Metabolic Hijacking of Hexose Metabolism to Ascorbate Synthesis Is the Unifying Biochemical Basis of Murine Liver Fibrosis

 ,
,  and
and 
Abstract
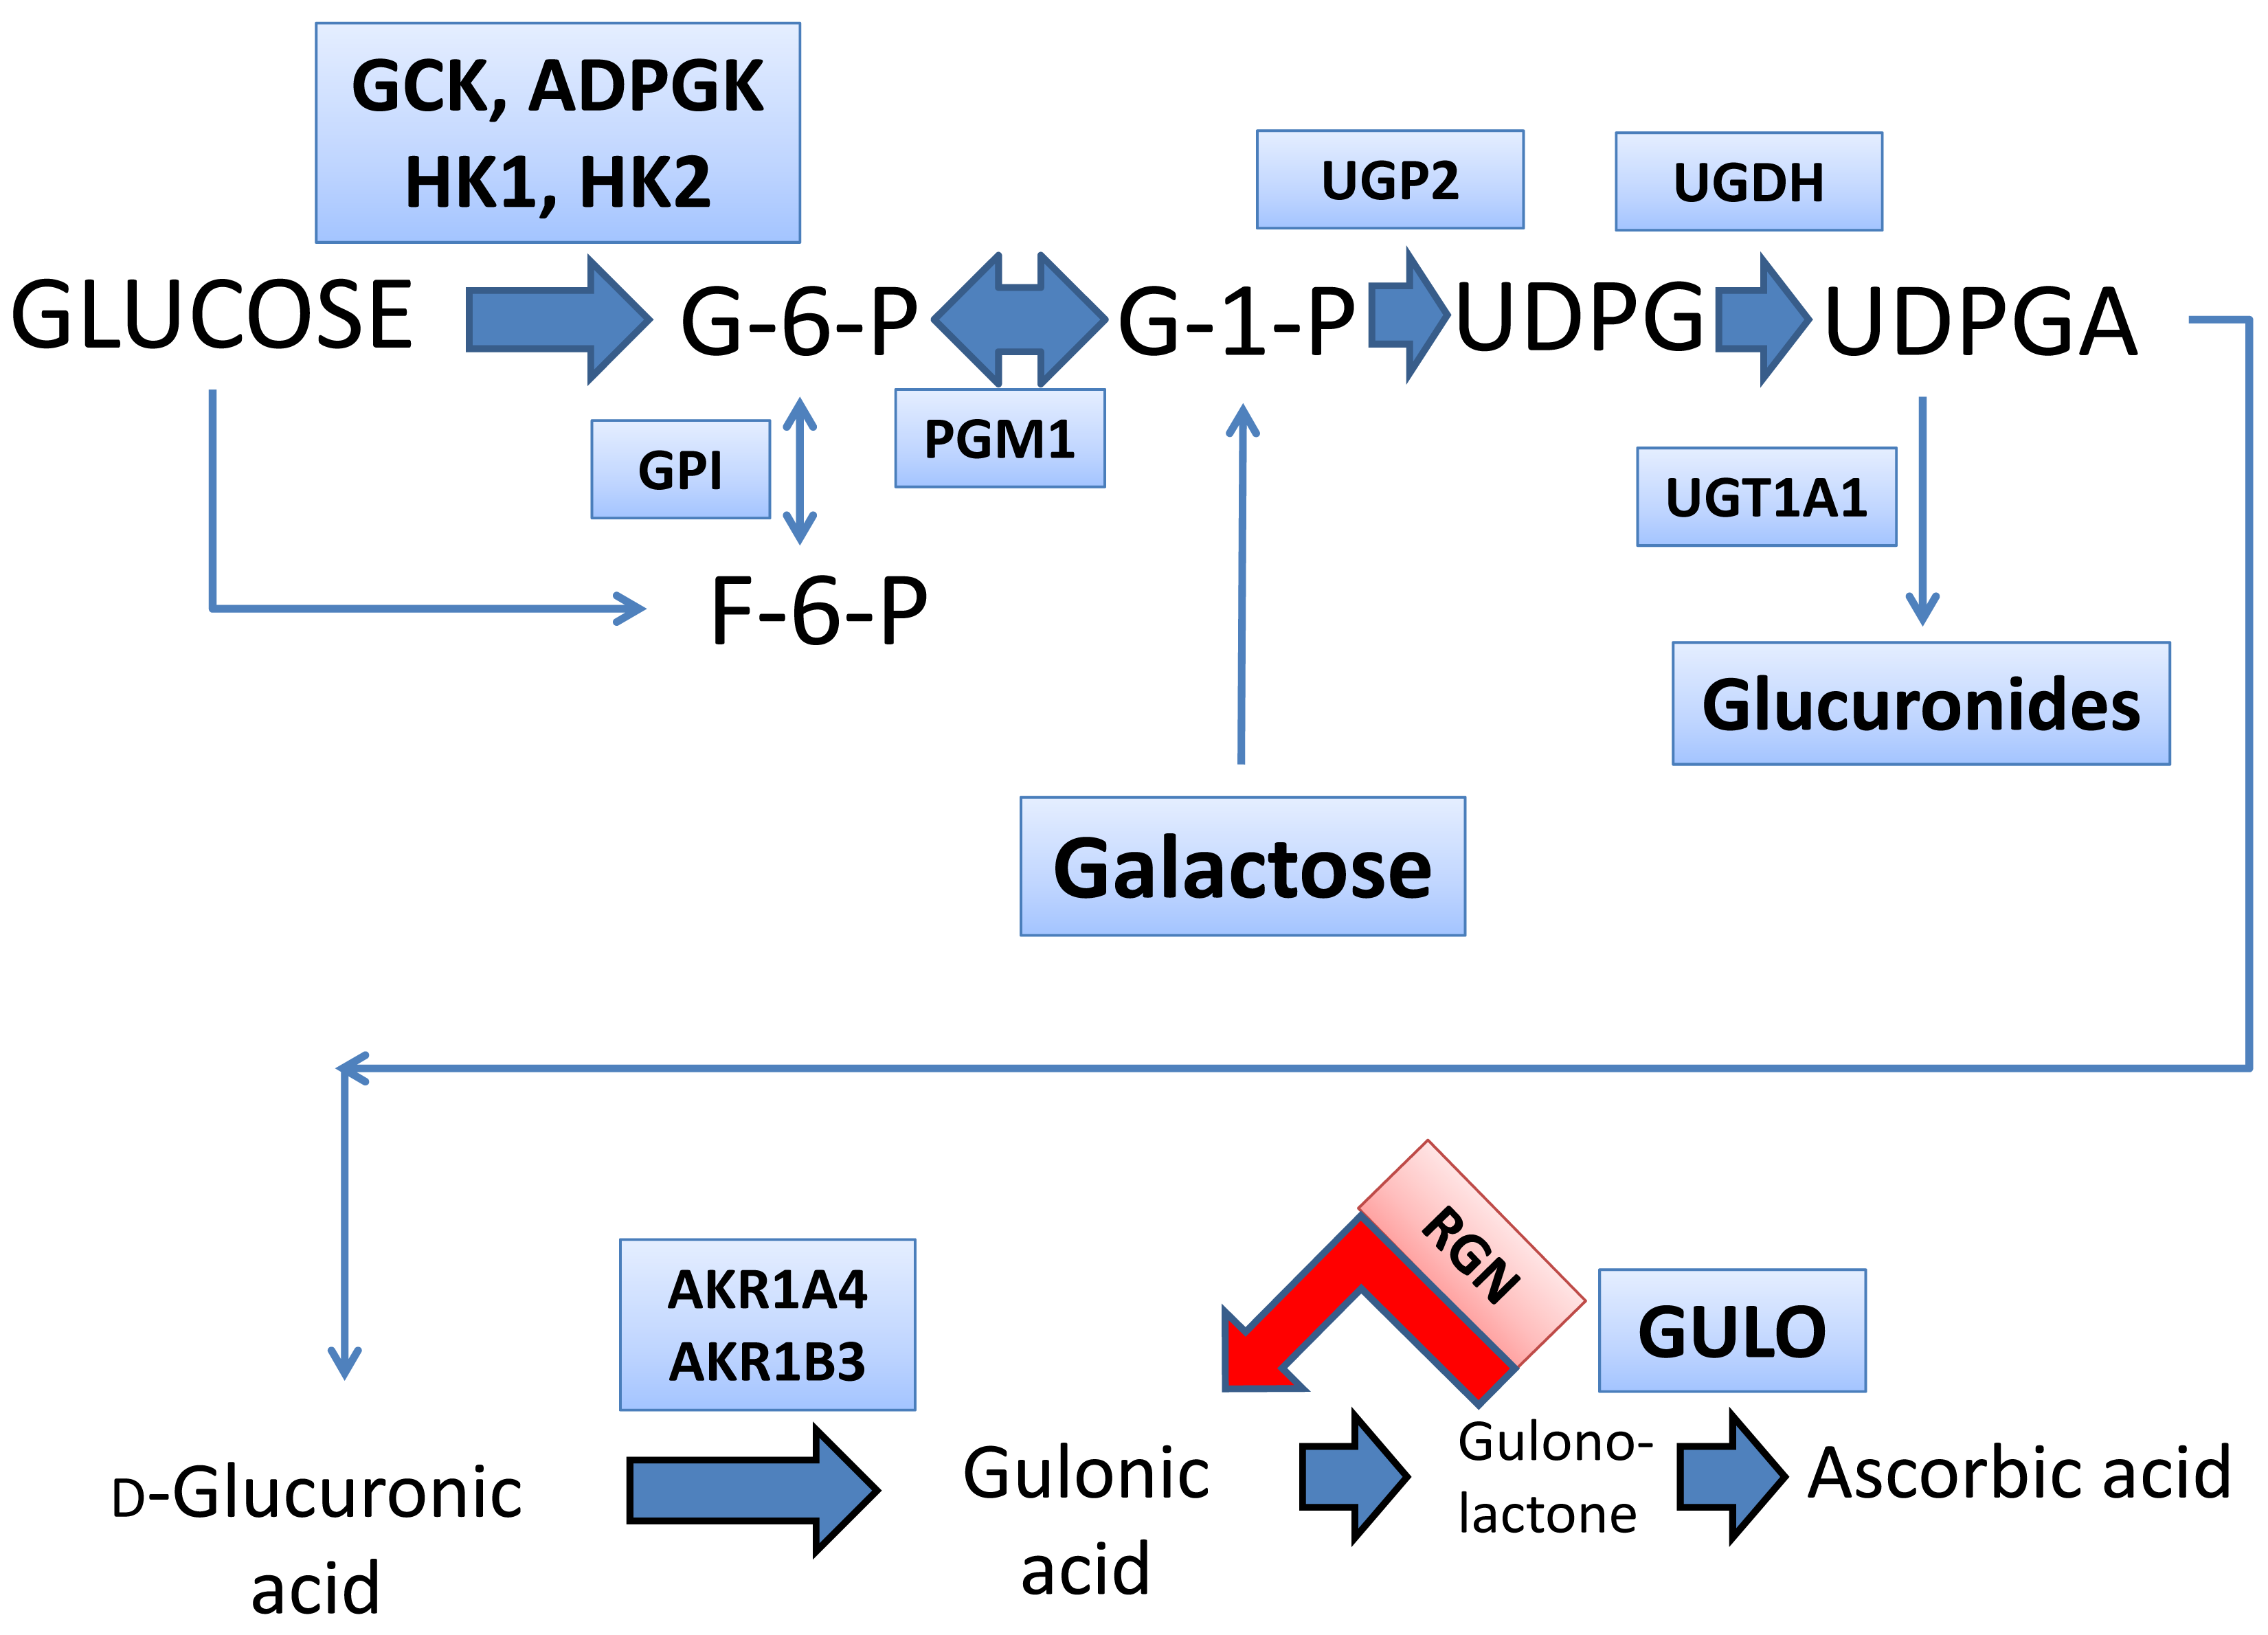
1. Introduction
2. Materials and Methods
2.1. Animals
2.1.1. Fibrosis Model #1. Carbon Tetrachloride-Induced Pan-Lobular Liver Fibrosis
2.1.2. Fibrosis Model #2. Thioacetamide-Induced Pan-Lobular Liver Fibrosis
2.1.3. Fibrosis Model #3. Choline-Deficient, Amino-Acid-Defined Diet with High-Fat Content
2.1.4. Fibrosis Model #4. Spontaneous Recovery from HF-CDAA-Induced Liver Fibrosis
2.2. Chemicals and Solvents
2.3. Analysis of Mouse Livers by Gas Chromatography-Mass Spectrometry (GC-MS)
2.4. Quantitative RT-PCR
2.5. Hepatic 4-Hydroxyproline Determination
2.6. Statistical Methods
3. Results
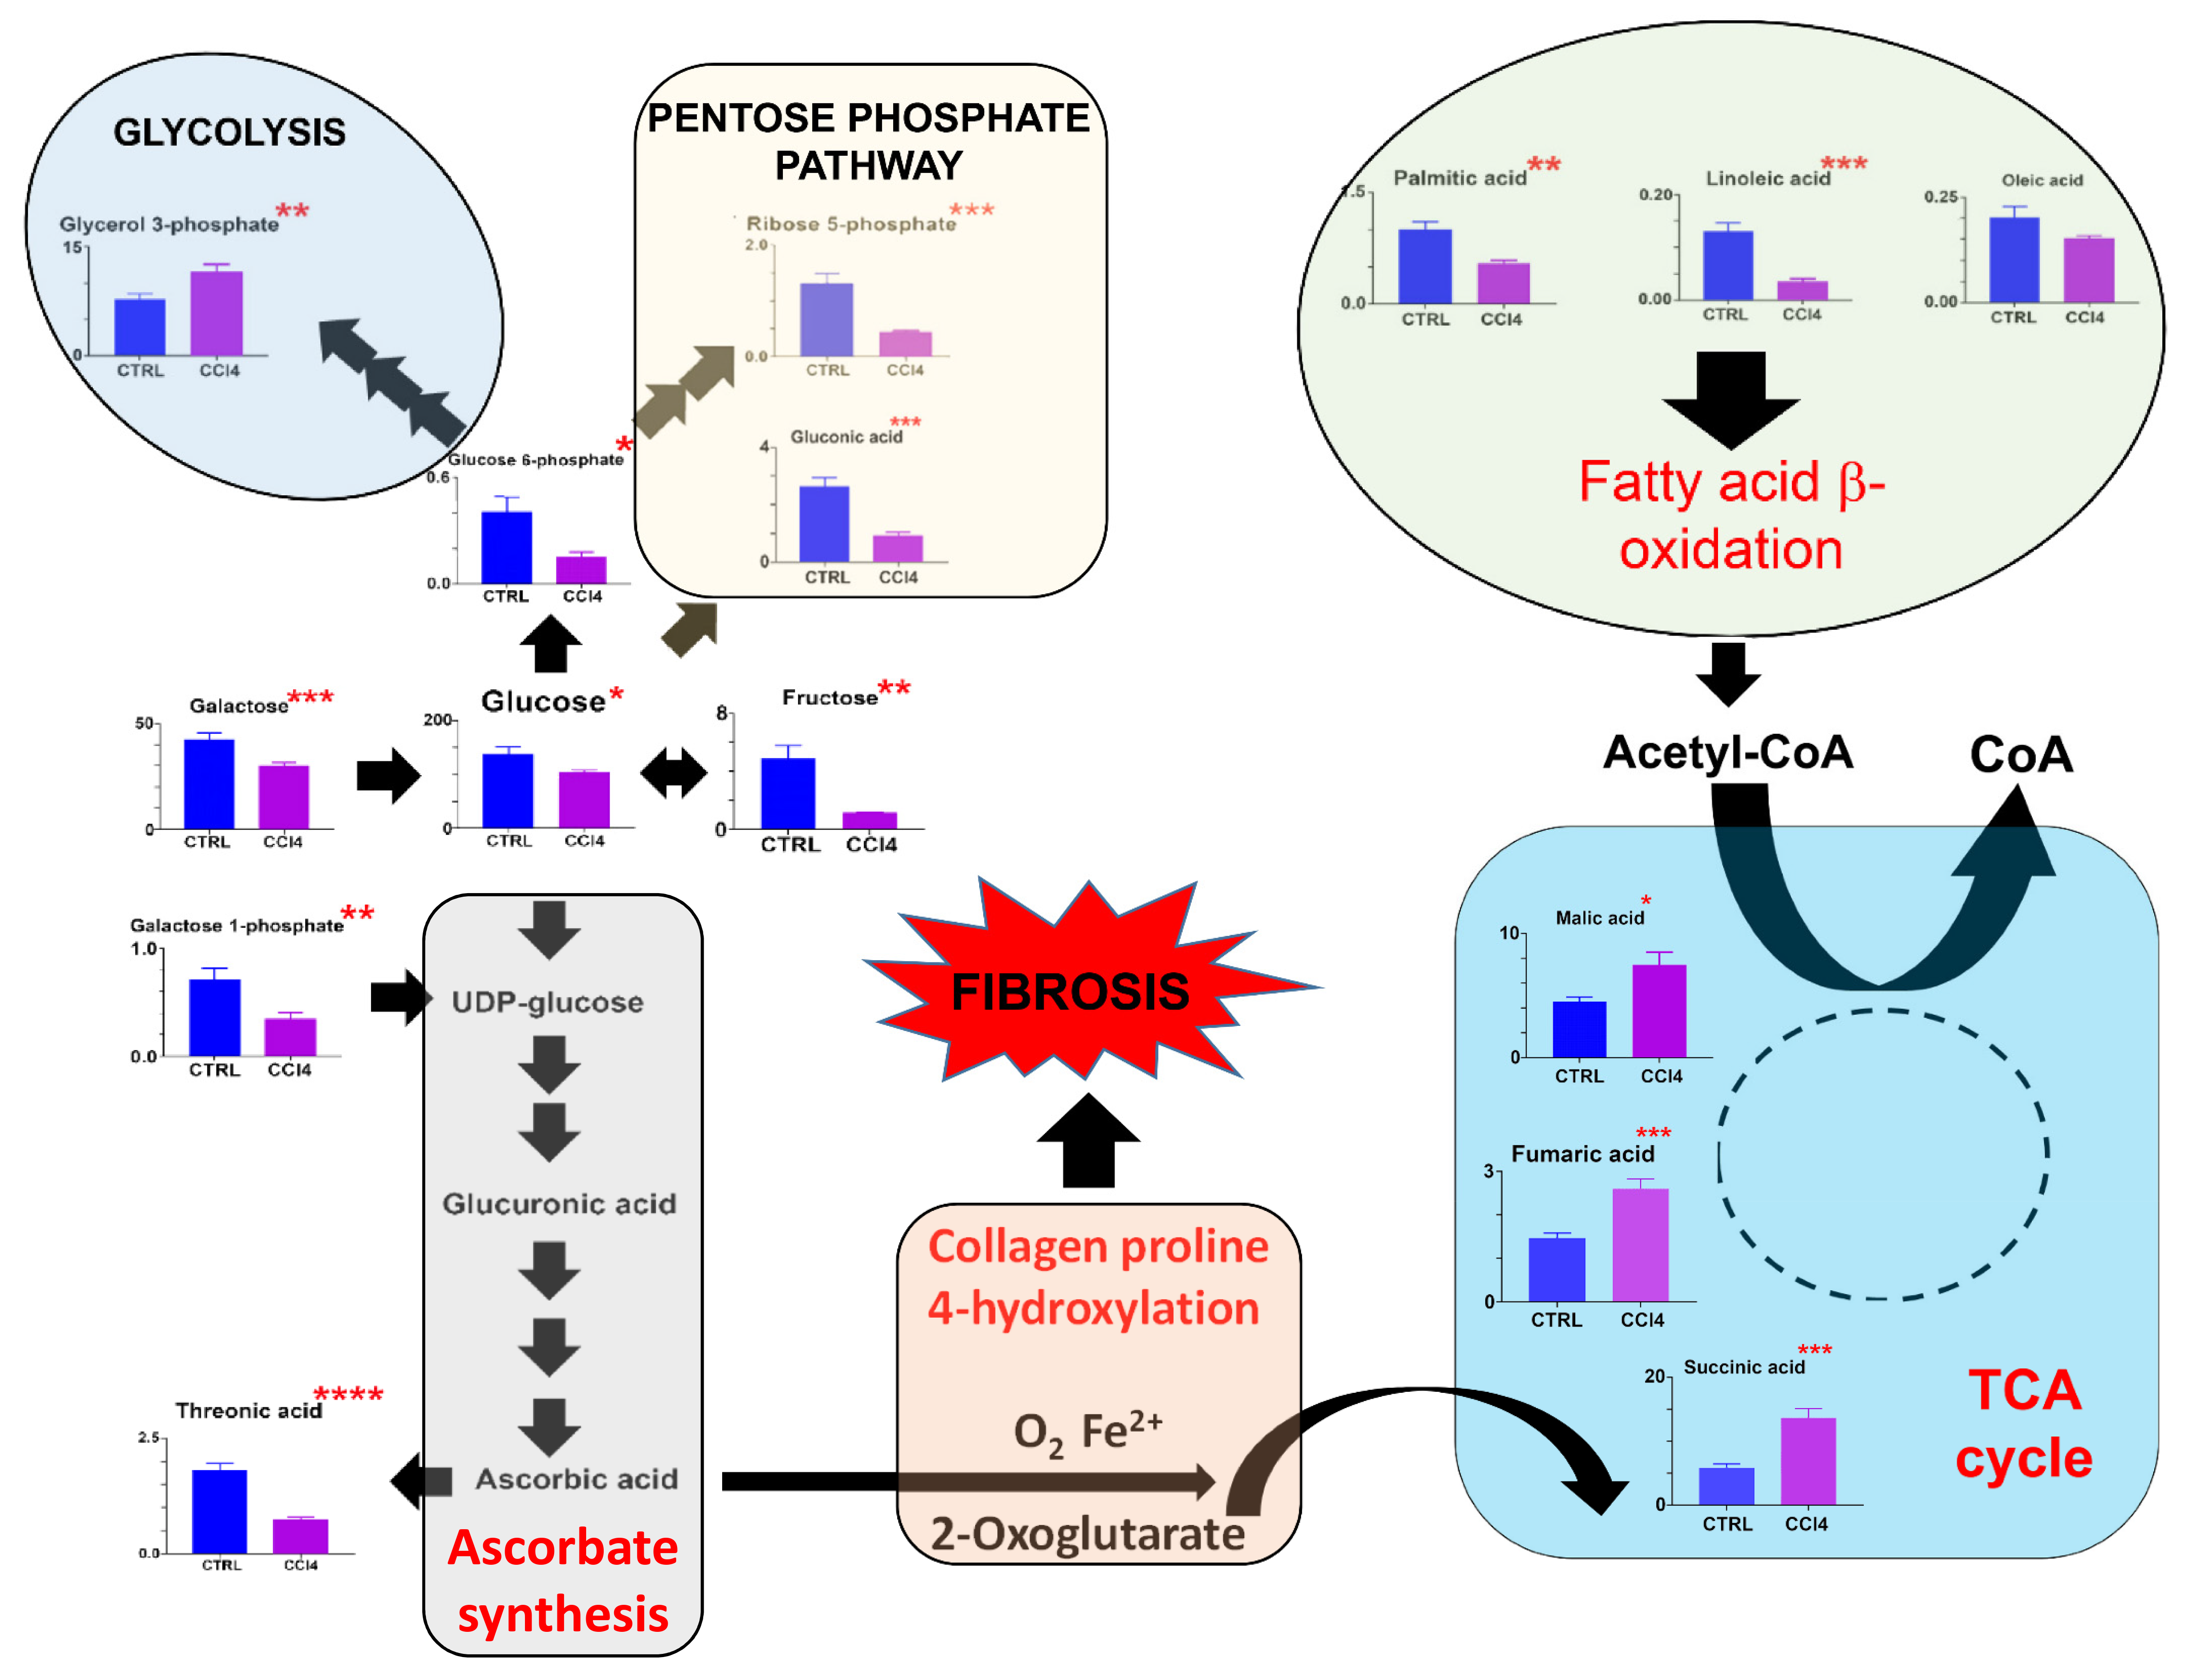
3.1. Metabolomics
3.1.1. Histology and Biochemistry of the Livers
3.1.2. Fibrosis Model #1. CCl4-Induced Pan-Lobular Liver Fibrosis
3.1.3. Fibrosis Model #2. TAA-Induced Pan-Lobular Liver Fibrosis
3.1.4. Fibrosis Model #3. HF-CDAA Diet-Induced Metabolic-Type Liver Fibrosis
3.1.5. Fibrosis Model #4. Spontaneous Reversal of HF-CDAA-Diet-Induced Fibrosis
3.2. Changes in Relevant Metabolism Gene Expression by qRT-PCR after Chronic Administration of CCl4 and TAA
3.3. Hepatic Gene Expression Changes by qRT-PCR during Choline-Deficient, Amino-Acid-Defined, 60% High-Fat Diet (HF-CDAA) Feeding
3.4. Hepatic Gene Expression Changes with qRT-PCR after Withdrawal of a Choline-Deficient, Amino-Acid-Defined, 60% High-Fat Diet (HF-CDAA) and Spontaneous Reversal of F2 Fibrosis
4. Discussion
Supplementary Materials
Author Contributions
Funding
Institutional Review Board Statement
Data Availability Statement
Conflicts of Interest
References
- Bataller, R.; Brenner, D.A. Liver fibrosis. J. Clin. Investig. 2005, 115, 209–218. [Google Scholar] [CrossRef] [PubMed]
- Wang, F.D.; Zhou, J.; Chen, E.Q. Molecular Mechanisms and Potential New Therapeutic Drugs for Liver Fibrosis. Front. Pharmacol. 2022, 13, 787748. [Google Scholar] [CrossRef] [PubMed]
- Zhang, Y.; Wu, Y.; Shen, W.; Wang, B.; Yuan, X. Crosstalk between NK cells and hepatic stellate cells in liver fibrosis (Review). Mol. Med. Rep. 2022, 25, 208. [Google Scholar] [CrossRef] [PubMed]
- Tan, Z.; Sun, H.; Xue, T.; Gan, C.; Liu, H.; Xie, Y.; Yao, Y.; Ye, T. Liver Fibrosis: Therapeutic Targets and Advances in Drug Therapy. Front. Cell Dev. Biol. 2021, 9, 730176. [Google Scholar] [CrossRef]
- Kwong, A.J.; Ebel, N.H.; Kim, W.R.; Lake, J.R.; Smith, J.M.; Schladt, D.P.; Skeans, M.A.; Foutz, J.; Gauntt, K.; Cafarella, M.; et al. OPTN/SRTR 2020 Annual Data Report: Liver. Am. J. Transpl. 2022, 22 (Suppl. 2), 204–309. [Google Scholar] [CrossRef]
- Oakley, F. Interrogating mechanisms of liver fibrosis with omics. Nat. Rev. Gastroenterol. Hepatol. 2022, 19, 89–90. [Google Scholar] [CrossRef]
- Loft, A.; Alfaro, A.J.; Schmidt, S.F.; Pedersen, F.B.; Terkelsen, M.K.; Puglia, M.; Chow, K.K.; Feuchtinger, A.; Troullinaki, M.; Maida, A.; et al. Liver-fibrosis-activated transcriptional networks govern hepatocyte reprogramming and intra-hepatic communication. Cell. Metab. 2021, 33, 1685–1700. [Google Scholar] [CrossRef]
- Glende, E.A., Jr.; Recknagel, R.O. Biochemical basis for the in vitro pro-oxidant action of carbon tetrachloride. Exp. Mol. Pathol. 1969, 11, 172–185. [Google Scholar] [CrossRef]
- Farber, J.L.; El-Mofty, S.K. The biochemical pathology of liver cell necrosis. Am. J. Pathol. 1975, 81, 237–250. [Google Scholar]
- Beyoglu, D.; Idle, J.R. Metabolomic and Lipidomic Biomarkers for Premalignant Liver Disease Diagnosis and Therapy. Metabolites 2020, 10, 50. [Google Scholar] [CrossRef]
- Beyoglu, D.; Idle, J.R. The metabolomic window into hepatobiliary disease. J. Hepatol. 2013, 59, 842–858. [Google Scholar] [CrossRef]
- Beyoglu, D.; Zhou, Y.; Chen, C.; Idle, J.R. Mass isotopomer-guided decluttering of metabolomic data to visualize endogenous biomarkers of drug toxicity. Biochem. Pharmacol. 2018, 156, 491–500. [Google Scholar] [CrossRef] [PubMed]
- Pihlajaniemi, T.; Myllyla, R.; Kivirikko, K.I. Prolyl 4-hydroxylase and its role in collagen synthesis. J. Hepatol. 1991, 13 (Suppl. 3), S2–S7. [Google Scholar] [CrossRef] [PubMed]
- Ravichandra, A.; Schwabe, R.F. Mouse models of liver fibrosis. In Myofibroblasts: Methods and Protocols, Methods in Molecular Biology; Hinz, B., Lagares, D., Eds.; Humana Press: New York, NY, USA, 2021; Volume 2299, pp. 339–356. [Google Scholar]
- Kim, Y.O.; Popov, Y.; Schuppan, D. Optimized Mouse Models for Liver Fibrosis. Methods Mol. Biol. 2017, 1559, 279–296. [Google Scholar] [CrossRef]
- Wei, G.; An, P.; Vaid, K.A.; Nasser, I.; Huang, P.; Tan, L.; Zhao, S.; Schuppan, D.; Popov, Y.V. Comparison of murine steatohepatitis models identifies a dietary intervention with robust fibrosis, ductular reaction, and rapid progression to cirrhosis and cancer. Am. J. Physiol. Gastrointest. Liver Physiol. 2020, 318, G174–G188. [Google Scholar] [CrossRef] [PubMed]
- Popov, Y.; Sverdlov, D.Y.; Sharma, A.K.; Bhaskar, K.R.; Li, S.; Freitag, T.L.; Lee, J.; Dieterich, W.; Melino, G.; Schuppan, D. Tissue transglutaminase does not affect fibrotic matrix stability or regression of liver fibrosis in mice. Gastroenterology 2011, 140, 1642–1652. [Google Scholar] [CrossRef] [PubMed]
- Semmo, N.; Weber, T.; Idle, J.R.; Beyoglu, D. Metabolomics reveals that aldose reductase activity due to AKR1B10 is upregulated in hepatitis C virus infection. J. Viral. Hepat. 2015, 22, 617–624. [Google Scholar] [CrossRef]
- Wang, M.; Keogh, A.; Treves, S.; Idle, J.R.; Beyoglu, D. The metabolomic profile of gamma-irradiated human hepatoma and muscle cells reveals metabolic changes consistent with the Warburg effect. PeerJ 2016, 4, e1624. [Google Scholar] [CrossRef]
- Beyoglu, D.; Imbeaud, S.; Maurhofer, O.; Bioulac-Sage, P.; Zucman-Rossi, J.; Dufour, J.F.; Idle, J.R. Tissue metabolomics of hepatocellular carcinoma: Tumor energy metabolism and the role of transcriptomic classification. Hepatology 2013, 58, 229–238. [Google Scholar] [CrossRef]
- Fahrner, R.; Beyoglu, D.; Beldi, G.; Idle, J.R. Metabolomic markers for intestinal ischemia in a mouse model. J. Surg. Res. 2012, 178, 879–887. [Google Scholar] [CrossRef]
- Simillion, C.; Semmo, N.; Idle, J.R.; Beyoglu, D. Robust Regression Analysis of GCMS Data Reveals Differential Rewiring of Metabolic Networks in Hepatitis B and C Patients. Metabolites 2017, 7, 51. [Google Scholar] [CrossRef]
- Keogh, A.; Senkardes, S.; Idle, J.R.; Kucukguzel, S.G.; Beyoglu, D. A Novel Anti-Hepatitis C Virus and Antiproliferative Agent Alters Metabolic Networks in HepG2 and Hep3B Cells. Metabolites 2017, 7, 23. [Google Scholar] [CrossRef]
- Idle, J.R.; Seipel, K.; Bacher, U.; Pabst, T.; Beyoglu, D. (2R,3S)-Dihydroxybutanoic Acid Synthesis as a Novel Metabolic Function of Mutant Isocitrate Dehydrogenase 1 and 2 in Acute Myeloid Leukemia. Cancers 2020, 12, 2842. [Google Scholar] [CrossRef]
- Beyoglu, D.; Park, E.J.; Quinones-Lombrana, A.; Dave, A.; Parande, F.; Pezzuto, J.M.; Idle, J.R. Addition of grapes to both a standard and a high-fat Western pattern diet modifies hepatic and urinary metabolite profiles in the mouse. Food Funct. 2022, 13, 8489–8499. [Google Scholar] [CrossRef] [PubMed]
- Beyoglu, D.; Simillion, C.; Storni, F.; De Gottardi, A.; Idle, J.R. A Metabolomic Analysis of Cirrhotic Ascites. Molecules 2022, 27, 3935. [Google Scholar] [CrossRef] [PubMed]
- Popov, Y.; Patsenker, E.; Fickert, P.; Trauner, M.; Schuppan, D. Mdr2 (Abcb4)-/- mice spontaneously develop severe biliary fibrosis via massive dysregulation of pro- and antifibrogenic genes. J. Hepatol. 2005, 43, 1045–1054. [Google Scholar] [CrossRef] [PubMed]
- Popov, Y.; Patsenker, E.; Bauer, M.; Niedobitek, E.; Schulze-Krebs, A.; Schuppan, D. Halofuginone induces matrix metalloproteinases in rat hepatic stellate cells via activation of p38 and NFkappaB. J. Biol. Chem. 2006, 281, 15090–15098. [Google Scholar] [CrossRef]
- Reuser, A.J.; Jongkind, J.F.; Galjaard, H. Methods for analysis of acid alpha-1,4-glucosidase activity in single hybrid cells. J. Histochem. Cytochem. 1976, 24, 578–586. [Google Scholar] [CrossRef]
- Dewhirst, R.A.; Fry, S.C. The oxidation of dehydroascorbic acid and 2,3-diketogulonate by distinct reactive oxygen species. Biochem. J. 2018, 475, 3451–3470. [Google Scholar] [CrossRef]
- Gross, S.; Cairns, R.A.; Minden, M.D.; Driggers, E.M.; Bittinger, M.A.; Jang, H.G.; Sasaki, M.; Jin, S.; Schenkein, D.P.; Su, S.M.; et al. Cancer-associated metabolite 2-hydroxyglutarate accumulates in acute myelogenous leukemia with isocitrate dehydrogenase 1 and 2 mutations. J. Exp. Med. 2010, 207, 339–344. [Google Scholar] [CrossRef]
- Beyoglu, D.; Idle, J.R. Metabolic Rewiring and the Characterization of Oncometabolites. Cancers 2021, 13, 2900. [Google Scholar] [CrossRef]
- Gorres, K.L.; Raines, R.T. Prolyl 4-hydroxylase. Crit. Rev. Biochem. Mol. Biol. 2010, 45, 106–124. [Google Scholar] [CrossRef]
- Sperling, O.; Boer, P.; Lipstein, B.; Kupfer, B.; Brosh, S.; Zoref, E.; Bashkin, P.; de Vries, A. Regulation of de novo purine synthesis in human and rat tissue: Role of oxidative pentose phosphate pathway activity and of ribose-5-phosphate and phosphoribosylpyrophosphate availability. Adv. Exp. Med. Biol. 1977, 76A, 481–487. [Google Scholar] [CrossRef]
- Van Gulik, W.M.; Canelas, A.B.; Taymaz-Nikerel, H.; Douma, R.D.; de Jonge, L.P.; Heijnen, J.J. Fast sampling of the cellular metabolome. Methods Mol. Biol. 2012, 881, 279–306. [Google Scholar] [CrossRef] [PubMed]
- Lu, W.; Su, X.; Klein, M.S.; Lewis, I.A.; Fiehn, O.; Rabinowitz, J.D. Metabolite Measurement: Pitfalls to Avoid and Practices to Follow. Annu. Rev. Biochem. 2017, 86, 277–304. [Google Scholar] [CrossRef] [PubMed]
- Fallon, A.; Bradley, J.F.; Burns, J.; McGee, J.O.D. Collagen stimulating factors in hepatic fibrogenesis. J. Clin. Pathol. 1984, 37, 542–548. [Google Scholar] [CrossRef] [PubMed]
- Guzelian, P.S.; Qureshi, G.D.; Diegelmann, R.F. Collagen synthesis by the hepatocyte: Studies in primary cultures of parenchymal cells from adult rat liver. Coll. Relat. Res. 1981, 1, 83–93. [Google Scholar] [CrossRef] [PubMed]
- Risteli, J.; Kivirikko, K.I. Activities of prolyl hydroxylase, lysyl hydroxylase, collagen galactosyltransferase and collagen glucosyltransferase in the liver of rats with hepatic injury. Biochem. J. 1974, 144, 115–122. [Google Scholar] [CrossRef]
- Smirnoff, N. Ascorbic acid metabolism and functions: A comparison of plants and mammals. Free Radic. Biol. Med. 2018, 122, 116–129. [Google Scholar] [CrossRef]
- Myllyla, R.; Kuutti-Savolainen, E.R.; Kivirikko, K.I. The role of ascorbate in the prolyl hydroxylase reaction. Biochem. Biophys. Res. Commun. 1978, 83, 441–448. [Google Scholar] [CrossRef]
- Parsons, K.K.; Maeda, N.; Yamauchi, M.; Banes, A.J.; Koller, B.H. Ascorbic acid-independent synthesis of collagen in mice. Am. J. Physiol. Endocrinol. Metab. 2006, 290, E1131–E1139. [Google Scholar] [CrossRef]
- Myllyla, R.; Majamaa, K.; Gunzler, V.; Hanauske-Abel, H.M.; Kivirikko, K.I. Ascorbate is consumed stoichiometrically in the uncoupled reactions catalyzed by prolyl 4-hydroxylase and lysyl hydroxylase. J. Biol. Chem. 1984, 259, 5403–5405. [Google Scholar] [CrossRef]
- Rojkind, M.; Giambrone, M.A.; Biempica, L. Collagen types in normal and cirrhotic liver. Gastroenterology 1979, 76, 710–719. [Google Scholar] [CrossRef]
- McGee, J.O.; O’Hare, R.P.; Patrick, R.S. Stimulation of the collagen biosynthetic pathway by factors isolated from experimentally-injured liver. Nat. New. Biol. 1973, 243, 121–123. [Google Scholar] [PubMed]
- McGee, J.O.; Patrick, R.S.; Rodger, M.C.; Luty, C.M. Collagen proline hydroxylase activity and 35S sulphate uptake in human liver biopsies. Gut 1974, 15, 260–267. [Google Scholar] [CrossRef] [PubMed]
- El-Tanbouly, D.M.; Wadie, W.; Sayed, R.H. Modulation of TGF-beta/Smad and ERK signaling pathways mediates the anti-fibrotic effect of mirtazapine in mice. Toxicol. Appl. Pharmacol. 2017, 329, 224–230. [Google Scholar] [CrossRef]
- Wang, Z.L.; Deng, C.Y.; Zheng, H.; Xie, C.F.; Wang, X.H.; Luo, Y.F.; Chen, Z.Z.; Cheng, P.; Chen, L.J. (Z)2-(5-(4-methoxybenzylidene)-2,4-dioxothiazolidin-3-yl) acetic acid protects rats from CCl(4)-induced liver injury. J. Gastroenterol. Hepatol. 2012, 27, 966–973. [Google Scholar] [CrossRef] [PubMed]
- Gao, Q.; Cheng, B.; Chen, C.; Lei, C.; Lin, X.; Nie, D.; Li, J.; Huang, L.; Li, X.; Wang, K.; et al. Dysregulated glucuronic acid metabolism exacerbates hepatocellular carcinoma progression and metastasis through the TGFbeta signalling pathway. Clin. Transl. Med. 2022, 12, e995. [Google Scholar] [CrossRef]
- Lee, M.R.; Yang, H.J.; Park, K.I.; Ma, J.Y. Lycopus lucidus Turcz. ex Benth. Attenuates free fatty acid-induced steatosis in HepG2 cells and non-alcoholic fatty liver disease in high-fat diet-induced obese mice. Phytomedicine 2019, 55, 14–22. [Google Scholar] [CrossRef]
- Yang, Y.; Chen, J.; Gao, Q.; Shan, X.; Wang, J.; Lv, Z. Study on the attenuated effect of Ginkgolide B on ferroptosis in high fat diet induced nonalcoholic fatty liver disease. Toxicology 2020, 445, 152599. [Google Scholar] [CrossRef]
- Hu, M.; Zhang, D.; Xu, H.; Zhang, Y.; Shi, H.; Huang, X.; Wang, X.; Wu, Y.; Qi, Z. Salidroside Activates the AMP-Activated Protein Kinase Pathway to Suppress Nonalcoholic Steatohepatitis in Mice. Hepatology 2021, 74, 3056–3073. [Google Scholar] [CrossRef]
- Cha, J.; Roomi, M.W.; Ivanov, V.; Kalinovsky, T.; Niedzwiecki, A.; Rath, M. Ascorbate supplementation inhibits growth and metastasis of B16FO melanoma and 4T1 breast cancer cells in vitamin C-deficient mice. Int. J. Oncol. 2013, 42, 55–64. [Google Scholar] [CrossRef]
- Kaelin, W.G., Jr.; Ratcliffe, P.J. Oxygen sensing by metazoans: The central role of the HIF hydroxylase pathway. Mol. Cell 2008, 30, 393–402. [Google Scholar] [CrossRef] [PubMed]
- Salman, S.; Meyers, D.J.; Wicks, E.E.; Lee, S.N.; Datan, E.; Thomas, A.M.; Anders, N.M.; Hwang, Y.; Lyu, Y.; Yang, Y.; et al. HIF inhibitor 32-134D eradicates murine hepatocellular carcinoma in combination with anti-PD1 therapy. J. Clin. Investig. 2022, 132, e156774. [Google Scholar] [CrossRef] [PubMed]
- Seo, J.; Jeong, D.W.; Park, J.W.; Lee, K.W.; Fukuda, J.; Chun, Y.S. Fatty-acid-induced FABP5/HIF-1 reprograms lipid metabolism and enhances the proliferation of liver cancer cells. Commun. Biol. 2020, 3, 638. [Google Scholar] [CrossRef]
- Nytko, K.J.; Maeda, N.; Schlafli, P.; Spielmann, P.; Wenger, R.H.; Stiehl, D.P. Vitamin C is dispensable for oxygen sensing in vivo. Blood 2011, 117, 5485–5493. [Google Scholar] [CrossRef] [PubMed]
- Flashman, E.; Davies, S.L.; Yeoh, K.K.; Schofield, C.J. Investigating the dependence of the hypoxia-inducible factor hydroxylases (factor inhibiting HIF and prolyl hydroxylase domain 2) on ascorbate and other reducing agents. Biochem. J. 2010, 427, 135–142. [Google Scholar] [CrossRef]
- Jones, D.T.; Trowbridge, I.S.; Harris, A.L. Effects of transferrin receptor blockade on cancer cell proliferation and hypoxia-inducible factor function and their differential regulation by ascorbate. Cancer Res. 2006, 66, 2749–2756. [Google Scholar] [CrossRef]
- Wohlrab, C.; Kuiper, C.; Vissers, M.C.; Phillips, E.; Robinson, B.A.; Dachs, G.U. Ascorbate modulates the hypoxic pathway by increasing intracellular activity of the HIF hydroxylases in renal cell carcinoma cells. Hypoxia 2019, 7, 17–31. [Google Scholar] [CrossRef]
- Chang, M.L.; Yang, S.S. Metabolic Signature of Hepatic Fibrosis: From Individual Pathways to Systems Biology. Cells 2019, 8, 1423. [Google Scholar] [CrossRef]
- Chang, H.; Meng, H.Y.; Liu, S.M.; Wang, Y.; Yang, X.X.; Lu, F.; Wang, H.Y. Identification of key metabolic changes during liver fibrosis progression in rats using a urine and serum metabolomics approach. Sci. Rep. 2017, 7, 11433. [Google Scholar] [CrossRef]
- Mindikoglu, A.L.; Opekun, A.R.; Putluri, N.; Devaraj, S.; Sheikh-Hamad, D.; Vierling, J.M.; Goss, J.A.; Rana, A.; Sood, G.K.; Jalal, P.K.; et al. Unique metabolomic signature associated with hepatorenal dysfunction and mortality in cirrhosis. Transl. Res. 2018, 195, 25–47. [Google Scholar] [CrossRef]
- Yuasa, H.J. Inhibitory effect of ascorbate on tryptophan 2,3-dioxygenase. J. Biochem. 2022, 171, 653–661. [Google Scholar] [CrossRef]
- Chatterjee, I.B.; Majumder, A.K.; Nandi, B.K.; Subramanian, N. Synthesis and some major functions of vitamin C in animals. Ann. N. Y. Acad. Sci. 1975, 258, 24–47. [Google Scholar] [CrossRef]
- Banhegyi, G.; Braun, L.; Csala, M.; Puskas, F.; Mandl, J. Ascorbate metabolism and its regulation in animals. Free Radic. Biol. Med. 1997, 23, 793–803. [Google Scholar] [CrossRef] [PubMed]
- Zheng, J.S.; Luan, J.; Sofianopoulou, E.; Imamura, F.; Stewart, I.D.; Day, F.R.; Pietzner, M.; Wheeler, E.; Lotta, L.A.; Gundersen, T.E.; et al. Plasma Vitamin C and Type 2 Diabetes: Genome-Wide Association Study and Mendelian Randomization Analysis in European Populations. Diabetes Care 2021, 44, 98–106. [Google Scholar] [CrossRef]
- Chen, L.; Sun, X.; Wang, Z.; Lu, Y.; Chen, M.; He, Y.; Xu, H.; Zheng, L. The impact of plasma vitamin C levels on the risk of cardiovascular diseases and Alzheimer’s disease: A Mendelian randomization study. Clin. Nutr. 2021, 40, 5327–5334. [Google Scholar] [CrossRef]
- Burzle, M.; Suzuki, Y.; Ackermann, D.; Miyazaki, H.; Maeda, N.; Clemencon, B.; Burrier, R.; Hediger, M.A. The sodium-dependent ascorbic acid transporter family SLC23. Mol. Asp. Med. 2013, 34, 436–454. [Google Scholar] [CrossRef] [PubMed]
- NLM. rs33972313. Available online: https://www.ncbi.nlm.nih.gov/snp/?term=rs33972313 (accessed on 8 October 2022).
- NLM. rs13028225. Available online: https://www.ncbi.nlm.nih.gov/snp/?term=rs13028225 (accessed on 8 October 2022).
- Emdin, C.A.; Haas, M.; Ajmera, V.; Simon, T.G.; Homburger, J.; Neben, C.; Jiang, L.; Wei, W.Q.; Feng, Q.; Zhou, A.; et al. Association of Genetic Variation With Cirrhosis: A Multi-Trait Genome-Wide Association and Gene-Environment Interaction Study. Gastroenterology 2021, 160, 1620–1633. [Google Scholar] [CrossRef] [PubMed]
- Schwantes-An, T.H.; Darlay, R.; Mathurin, P.; Masson, S.; Liangpunsakul, S.; Mueller, S.; Aithal, G.P.; Eyer, F.; Gleeson, D.; Thompson, A.; et al. Genome-wide Association Study and Meta-analysis on Alcohol-Associated Liver Cirrhosis Identifies Genetic Risk Factors. Hepatology 2021, 73, 1920–1931. [Google Scholar] [CrossRef] [PubMed]
- Innes, H.; Buch, S.; Hutchinson, S.; Guha, I.N.; Morling, J.R.; Barnes, E.; Irving, W.; Forrest, E.; Pedergnana, V.; Goldberg, D.; et al. Genome-Wide Association Study for Alcohol-Related Cirrhosis Identifies Risk Loci in MARC1 and HNRNPUL1. Gastroenterology 2020, 159, 1276–1289. [Google Scholar] [CrossRef] [PubMed]
- Patin, E.; Kutalik, Z.; Guergnon, J.; Bibert, S.; Nalpas, B.; Jouanguy, E.; Munteanu, M.; Bousquet, L.; Argiro, L.; Halfon, P.; et al. Genome-wide association study identifies variants associated with progression of liver fibrosis from HCV infection. Gastroenterology 2012, 143, 1244–1252. [Google Scholar] [CrossRef] [PubMed]
- Ipsen, D.H.; Tveden-Nyborg, P.; Rolin, B.; Rakipovski, G.; Beck, M.; Mortensen, L.W.; Faerk, L.; Heegaard, P.M.; Moller, P.; Lykkesfeldt, J. High-fat but not sucrose intake is essential for induction of dyslipidemia and non-alcoholic steatohepatitis in guinea pigs. Nutr. Metab. 2016, 13, 51. [Google Scholar] [CrossRef] [PubMed]
- Ishimoto, T.; Lanaspa, M.A.; Rivard, C.J.; Roncal-Jimenez, C.A.; Orlicky, D.J.; Cicerchi, C.; McMahan, R.H.; Abdelmalek, M.F.; Rosen, H.R.; Jackman, M.R.; et al. High-fat and high-sucrose (western) diet induces steatohepatitis that is dependent on fructokinase. Hepatology 2013, 58, 1632–1643. [Google Scholar] [CrossRef]
- Smith-Cortinez, N.; Fagundes, R.R.; Gomez, V.; Kong, D.; de Waart, D.R.; Heegsma, J.; Sydor, S.; Olinga, P.; de Meijer, V.E.; Taylor, C.T.; et al. Collagen release by human hepatic stellate cells requires vitamin C and is efficiently blocked by hydroxylase inhibition. FASEB J. 2021, 35, e21219. [Google Scholar] [CrossRef] [PubMed]


| Metabolite | ND Mean ± Sem | CCl4 Mean ± Sem | Fold- Change | p-Value (Uncorrected) |
|---|---|---|---|---|
| Glucose | 137.8 ± 13.57 | 104.0 ± 3.80 | −1.3 | 0.03 |
| Glucose 6-phosphate | 0.41 ± 0.09 | 0.15 ± 0.03 | −2.7 | 0.01 |
| Fructose | 4.9 ± 0.92 | 1.1 ± 0.05 | −4.5 | 0.001 |
| Gluconic acid | 2.6 ± 0.30 | 0.93 ± 0.10 | −2.8 | 0.0001 |
| myo-Inositol | 1.1 ± 0.17 | 1.9 ± 0.16 | +1.7 | 0.006 |
| Galactose | 42.54 ± 3.00 | 30.06 ± 1.42 | −1.4 | 0.002 |
| Galactose 1-phosphate | 0.71 ± 0.10 | 0.35 ± 0.06 | −2.0 | 0.007 |
| Galacturonic acid | 1.3 ± 0.19 | 0.32 ± 0.02 | −4.1 | 0.0001 |
| Maltose | 1.7 ± 0.58 | 0.29 ± 0.03 | −5.9 | 0.03 |
| Ribose 5-phosphate | 1.3 ± 0.17 | 0.45 ± 0.03 | −2.9 | 0.0002 |
| Ribitol | 0.22 ± 0.02 | 0.14 ± 0.01 | −1.6 | 0.02 |
| Glycine | 20.84 ± 1.53 | 11.87 ± 0.90 | −1.8 | 0.0002 |
| Glutamic acid | 4.6 ± 0.67 | 8.8 ± 1.3 | +1.9 | 0.01 |
| Palmitic acid | 1.0 ± 0.11 | 0.55 ± 0.04 | −1.8 | 0.002 |
| Linoleic acid | 0.13 ± 0.02 | 0.04 ± 0.01 | −3.3 | 0.0001 |
| Succinic acid | 5.8 ± 0.62 | 14 ± 1.5 | +2.4 | 0.0003 |
| Fumaric acid | 1.5 ± 0.12 | 2.6 ± 0.23 | +1.7 | 0.0007 |
| Malic acid | 4.5 ± 0.37 | 7.5 ± 1.0 | +1.6 | 0.02 |
| 2-Hydroxyglutaric acid | 0.15 ± 0.01 | 0.39 ± 0.03 | +2.6 | <0.0001 |
| Glycerol 3-phosphate | 7.8 ± 0.66 | 12 ± 1.0 | +1.5 | 0.01 |
| 2-Aminobutanoic acid | 0.79 ± 0.08 | 0.38 ± 0.07 | −2.1 | 0.002 |
| Threonic acid | 1.80 ± 0.16 | 0.74 ± 0.05 | −2.4 | <0.0001 |
| Uracil | 0.30 ± 0.03 | 0.55 ± 0.03 | +1.8 | <0.0001 |
| Metabolite | ND Mean ± Sem | TAA Mean ± Sem | Fold Change | p-Value (Uncorrected) |
|---|---|---|---|---|
| Glucose | 138 ± 14 | 95 ± 3.4 | −1.5 | 0.0003 |
| Fructose | 4.9 ± 0.92 | 1.2 ± 0.11 | −4.1 | <0.0001 |
| Glucuronic acid | 1.9 ± 0.19 | 1.1 ± 0.06 | −1.7 | <0.0001 |
| Ascorbic acid | 4.2 ± 0.44 | 6.8 ± 0.35 | +1.6 | 0.0002 |
| Galactose | 43 ± 3.0 | 28 ± 1.0 | −1.5 | <0.0001 |
| Galacturonic acid | 1.3 ± 0.19 | 0.54 ± 0.05 | −2.4 | <0.0001 |
| Maltose | 1.7 ± 0.58 | 0.26 ± 0.02 | −2.9 | 0.001 |
| Ribose 5-phosphate | 1.3 ± 0.17 | 0.51 ± 0.02 | −2.5 | <0.0001 |
| Xylose | 0.55 ± 0.07 | 0.19 ± 0.01 | −2.9 | <0.0001 |
| Glutamic acid | 4.6 ± 0.67 | 13 ± 1.3 | +2.8 | 0.0002 |
| Proline | 3.6 ± 0.38 | 6.2 ± 0.46 | +1.7 | 0.002 |
| Palmitic acid | 1.0 ± 0.11 | 0.58 ± 0.02 | −1.7 | <0.0001 |
| Oleic acid | 0.20 ± 0.03 | 0.12 ± 0.01 | −1.7 | 0.0001 |
| Linoleic acid | 0.13 ± 0.02 | 0.05 ± 0.01 | −2.6 | <0.0001 |
| Succinic acid | 5.8 ± 0.62 | 13 ± 0.72 | +2.3 | <0.0001 |
| Fumaric acid | 1.5 ± 0.12 | 2.3 ± 0.15 | +1.5 | 0.003 |
| Malic acid | 4.5 ± 0.37 | 5.9 ± 0.31 | +1.3 | 0.02 |
| 2-Hydroxyglutaric acid | 0.15 ± 0.01 | 0.60 ± 0.05 | +4.0 | <0.0001 |
| Uracil | 0.30 ± 0.03 | 0.72 ± 0.05 | +2.4 | <0.0001 |
| Uridine | 0.67 ± 0.13 | 1.5 ± 0.12 | +2.2 | 0.0003 |
| Metabolite | ND | F1 | F2 | F3 | F4 | Kruskal–Wallis One-Way ANOVA p-Value |
|---|---|---|---|---|---|---|
| Mean ± Sem | Mean ± Sem | Mean ± Sem | Mean ± Sem | Mean ± Sem | ||
| Glucose | 138 ± 14 | 111 ± 11 | 59 ± 6.0 | 73 ± 8.3 | 75 ± 5.0 | <0.0001 |
| Fructose | 4.9 ± 0.92 | 1.4 ± 0.26 | 0.59 ± 0.1 | 0.63 ± 0.1 | 0.68 ± 0.10 | <0.0001 |
| Glucuronic acid | 1.9 ± 0.19 | 0.95 ± 0.04 | 0.75 ± 0.07 | 0.60 ± 0.06 | 0.75 ± 0.04 | <0.0001 |
| Ascorbic acid | 4.2 ± 0.44 | 10 ± 0.35 | 8.3 ± 0.53 | 9.6 ± 0.63 | 8.4 ± 0.53 | 0.0004 |
| Galactose | 43 ± 3.0 | 30 ± 2.0 | 18 ± 1.6 | 21 ± 1.5 | 25 ± 1.50 | <0.0001 |
| Glucose 6-phosphate | 0.41 ± 0.10 | 0.16 ± 0.02 | 0.07 ± 0.01 | 0.08 ± 0.03 | 0.09 ± 0.01 | <0.0001 |
| Fructose 6-phosphate | 0.93 ± 0.12 | 0.60 ± 0.09 | 0.23 ± 0.04 | 0.27 ± 0.07 | 0.30 ± 0.03 | <0.0001 |
| Galactose 1-phosphate | 0.71 ± 0.10 | 0.42 ± 0.04 | 0.17 ± 0.03 | 0.20 ± 0.06 | 0.19 ± 0.03 | <0.0001 |
| Ribose 5-phosphate | 1.3 ± 0.17 | 0.85 ± 0.10 | 0.38 ± 0.05 | 0.27 ± 0.04 | 0.26 ± 0.03 | <0.0001 |
| Aspartic acid | 0.39 ± 0.04 | 0.93 ± 0.1 | 0.96 ± 0.06 | 0.97 ± 0.1 | 0.79 ± 0.05 | 0.001 |
| Palmitic acid | 1.0 ± 0.11 | 0.61 ± 0.05 | 0.59 ± 0.07 | 0.42 ± 0.05 | 0.27 ± 0.02 | <0.0001 |
| Oleic acid | 0.20 ± 0.03 | 0.15 ± 0.01 | 0.17 ± 0.02 | 0.09 ± 0.01 | 0.08 ± 0.01 | 0.002 |
| Citric acid | 1.2 ± 0.13 | 0.83 ± 0.04 | 0.48 ± 0.05 | 0.36 ± 0.04 | 0.36 ± 0.04 | <0.0001 |
| Glycerol 3-phosphate | 7.8 ± 0.66 | 5.0 ± 0.40 | 2.4 ± 0.25 | 3.5 ± 0.57 | 3.5 ± 0.37 | <0.0001 |
| Creatinine | 0.23 ± 0.04 | 0.54 ± 0.06 | 0.57 ± 0.03 | 0.48 ± 0.04 | 0.49 ± 0.03 | 0.0002 |
| Uracil | 0.30 ± 0.03 | 0.56 ± 0.03 | 0.46 ± 0.03 | 0.41 ± 0.03 | 0.34 ± 0.04 | 0.0006 |
| Adenosine | 0.35 ± 0.06 | 0.20 ± 0.02 | 0.06 ± 0.01 | 0.07 ± 0.02 | 0.10 ± 0.02 | <0.0001 |
Disclaimer/Publisher’s Note: The statements, opinions and data contained in all publications are solely those of the individual author(s) and contributor(s) and not of MDPI and/or the editor(s). MDPI and/or the editor(s) disclaim responsibility for any injury to people or property resulting from any ideas, methods, instructions or products referred to in the content. |
© 2023 by the authors. Licensee MDPI, Basel, Switzerland. This article is an open access article distributed under the terms and conditions of the Creative Commons Attribution (CC BY) license (https://creativecommons.org/licenses/by/4.0/).
Share and Cite
Beyoğlu, D.; Huang, P.; Skelton-Badlani, D.; Zong, C.; Popov, Y.V.; Idle, J.R. Metabolic Hijacking of Hexose Metabolism to Ascorbate Synthesis Is the Unifying Biochemical Basis of Murine Liver Fibrosis. Cells 2023, 12, 485. https://doi.org/10.3390/cells12030485
Beyoğlu D, Huang P, Skelton-Badlani D, Zong C, Popov YV, Idle JR. Metabolic Hijacking of Hexose Metabolism to Ascorbate Synthesis Is the Unifying Biochemical Basis of Murine Liver Fibrosis. Cells. 2023; 12(3):485. https://doi.org/10.3390/cells12030485
Chicago/Turabian StyleBeyoğlu, Diren, Pinzhu Huang, Disha Skelton-Badlani, Christine Zong, Yury V. Popov, and Jeffrey R. Idle. 2023. "Metabolic Hijacking of Hexose Metabolism to Ascorbate Synthesis Is the Unifying Biochemical Basis of Murine Liver Fibrosis" Cells 12, no. 3: 485. https://doi.org/10.3390/cells12030485
APA StyleBeyoğlu, D., Huang, P., Skelton-Badlani, D., Zong, C., Popov, Y. V., & Idle, J. R. (2023). Metabolic Hijacking of Hexose Metabolism to Ascorbate Synthesis Is the Unifying Biochemical Basis of Murine Liver Fibrosis. Cells, 12(3), 485. https://doi.org/10.3390/cells12030485