
Modeling of FAN1-Deficient Kidney Disease Using a Human Induced Pluripotent Stem Cell-Derived Kidney Organoid System

 , , , , , and
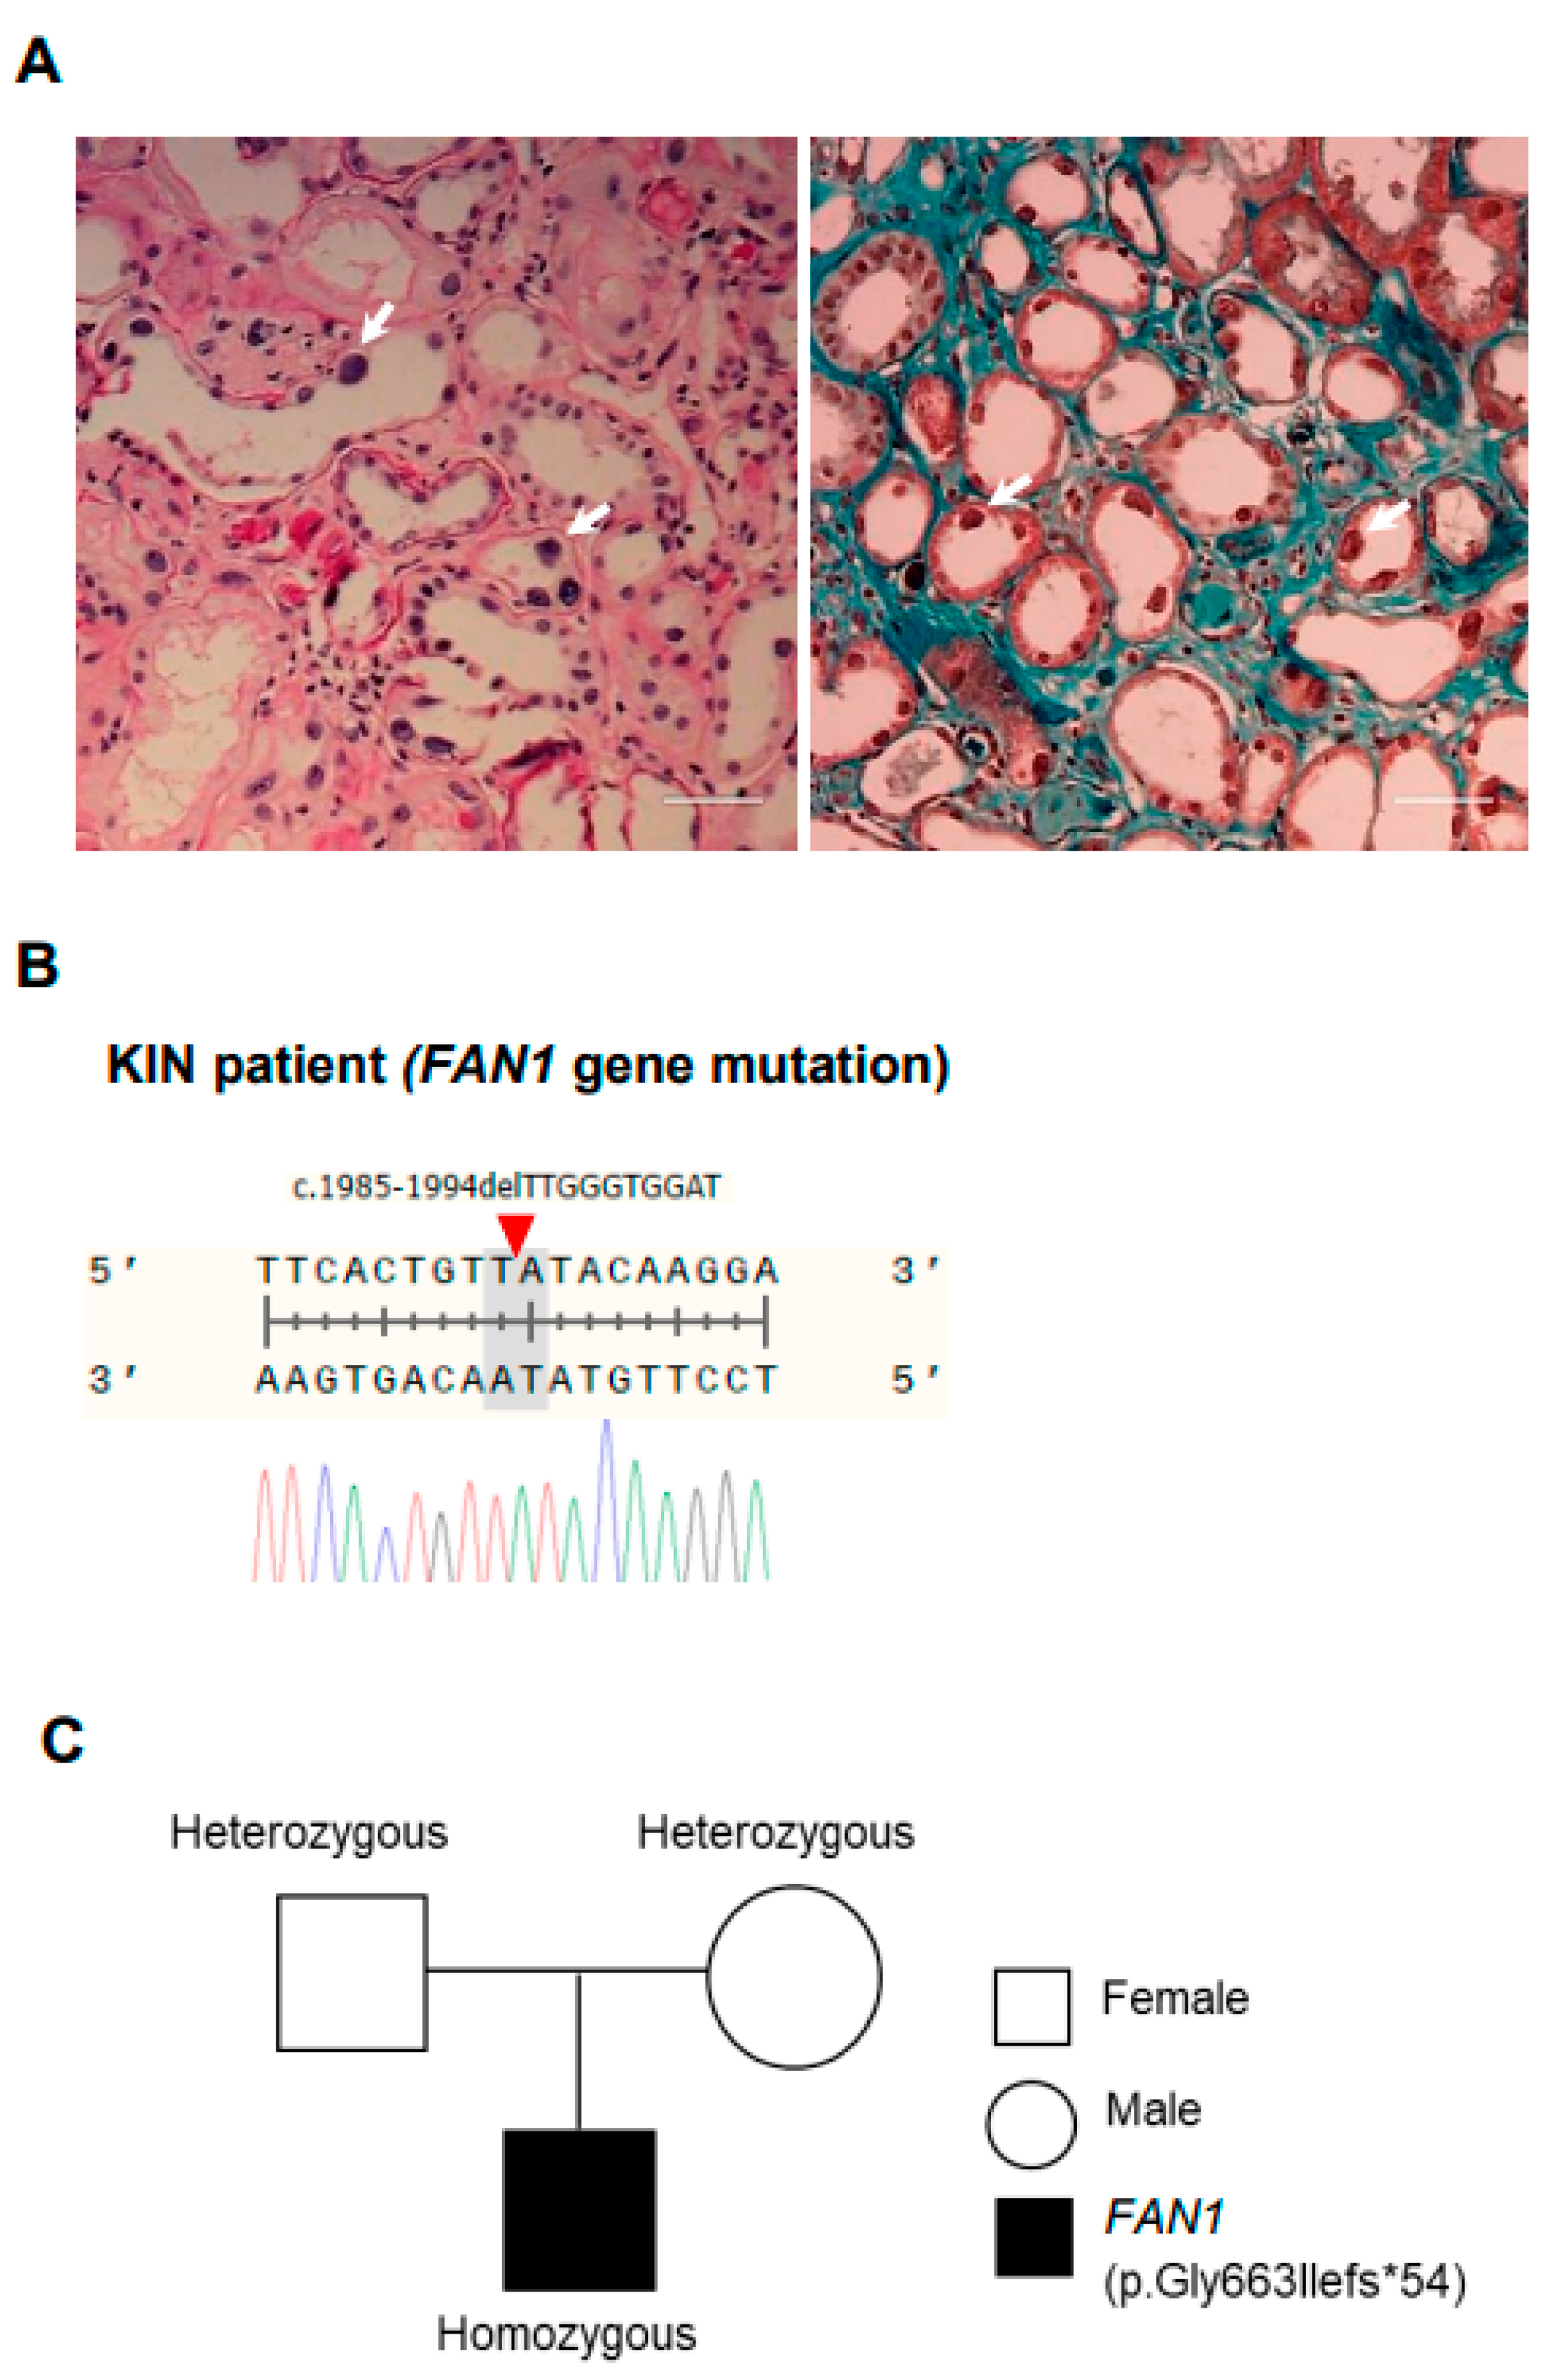
Abstract
:1. Introduction
2. Materials and Methods
2.1. FAN1 Gene Sequencing
2.2. Gene Editing Using CRISPR/Cas9
2.3. hiPSC Cell Culture
2.4. Tri-Lineage Differentiation
2.5. Kidney Organoid Differentiation from hiPSCs
2.6. Flow Cytometry
2.7. RT-PCR
2.8. Immunofluorescence
2.9. Immunoblot Analysis
2.10. Statistical Analyses
3. Results
3.1. Summary of Clinical Features of a Patient with Karyomegalic Interstitial Nephritis
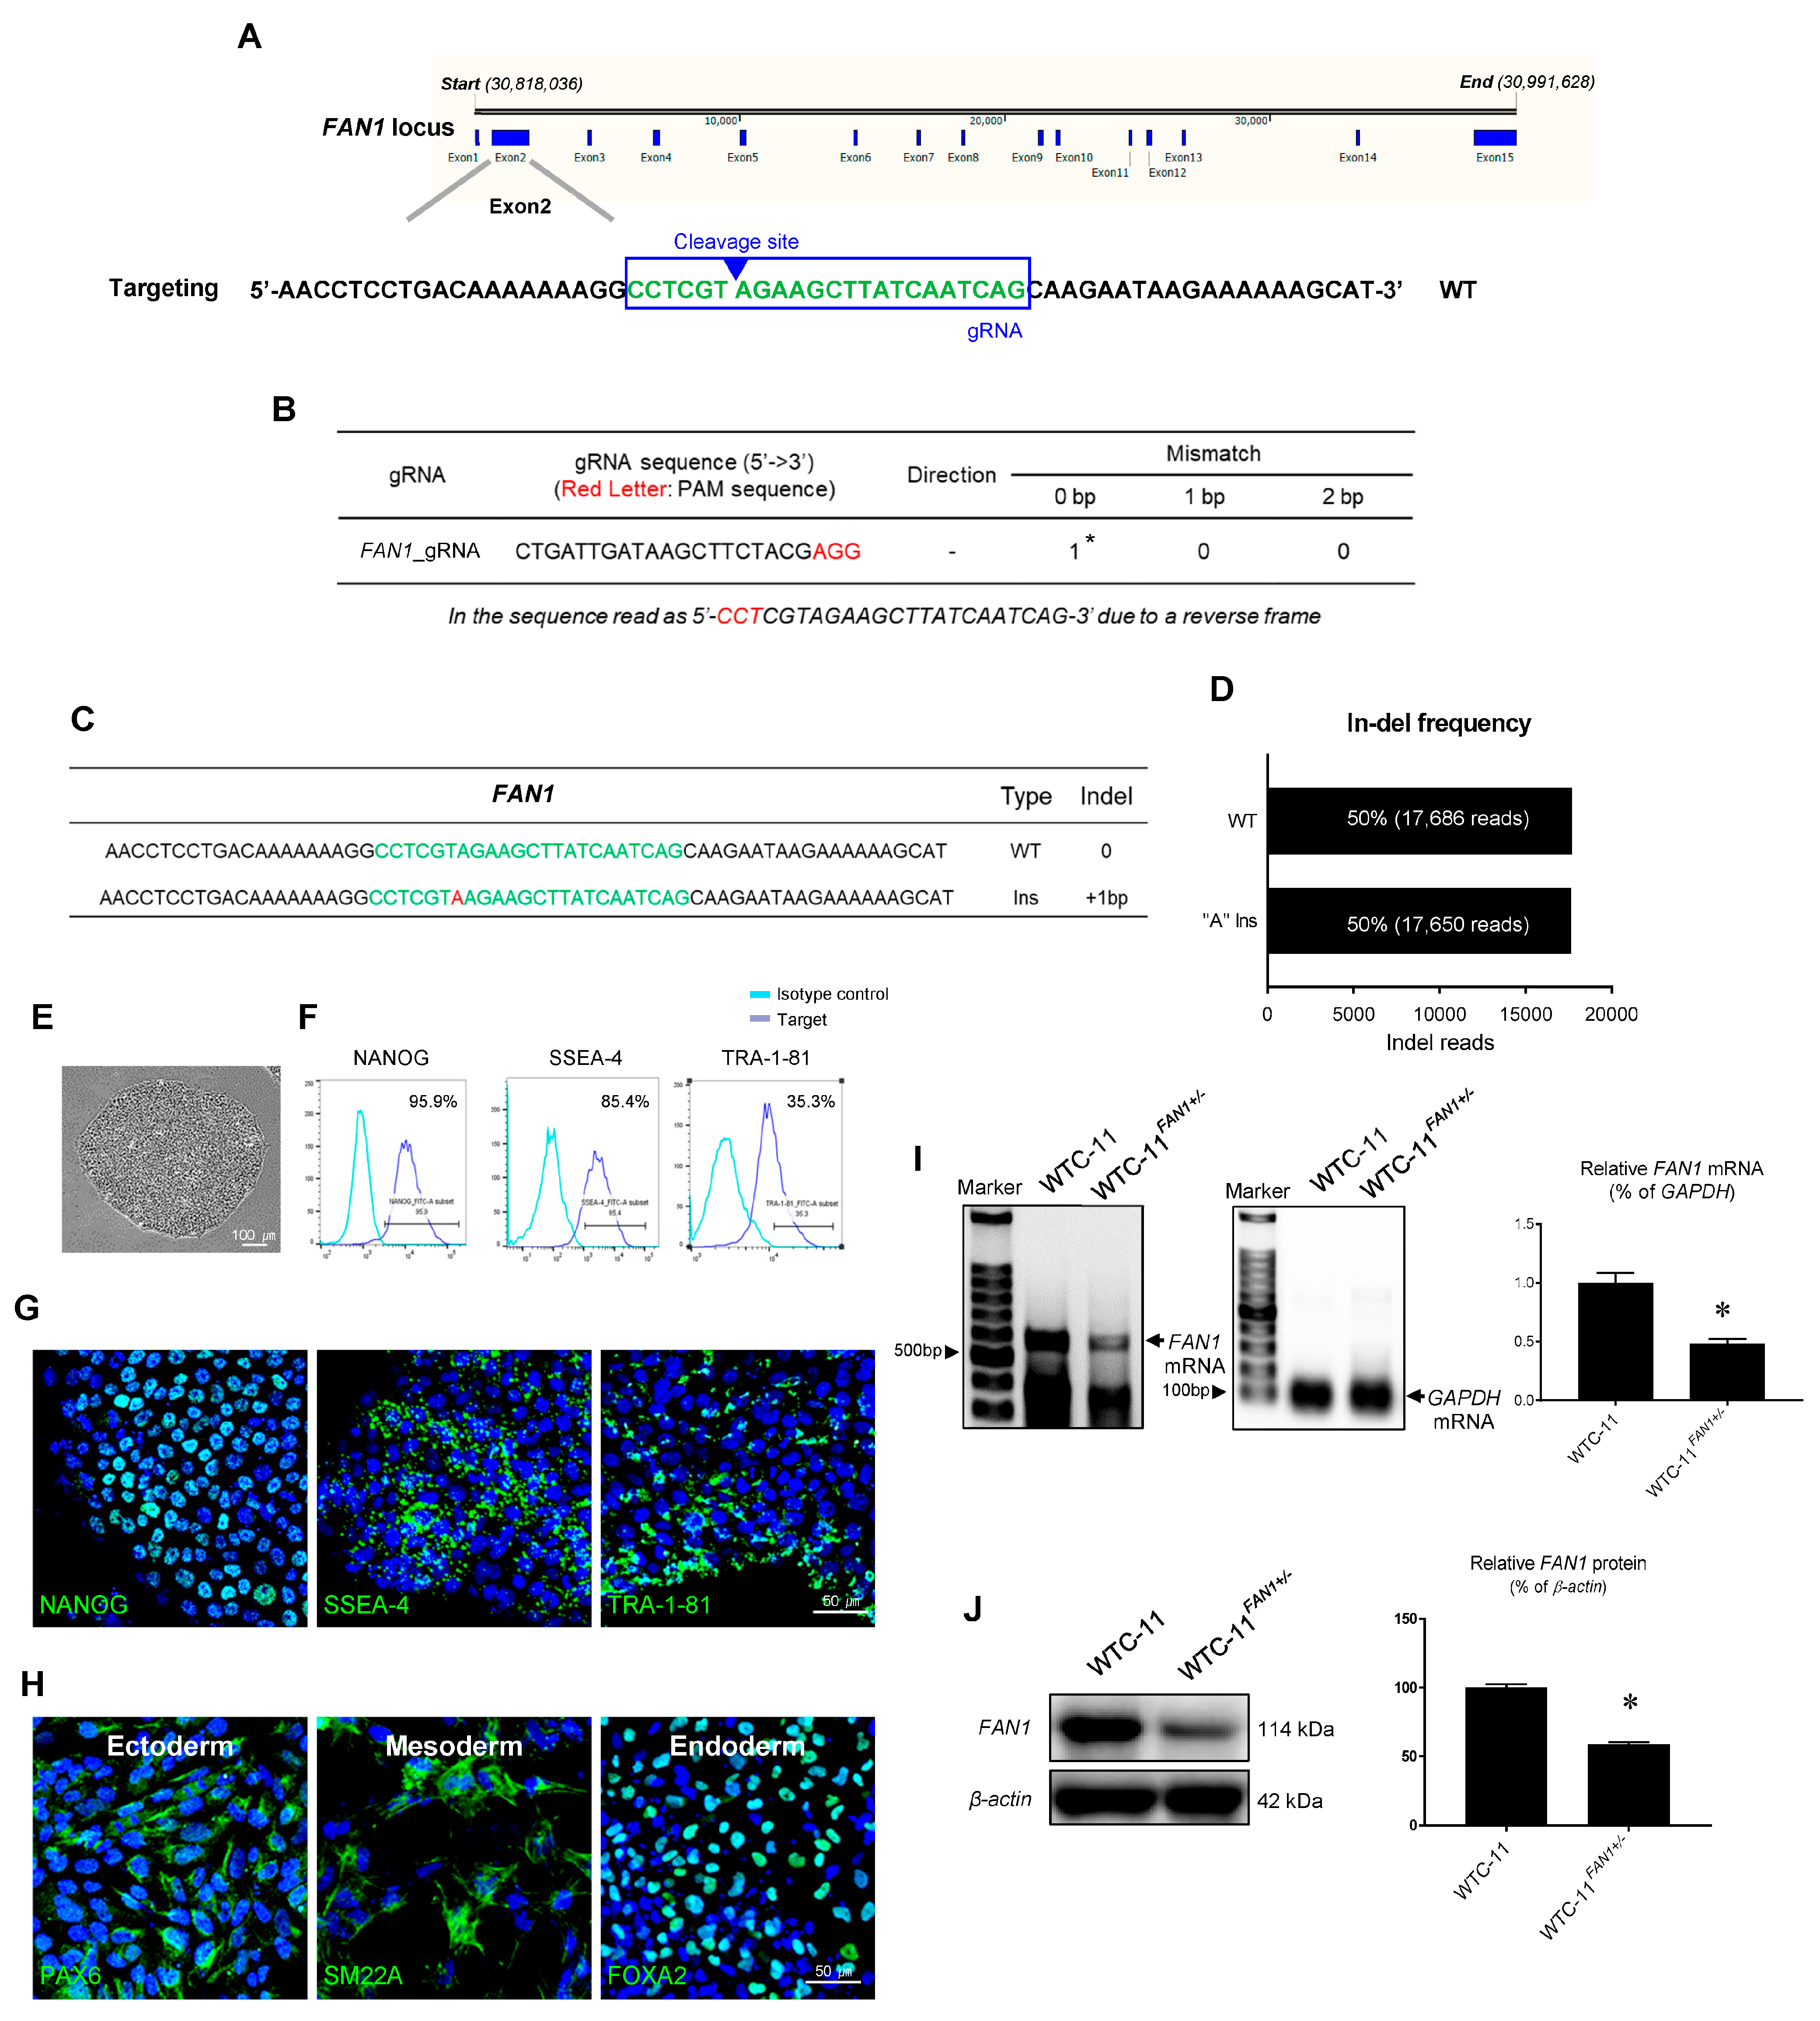
3.2. Generation of FAN1 Gene Mutation hiPSC Using CRISPR/Cas9 System
3.3. Characterization of FAN1 Gene Edited WTC-11 hiPSC
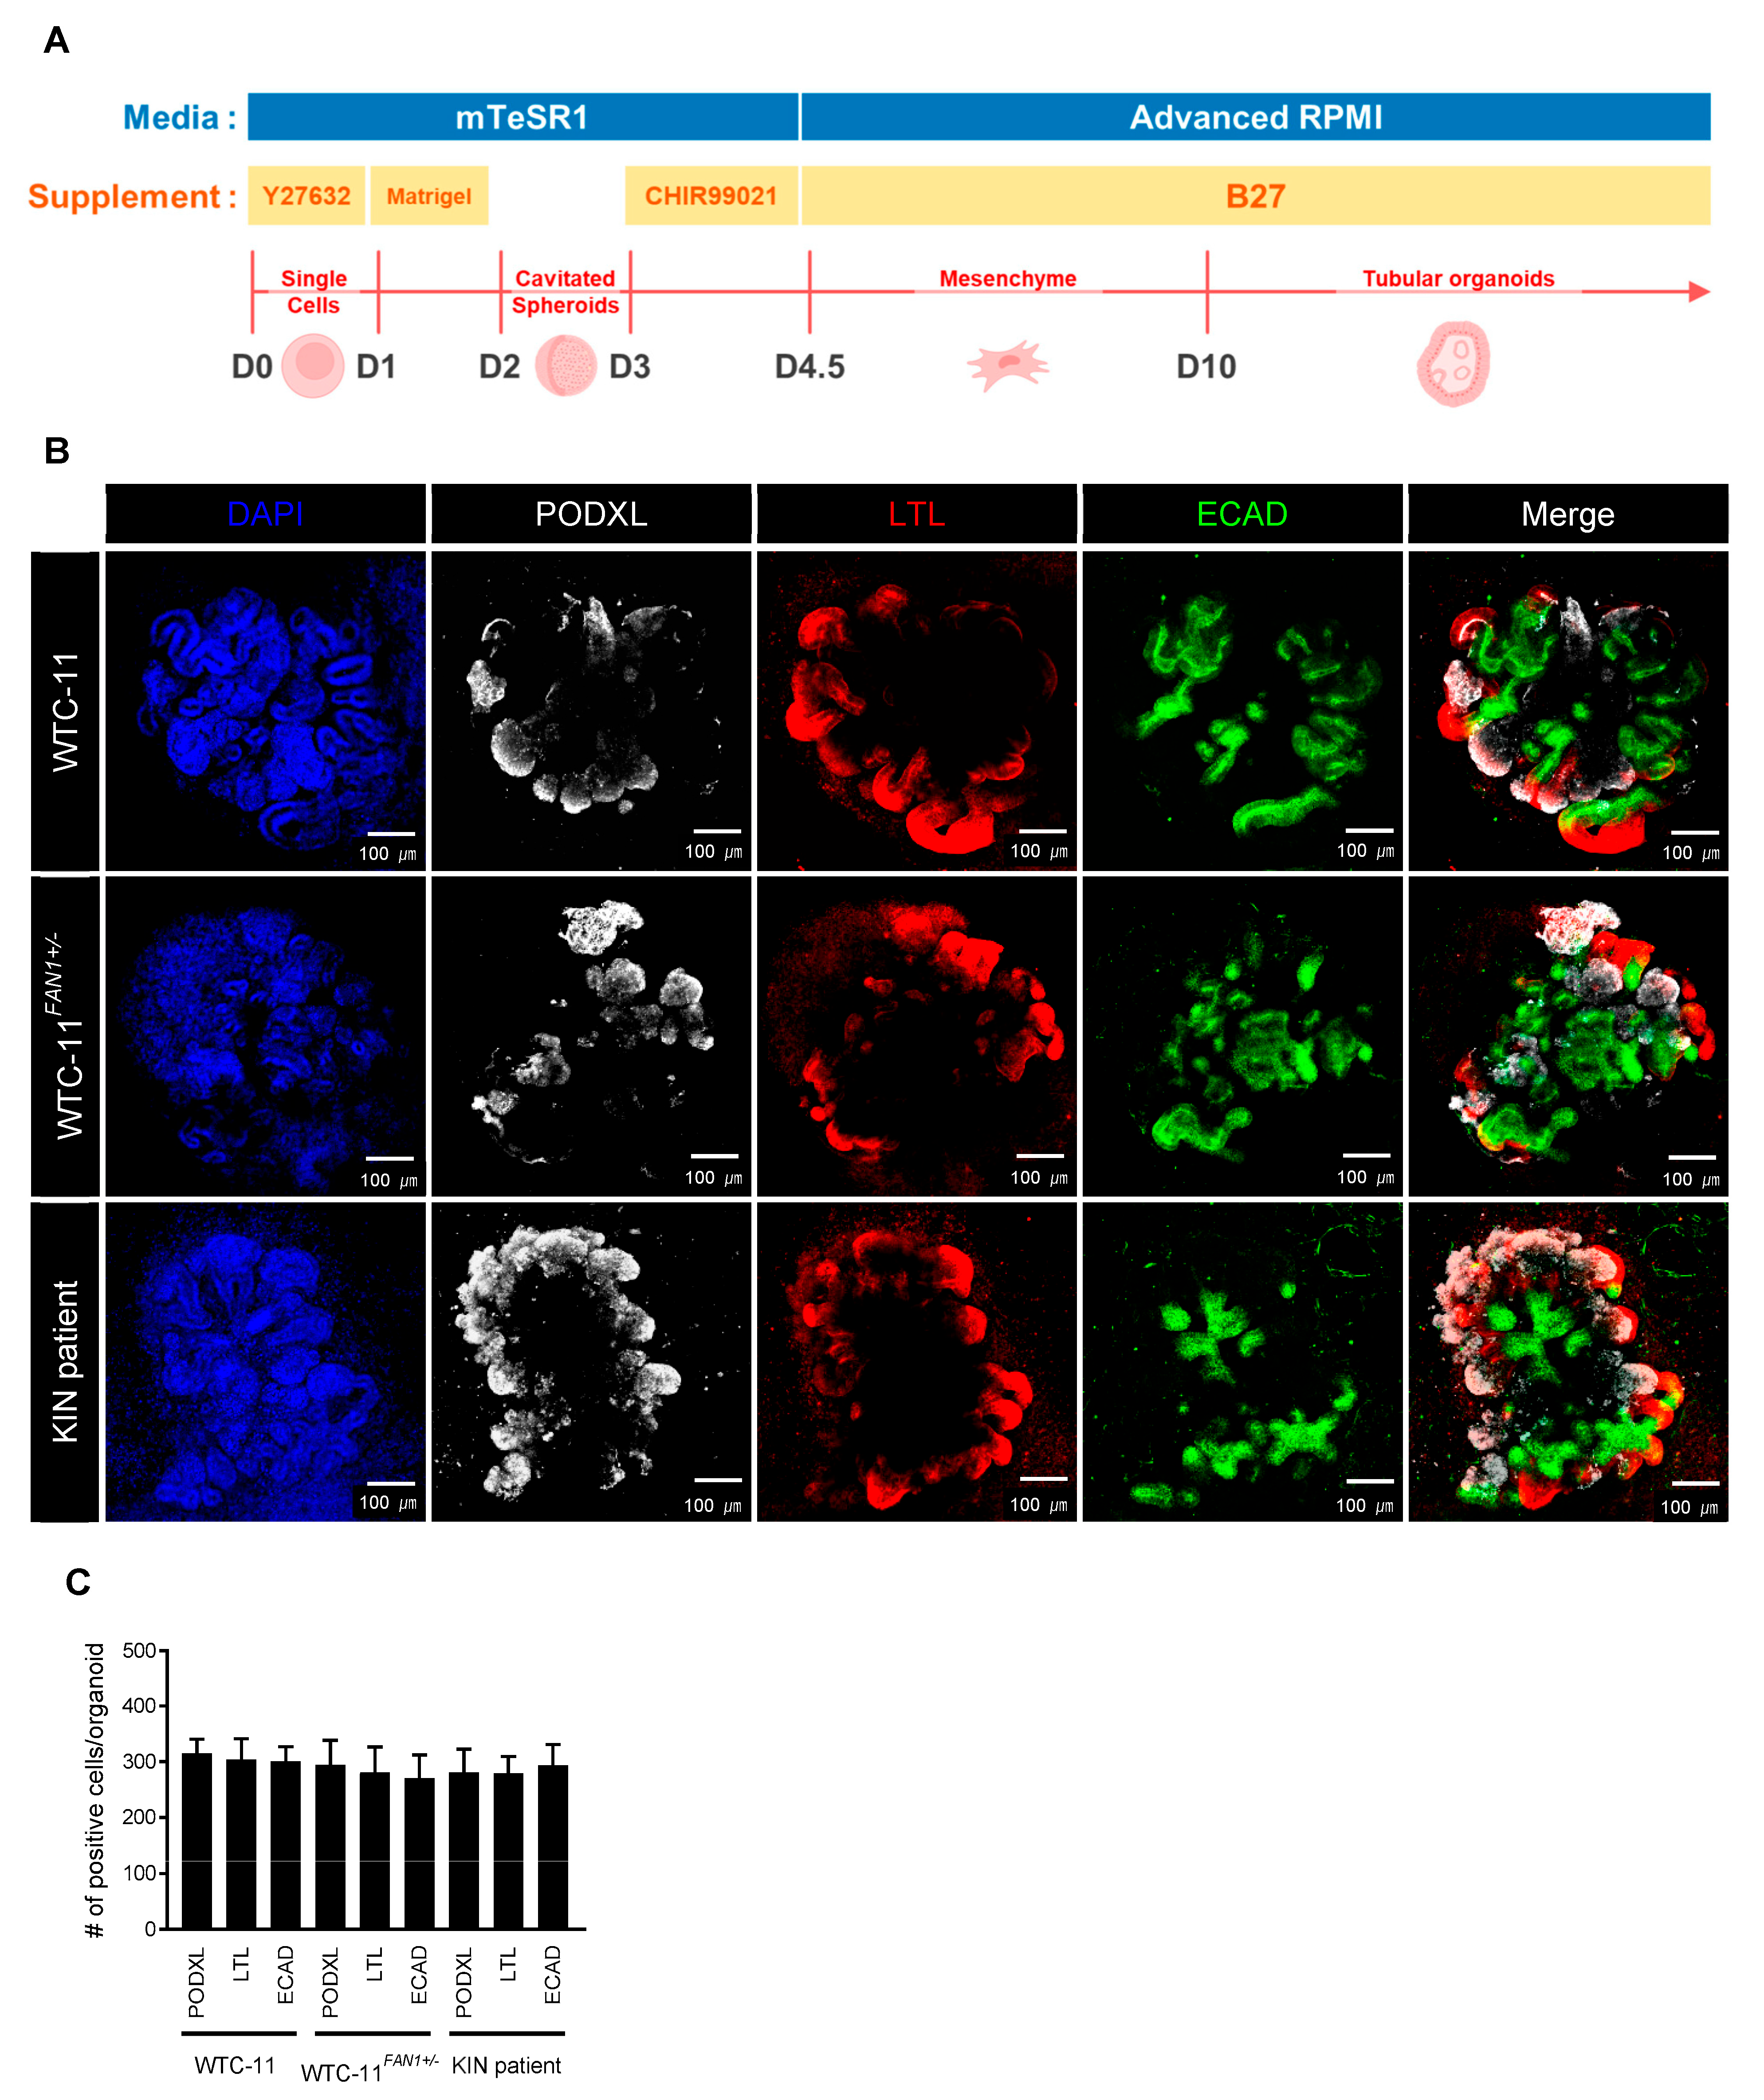
3.4. Differentiation of FAN1-Mutant hiPSCs into Kidney Organoid
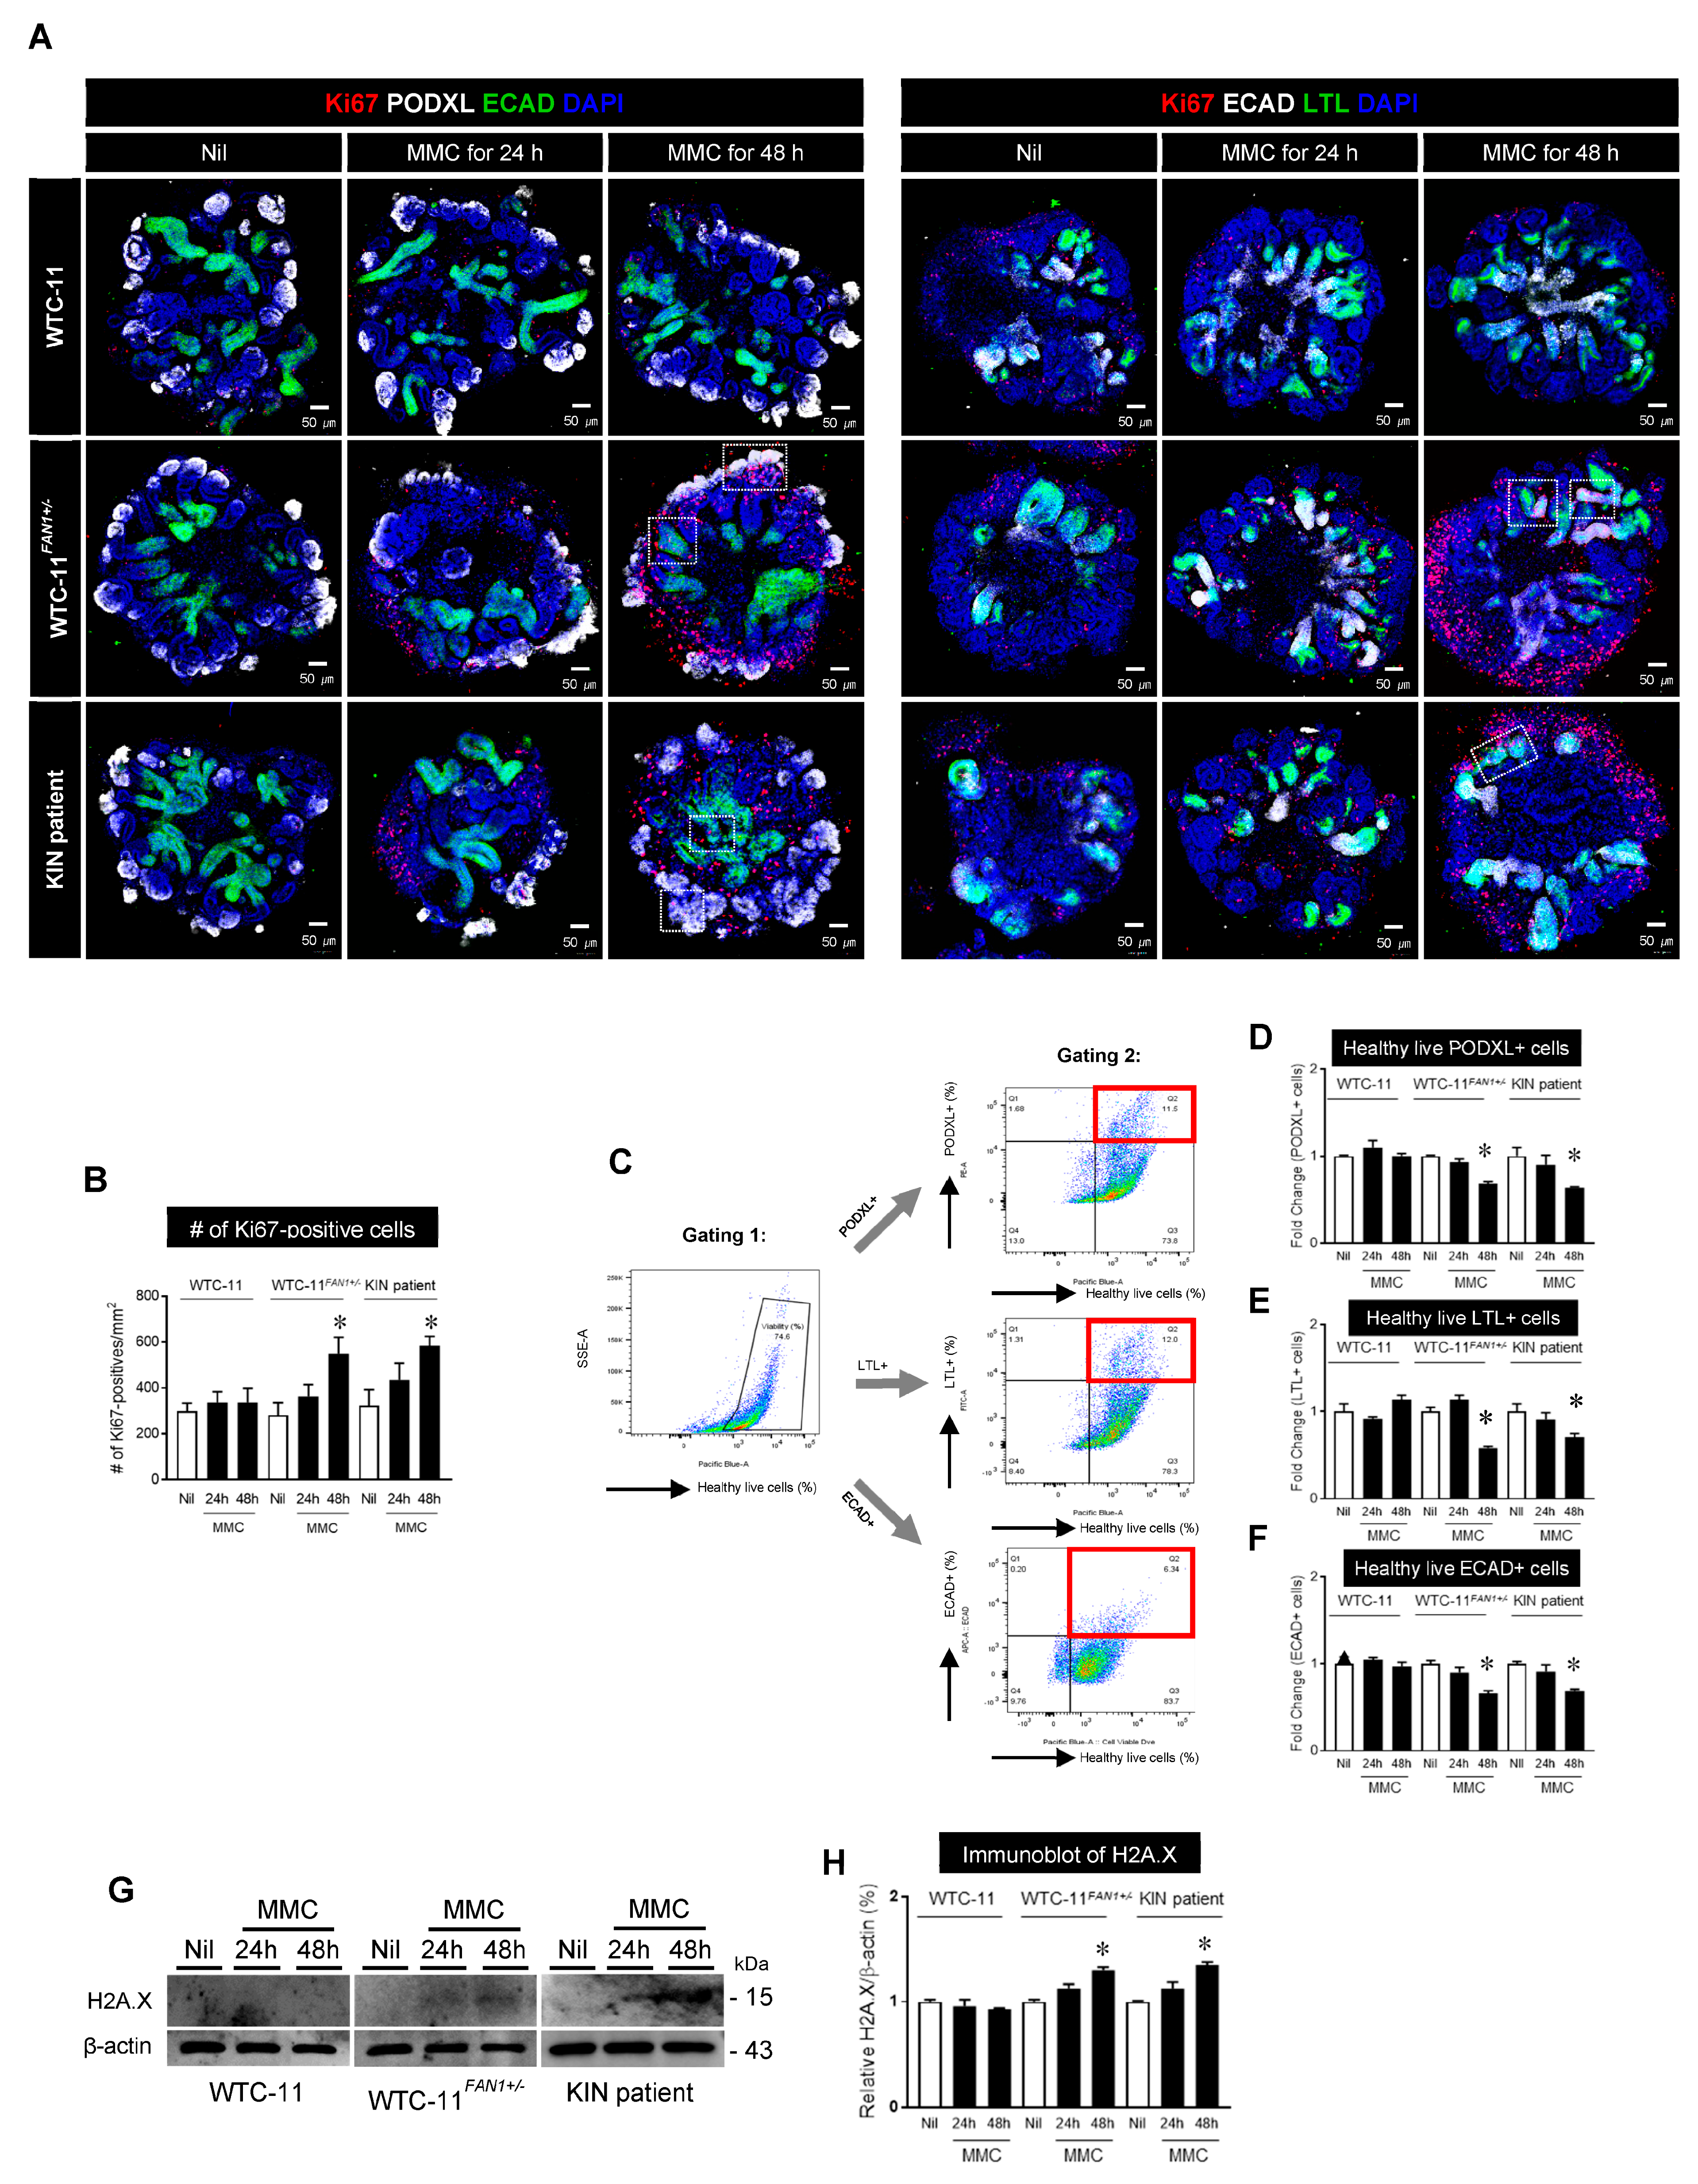
3.5. Effect of Mitomycin C treatment in Kidney Organoids from WTC-11, WTC-11FAN1+/−, and KIN Patient hiPSCs
4. Discussion
5. Conclusions
Author Contributions
Funding
Institutional Review Board Statement
Informed Consent Statement
Data Availability Statement
Acknowledgments
Conflicts of Interest
References
- Zhou, W.; Otto, E.A.; Cluckey, A.; Airik, R.; Hurd, T.W.; Chaki, M.; Diaz, K.; Lach, F.P.; Bennett, G.R.; Gee, H.Y.; et al. FAN1 mutations cause karyomegalic interstitial nephritis, linking chronic kidney failure to defective DNA damage repair. Nat. Genet. 2012, 44, 910–915. [Google Scholar] [CrossRef] [PubMed]
- Airik, R.; Schueler, M.; Airik, M.; Cho, J.; Porath, J.D.; Mukherjee, E.; Sims-Lucas, S.; Hildebrandt, F. A FANCD2/FANCI-Associated Nuclease 1-Knockout Model Develops Karyomegalic Interstitial Nephritis. J. Am. Soc. Nephrol. JASN 2016, 27, 3552–3559. [Google Scholar] [CrossRef]
- Thongthip, S.; Bellani, M.; Gregg, S.Q.; Sridhar, S.; Conti, B.A.; Chen, Y.; Seidman, M.M.; Smogorzewska, A. Fan1 deficiency results in DNA interstrand cross-link repair defects, enhanced tissue karyomegaly, and organ dysfunction. Genes Dev. 2016, 30, 645–659. [Google Scholar] [CrossRef]
- Kratz, K.; Schopf, B.; Kaden, S.; Sendoel, A.; Eberhard, R.; Lademann, C.; Cannavo, E.; Sartori, A.A.; Hengartner, M.O.; Jiricny, J. Deficiency of FANCD2-associated nuclease KIAA1018/FAN1 sensitizes cells to interstrand crosslinking agents. Cell 2010, 142, 77–88. [Google Scholar] [CrossRef] [PubMed]
- Wrighton, K.H. DNA repair: A new fan of the Fanconi anaemia pathway. Nat. Rev. Mol. Cell Biol. 2010, 11, 603. [Google Scholar] [CrossRef] [PubMed]
- Liu, T.; Ghosal, G.; Yuan, J.; Chen, J.; Huang, J. FAN1 acts with FANCI-FANCD2 to promote DNA interstrand cross-link repair. Science 2010, 329, 693–696. [Google Scholar] [CrossRef]
- O’Donnell, L.; Durocher, D. DNA repair has a new FAN1 club. Mol. Cell 2010, 39, 167–169. [Google Scholar] [CrossRef]
- Airik, M.; Phua, Y.L.; Huynh, A.B.; McCourt, B.T.; Rush, B.M.; Tan, R.J.; Vockley, J.; Murray, S.L.; Dorman, A.; Conlon, P.J.; et al. Persistent DNA damage underlies tubular cell polyploidization and progression to chronic kidney disease in kidneys deficient in the DNA repair protein FAN1. Kidney Int. 2022, 102, 1042–1056. [Google Scholar] [CrossRef]
- Narsinh, K.H.; Plews, J.; Wu, J.C. Comparison of human induced pluripotent and embryonic stem cells: Fraternal or identical twins? Mol. Ther. 2011, 19, 635–638. [Google Scholar] [CrossRef]
- Kim, K.W.; Shin, Y.J.; Kim, B.M.; Cui, S.; Ko, E.J.; Lim, S.W.; Yang, C.W.; Chung, B.H. Modeling of endothelial cell dysfunction using human induced pluripotent stem cells derived from patients with end-stage renal disease. Kidney Res. Clin. Pract. 2021, 40, 698–711. [Google Scholar] [CrossRef]
- Cui, S.; Shin, Y.J.; Ko, E.J.; Lim, S.W.; Ju, J.H.; Lee, K.I.; Lee, J.Y.; Yang, C.W.; Chung, B.H. Human-induced pluripotent stem cell lines (CMCi006-A and CMCi007-A) from a female and male patient with Fabry disease carrying the same frameshift deletion mutation. Stem Cell Res. 2021, 51, 102214. [Google Scholar] [CrossRef] [PubMed]
- Lim, S.W.; Shin, Y.J.; Cui, S.; Ko, E.J.; Lee, K.I.; Lee, J.Y.; Chung, B.H.; Yang, C.W. Generation of a human induced pluripotent stem cell line (CMCi002-A) from a patient with Gitelman’s syndrome. Stem Cell Res. 2020, 49, 102110. [Google Scholar] [CrossRef] [PubMed]
- Takahashi, K.; Tanabe, K.; Ohnuki, M.; Narita, M.; Ichisaka, T.; Tomoda, K.; Yamanaka, S. Induction of pluripotent stem cells from adult human fibroblasts by defined factors. Cell 2007, 131, 861–872. [Google Scholar] [CrossRef]
- Park, I.H.; Arora, N.; Huo, H.; Maherali, N.; Ahfeldt, T.; Shimamura, A.; Lensch, M.W.; Cowan, C.; Hochedlinger, K.; Daley, G.Q. Disease-specific induced pluripotent stem cells. Cell 2008, 134, 877–886. [Google Scholar] [CrossRef] [PubMed]
- Rowe, R.G.; Daley, G.Q. Induced pluripotent stem cells in disease modelling and drug discovery. Nat. Rev. Genet. 2019, 20, 377–388. [Google Scholar] [CrossRef] [PubMed]
- Mali, P.; Yang, L.; Esvelt, K.M.; Aach, J.; Guell, M.; DiCarlo, J.E.; Norville, J.E.; Church, G.M. RNA-guided human genome engineering via Cas9. Science 2013, 339, 823–826. [Google Scholar] [CrossRef] [PubMed]
- Ding, Q.; Regan, S.N.; Xia, Y.; Oostrom, L.A.; Cowan, C.A.; Musunuru, K. Enhanced efficiency of human pluripotent stem cell genome editing through replacing TALENs with CRISPRs. Cell Stem Cell 2013, 12, 393–394. [Google Scholar] [CrossRef]
- Liu, E.; Radmanesh, B.; Chung, B.H.; Donnan, M.D.; Yi, D.; Dadi, A.; Smith, K.D.; Himmelfarb, J.; Li, M.; Freedman, B.S.; et al. Profiling APOL1 Nephropathy Risk Variants in Genome-Edited Kidney Organoids with Single-Cell Transcriptomics. Kidney360 2020, 1, 203–215. [Google Scholar] [CrossRef]
- Cruz, N.M.; Song, X.; Czerniecki, S.M.; Gulieva, R.E.; Churchill, A.J.; Kim, Y.K.; Winston, K.; Tran, L.M.; Diaz, M.A.; Fu, H.; et al. Organoid cystogenesis reveals a critical role of microenvironment in human polycystic kidney disease. Nat. Mater. 2017, 16, 1112–1119. [Google Scholar] [CrossRef]
- Park, K.; Lee, J.Y.; Lee, S.Y.; Jeong, I.; Park, S.Y.; Kim, J.W.; Nam, S.A.; Kim, H.W.; Kim, Y.K.; Lee, S. Deep learning predicts the differentiation of kidney organoids derived from human induced pluripotent stem cells. Kidney Res. Clin. Pract. 2023, 42, 75–85. [Google Scholar] [CrossRef]
- Freedman, B.S.; Brooks, C.R.; Lam, A.Q.; Fu, H.; Morizane, R.; Agrawal, V.; Saad, A.F.; Li, M.K.; Hughes, M.R.; Werff, R.V.; et al. Modelling kidney disease with CRISPR-mutant kidney organoids derived from human pluripotent epiblast spheroids. Nat. Commun. 2015, 6, 8715. [Google Scholar] [CrossRef] [PubMed]
- Cui, S.; Fang, X.; Lee, H.; Shin, Y.J.; Koh, E.S.; Chung, S.; Park, H.S.; Lim, S.W.; Lee, K.I.; Lee, J.Y.; et al. Modeling of Fabry disease nephropathy using patient derived human induced pluripotent stem cells and kidney organoid system. J. Transl. Med. 2023, 21, 138. [Google Scholar] [CrossRef] [PubMed]
- Cui, S.; Shin, Y.J.; Fang, X.; Lee, H.; Eum, S.H.; Ko, E.J.; Lim, S.W.; Shin, E.; Lee, K.I.; Lee, J.Y.; et al. CRISPR/Cas9-mediated A4GALT suppression rescues Fabry disease phenotypes in a kidney organoid model. Transl. Res. 2023, 258, 35–46. [Google Scholar] [CrossRef] [PubMed]
- Lim, S.W.; Fang, X.; Cui, S.; Lee, H.; Shin, Y.J.; Ko, E.J.; Lee, K.I.; Lee, J.Y.; Chung, B.H.; Yang, C.W. CRISPR-Cas9-Mediated Correction of SLC12A3 Gene Mutation Rescues the Gitelman’s Disease Phenotype in a Patient-Derived Kidney Organoid System. Int. J. Mol. Sci. 2023, 24, 3019. [Google Scholar] [CrossRef]
- Cruz, N.M.; Freedman, B.S. Differentiation of human kidney organoids from pluripotent stem cells. Methods Cell Biol. 2019, 153, 133–150. [Google Scholar]
- Na, D.H.; Lim, S.W.; Kim, B.M.; Kim, K.W.; Shin, Y.J.; Chae, H.; Ko, E.J.; Yang, C.W.; Kim, M.; Chung, B.H. Generation of a human induced pluripotent stem cell line (CMCi001-A) from a patient with karyomegalic interstitial nephritis with homozygous frameshift deletion mutation c.1985_1994del10 of the FANCD2/FANCI-Associated Nuclease 1 gene. Stem Cell Res. 2020, 46, 101876. [Google Scholar] [CrossRef]
- Canaud, G.; Bonventre, J.V. Cell cycle arrest and the evolution of chronic kidney disease from acute kidney injury. Nephrol. Dial. Transplant. 2015, 30, 575–583. [Google Scholar] [CrossRef]
- McCulloch, T.; Prayle, A.; Lunn, A.; Watson, A.R. Karyomegalic-like nephropathy, Ewing’s sarcoma and ifosfamide therapy. Pediatr. Nephrol. 2011, 26, 1163–1166. [Google Scholar] [CrossRef]
- Godin, M.; Francois, A.; Le Roy, F.; Morin, J.P.; Creppy, E.; Hemet, J.; Fillastre, J.P. Karyomegalic interstitial nephritis. Am. J. Kidney Dis. 1996, 27, 166. [Google Scholar] [CrossRef]
- Economopoulou, M.; Langer, H.F.; Celeste, A.; Orlova, V.V.; Choi, E.Y.; Ma, M.; Vassilopoulos, A.; Callen, E.; Deng, C.; Bassing, C.H.; et al. Histone H2AX is integral to hypoxia-driven neovascularization. Nat. Med. 2009, 15, 553–558. [Google Scholar] [CrossRef]
- Valdiglesias, V.; Giunta, S.; Fenech, M.; Neri, M.; Bonassi, S. gammaH2AX as a marker of DNA double strand breaks and genomic instability in human population studies. Mutat. Res. 2013, 753, 24–40. [Google Scholar] [CrossRef] [PubMed]
- Garreta, E.; Gonzalez, F.; Montserrat, N. Studying Kidney Disease Using Tissue and Genome Engineering in Human Pluripotent Stem Cells. Nephron 2018, 138, 48–59. [Google Scholar] [CrossRef] [PubMed]
- Deltas, C.; Pierides, A.; Voskarides, K. Molecular genetics of familial hematuric diseases. Nephrol. Dial. Transplant. 2013, 28, 2946–2960. [Google Scholar] [CrossRef] [PubMed]
- Coulter-Mackie, M.B.; Rumsby, G. Genetic heterogeneity in primary hyperoxaluria type 1: Impact on diagnosis. Mol. Genet. Metab. 2004, 83, 38–46. [Google Scholar] [CrossRef]
- Wu, G. Current advances in molecular genetics of autosomal-dominant polycystic kidney disease. Curr. Opin. Nephrol. Hypertens. 2001, 10, 23–31. [Google Scholar] [CrossRef]
- Guo, C.; Ma, X.; Gao, F.; Guo, Y. Off-target effects in CRISPR/Cas9 gene editing. Front. Bioeng. Biotechnol. 2023, 11, 1143157. [Google Scholar] [CrossRef]
- Wienert, B.; Cromer, M.K. CRISPR nuclease off-target activity and mitigation strategies. Front. Genome Ed. 2022, 4, 1050507. [Google Scholar] [CrossRef]


Disclaimer/Publisher’s Note: The statements, opinions and data contained in all publications are solely those of the individual author(s) and contributor(s) and not of MDPI and/or the editor(s). MDPI and/or the editor(s) disclaim responsibility for any injury to people or property resulting from any ideas, methods, instructions or products referred to in the content. |
© 2023 by the authors. Licensee MDPI, Basel, Switzerland. This article is an open access article distributed under the terms and conditions of the Creative Commons Attribution (CC BY) license (https://creativecommons.org/licenses/by/4.0/).
Share and Cite
Lim, S.W.; Na, D.; Lee, H.; Fang, X.; Cui, S.; Shin, Y.J.; Lee, K.I.; Lee, J.Y.; Yang, C.W.; Chung, B.H. Modeling of FAN1-Deficient Kidney Disease Using a Human Induced Pluripotent Stem Cell-Derived Kidney Organoid System. Cells 2023, 12, 2319. https://doi.org/10.3390/cells12182319
Lim SW, Na D, Lee H, Fang X, Cui S, Shin YJ, Lee KI, Lee JY, Yang CW, Chung BH. Modeling of FAN1-Deficient Kidney Disease Using a Human Induced Pluripotent Stem Cell-Derived Kidney Organoid System. Cells. 2023; 12(18):2319. https://doi.org/10.3390/cells12182319
Chicago/Turabian StyleLim, Sun Woo, Dohyun Na, Hanbi Lee, Xianying Fang, Sheng Cui, Yoo Jin Shin, Kang In Lee, Jae Young Lee, Chul Woo Yang, and Byung Ha Chung. 2023. "Modeling of FAN1-Deficient Kidney Disease Using a Human Induced Pluripotent Stem Cell-Derived Kidney Organoid System" Cells 12, no. 18: 2319. https://doi.org/10.3390/cells12182319
APA StyleLim, S. W., Na, D., Lee, H., Fang, X., Cui, S., Shin, Y. J., Lee, K. I., Lee, J. Y., Yang, C. W., & Chung, B. H. (2023). Modeling of FAN1-Deficient Kidney Disease Using a Human Induced Pluripotent Stem Cell-Derived Kidney Organoid System. Cells, 12(18), 2319. https://doi.org/10.3390/cells12182319