
Altered Epigenetic Marks and Gene Expression in Fetal Brain, and Postnatal Behavioural Disorders, Following Prenatal Exposure of Ogg1 Knockout Mice to Saline or Ethanol


Abstract
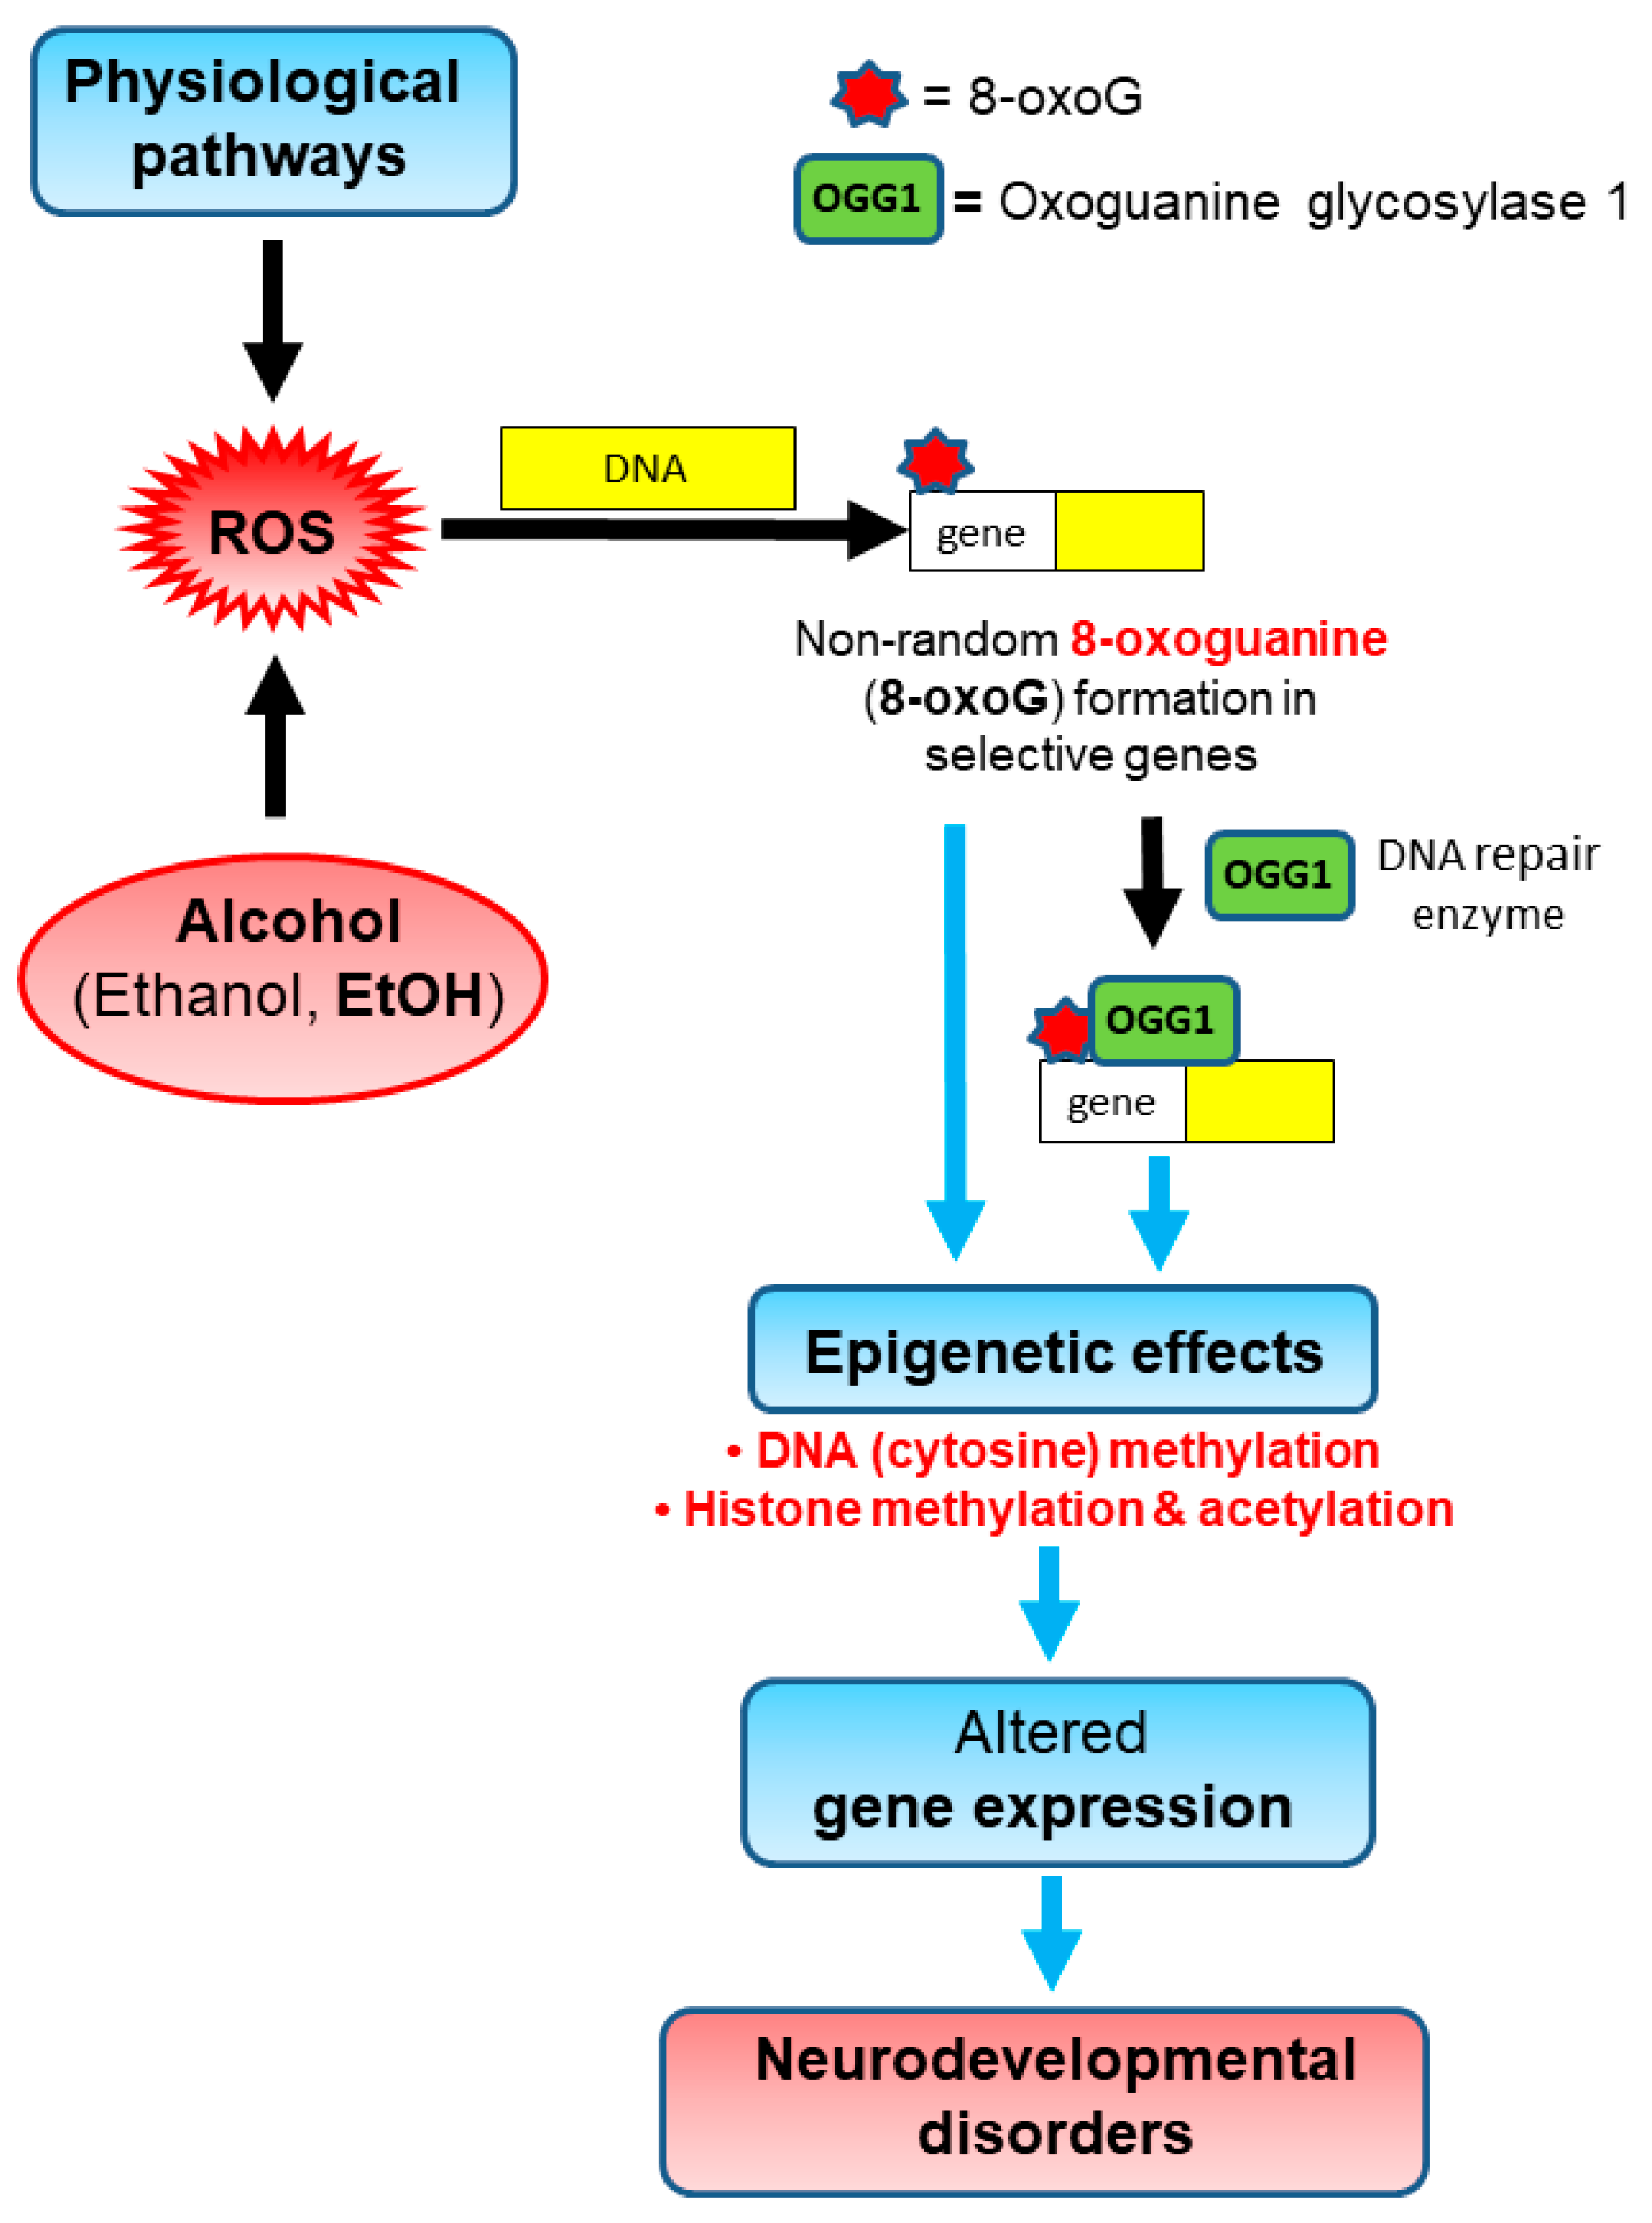
:1. Introduction
2. Methods
2.1. Animals and Diet
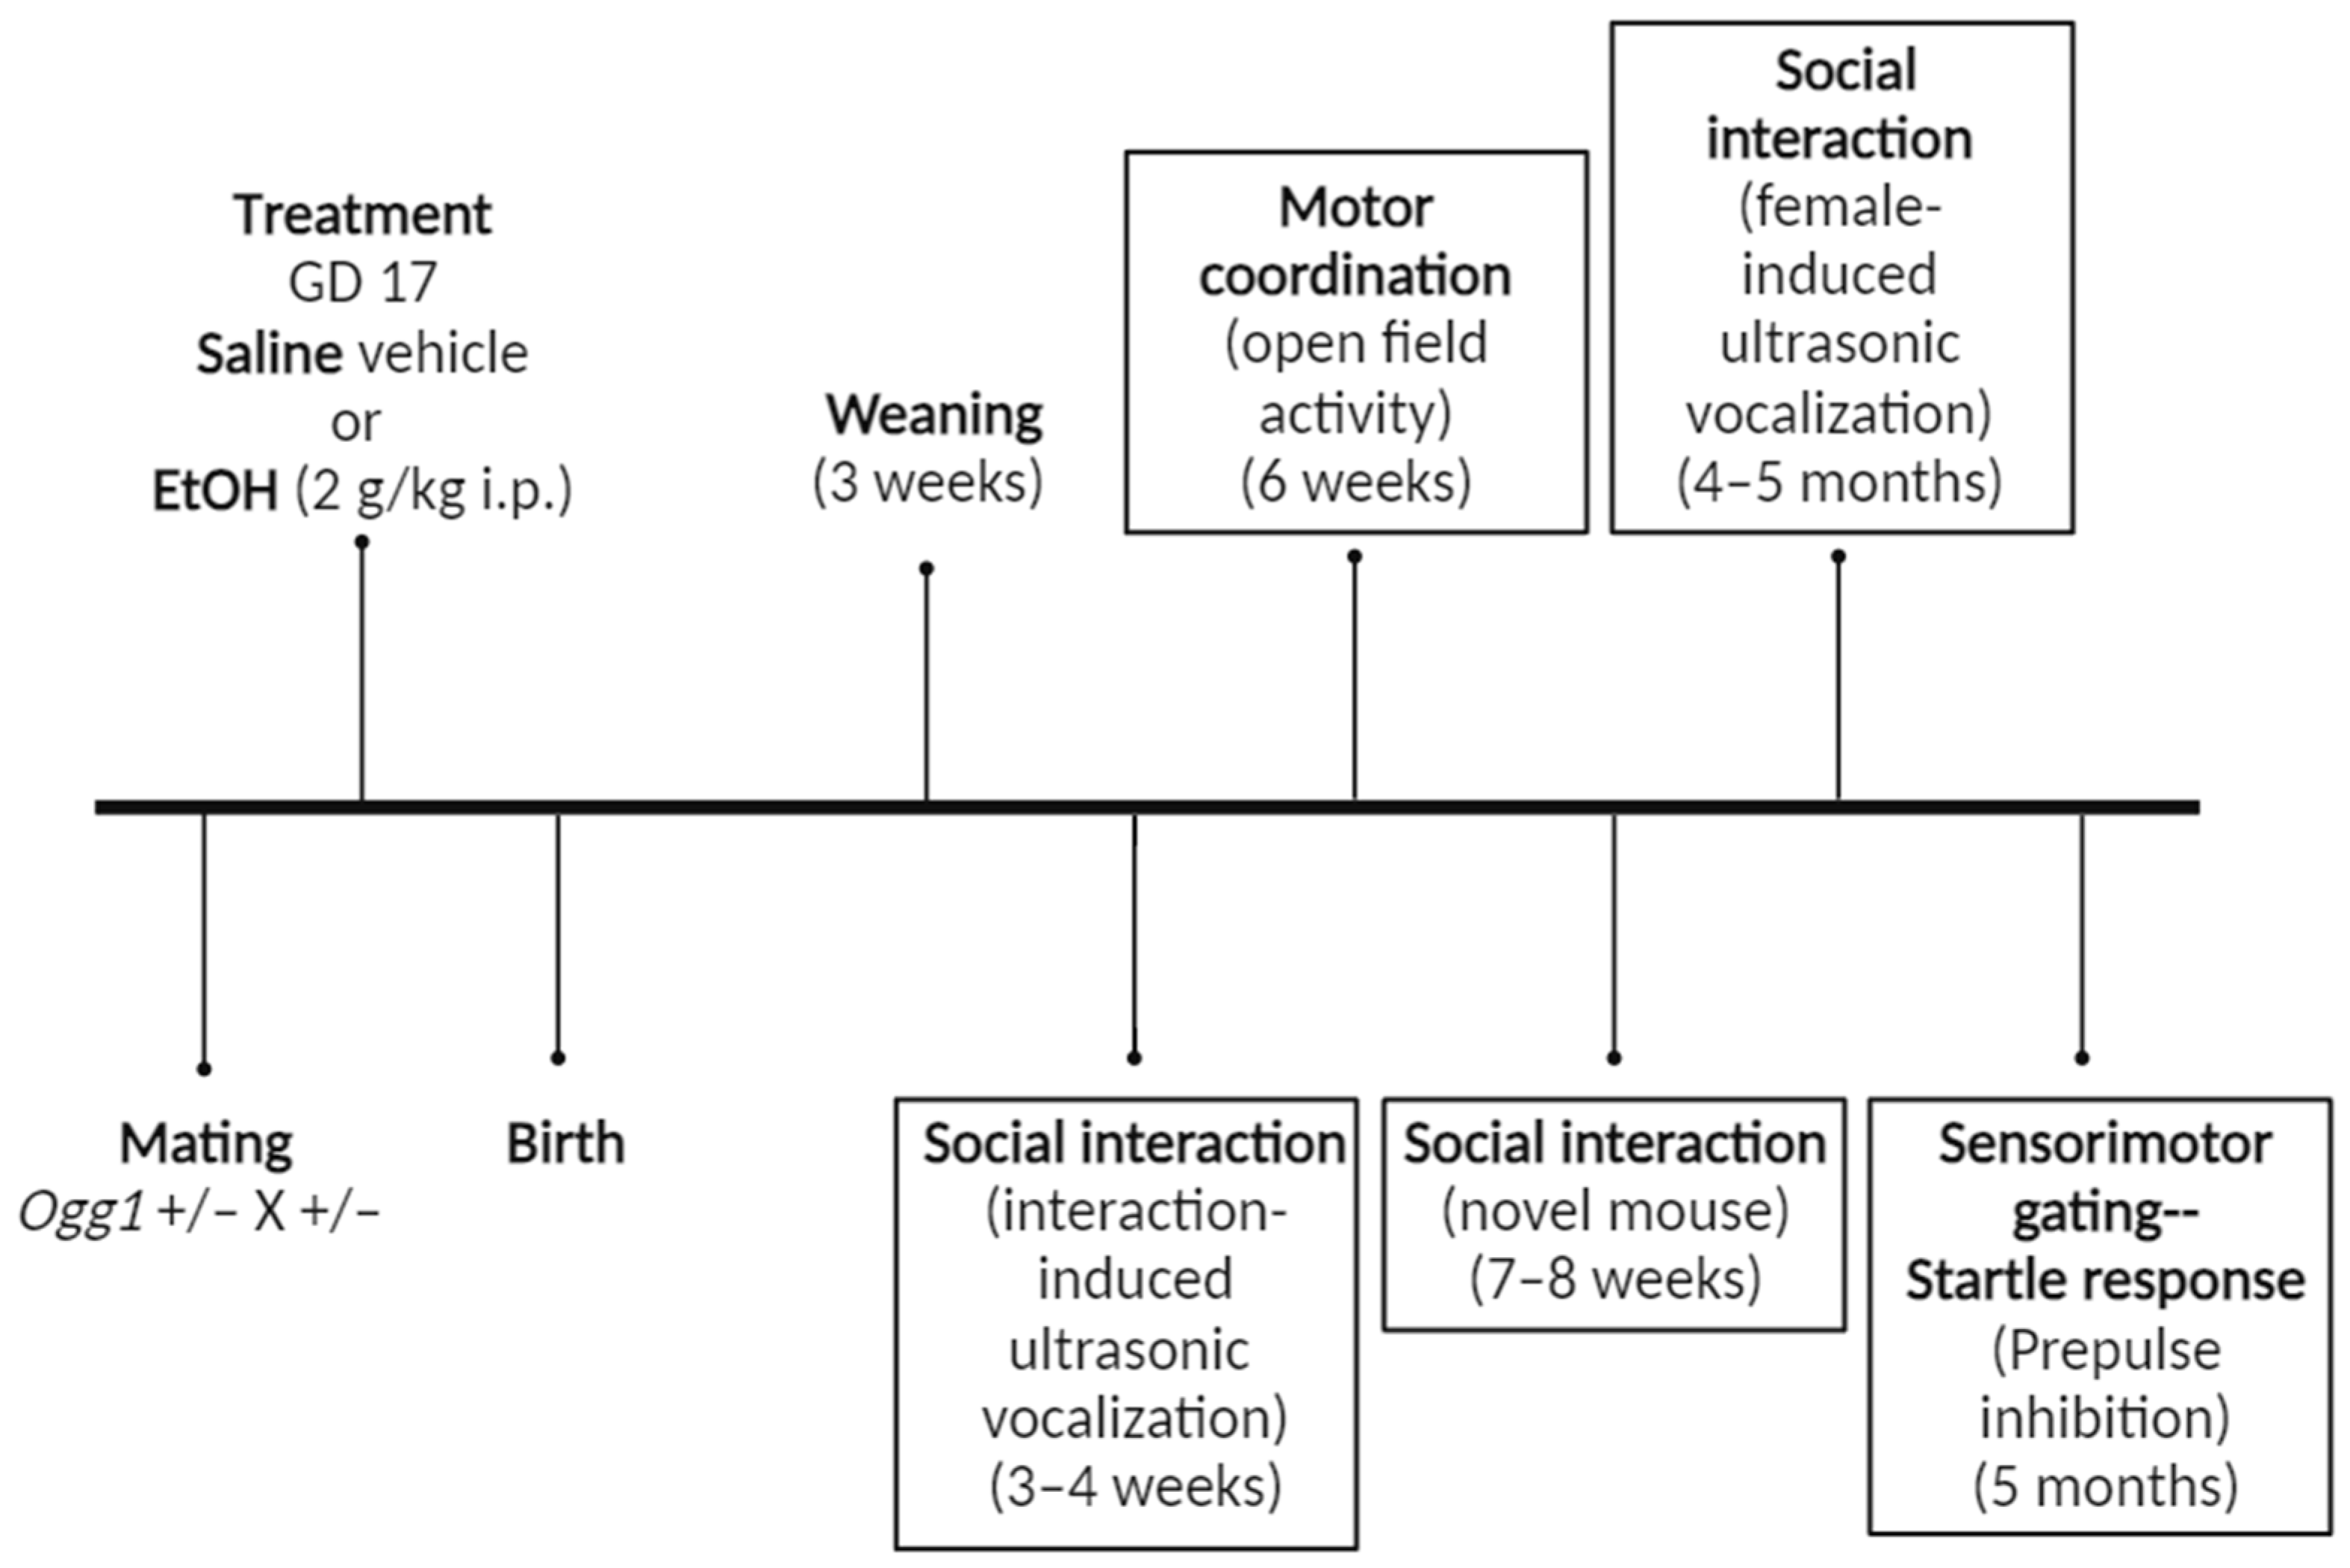
2.2. Treatment Regimen
2.3. DNA Extraction and Determination of Ogg1 Genotype and Sex
2.4. Sex Genotyping
2.5. Histone Modifications
2.6. 5-Methylcytosine (5-mC) and 5-Hydroxymethylcytosine (5-hmC) Levels in GD 17 Fetal Brains
2.7. Gene Expression via Reverse Transcriptase Followed by Quantitative Polymerase Chain Reaction (RT-qPCR)
2.8. Protein Levels
2.9. Chromatin Immunoprecipitation and qPCR (ChIP-qPCR)
2.10. Behavioural Tests
2.11. Interaction-Induced Ultrasonic Vocalizations (USV)
2.12. Open Field Activity
2.13. Social Interaction Test
2.14. Female-Induced Ultrasonic Vocalization (USV)
2.15. Prepulse Inhibition
3. Results
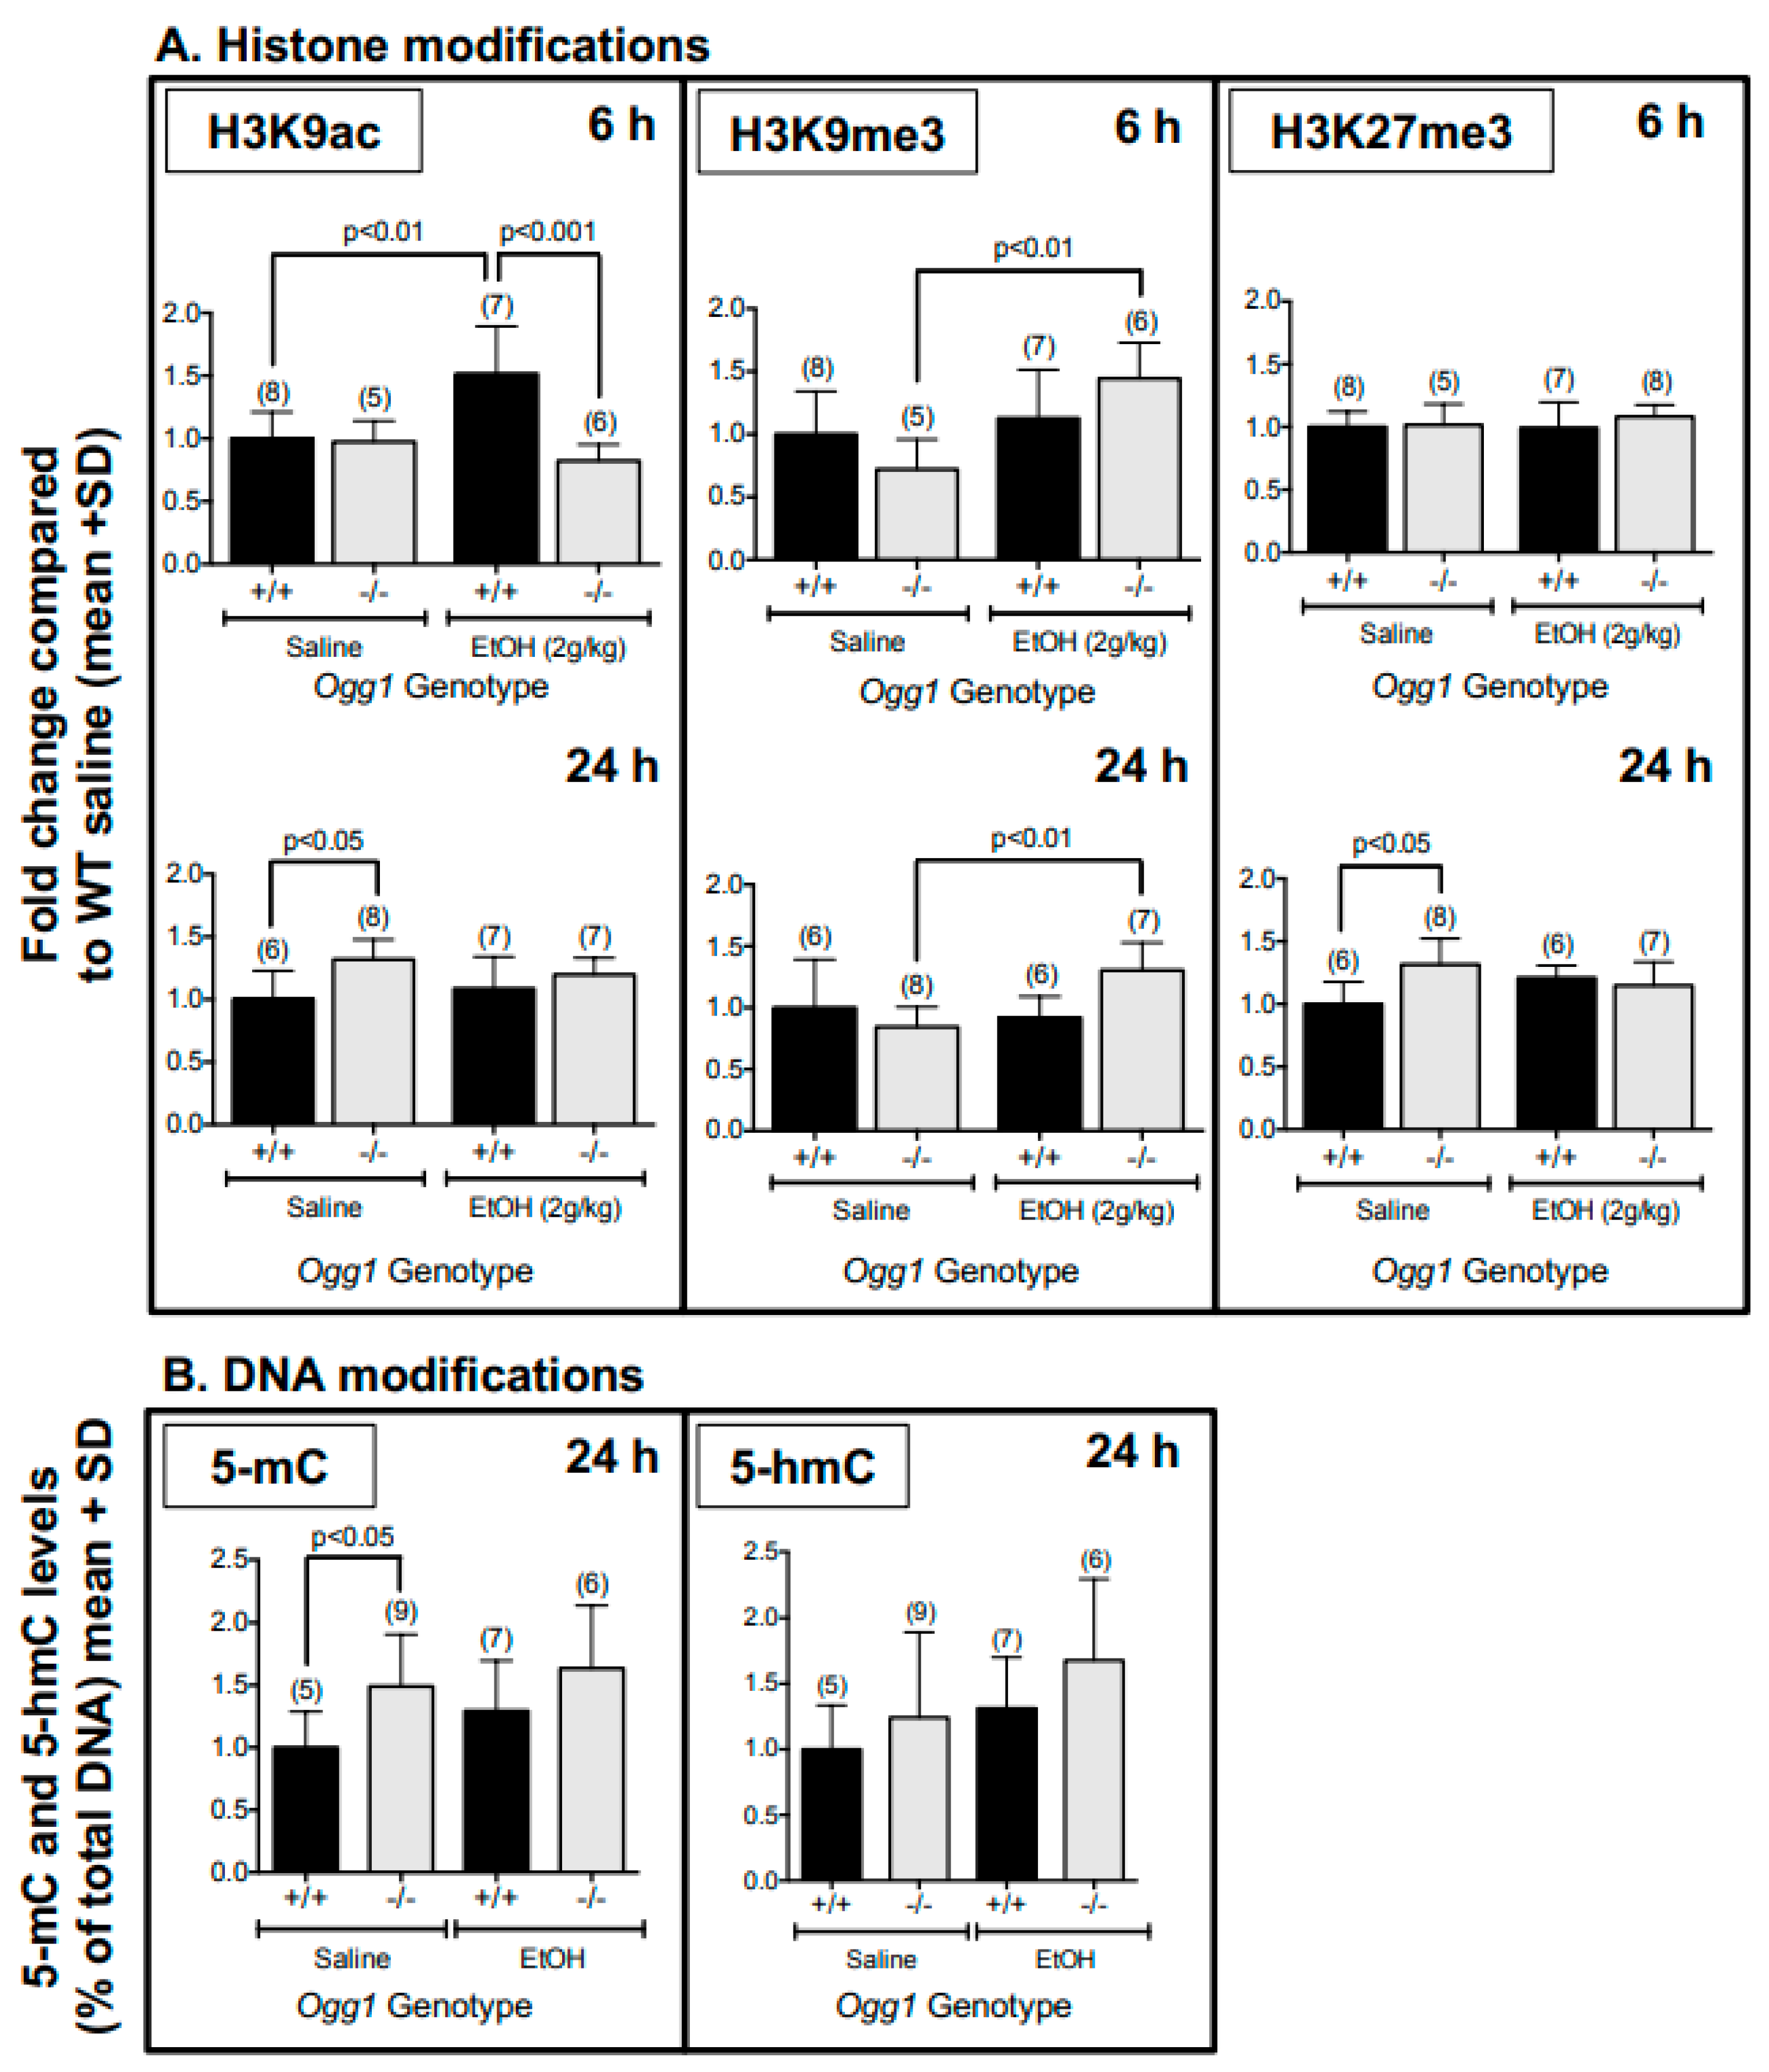
3.1. Altered Histone and DNA Modifications in Fetal Brains of Ogg1 −/− Mice Exposed In Utero to EtOH
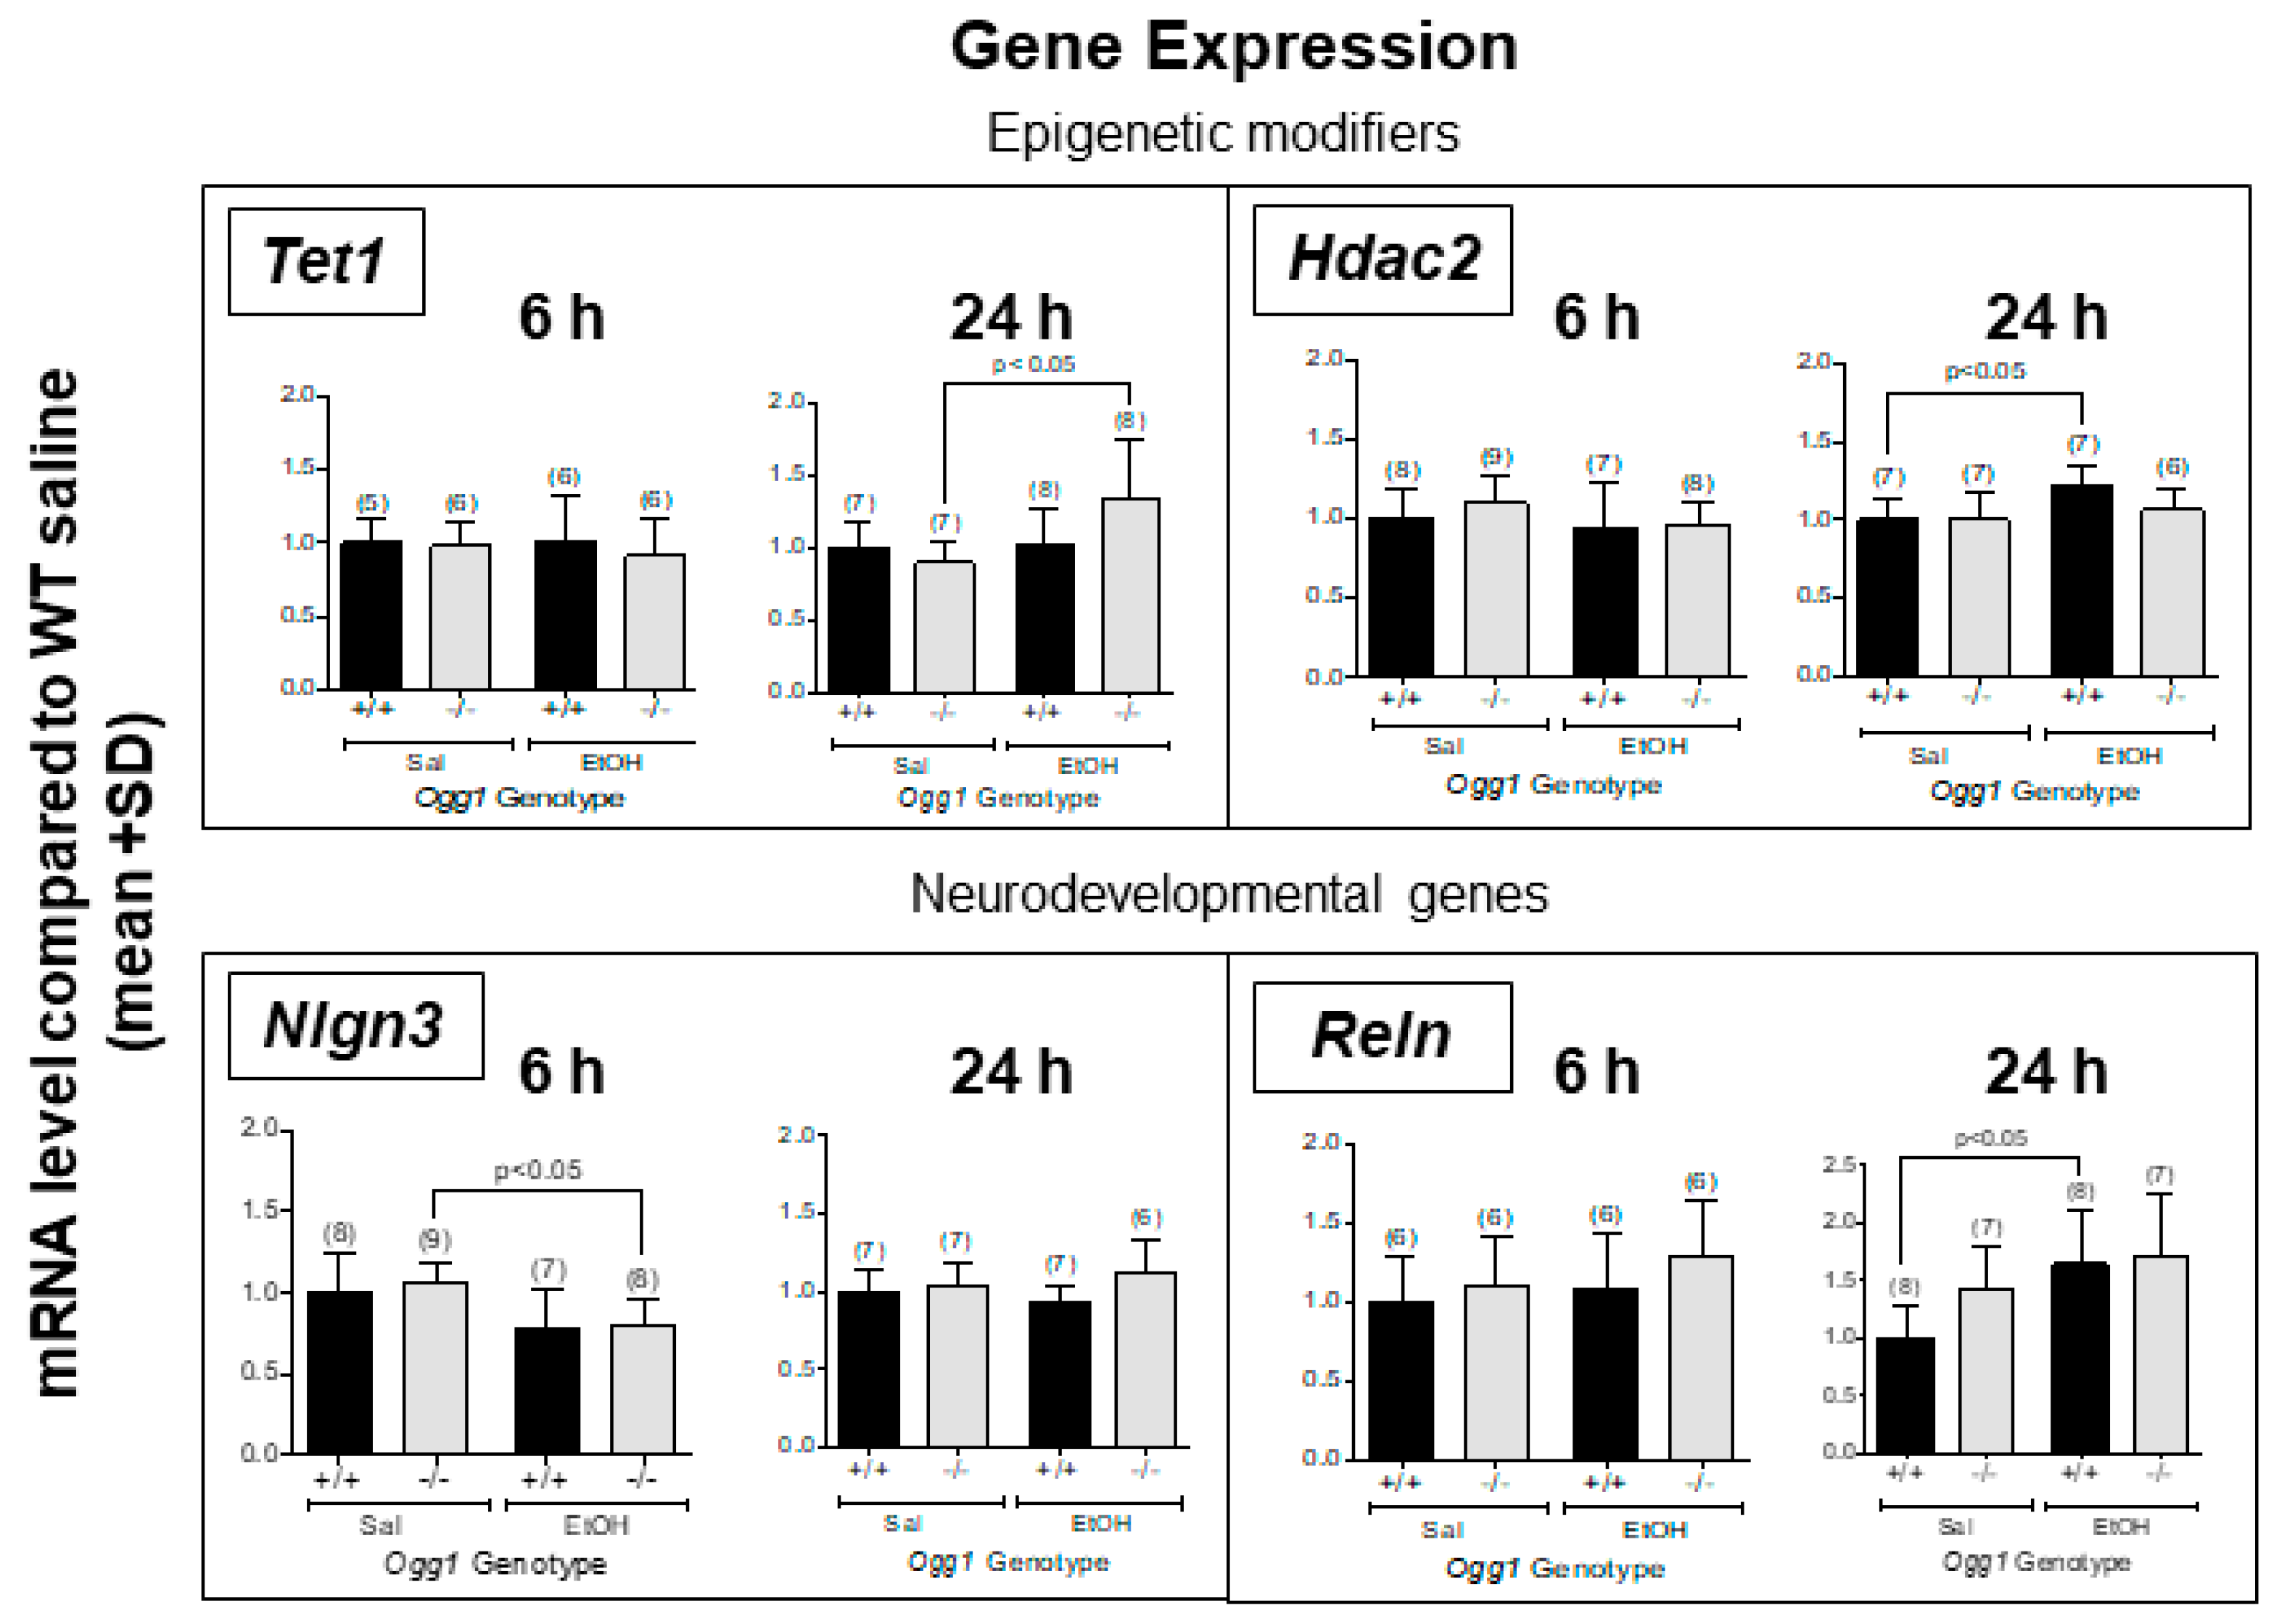
3.2. Altered Gene Expression in OGG1 Fetal Brains Exposed In Utero to EtOH
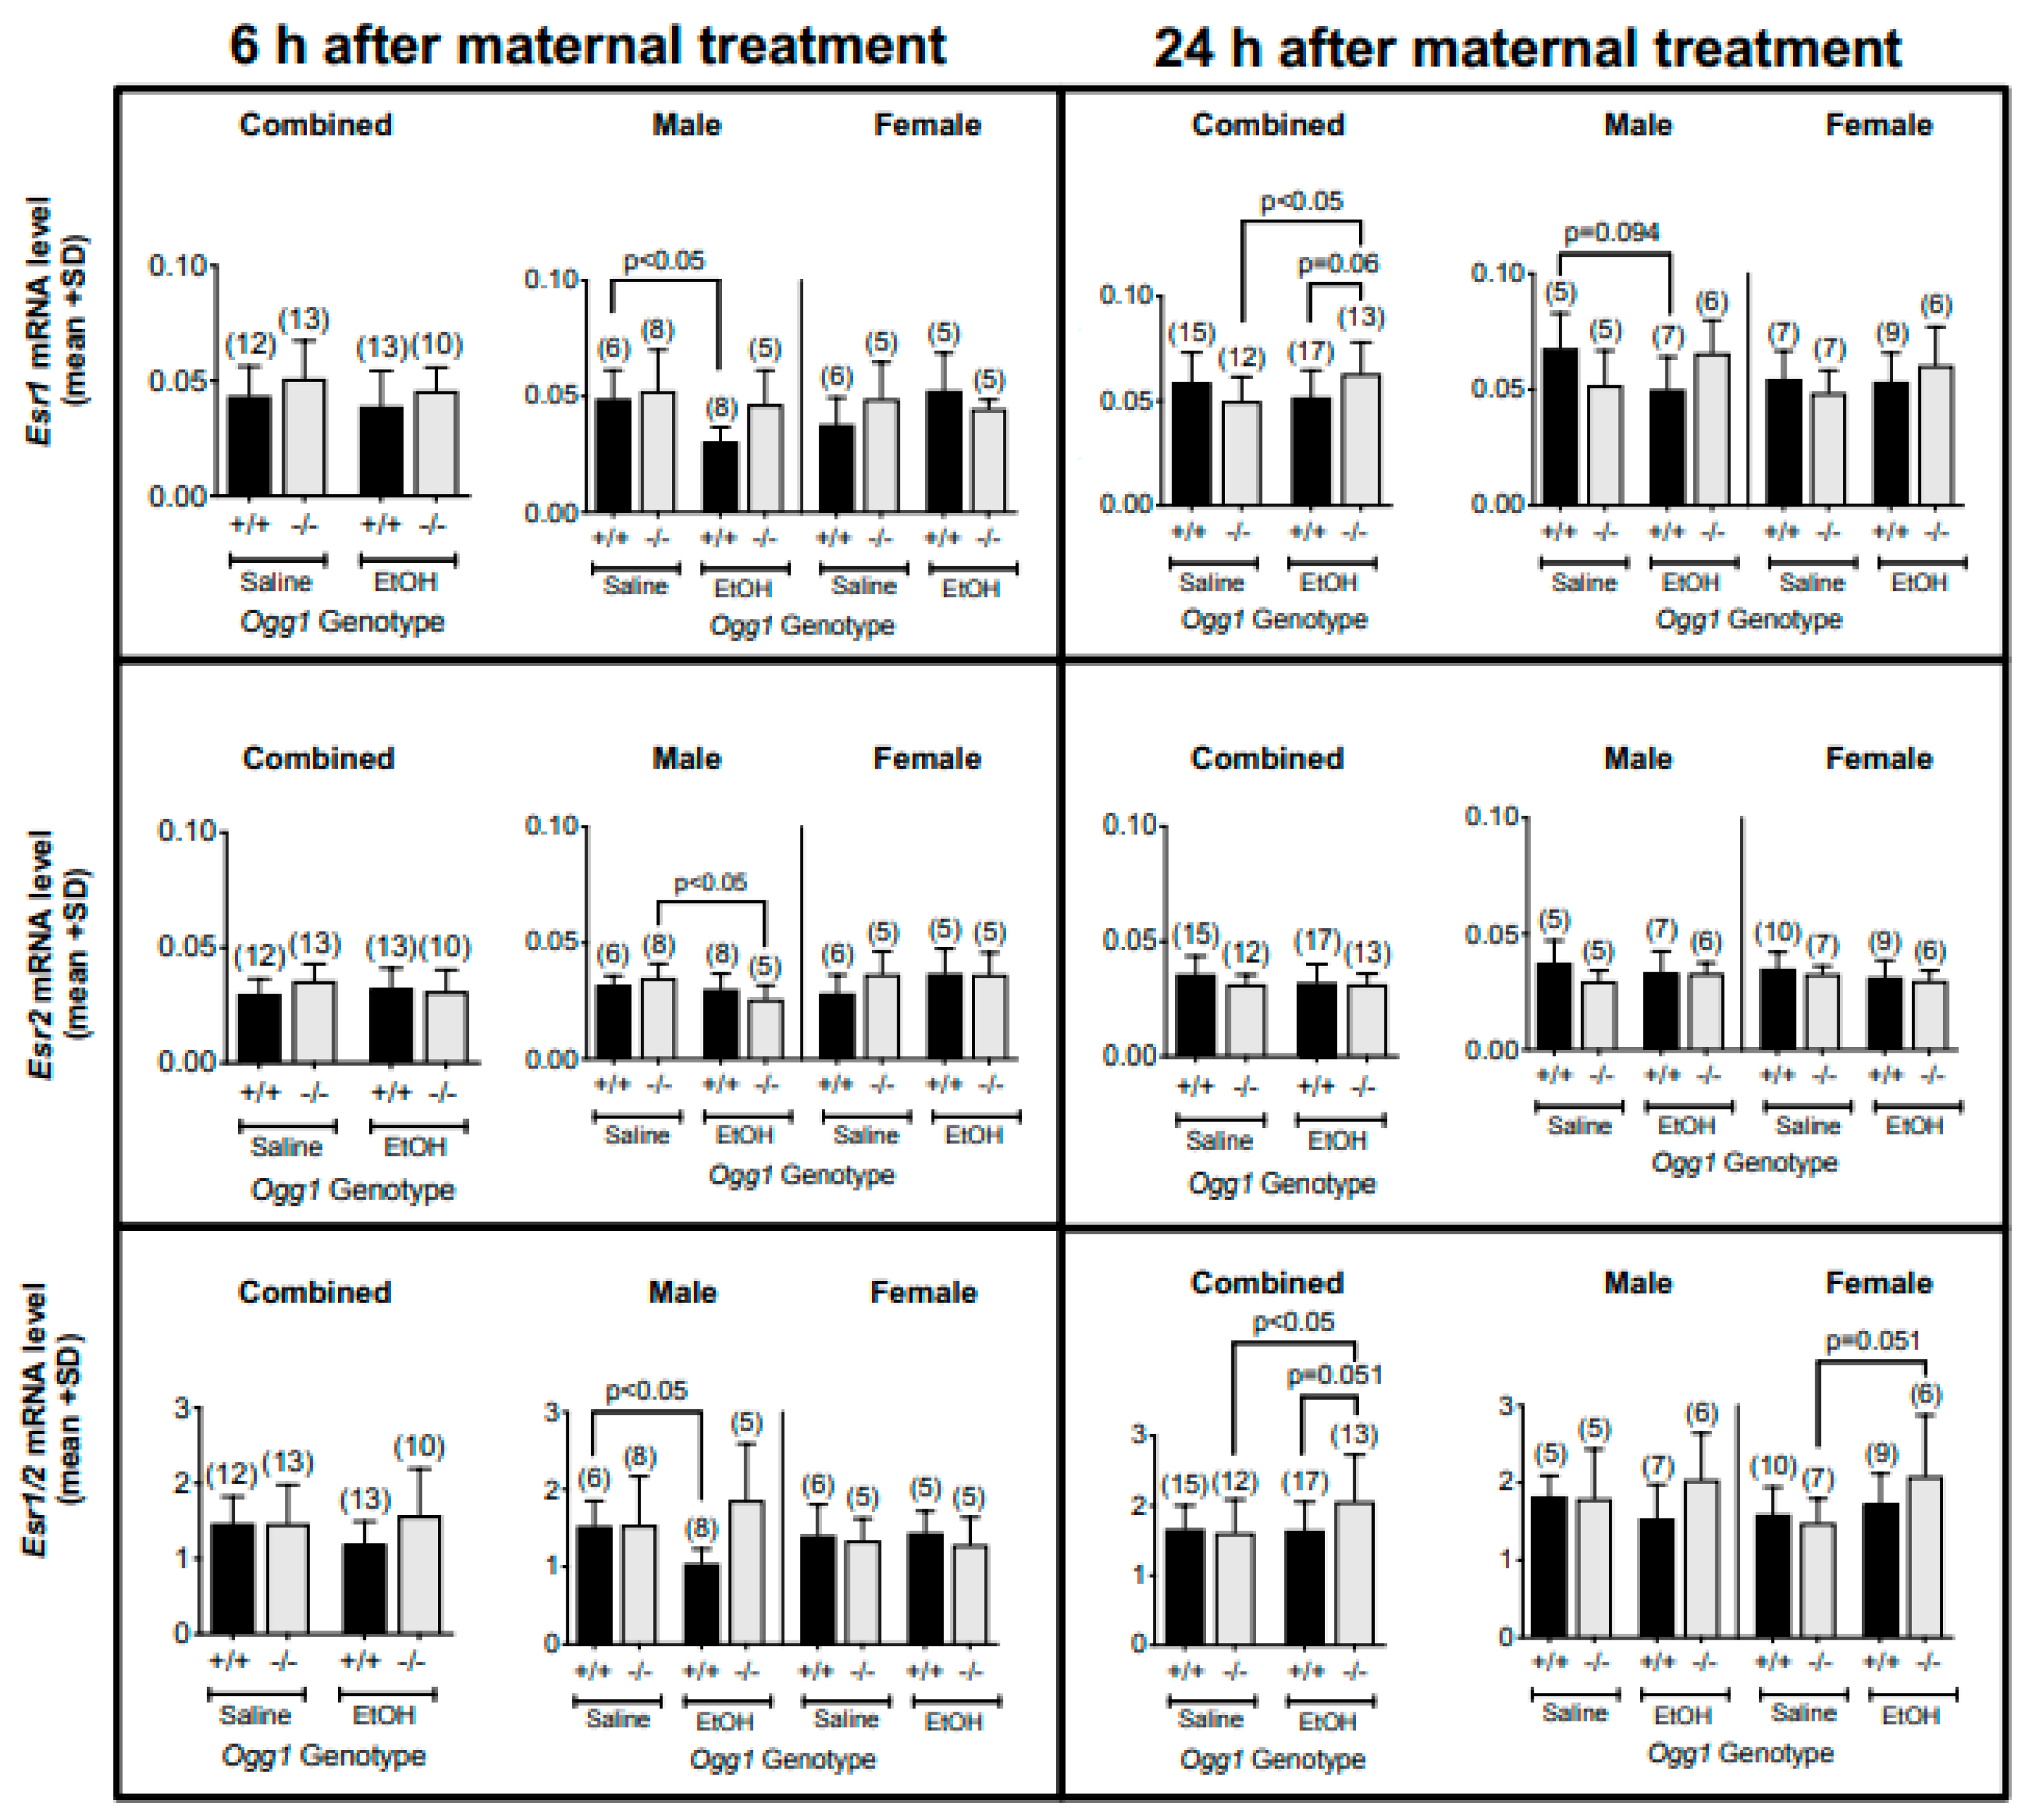
3.3. OGG1-and Sex-Dependent Differences in Esr1 and Esr2 mRNA Levels and Their Ratios in Fetal Brains Exposed In Utero to EtOH
3.4. OGG1-and Sex-Dependent Differences in ESR1 and ESR2 Protein Levels and Their Ratios in Fetal Brains Exposed In Utero to EtOH
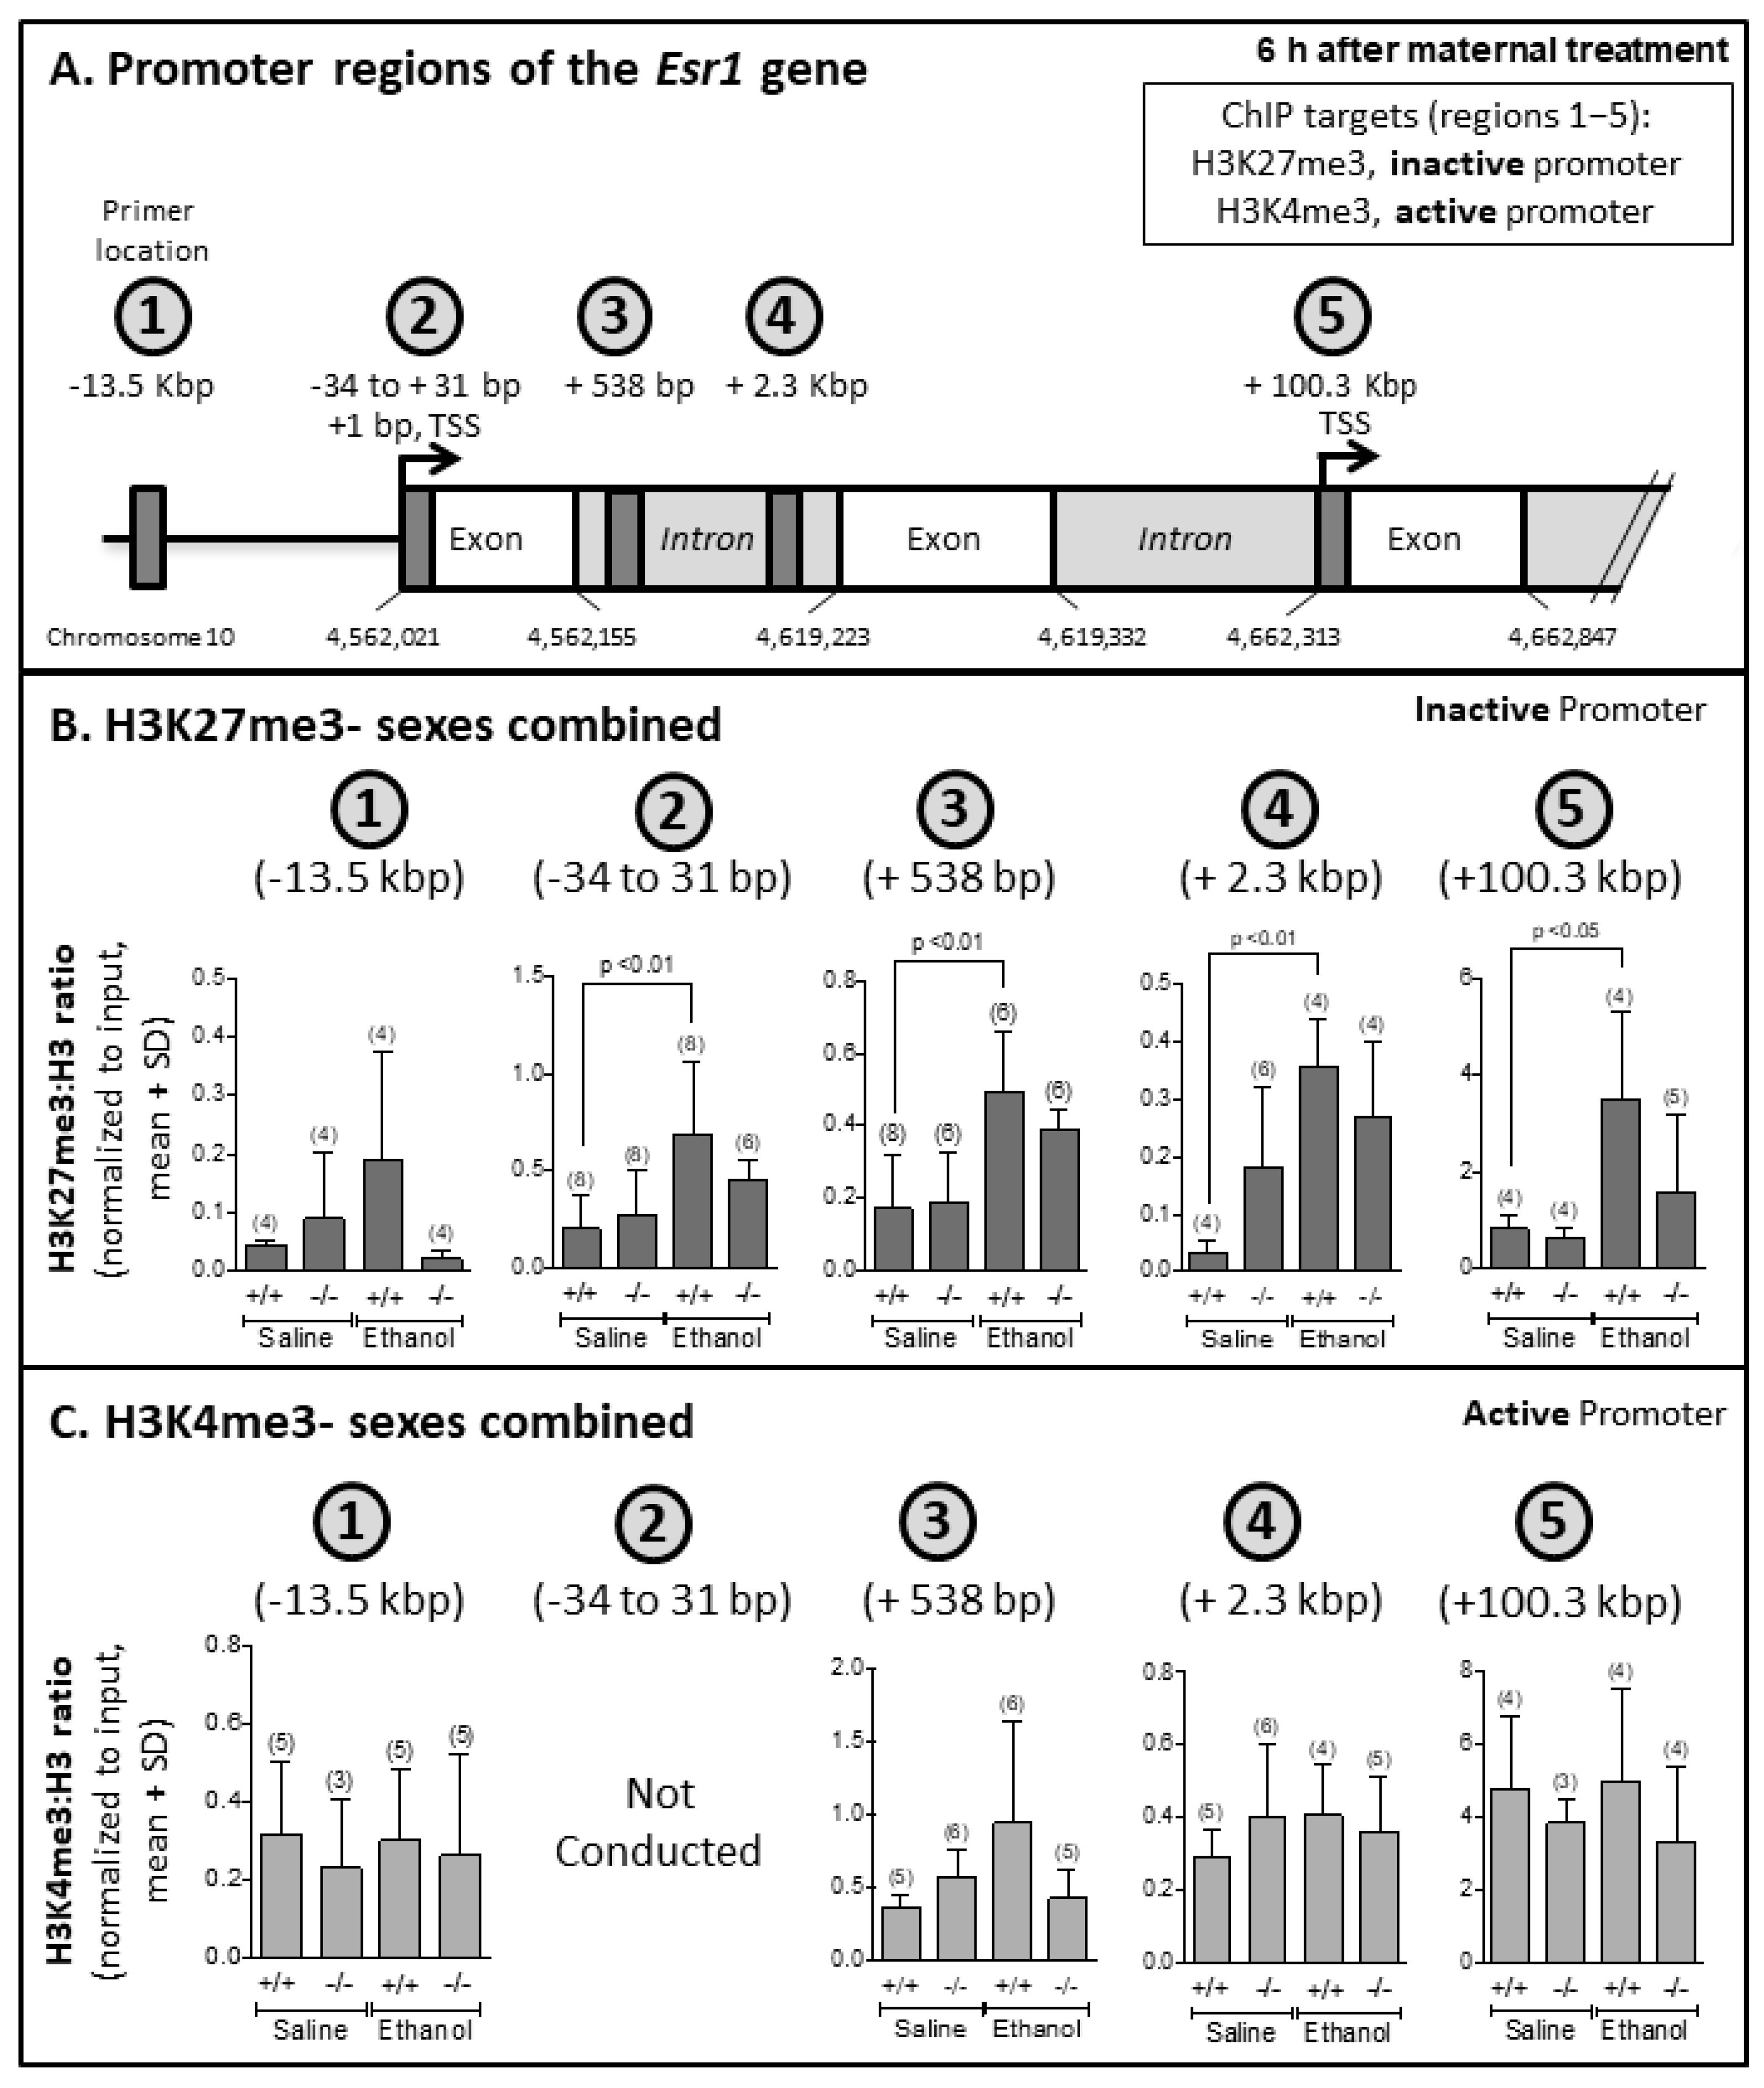
3.5. EtOH-Mediated Increased Association of H3K27me3 with Esr1 Gene in Ogg1 +/+ but Not −/− Fetal Brains
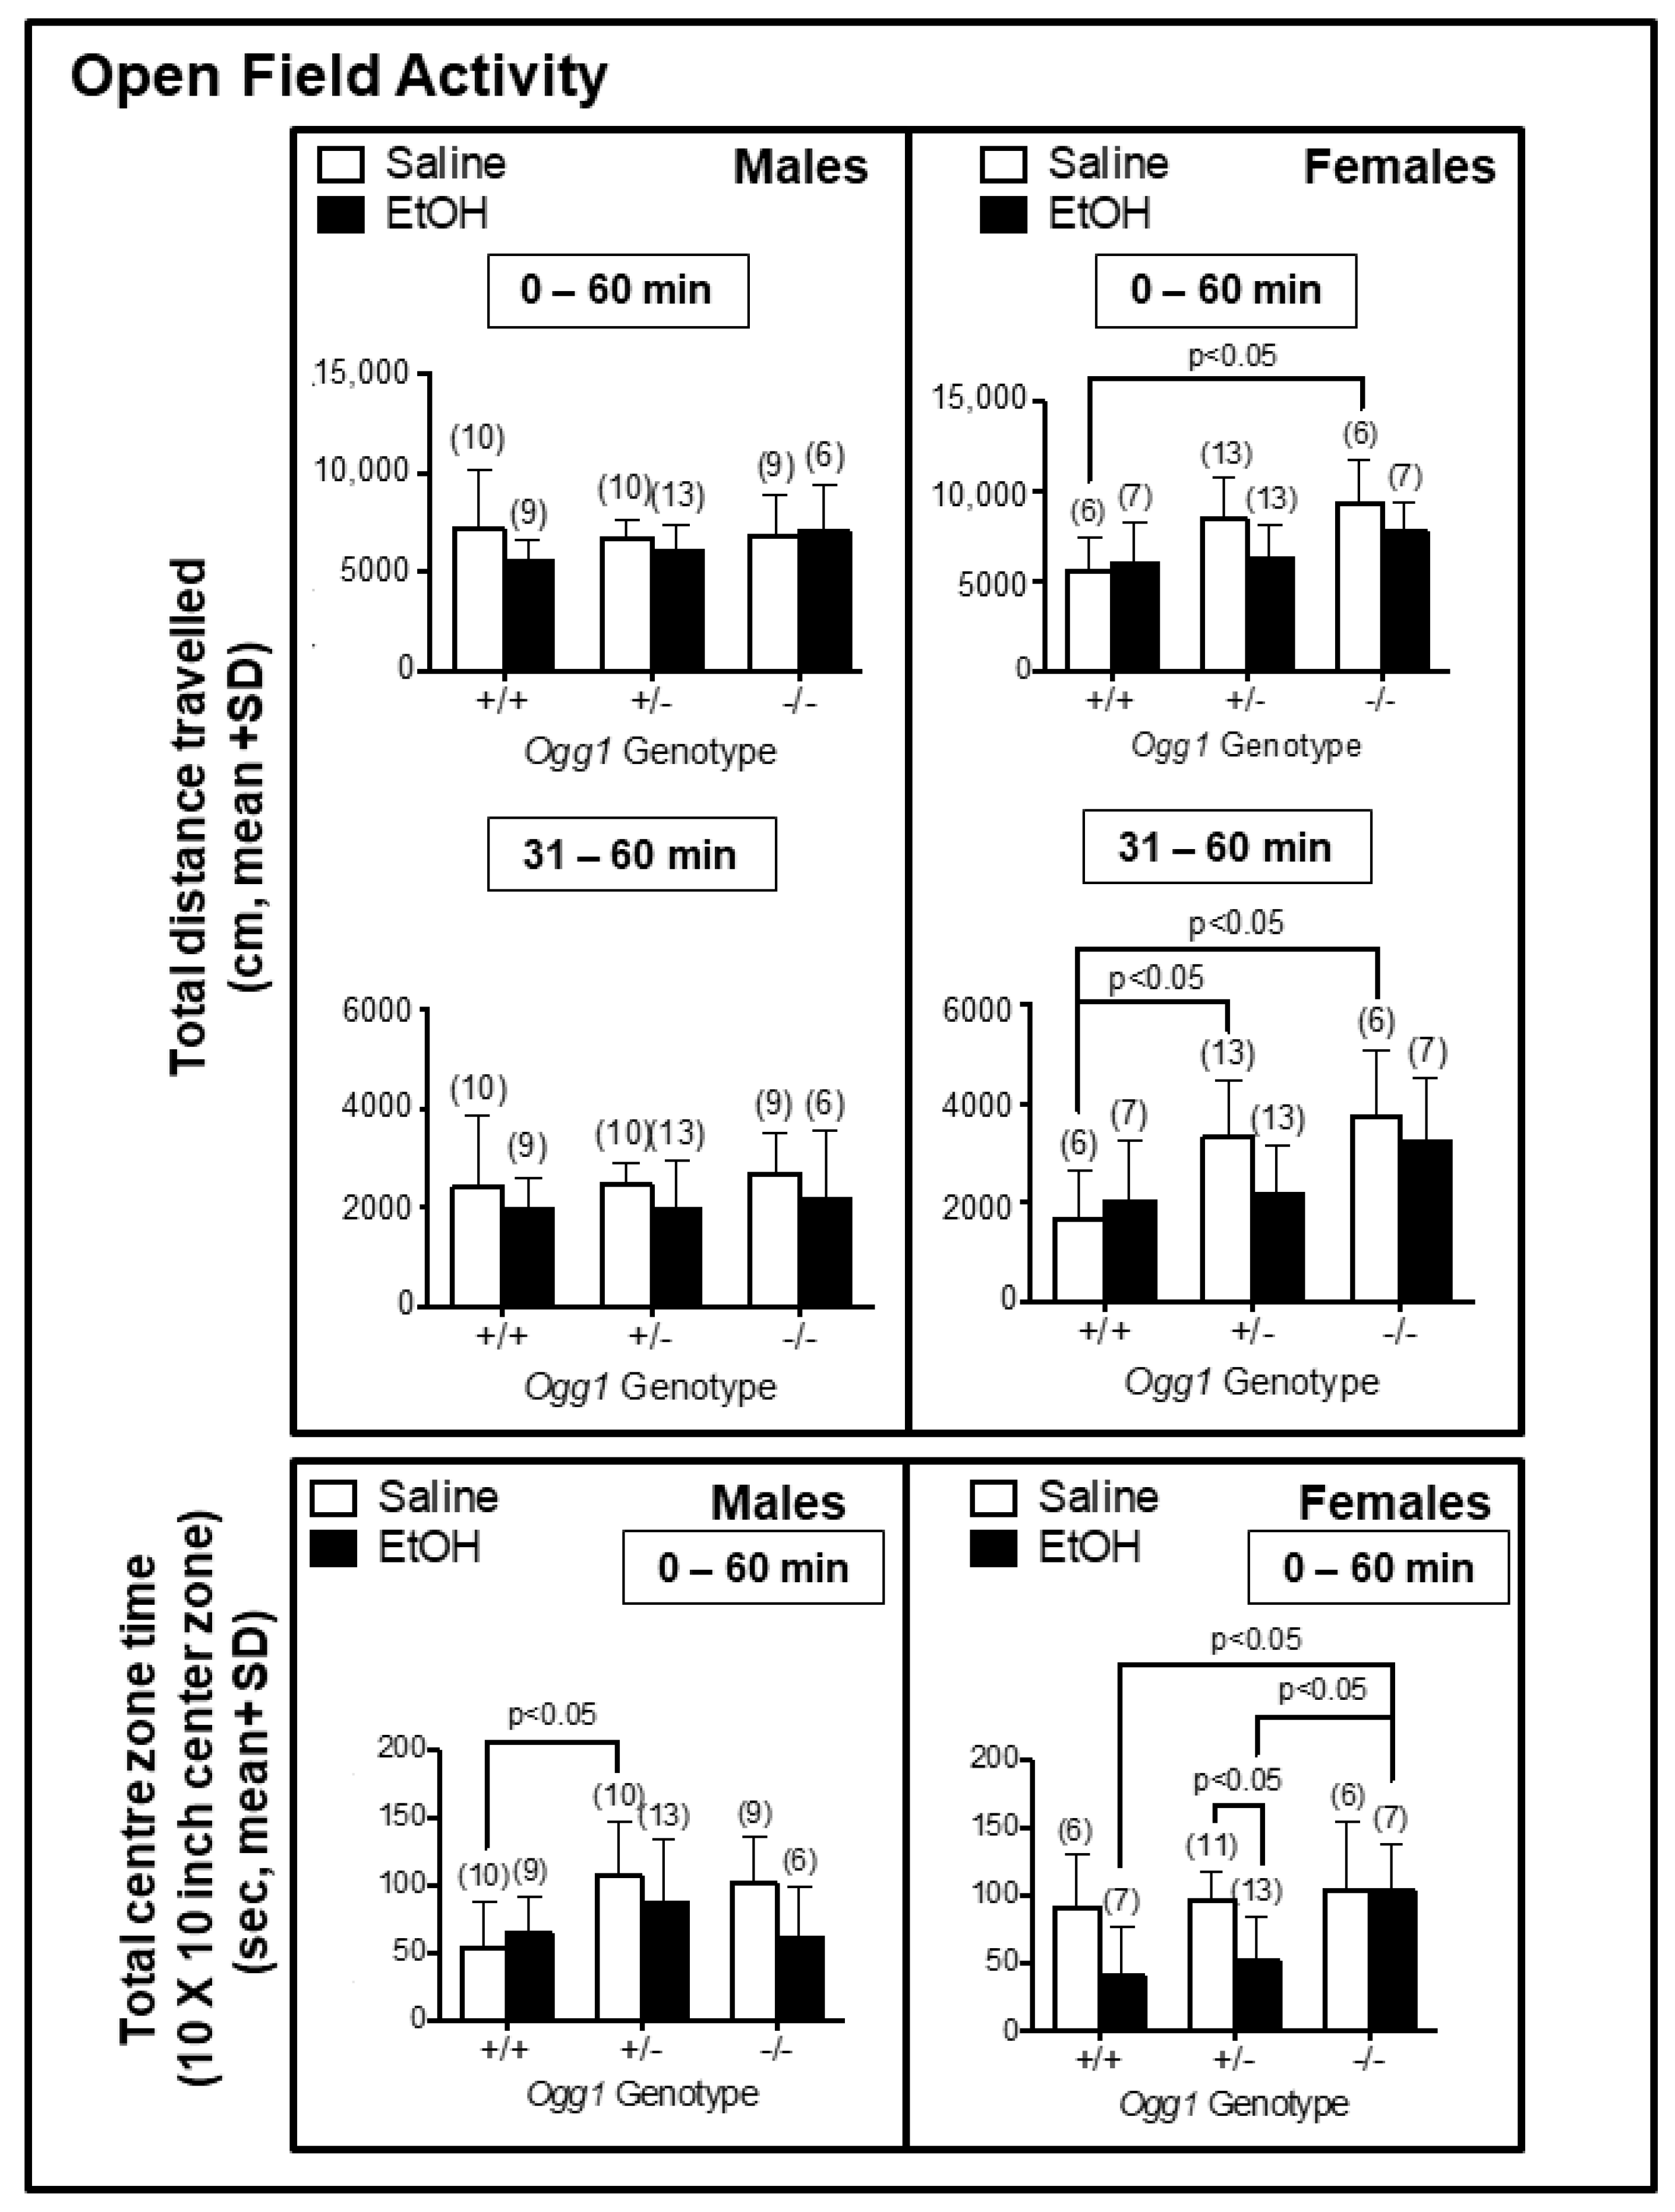
3.6. Increased Hyperactivity in Saline- but Not EtOH-Exposed Ogg1 −/− vs. +/+ Females and Ogg1- and Sex-Dependent Changes in Centre Time Spent in Saline- and EtOH-Exposed Progeny
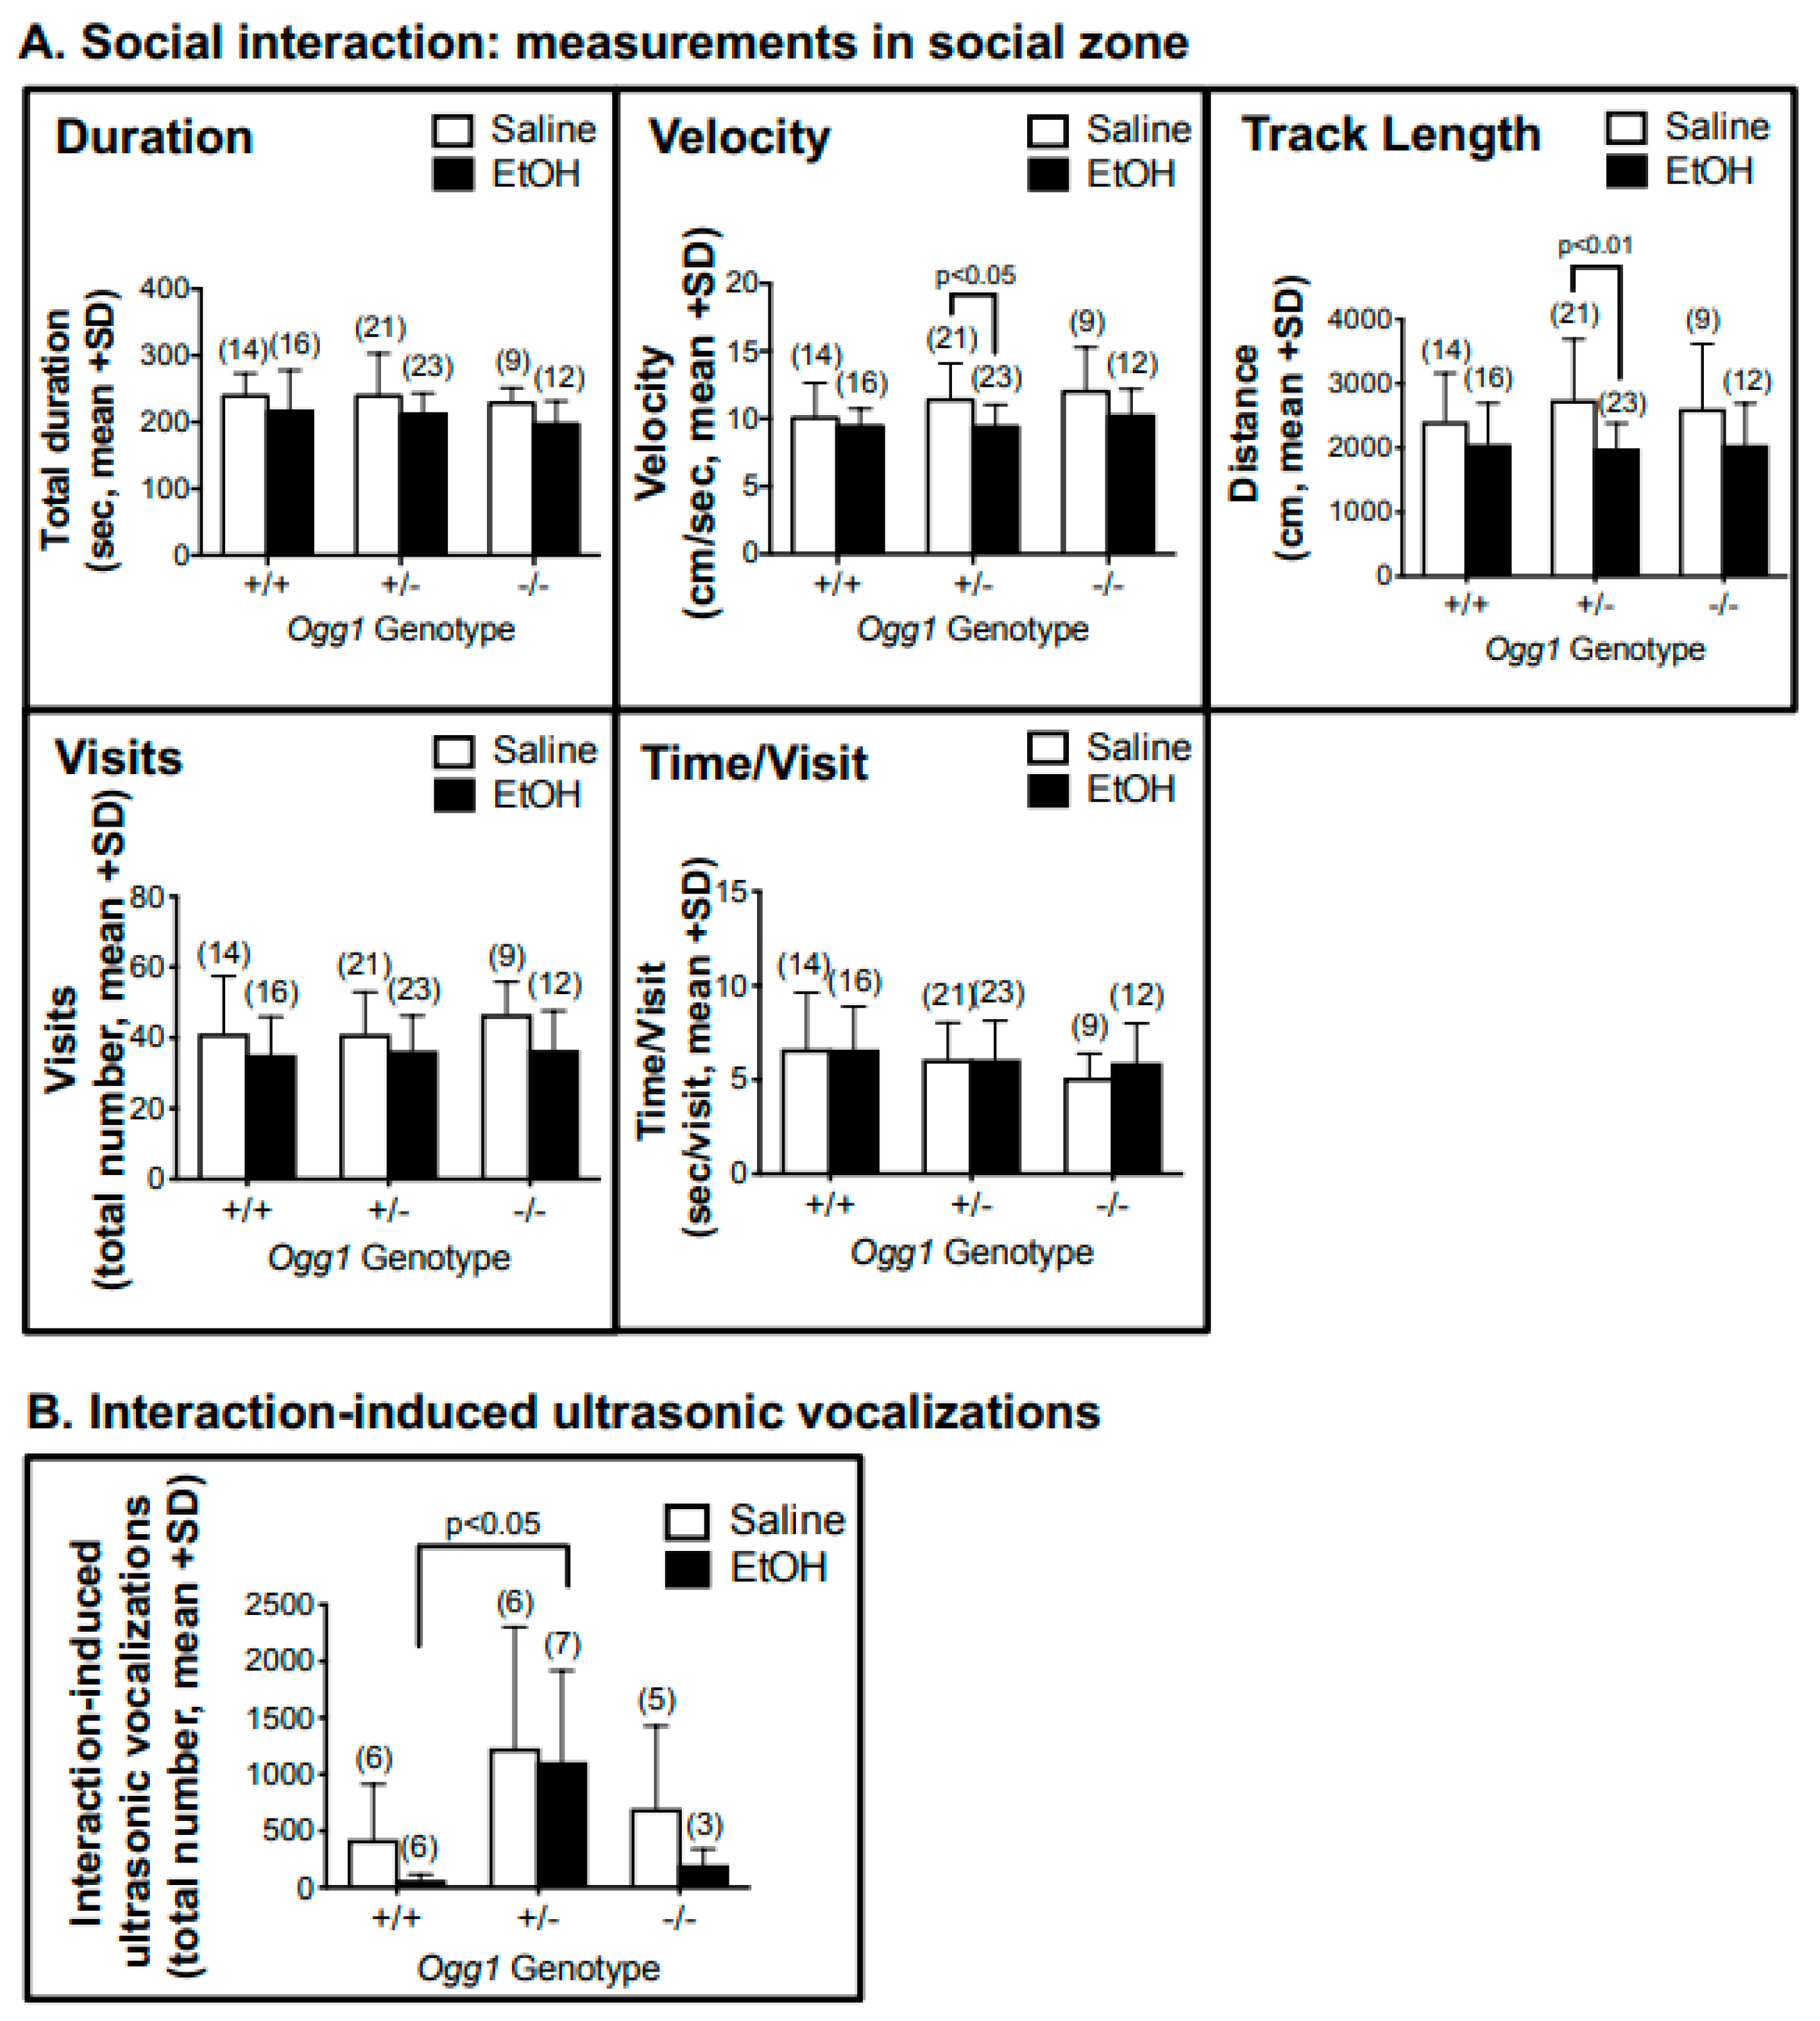
3.7. OGG1- and Sex-Dependent Effect on Social Interaction and Interaction-Induced Ultrasonic Vocalizations but Not Startle Response
3.8. Prepulse Inhibition
4. Discussion
4.1. Overview
4.2. Ethanol-Initiated Alterations in Histone Modifications and Gene Expression in Fetal Brains
4.3. Alterations in Histone Modifications, DNA Methylation and Gene Expression in Fetal Brains Exposed to Saline
4.4. OGG1- and Sex-Dependent Differences in mRNA and Protein Levels of ESR1 and ESR2 and Their Ratios in Fetal Brains, and the Association of H3K27me3 and H3K4me3 with the Esr1 Gene
4.5. OGG1- and EtOH-Dependent Effects on Behavioural Abnormalities
5. Conclusions
Supplementary Materials
Author Contributions
Funding
Institutional Review Board Statement
Informed Consent Statement
Data Availability Statement
Conflicts of Interest
References
- Klungland, A.; Laerdahl, J.K.; Rognes, T. OGG1: From structural analysis to the knockout mouse. In Oxidative Damage to Nucleic Acids; Evans, M.D., Cooke, M.S., Eds.; Springer: New York, NY, USA, 2007; pp. 67–80. [Google Scholar]
- Klungland, A.; Rosewell, I.; Hollenbach, S.; Larsen, E.; Daly, G.; Epe, B.; Seeberg, E.; Lindahl, T.; Barnes, D.E. Accumulation of premutagenic DNA lesions in mice defective in removal of oxidative base damage. Proc. Natl. Acad. Sci. USA 1999, 96, 13300–13305. [Google Scholar] [CrossRef]
- Bhatia, S.; Drake, D.M.; Miller, L.; Wells, P.G. Oxidative stress and DNA damage in the mechanism of fetal alcohol spectrum disorders. Birth Defects Res. 2019, 111, 714–748. [Google Scholar] [CrossRef]
- Wells, P.G.; Bhatia, S.; Drake, D.M.; Miller-Pinsler, L. Fetal oxidative stress mechanisms of neurodevelopmental deficits and exacerbation by ethanol and methamphetamine. Birth Defects Res. Part C Embryo Today Rev. 2016, 108, 108–130. [Google Scholar] [CrossRef]
- Wells, P.G.; Miller-Pinsler, L.; Shapiro, A.M. Impact of oxidative stress on development. In Perinatal and Prenatal Disorders; Dennery, P.A., Buonocore, G., Saugstad, O., Eds.; Book Series on Oxidative Stress in Applied Basic Research and Clinical Practice; Humana Press: Totowa, NJ, USA; Springer Science: Berlin/Heidelberg, Germany, 2014; pp. 1–37. [Google Scholar]
- Halliwell, B.; Gutteridge, L.M.C. Free Radicals in Biology and Medicine, 5th ed.; Oxford University Press: New York, NY, USA, 2015. [Google Scholar]
- Miller-Pinsler, L.; Pinto, D.J.; Wells, P.G. Oxidative DNA damage in the in utero initiation of postnatal neurodevelopmental deficits by normal fetal and ethanol-enhanced oxidative stress in oxoguanine glycosylase 1 knockout mice. Free Radic. Biol. Med. 2015, 78, 23–29. [Google Scholar] [CrossRef] [PubMed]
- Ba, X.; Boldogh, I. 8-Oxoguanine DNA glycosylase 1: Beyond repair of the oxidatively modified base lesions. Redox Biol. 2018, 14, 669–678. [Google Scholar] [CrossRef] [PubMed]
- Wang, R.; Hao, W.; Pan, L.; Boldogh, I.; Ba, X. The roles of base excision repair enzyme OGG1 in gene expression. Cell. Mol. Life Sci. 2018, 75, 3741–3750. [Google Scholar] [CrossRef] [PubMed]
- Bhatia, S.; Arslan, E.; Rodriguez-Hernandez, L.; Bonin, R.; Wells, P.G. DNA damage repair and epigenetic modification in the role of oxoguanine glycosylase 1 (OGG1) in brain development. Toxicol. Sci. 2022, 26, 93–111. [Google Scholar] [CrossRef]
- Arim, R.; Findlay, L.; Kohen, D. What Statistics Canada Survey Data Sources Are Available to Study Neurodevelopmental Conditions and Disabilities in Children and Youth? SPP Res. Pap. 2016, 9, 36. [Google Scholar]
- May, P.A.; Chambers, C.D.; Kalberg, W.O.; Zellner, J.; Feldman, H.; Buckley, D.; Kopald, D.; Hasken, J.M.; Xu, R.; Honerkamp-Smith, G.; et al. Prevalence of Fetal Alcohol Spectrum Disorders in 4 US Communities. JAMA 2018, 319, 474–482. [Google Scholar] [CrossRef]
- Lange, S.; Rehm, J.; Popova, S. Implications of Higher Than Expected Prevalence of Fetal Alcohol Spectrum Disorders. JAMA 2018, 319, 448–449. [Google Scholar] [CrossRef]
- Ungerer, M.; Knezovich, J.; Ramsay, M. In utero alcohol exposure, epigenetic changes, and their consequences. Alcohol Res. 2013, 35, 37–46. [Google Scholar]
- Mandal, C.; Halder, D.; Jung, K.H.; Chai, Y.G. Gestational Alcohol Exposure Altered DNA Methylation Status in the Developing Fetus. Int. J. Mol. Sci. 2017, 18, 1386. [Google Scholar] [CrossRef]
- Mandal, C.; Halder, D.; Jung, K.H.; Chai, Y.G. In Utero Alcohol Exposure and the Alteration of Histone Marks in the Developing Fetus: An Epigenetic Phenomenon of Maternal Drinking. Int. J. Biol. Sci. 2017, 13, 1100–1108. [Google Scholar] [CrossRef]
- Bjørge, M.D.; Hildrestrand, G.A.; Scheffler, K.; Suganthan, R.; Rolseth, V.; Kuśnierczyk, A.; Rowe, A.D.; Vågbø, C.B.; Vetlesen, S.; Eide, L.; et al. Synergistic actions of ogg1 and mutyh DNA glycosylases modulate anxiety-like behavior in mice. Cell Rep. 2015, 13, 2671–2678. [Google Scholar] [CrossRef]
- Schuettengruber, B.; Chourrout, D.; Vervoort, M.; Leblanc, B.; Cavalli, G. Genome Regulation by Polycomb and Trithorax Proteins. Cell 2007, 128, 735–745. [Google Scholar] [CrossRef]
- Bhatia, S.; Matthews, J.; Wells, P.G. Characterization of epigenetic histone activation/repression marks in sequences of genes by chromatin immunoprecipitation-quantitative polymerase chain reaction (ChIP-qPCR). Methods Mol. Biol. 2019, 1965, 389–403. [Google Scholar] [CrossRef]
- Ramkissoon, A.; Wells, P.G. Developmental role of nuclear factor-E2-related factor 2 (Nrf2) in protecting against methamphetamine fetal toxicity and postnatal neurodevelopmental deficits. Free Radic. Biol. Med. 2013, 65, 620–631. [Google Scholar] [CrossRef]
- Bhatia, S.; Yan, Y.; Ly, M.; Wells, P.G. Sex- and OGG1-dependent reversal of in utero ethanol-initiated changes in postnatal behaviour by neonatal treatment with the histone deacetylase inhibitor trichostatin A (TSA) in oxoguanine glycosylase 1 (Ogg1) knockout mice. Toxicol. Lett. 2021, 356, 121–131. [Google Scholar] [CrossRef]
- McFarlane, L.; Truong, V.; Palmer, J.S.; Wilhelm, D. Novel PCR assay for determining the genetic sex of mice. Sex. Dev. 2013, 7, 207–211. [Google Scholar] [CrossRef]
- Kim, J.-S.; Shukla, S.D. Acute in vivo effect of ethanol (binge drinking) on histone H3 modifications in rat tissues. Alcohol Alcohol. 2006, 41, 126–132. [Google Scholar] [CrossRef]
- Bookout, A.L.; Cummins, C.L.; Mangelsdorf, D.J.; Pesola, J.M.; Kramer, M.F. High-throughput real-time quantitative reverse transcription PCR. Curr. Protoc. Mol. Biol. 2005, 15, 15.18.11–15.18.21. [Google Scholar] [CrossRef]
- Wöhr, M.; Scattoni, M.L. Behavioural methods used in rodent models of autism spectrum disorders: Current standards and new developments. Behav. Brain Res. 2013, 251, 5–17. [Google Scholar] [CrossRef]
- Silverman, J.L.; Yang, M.; Lord, C.; Crawley, J.N. Behavioural phenotyping assays for mouse models of autism. Nat. Rev. Neurosci. 2010, 11, 490–502. [Google Scholar] [CrossRef]
- Panksepp, J.B.; Jochman, K.A.; Kim, J.U.; Koy, J.J.; Wilson, E.D.; Chen, Q.; Wilson, C.R.; Lahvis, G.P. Affiliative behavior, ultrasonic communication and social reward are influenced by genetic variation in adolescent mice. PLoS ONE 2007, 2, e351. [Google Scholar] [CrossRef]
- Seibenhener, M.L.; Wooten, M.C. Use of the Open Field Maze to measure locomotor and anxiety-like behavior in mice. J. Vis. Exp. 2015, e52434. [Google Scholar] [CrossRef]
- Patten, A.R.; Fontaine, C.J.; Christie, B.R. A comparison of the different animal models of fetal alcohol spectrum disorders and their use in studying complex behaviors. Front. Pediatr. 2014, 2, 93. [Google Scholar] [CrossRef]
- Schneider, M.L.; Moore, C.F.; Adkins, M.M. The effects of prenatal alcohol exposure on behavior: Rodent and primate studies. Neuropsychol. Rev. 2011, 21, 186–203. [Google Scholar] [CrossRef]
- Valsamis, B.; Schmid, S. Habituation and prepulse inhibition of acoustic startle in rodents. J. Vis. Exp. 2011, e3446. [Google Scholar] [CrossRef]
- Mons, N.; Beracochea, D. Behavioral Neuroadaptation to Alcohol: From Glucocorticoids to Histone Acetylation. Front. Psychiatry 2016, 7, 165. [Google Scholar] [CrossRef]
- Lussier, A.A.; Weinberg, J.; Kobor, M.S. Epigenetics studies of fetal alcohol spectrum disorder: Where are we now? Epigenomics 2017, 9, 291–311. [Google Scholar] [CrossRef]
- Ding, Y.; Fleming, A.M.; Burrows, C.J. Sequencing the Mouse Genome for the Oxidatively Modified Base 8-Oxo-7,8-dihydroguanine by OG-Seq. J. Am. Chem. Soc. 2017, 139, 2569–2572. [Google Scholar] [CrossRef] [PubMed]
- Poetsch, A.R.; Boulton, S.J.; Luscombe, N.M. Genomic landscape of oxidative DNA damage and repair reveals regioselective protection from mutagenesis. Genome Biol. 2018, 19, 215. [Google Scholar] [CrossRef] [PubMed]
- Vandesompele, J.; De Preter, K.; Pattyn, F.; Poppe, B.; Van Roy, N.; De Paepe, A.; Speleman, F. Accurate normalization of real-time quantitative RT-PCR data by geometric averaging of multiple internal control genes. Genome Biol. 2002, 3, 0034.1–0034.11. [Google Scholar] [CrossRef] [PubMed]
- Wu, X.; Zhang, Y. TET-mediated active DNA demethylation: Mechanism, function and beyond. Nat. Rev. Genet. 2017, 18, 517–534. [Google Scholar] [CrossRef] [PubMed]
- Lee, G.H.; D’Arcangelo, G. New Insights into Reelin-Mediated Signaling Pathways. Front. Cell. Neurosci. 2016, 10, 122. [Google Scholar] [CrossRef] [PubMed]
- Costa, E.; Chen, Y.; Davis, J.; Dong, E.; Noh, J.S.; Tremolizzo, L.; Veldic, M.; Grayson, D.R.; Guidotti, A. REELIN and schizophrenia: A disease at the interface of the genome and the epigenome. Mol. Interv. 2002, 2, 47–57. [Google Scholar] [CrossRef]
- De Rubeis, S.; He, X.; Goldberg, A.P.; Poultney, C.S.; Samocha, K.; Cicek, A.E.; Kou, Y.; Liu, L.; Fromer, M.; Walker, S.; et al. Synaptic, transcriptional and chromatin genes disrupted in autism. Nature 2014, 515, 209–215. [Google Scholar] [CrossRef] [PubMed]
- Wang, D.; Enck, J.; Howell, B.W.; Olson, E.C. Ethanol Exposure Transiently Elevates but Persistently Inhibits Tyrosine Kinase Activity and Impairs the Growth of the Nascent Apical Dendrite. Mol. Neurobiol. 2019, 56, 5749–5762. [Google Scholar] [CrossRef] [PubMed]
- Südhof, T.C. Neuroligins and neurexins link synaptic function to cognitive disease. Nature 2008, 455, 903–911. [Google Scholar] [CrossRef]
- Liu, Y.; Balaraman, Y.; Wang, G.; Nephew, K.P.; Zhou, F.C. Alcohol exposure alters DNA methylation profiles in mouse embryos at early neurulation. Epigenetics 2009, 4, 500–511. [Google Scholar] [CrossRef]
- Tabuchi, K.; Blundell, J.; Etherton, M.R.; Hammer, R.E.; Liu, X.; Powell, C.M.; Südhof, T.C. A neuroligin-3 mutation implicated in autism increases inhibitory synaptic transmission in mice. Science 2007, 318, 71–76. [Google Scholar] [CrossRef]
- Zhou, X.; Zhuang, Z.; Wang, W.; He, L.; Wu, H.; Cao, Y.; Pan, F.; Zhao, J.; Hu, Z.; Sekhar, C.; et al. OGG1 is essential in oxidative stress induced DNA demethylation. Cell Signal. 2016, 28, 1163–1171. [Google Scholar] [CrossRef]
- Perillo, B.; Ombra, M.N.; Bertoni, A.; Cuozzo, C.; Sacchetti, S.; Sasso, A.; Chiariotti, L.; Malorni, A.; Abbondanza, C.; Avvedimento, E.V. DNA oxidation as triggered by H3K9me2 demethylation drives estrogen-induced gene expression. Science 2008, 319, 202–206. [Google Scholar] [CrossRef] [PubMed]
- Bean, L.A.; Ianov, L.; Foster, T.C. Estrogen receptors, the hippocampus, and memory. Neuroscientist 2014, 20, 534–545. [Google Scholar] [CrossRef] [PubMed]
- Cho, J.; Yu, N.K.; Choi, J.H.; Sim, S.E.; Kang, S.J.; Kwak, C.; Lee, S.W.; Kim, J.l.; Choi, D.I.; Kim, V.N.; et al. Multiple repressive mechanisms in the hippocampus during memory formation. Science 2015, 350, 82–87. [Google Scholar] [CrossRef]
- Xia, L.; Huang, W.; Bellani, M.; Seidman, M.M.; Wu, K.; Fan, D.; Nie, Y.; Cai, Y.; Zhang, Y.W.; Yu, L.-R.; et al. CHD4 Has Oncogenic Functions in Initiating and Maintaining Epigenetic Suppression of Multiple Tumor Suppressor Genes. Cancer Cell 2017, 31, 653–668. [Google Scholar] [CrossRef]
- Cardozo-Pelaez, F.; Sanchez-Contreras, M.; Nevin, A.B. Ogg1 null mice exhibit age-associated loss of the nigrostriatal pathway and increased sensitivity to MPTP. Neurochem. Int. 2012, 61, 721–730. [Google Scholar] [CrossRef] [PubMed]
- Nagy, Z.M.; Glaser, H.D. Open-field behavior of C57BL/6J mice: Effect of illumination, age, and number of test days. Psychon. Sci. 1970, 19, 143–145. [Google Scholar] [CrossRef]
- Cullen, C.L.; Burne, T.H.J.; Lavidis, N.A.; Moritz, K.M. Low Dose Prenatal Ethanol Exposure Induces Anxiety-Like Behaviour and Alters Dendritic Morphology in the Basolateral Amygdala of Rat Offspring. PLoS ONE 2013, 8, e54924. [Google Scholar] [CrossRef]
- Abbott, C.W.; Kozanian, O.O.; Kanaan, J.; Wendel, K.M.; Huffman, K.J. The impact of prenatal ethanol exposure on neuroanatomical and behavioral development in mice. Alcohol. Clin. Exp. Res. 2016, 40, 122–133. [Google Scholar] [CrossRef]
- Ogawa, S.; Chan, J.; Gustafsson, J.-A.k.; Korach, K.S.; Pfaff, D.W. Estrogen Increases Locomotor Activity in Mice through Estrogen Receptor α: Specificity for the Type of Activity. Endocrinology 2003, 144, 230–239. [Google Scholar] [CrossRef]
- Ogawa, S.; Chester, A.E.; Hewitt, S.C.; Walker, V.R.; Gustafsson, J.A.; Smithies, O.; Korach, K.S.; Pfaff, D.W. Abolition of male sexual behaviors in mice lacking estrogen receptors alpha and beta (alpha beta ERKO). Proc. Natl. Acad. Sci. USA 2000, 97, 14737–14741. [Google Scholar] [CrossRef] [PubMed]
- Choleris, E.; Ogawa, S.; Kavaliers, M.; Gustafsson, J.Å.; Korach, K.S.; Muglia, L.J.; Pfaff, D.W. Involvement of estrogen receptor α, β and oxytocin in social discrimination: A detailed behavioral analysis with knockout female mice. Genes Brain Behav. 2006, 5, 528–539. [Google Scholar] [CrossRef]
- Imwalle, D.B.; Scordalakes, E.M.; Rissman, E.F. Estrogen Receptor α Influences Socially Motivated Behaviors. Horm. Behav. 2002, 42, 484–491. [Google Scholar] [CrossRef] [PubMed]
- Garcia, A.N.; Bezner, K.; Depena, C.; Yin, W.; Gore, A.C. The effects of long-term estradiol treatment on social behavior and gene expression in adult female rats. Horm. Behav. 2017, 87, 145–154. [Google Scholar] [CrossRef] [PubMed]


| Gene/Protein | Time Post-Exposure (h) | Saline-Exposed | EtOH-Exposed (Compared to Saline-Exposed Progeny of the Same Ogg1 Genotype, Unless Otherwise Stated) |
|---|---|---|---|
| Epigenetic Marks (Figure 2) | |||
| H3K9ac | 6 | - | ↑ Ogg1 +/+ ↓ Ogg1 −/− (vs. EtOH-exposed +/+) |
| 24 | ↑ Ogg1 −/− | - | |
| H3K9me3 | 6 | - | ↑ Ogg1 −/− |
| 24 | - | ↑ Ogg1 −/− | |
| H3K27me3 | 6 | - | - |
| 24 | ↑ Ogg1 −/− | - | |
| 5-mC | 24 | ↑ Ogg1 −/− | - |
| 5-hmC | 24 | - | - |
| Gene expression (Figure 3) | |||
| Tet1 | 6 | - | - |
| 24 | - | ↑ Ogg1 −/− | |
| Hdac2 | 6 | - | - |
| 24 | - | ↑ Ogg1 +/+ | |
| Nlgn3 | 6 | - | ↓ Ogg1 −/− |
| 24 | - | - | |
| Reln | 6 | - | - |
| 24 | - | ↑ Ogg1 +/+ | |
| Estrogen mRNA levels (Figure 4) | |||
| Esr1 | 6 | - | ↓ Ogg1 +/+ (M) |
| 24 | - | ↑ Ogg1 −/− (combined sexes) ↑ Ogg1 −/− (combined sexes, vs. EtOH-exposed +/+) 1 | |
| Esr2 | 6 | - | ↓ Ogg1−/− (M) |
| 24 | - | - | |
| Esr1/2 ratio | 6 | - | ↓ Ogg1 +/+ (M) |
| 24 | - | ↑ Ogg1 −/− (combined sexes) ↑ Ogg1 −/− (F) (vs. EtOH-exposed +/+) 1 | |
| Estrogen Protein levels 2 (Figure 5) | |||
| ESR1 | 24 | - | - |
| ESR2 | 24 | - | ↓ Ogg1 −/− (M) ↓ Ogg1 −/− (M) (vs. EtOH-exposed +/+) 1 |
| ESR1/2 ratio | 24 | - | - |
| Esr1 loci select epigenetic marks (Figure 6) | |||
| H3K27me3 | 6 | - | ↑ Ogg1 +/+ (regions 2, 3, 4, 5) |
| H3K4me3 | 6 | - | - |
| Behaviour (Figure 7 and Figure 8) | |||
| Open field activity (total distance) | 6 weeks | ↑ Ogg1 +/− (F) ↑ Ogg1 −/− (F) | |
| Open field activity (centre zone time) | 6 weeks | ↑ Ogg1 +/− (M) | ↑ Ogg1 −/− (F) (vs. EtOH-exposed +/+ and +/−) ↓ Ogg1 +/− (F) |
| Social interaction (velocity) | 8 weeks | - | ↓ Ogg1 +/− (combined sexes) |
| Social interaction (track length) | 8 weeks | - | ↓ Ogg1 +/− (combined sexes) |
| Female-induced USV | 4–5 months | - | ↑ Ogg1 +/− (compared to EtOH-exposed +/+) |
Disclaimer/Publisher’s Note: The statements, opinions and data contained in all publications are solely those of the individual author(s) and contributor(s) and not of MDPI and/or the editor(s). MDPI and/or the editor(s) disclaim responsibility for any injury to people or property resulting from any ideas, methods, instructions or products referred to in the content. |
© 2023 by the authors. Licensee MDPI, Basel, Switzerland. This article is an open access article distributed under the terms and conditions of the Creative Commons Attribution (CC BY) license (https://creativecommons.org/licenses/by/4.0/).
Share and Cite
Bhatia, S.; Bodenstein, D.; Cheng, A.P.; Wells, P.G. Altered Epigenetic Marks and Gene Expression in Fetal Brain, and Postnatal Behavioural Disorders, Following Prenatal Exposure of Ogg1 Knockout Mice to Saline or Ethanol. Cells 2023, 12, 2308. https://doi.org/10.3390/cells12182308
Bhatia S, Bodenstein D, Cheng AP, Wells PG. Altered Epigenetic Marks and Gene Expression in Fetal Brain, and Postnatal Behavioural Disorders, Following Prenatal Exposure of Ogg1 Knockout Mice to Saline or Ethanol. Cells. 2023; 12(18):2308. https://doi.org/10.3390/cells12182308
Chicago/Turabian StyleBhatia, Shama, David Bodenstein, Ashley P. Cheng, and Peter G. Wells. 2023. "Altered Epigenetic Marks and Gene Expression in Fetal Brain, and Postnatal Behavioural Disorders, Following Prenatal Exposure of Ogg1 Knockout Mice to Saline or Ethanol" Cells 12, no. 18: 2308. https://doi.org/10.3390/cells12182308
APA StyleBhatia, S., Bodenstein, D., Cheng, A. P., & Wells, P. G. (2023). Altered Epigenetic Marks and Gene Expression in Fetal Brain, and Postnatal Behavioural Disorders, Following Prenatal Exposure of Ogg1 Knockout Mice to Saline or Ethanol. Cells, 12(18), 2308. https://doi.org/10.3390/cells12182308