
Effects of Traumatic Brain Injury on the Gut Microbiota Composition and Serum Amino Acid Profile in Rats


 , , , ,
  ,
,  , add
Show full author list
, add
Show full author list
Abstract
:1. Introduction
2. Materials and Methods
2.1. Rats
2.2. Traumatic-Brain-Injury Model
2.3. Magnetic Resonance-Imaging Studies of the Brain Damage
2.4. Neurological Deficit Assessment
2.4.1. Limb Placement Test
2.4.2. Cylinder Test
2.4.3. Assessment of Neurological-Deficit Dynamics
2.5. Sampling
2.6. Tandem Mass Spectrometry
2.7. Assessment of Serum Markers of Brain Injury
2.8. 16S rRNA Sequencing (V3–V4 Regions)
2.8.1. Fecal DNA Extraction and Amplification
- 98 °C for 30 s;
- 30 cycles: 98 °C for 15 s;
- 58 °C for 15 s;
- 72 °C for 15 s;
- 72 °C for 1 min;
- Storage at 4 °C.
2.8.2. 16S rRNA Sequencing
2.9. Bioinformatic Analysis
2.10. Statistical Analysis
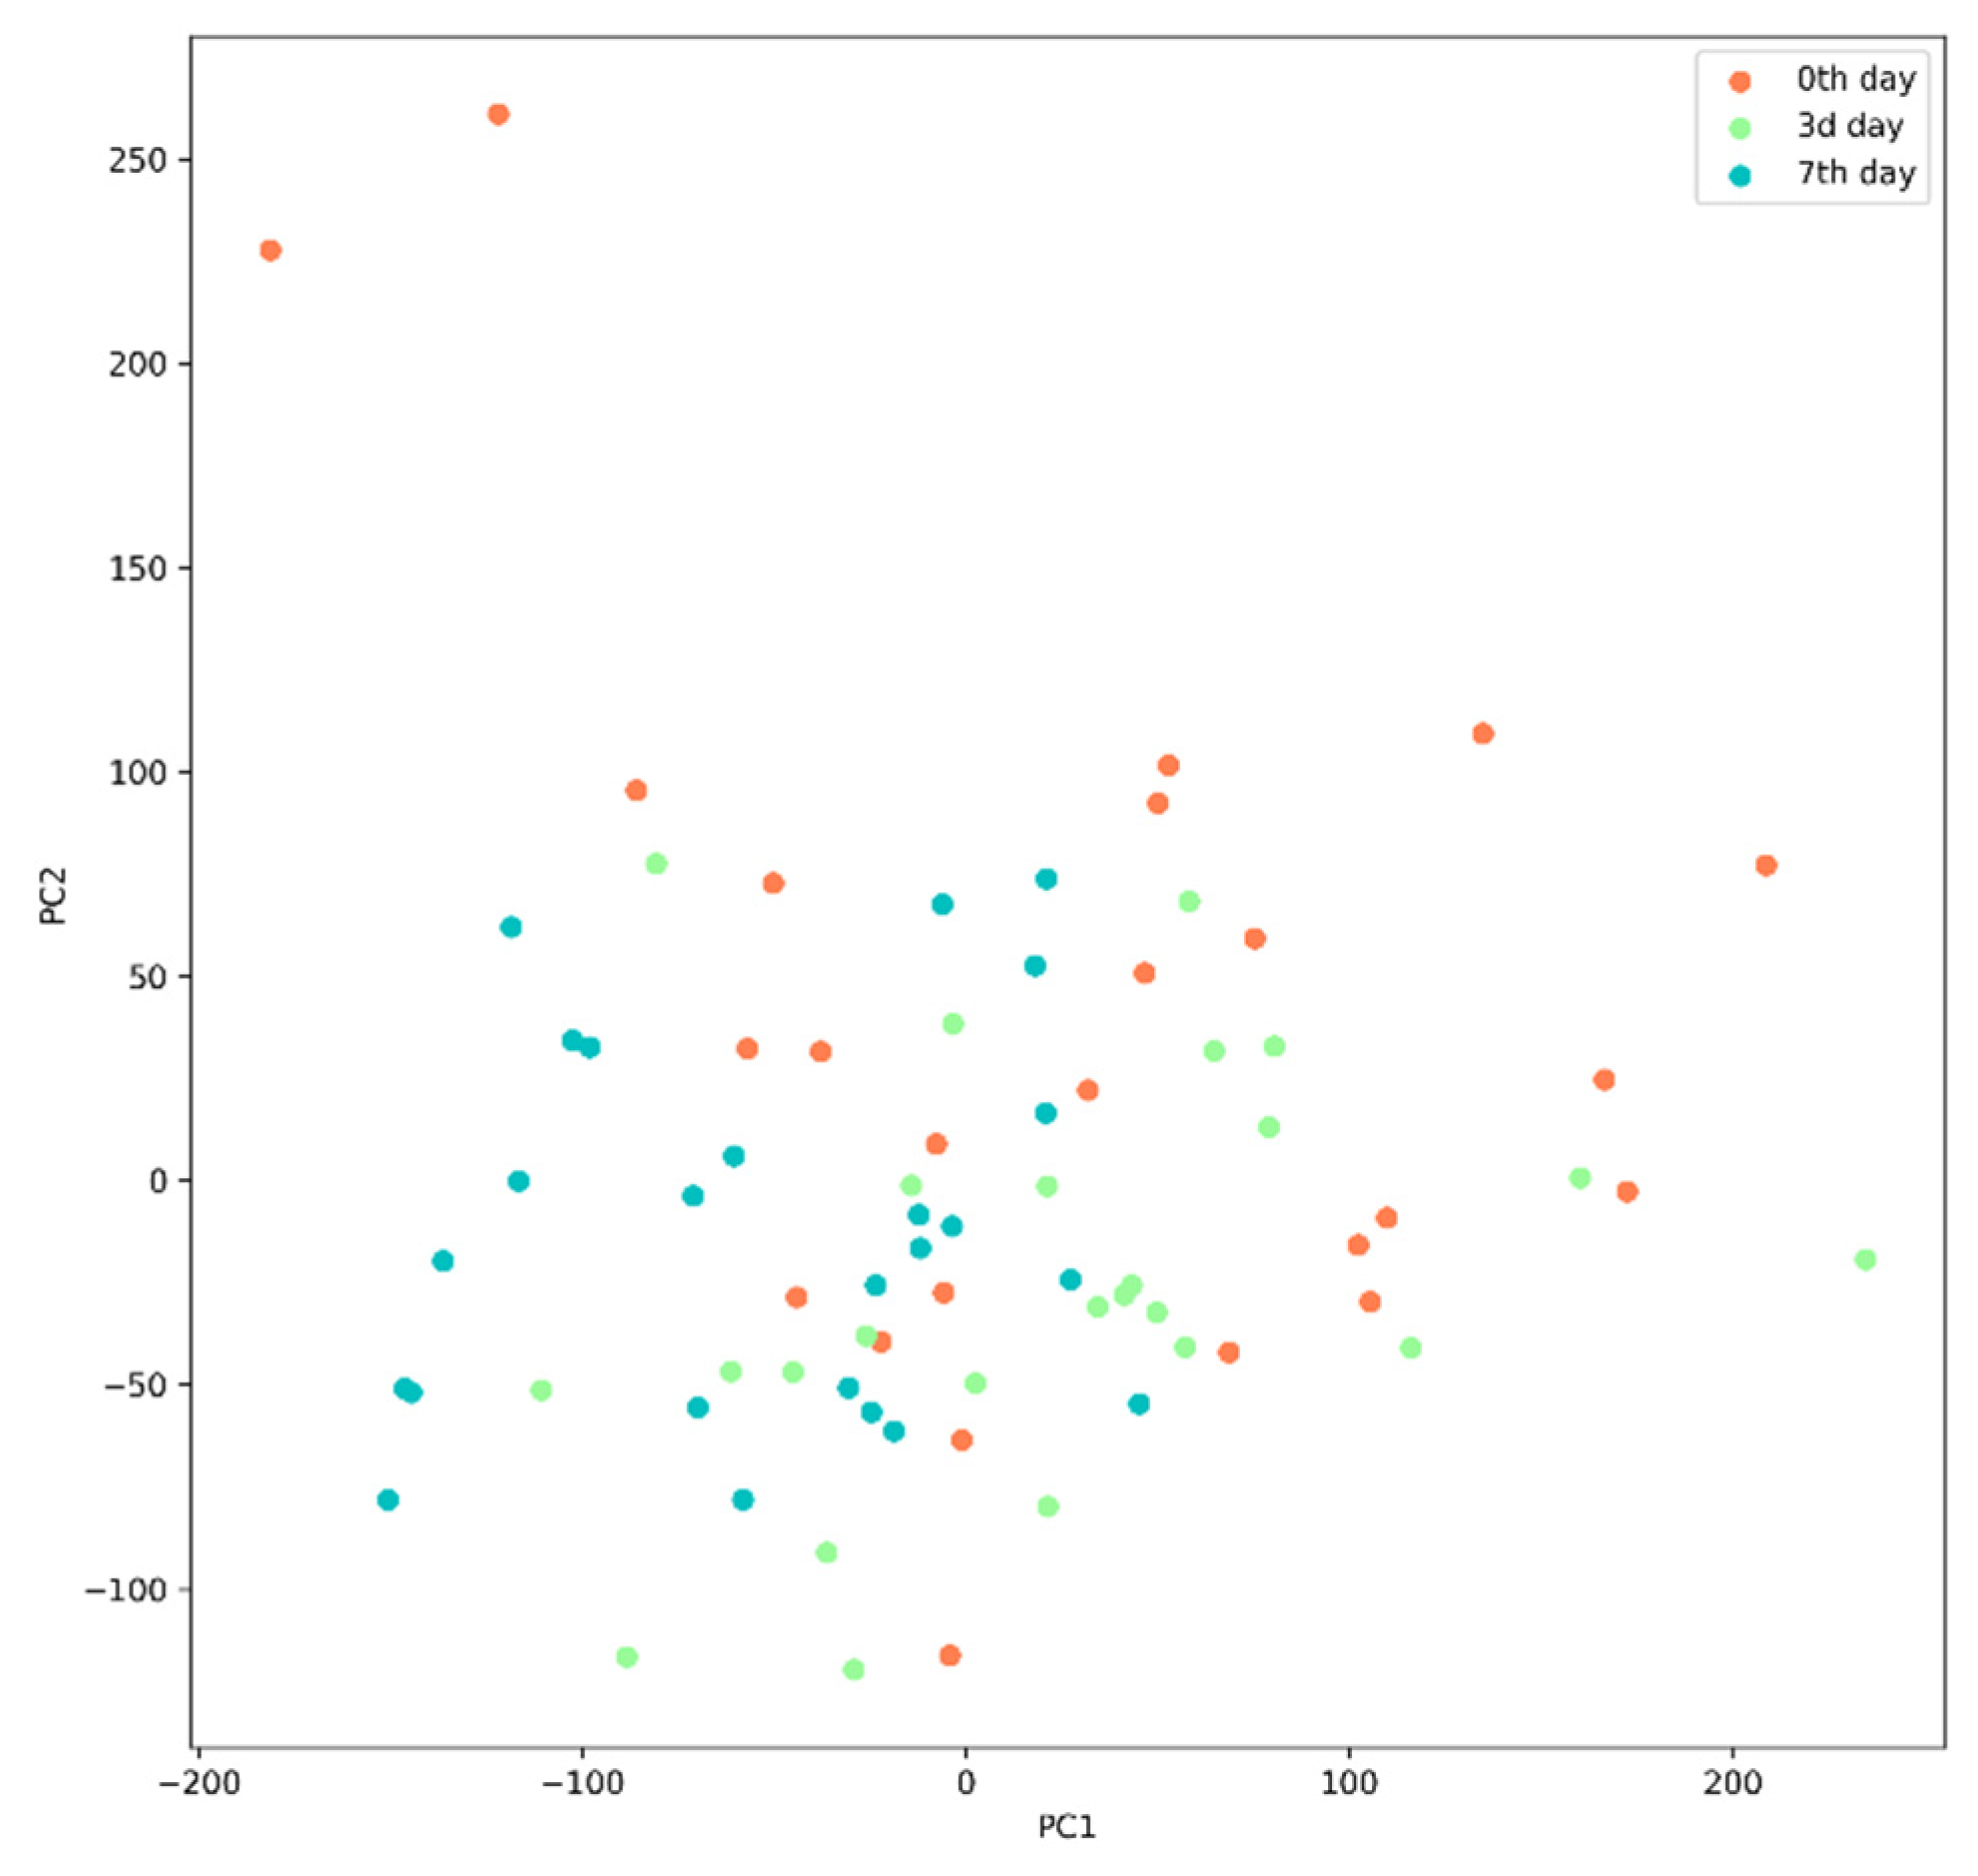
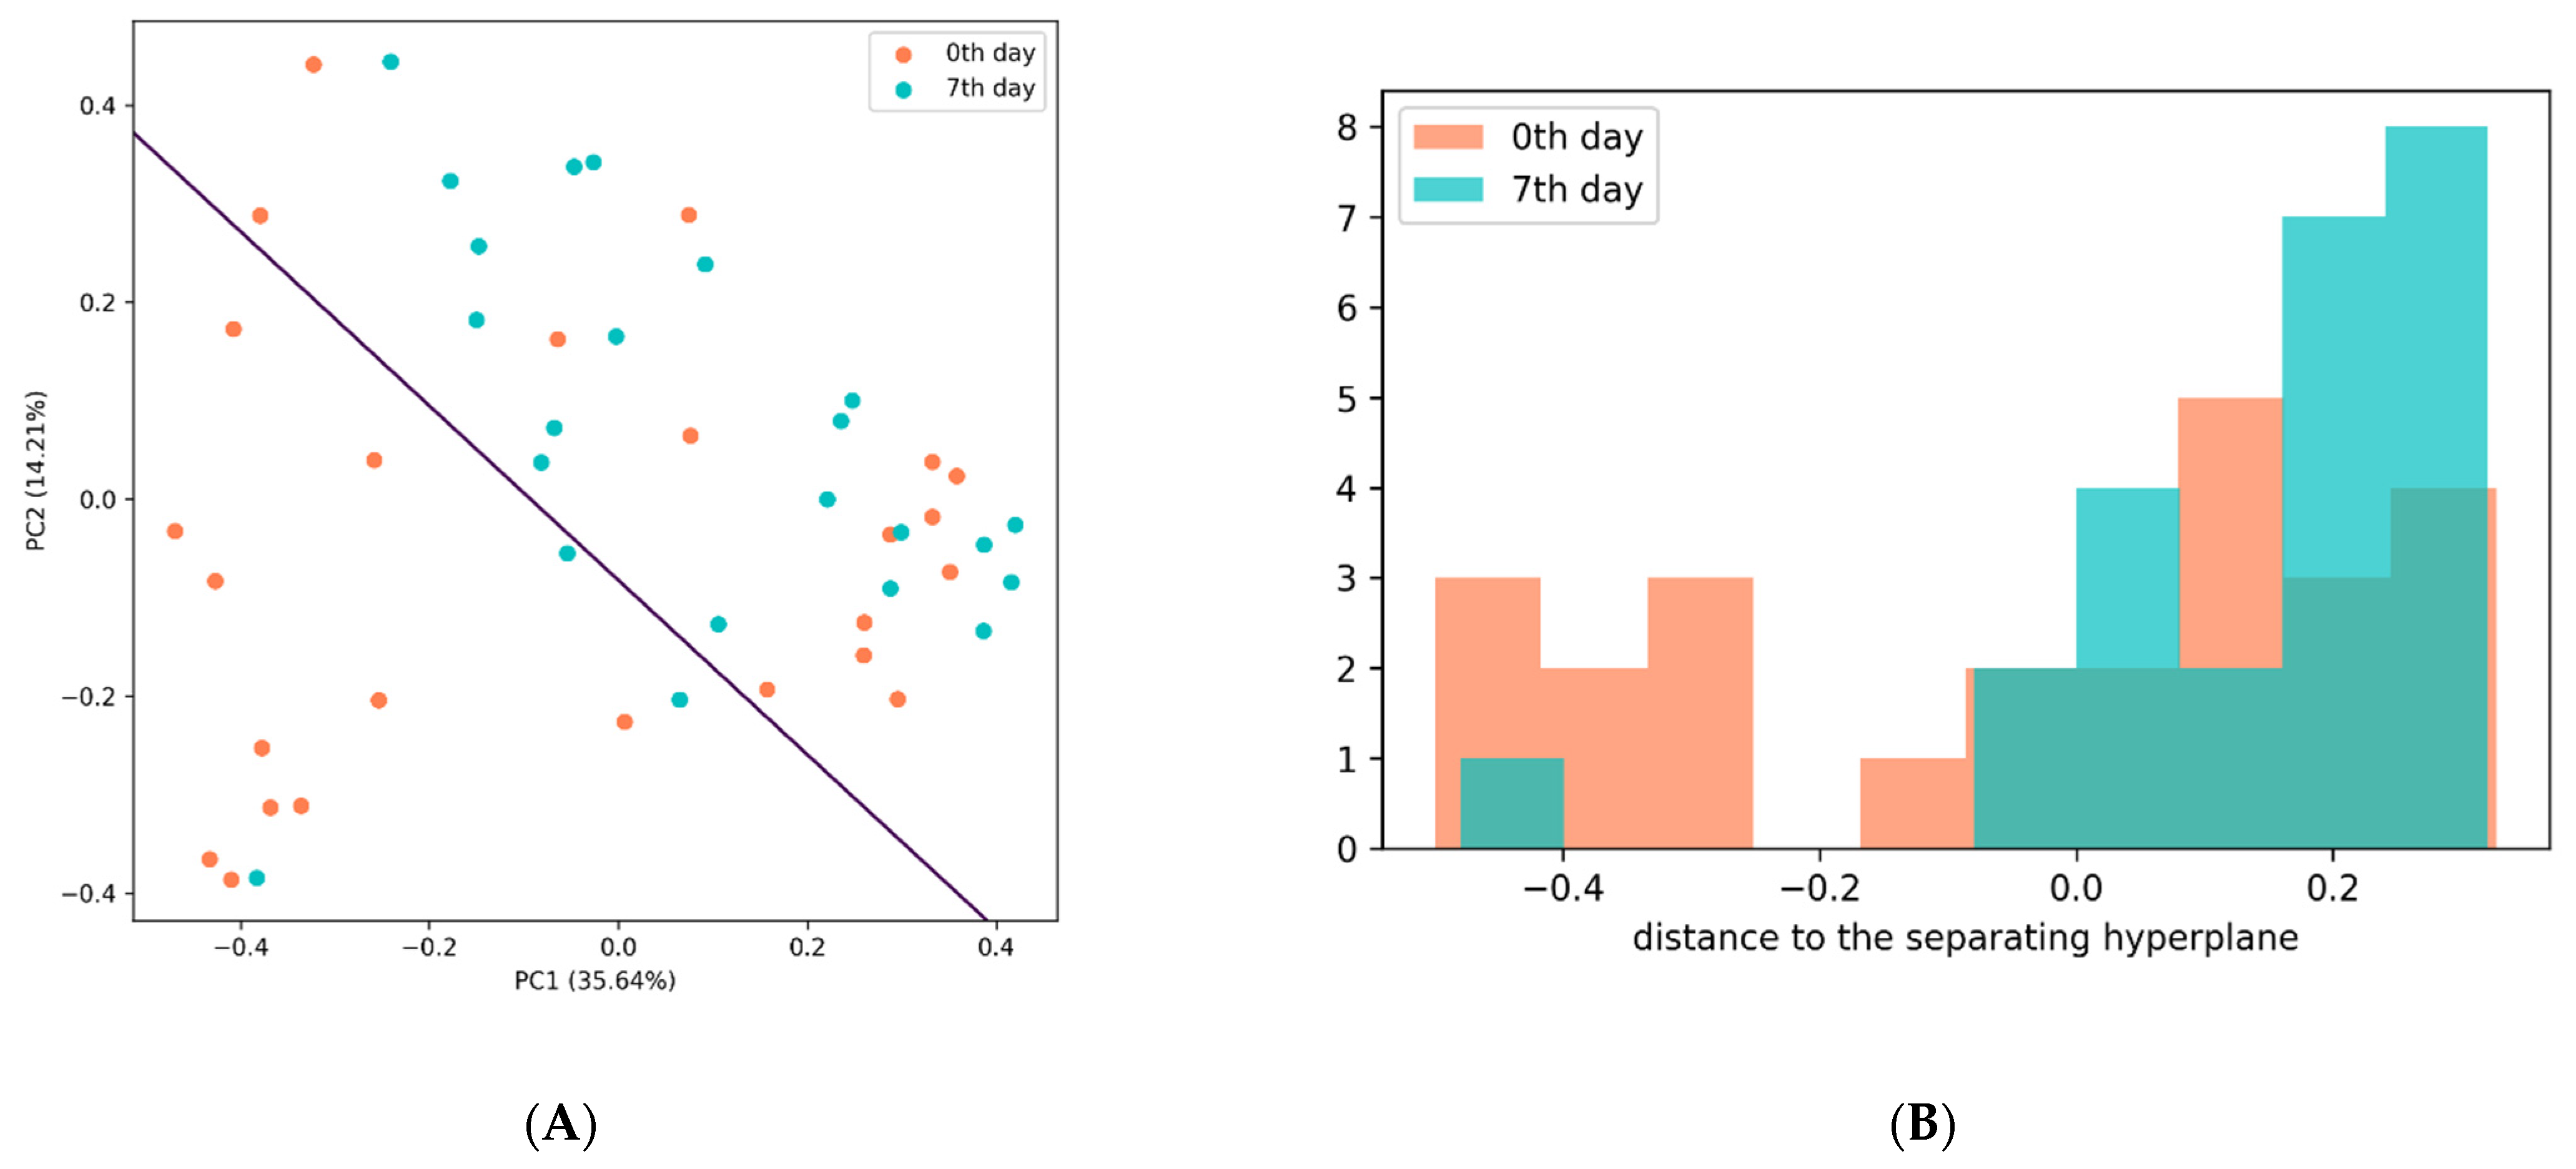
Principal Component Analysis (PCA)
3. Results
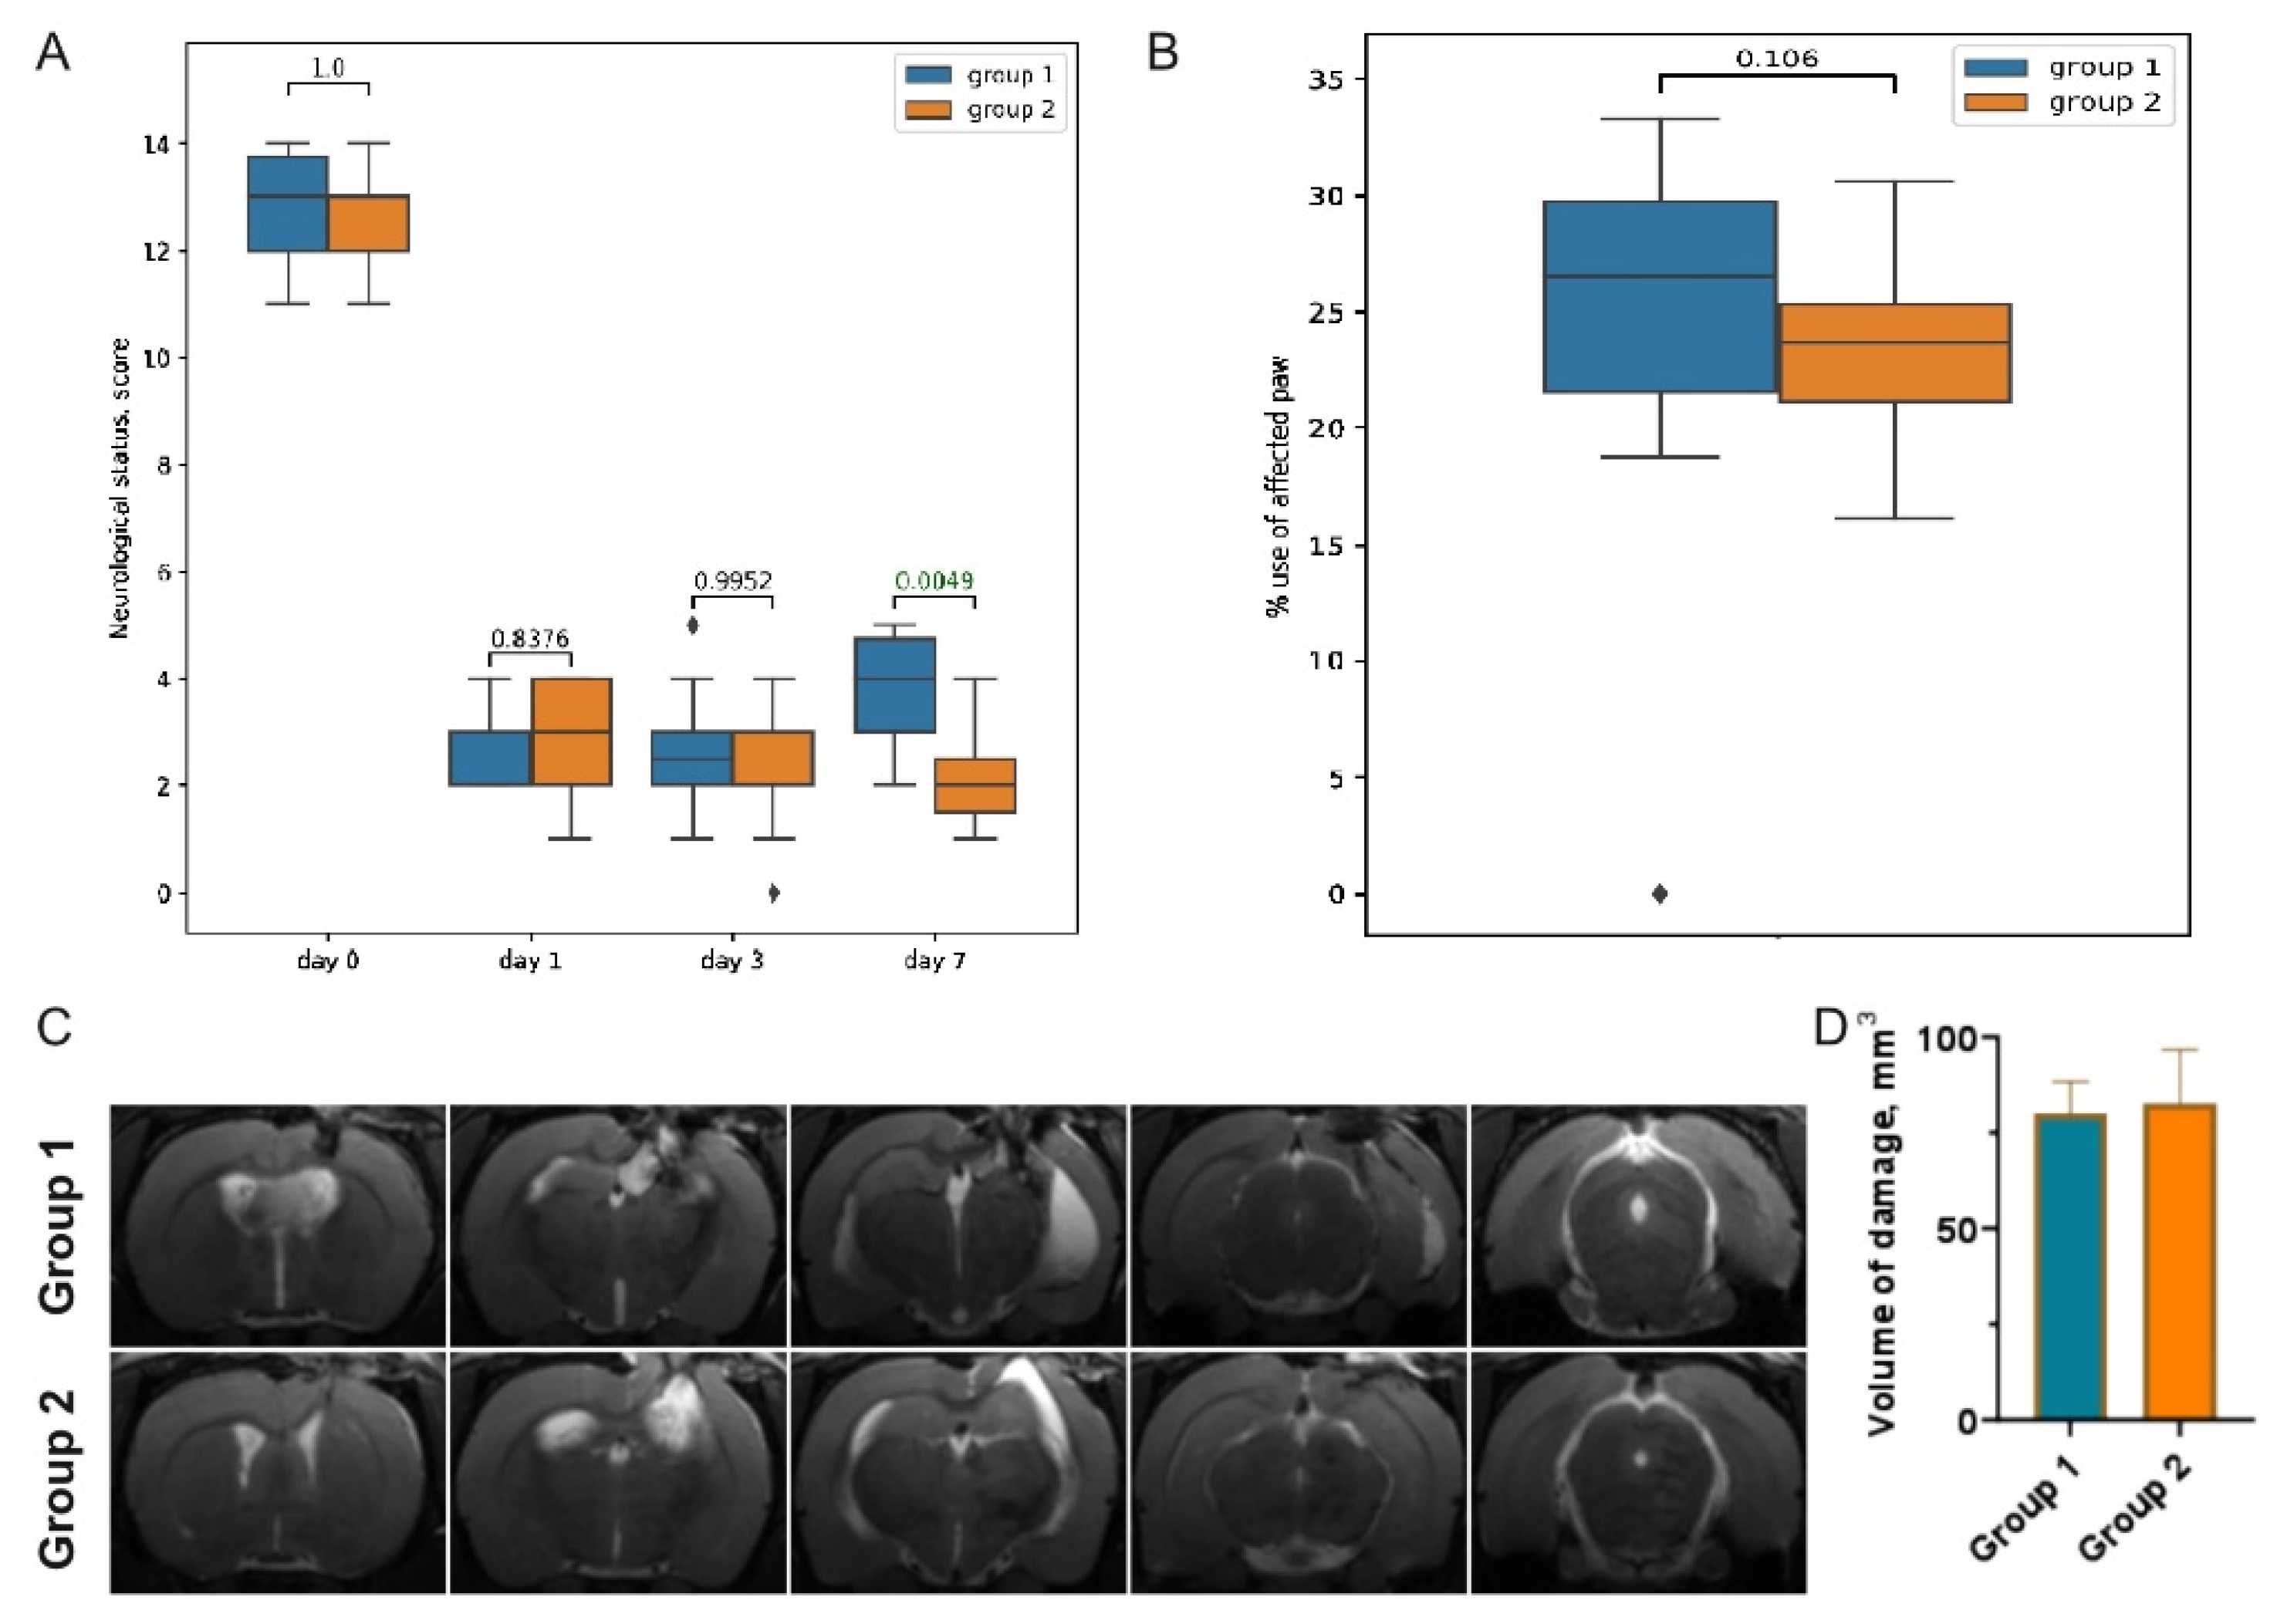
3.1. Post-TBI Changes in Neurological Signs and MR Scans
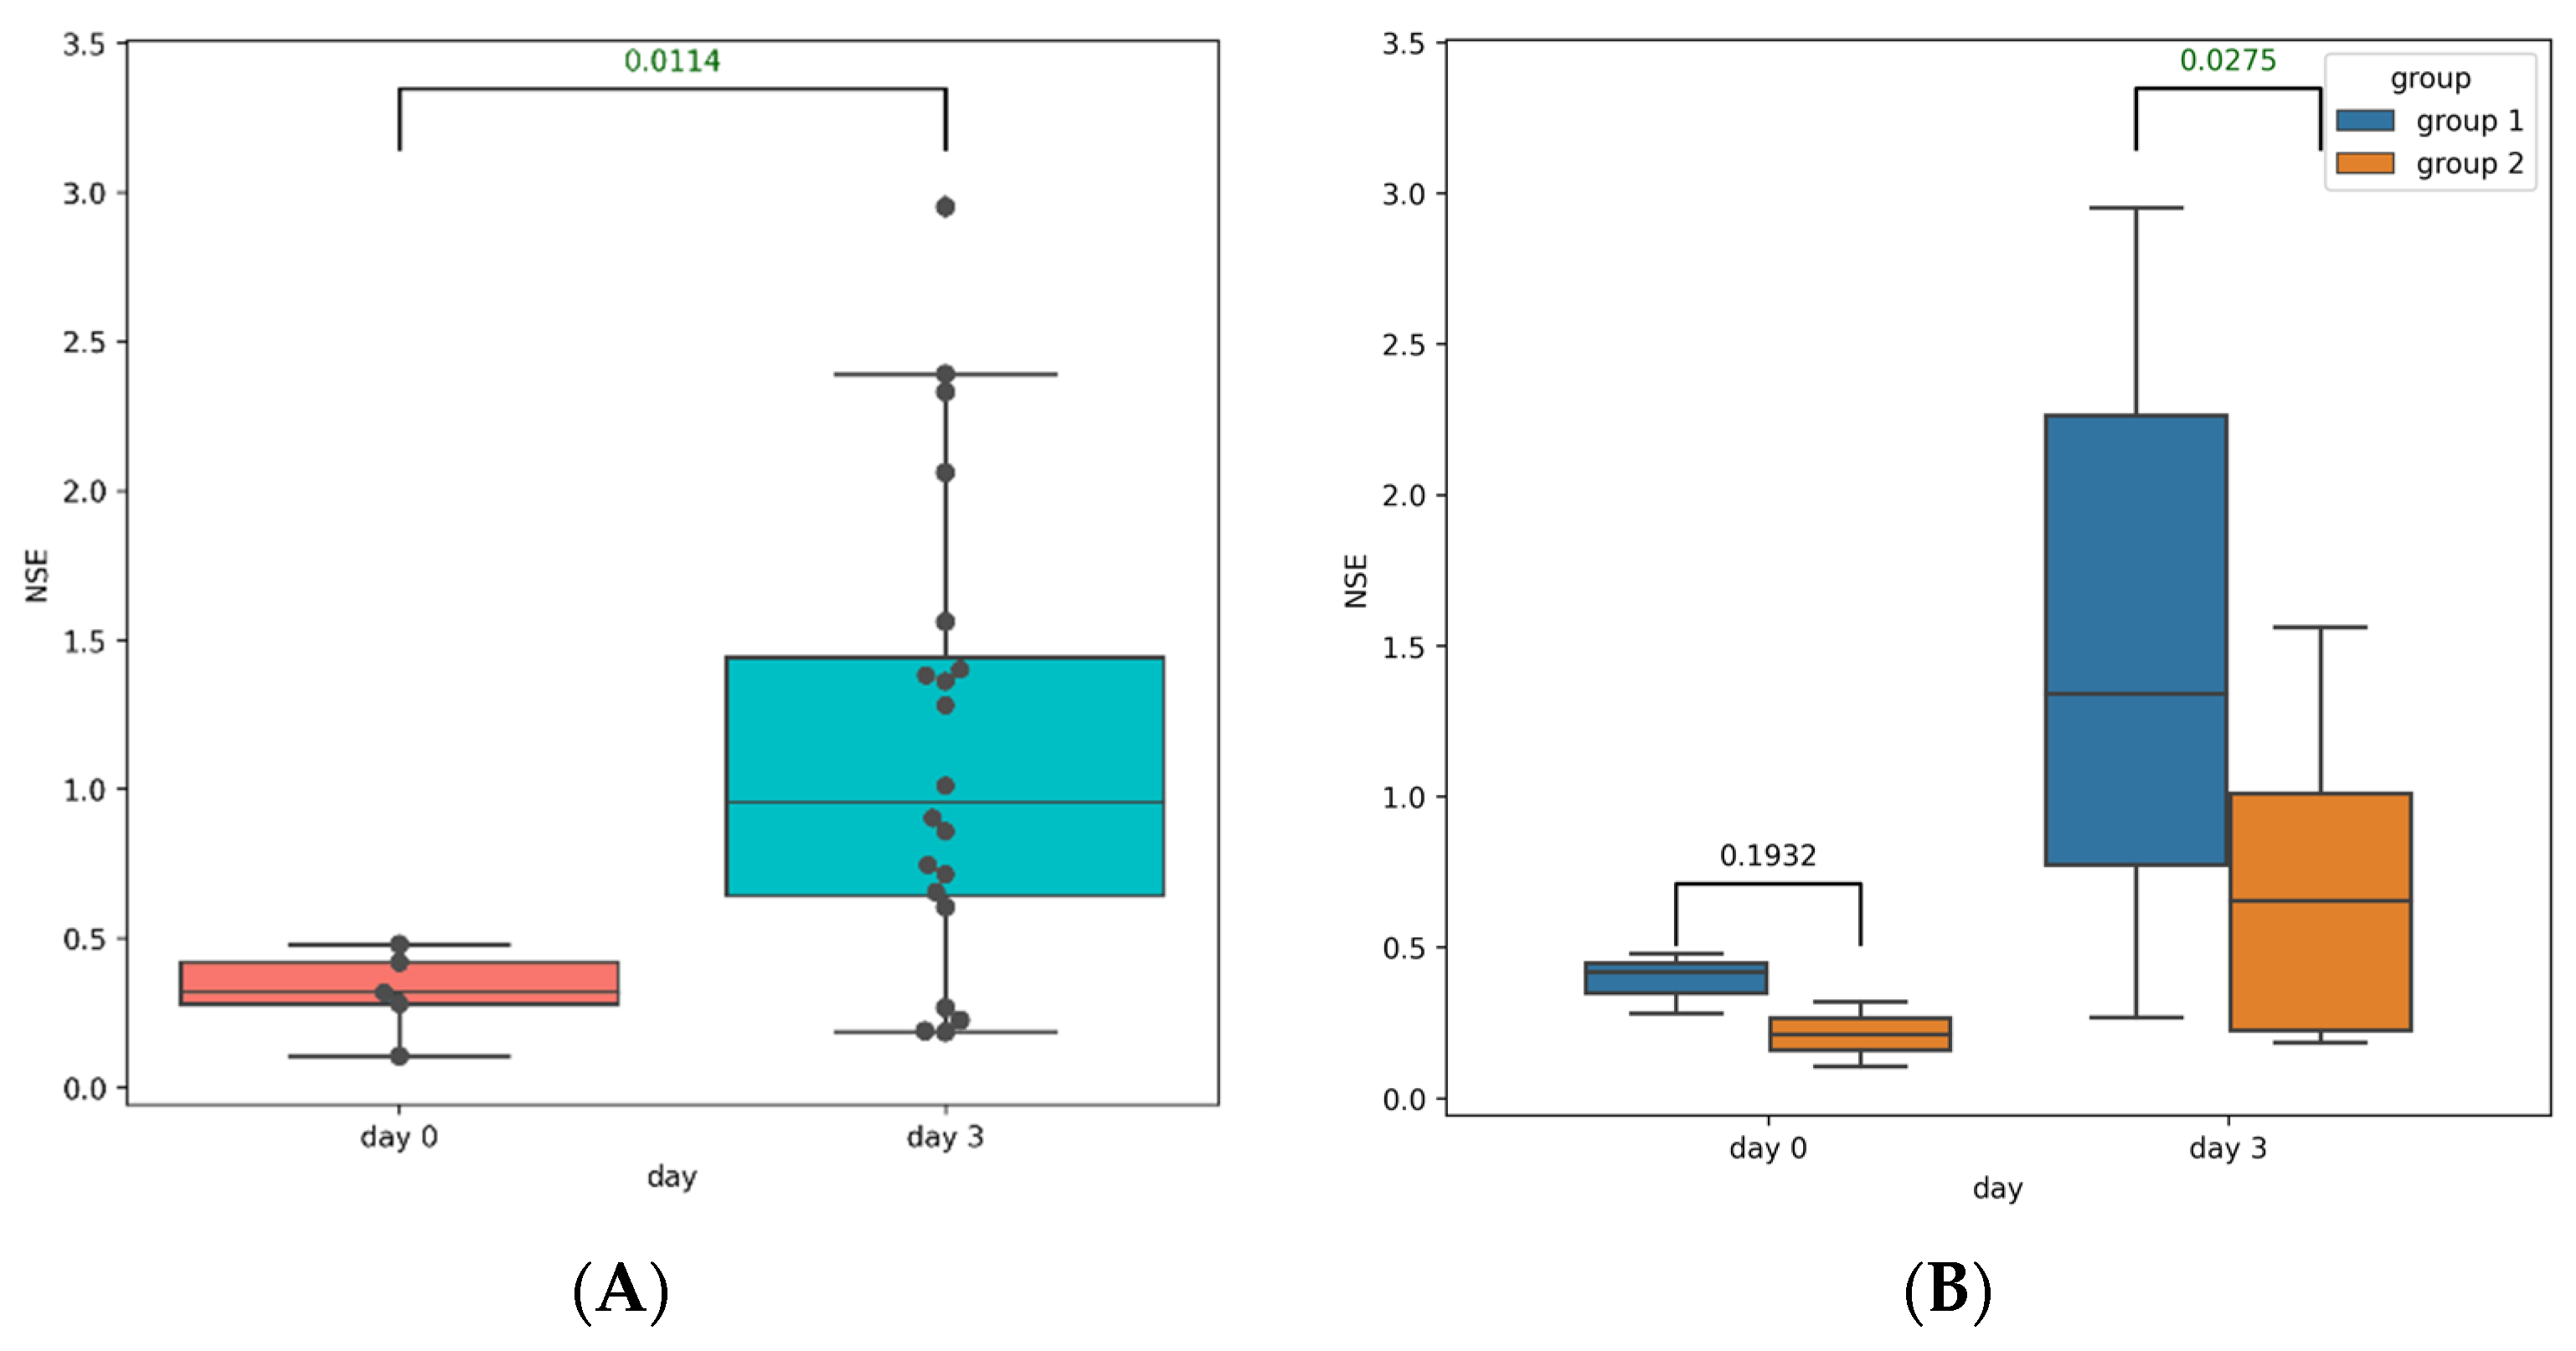
3.2. Post-TBI Changes in Serum Markers of Brain Injury
3.3. Post-TBI Changes in the Gut Microbiome Composition and Metabolic Profile
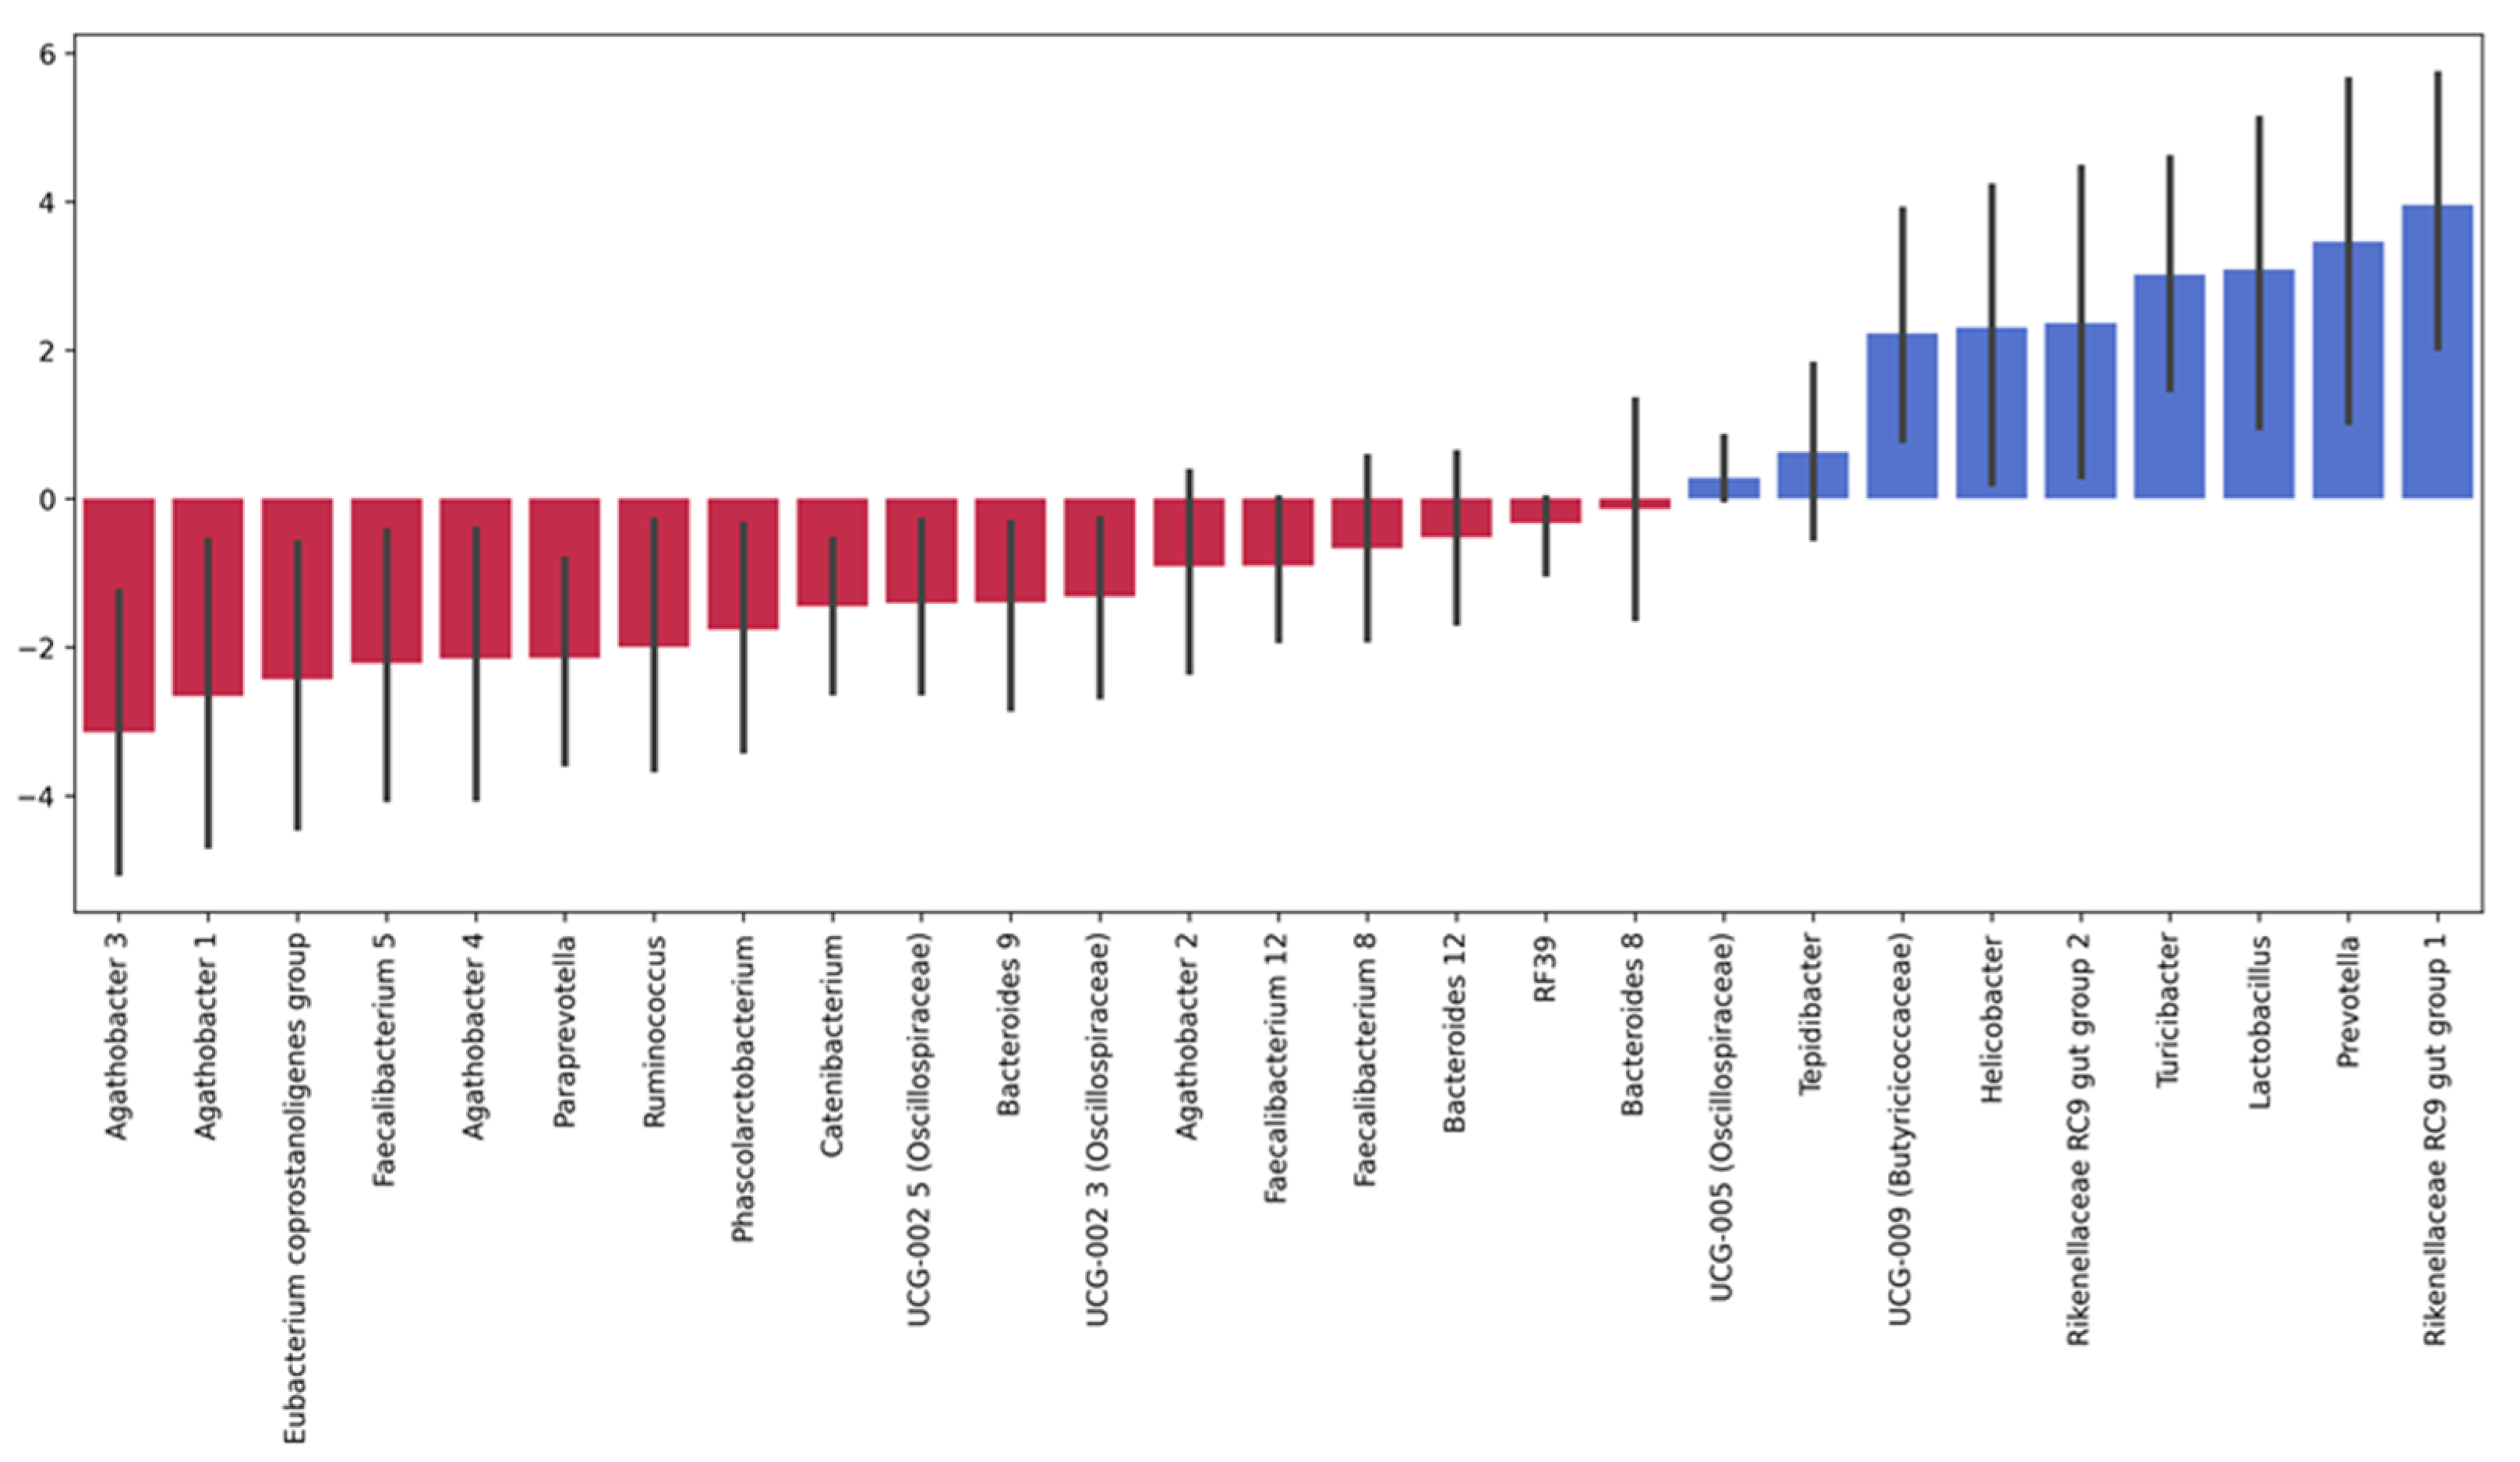
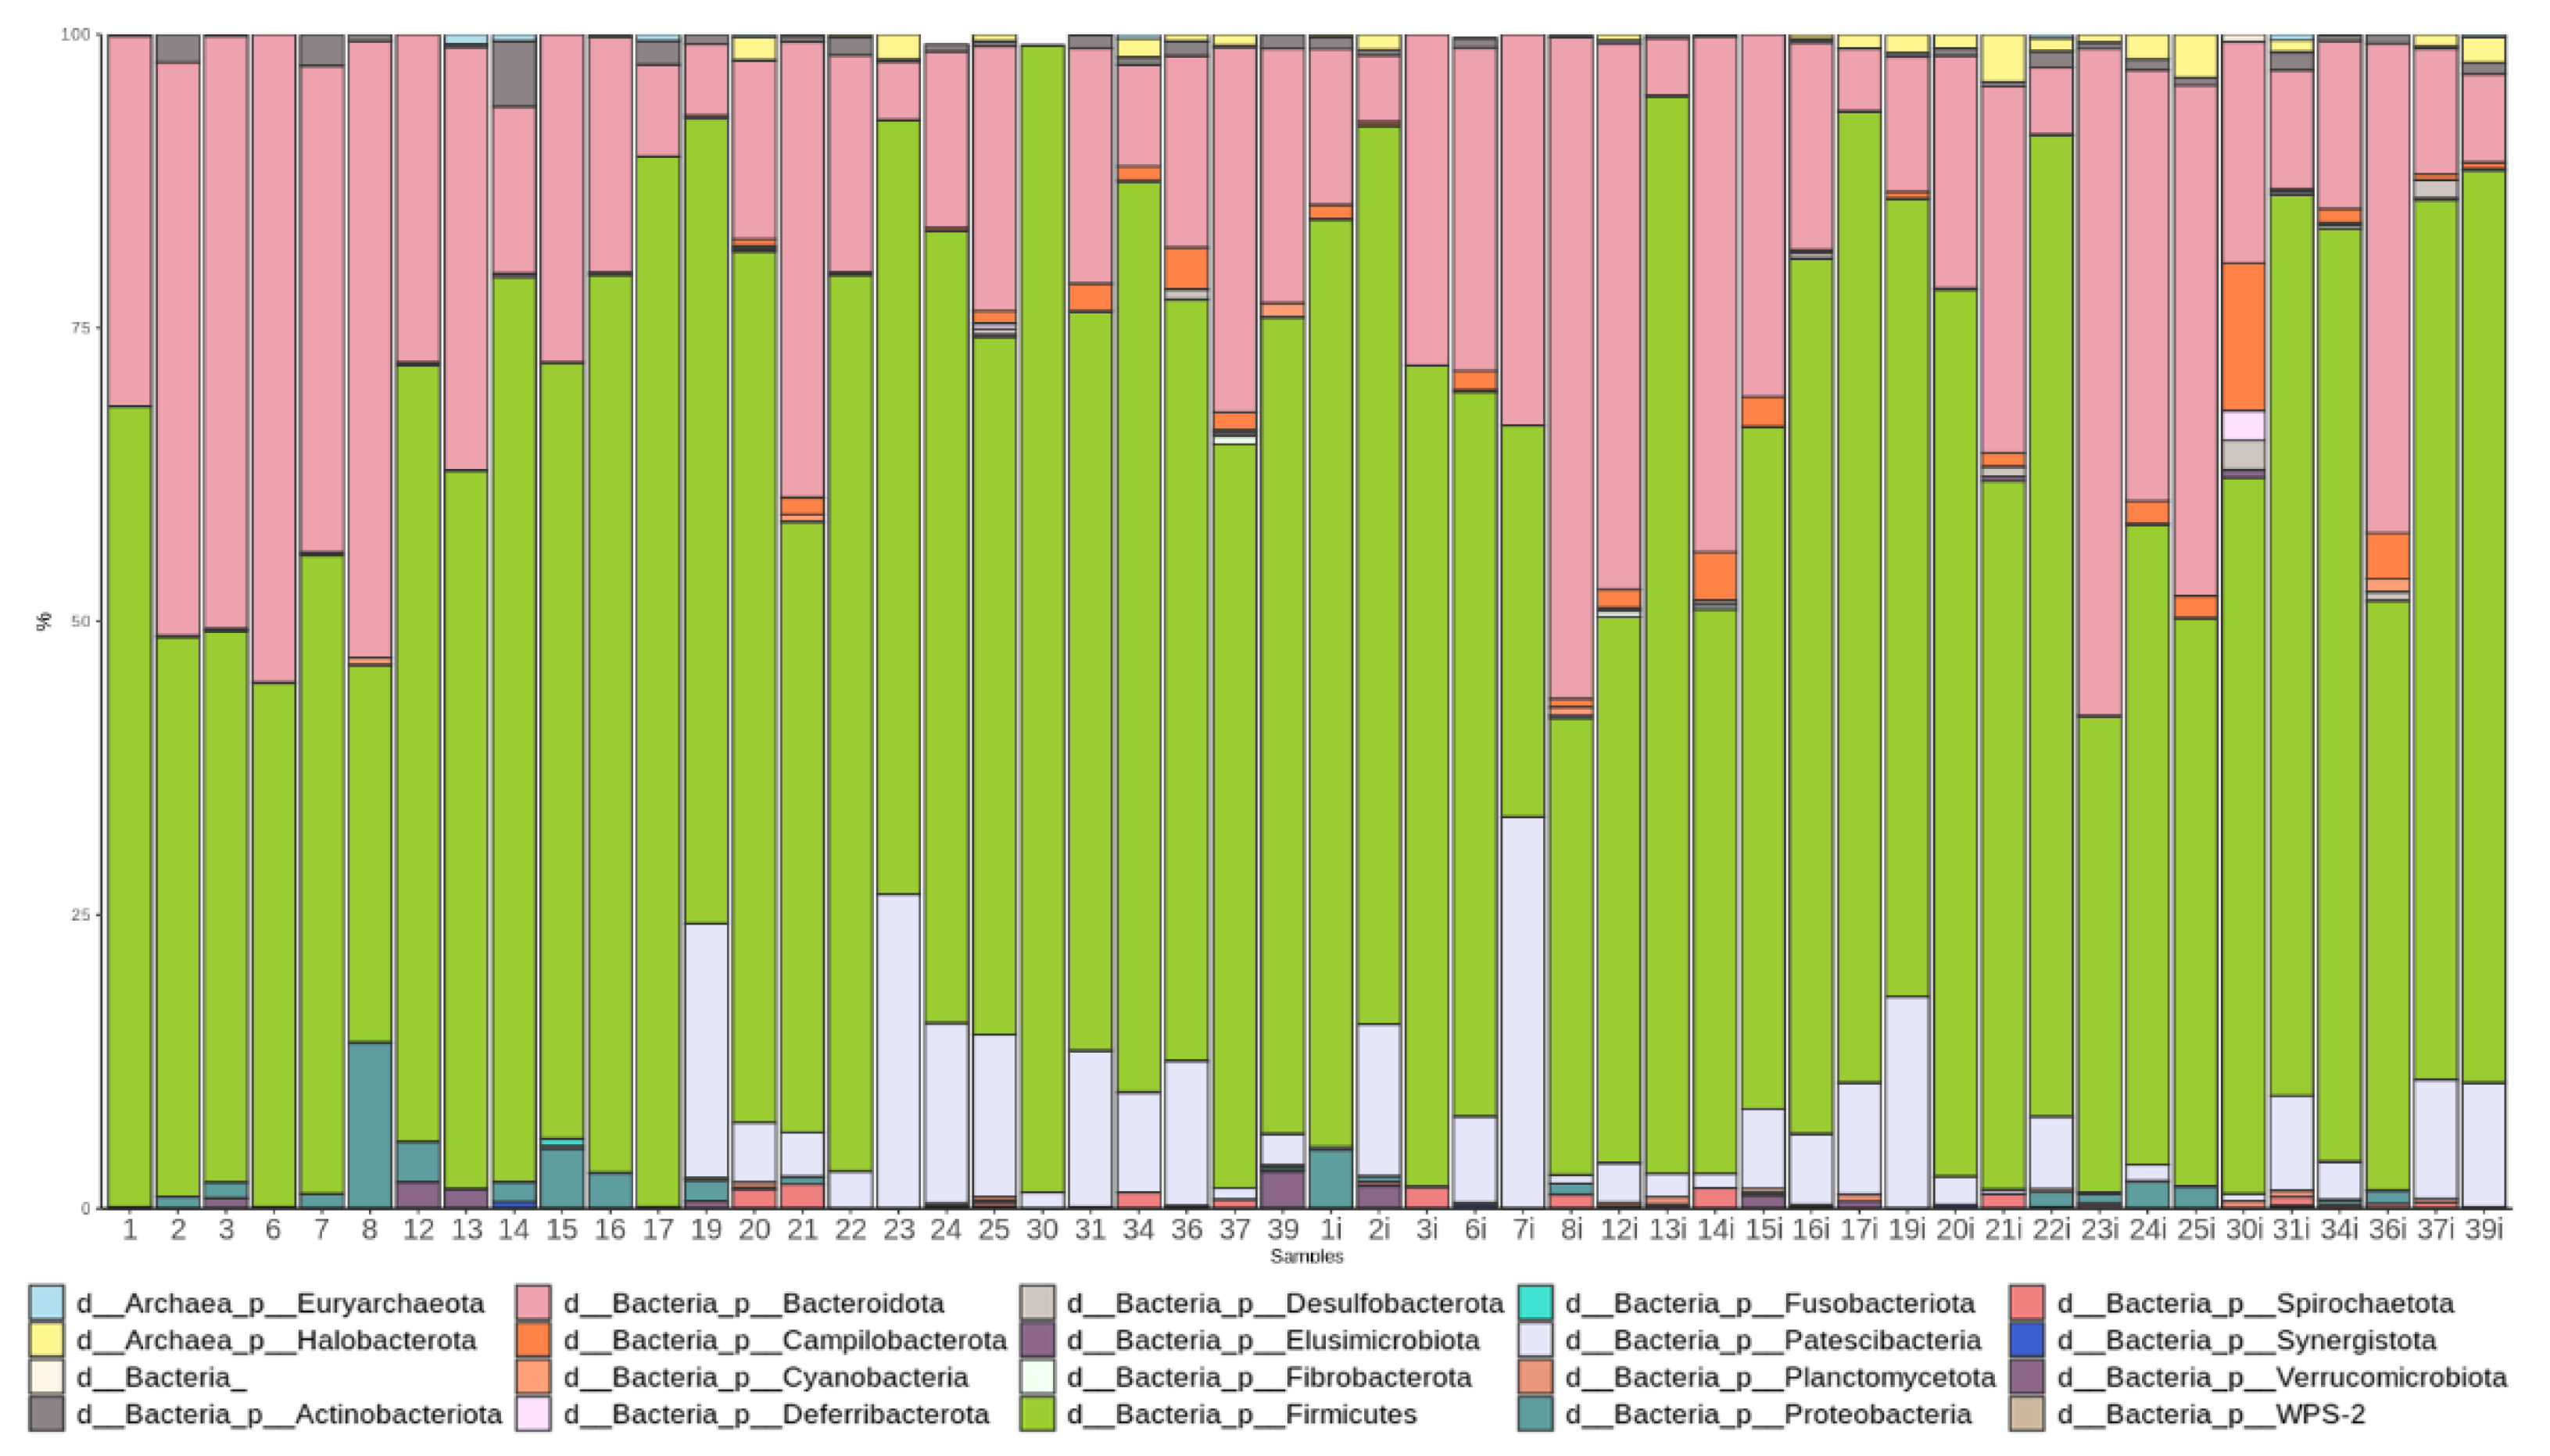
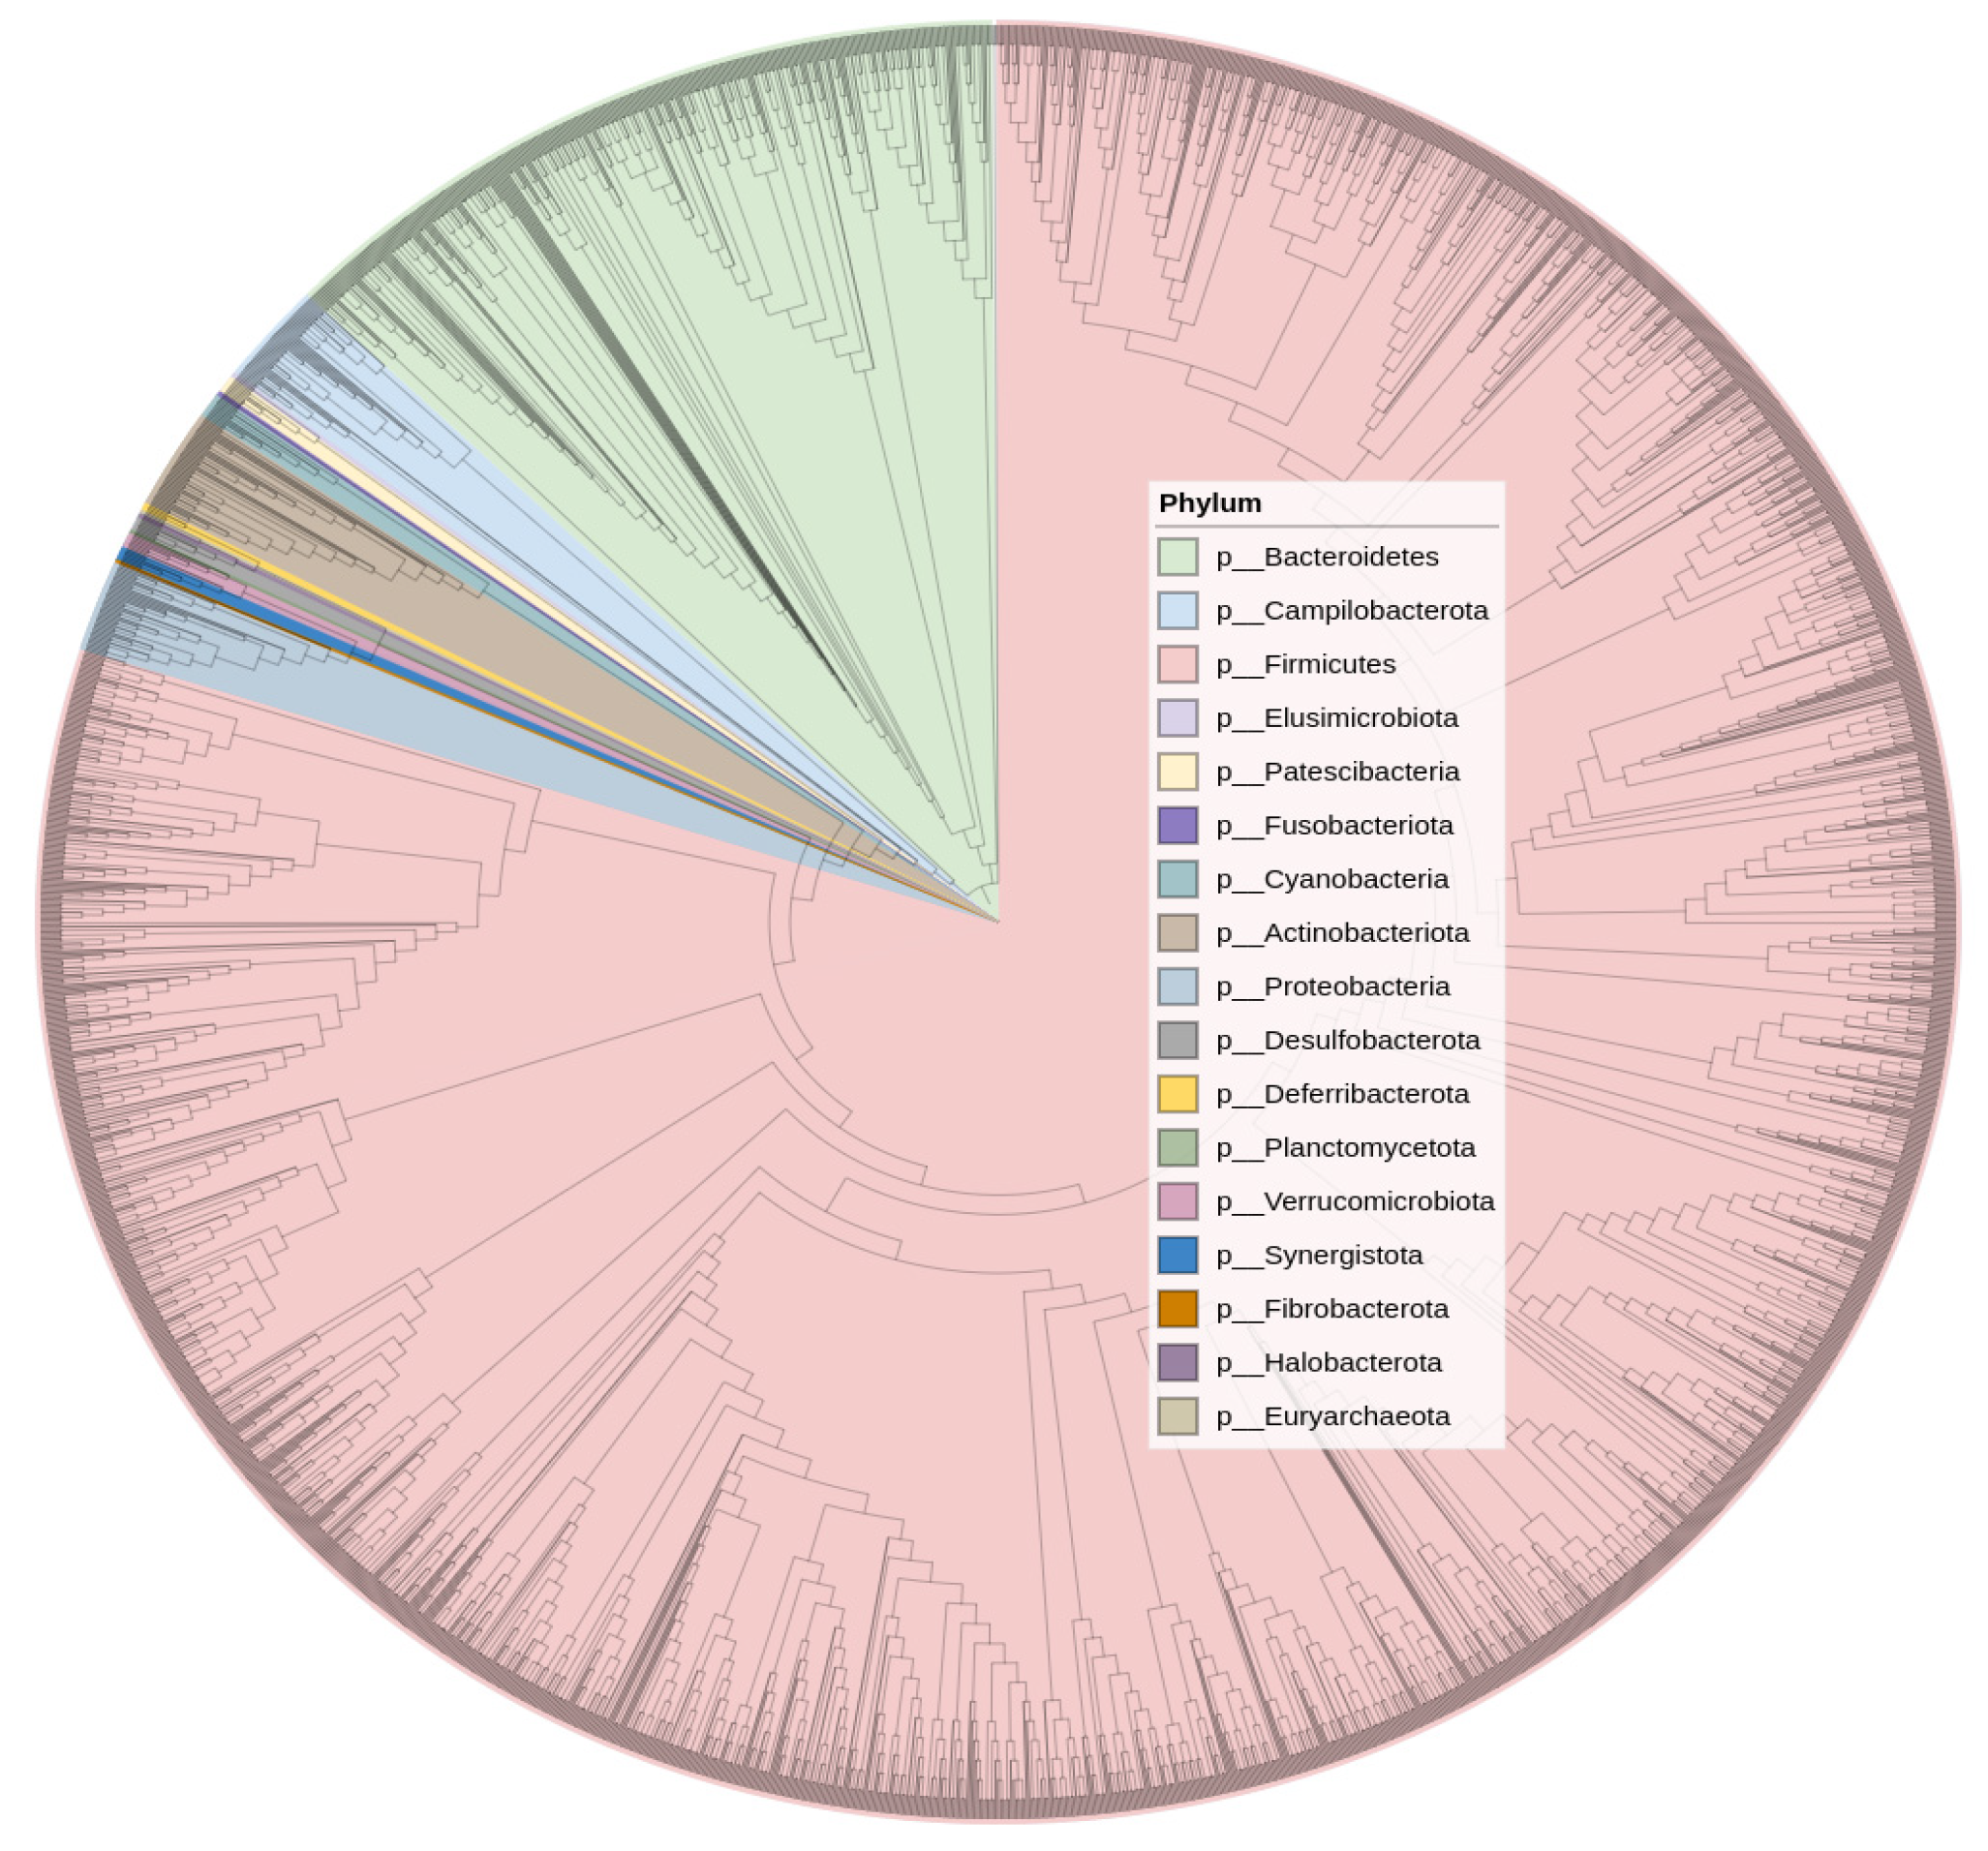
3.3.1. Taxonomic Composition and Differential Abundance in Bacterial Communities
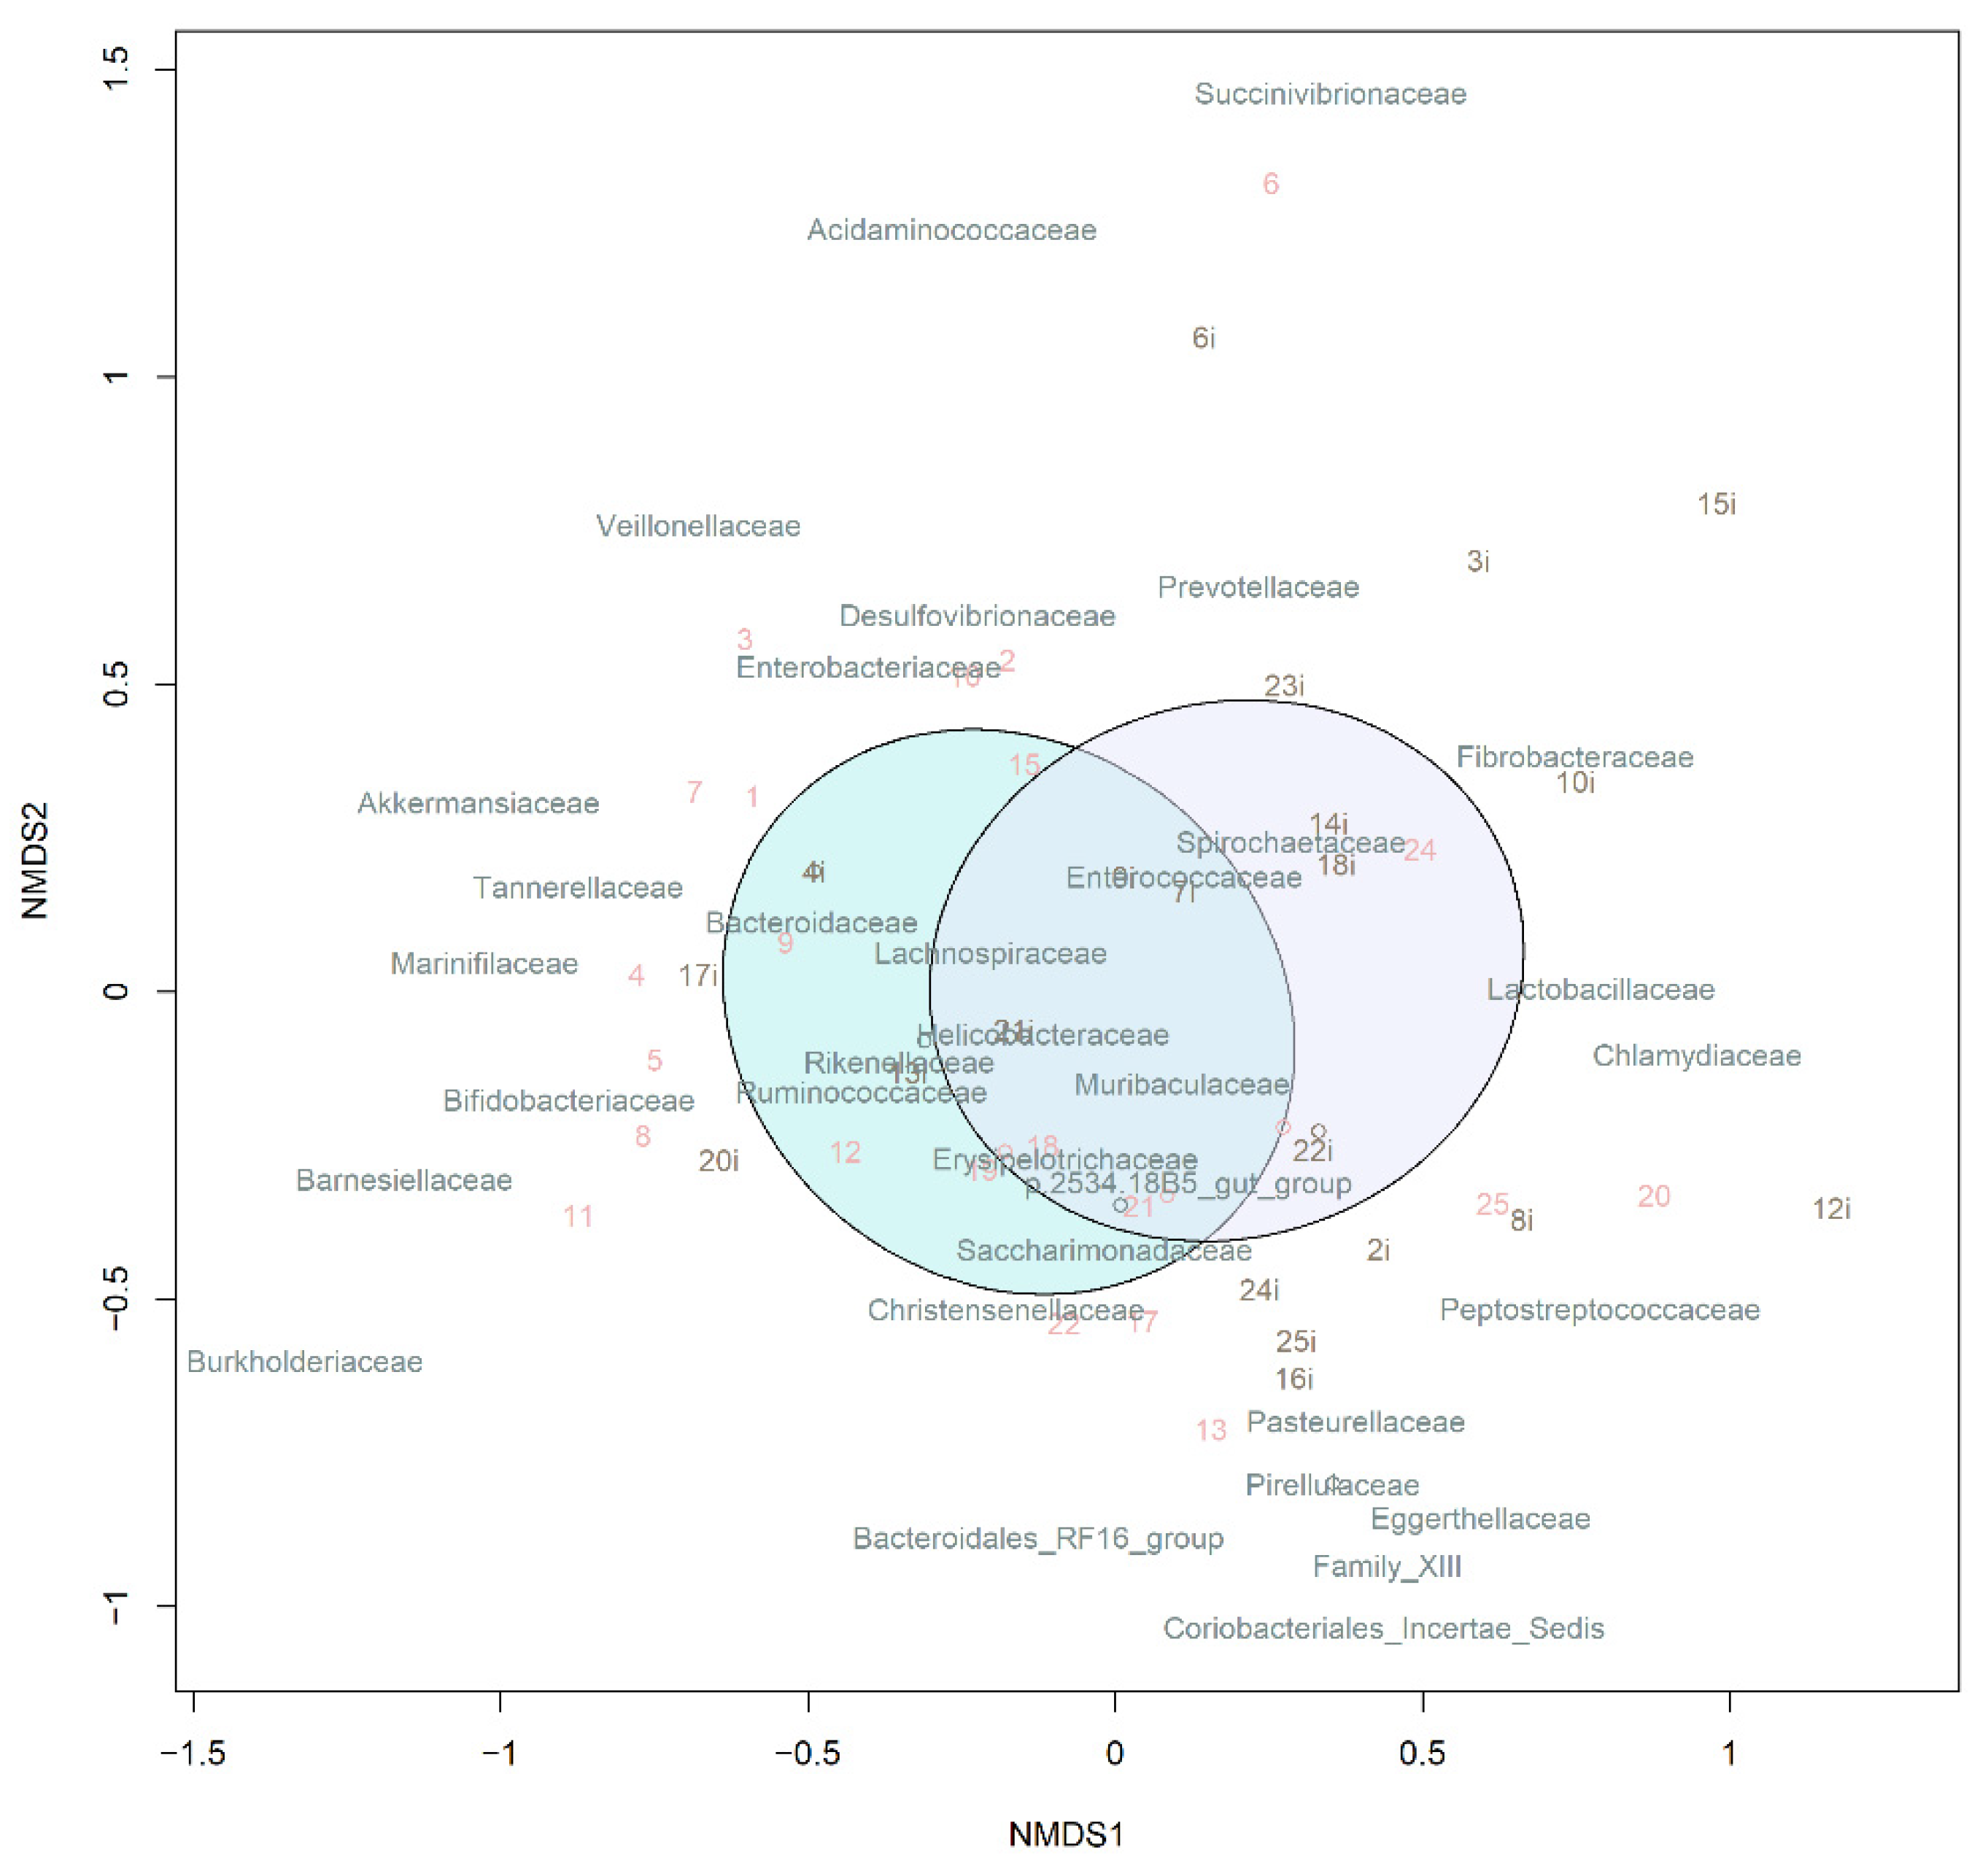
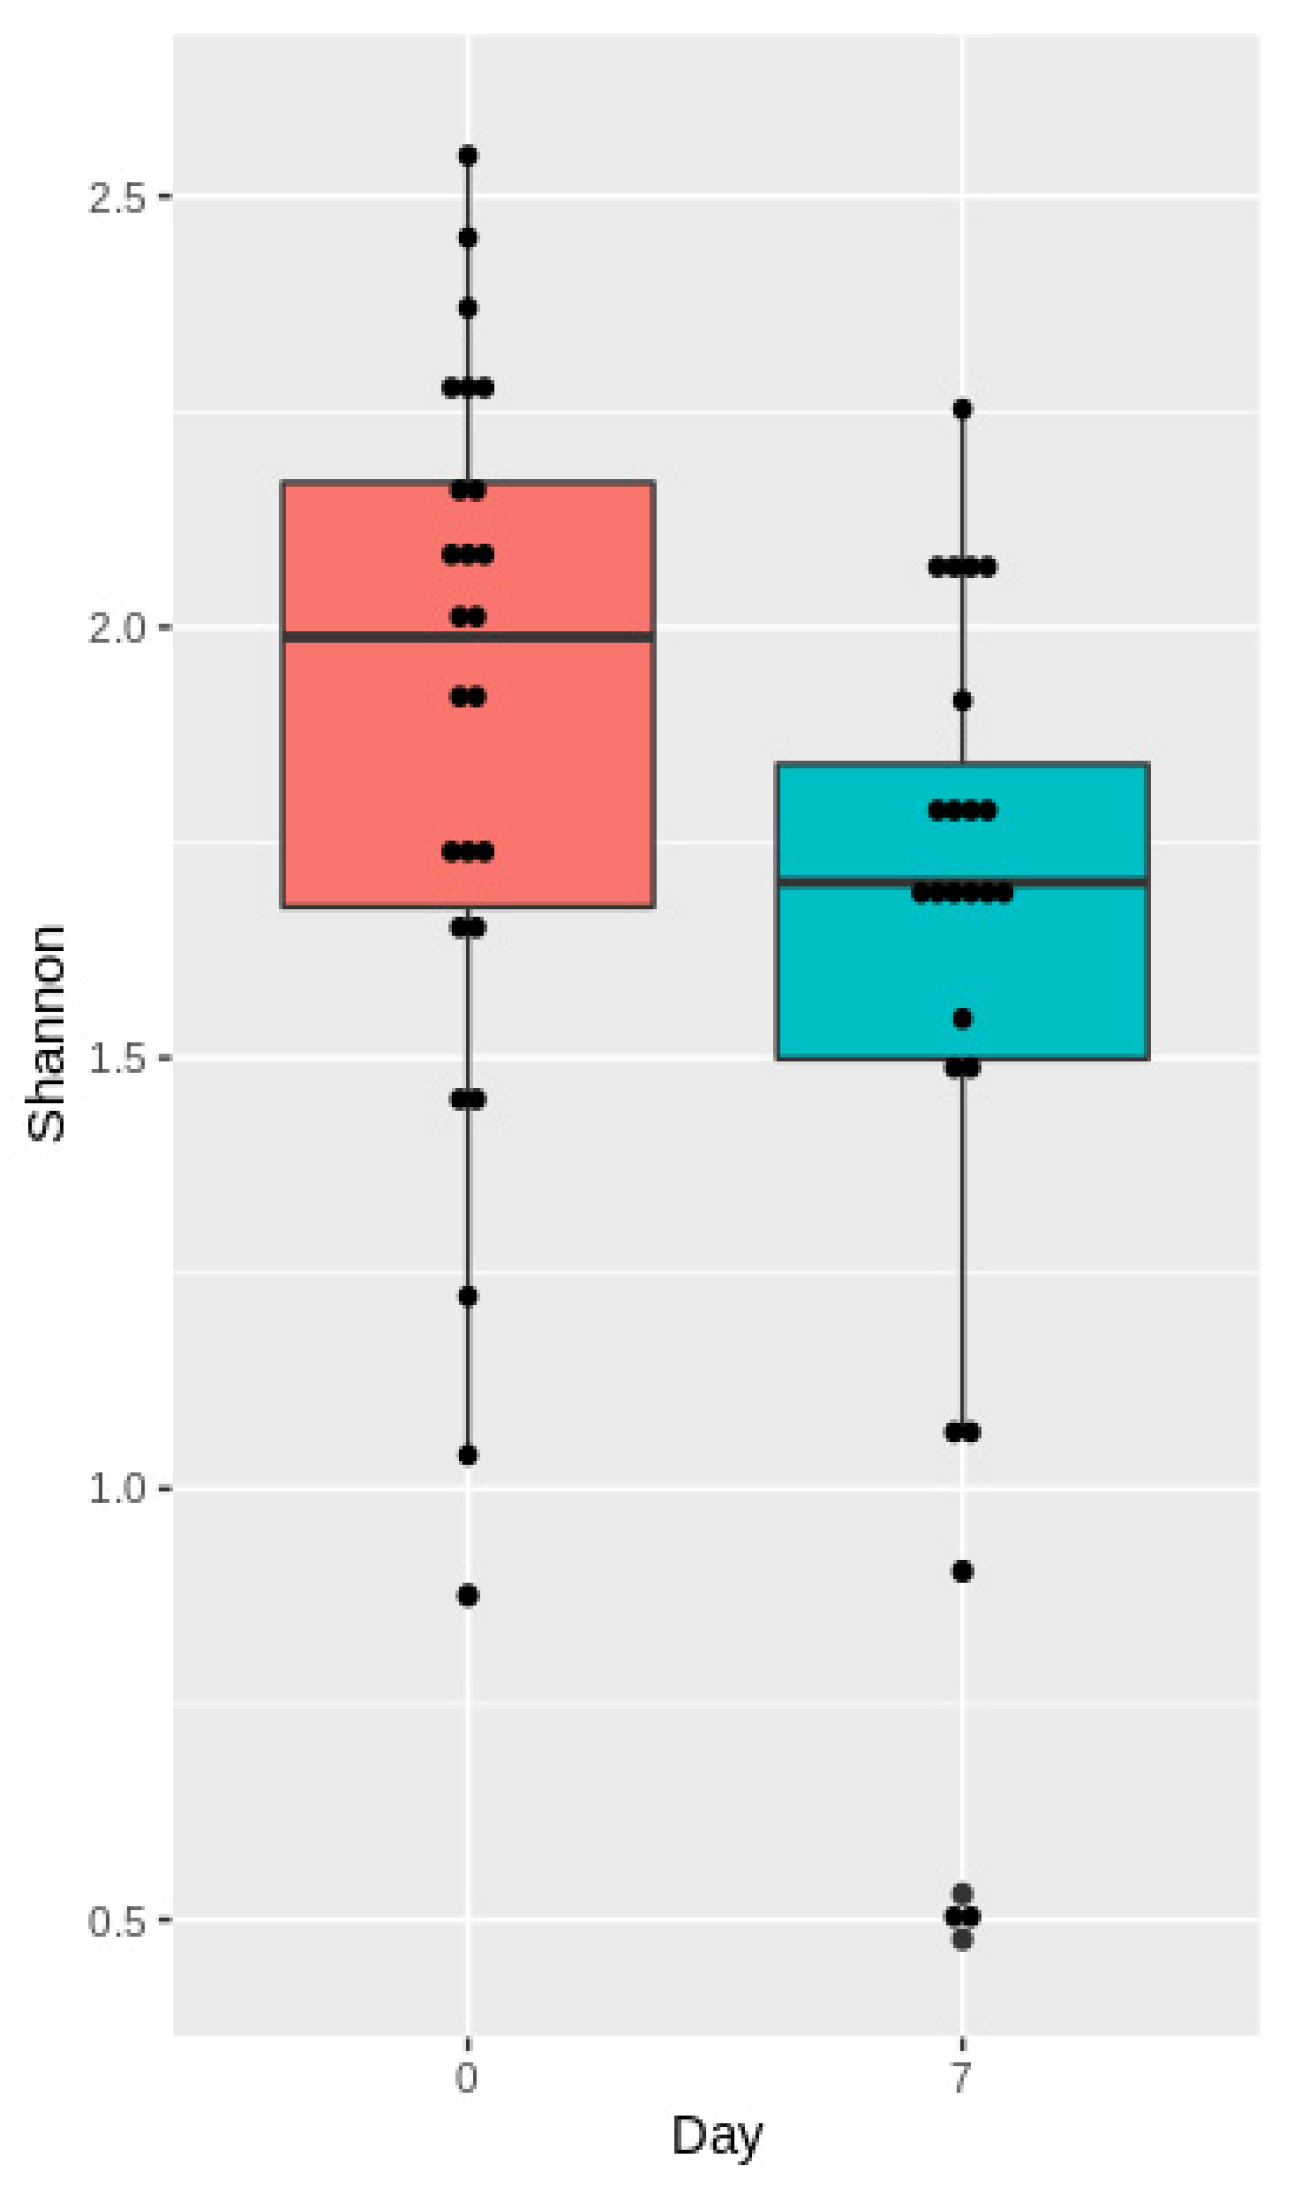
3.3.2. Analysis of Microbiota Diversity
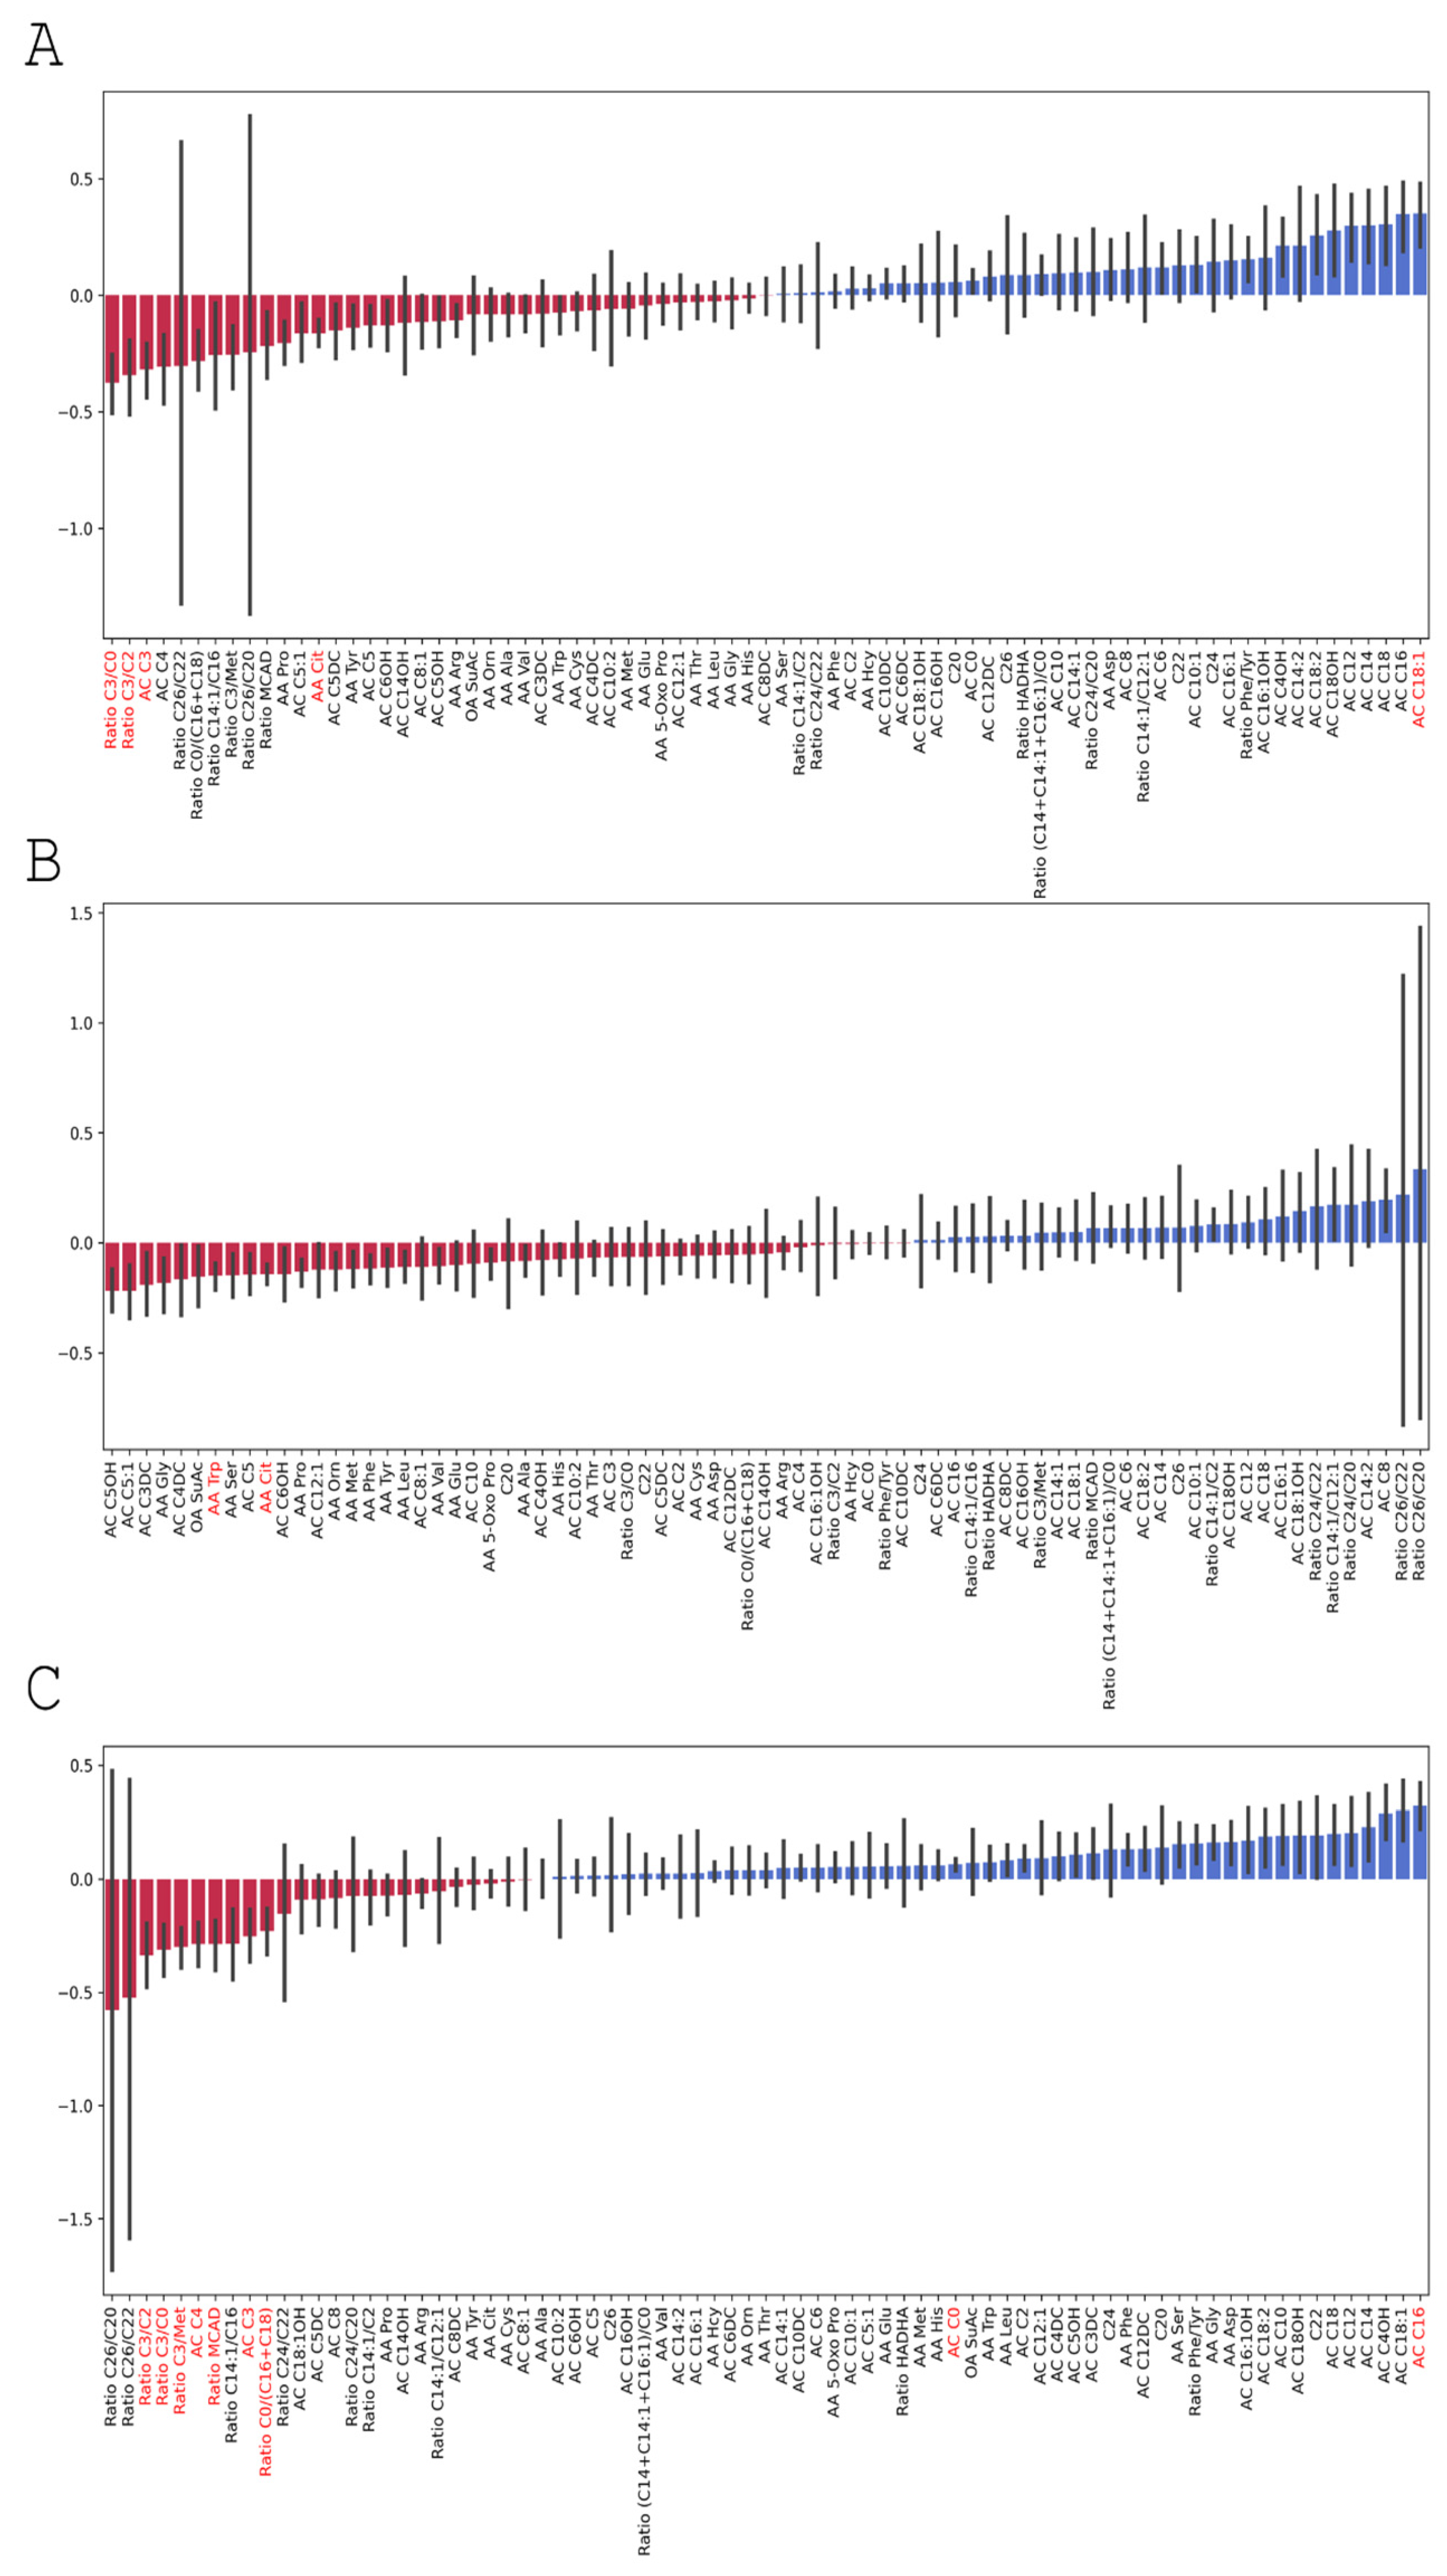
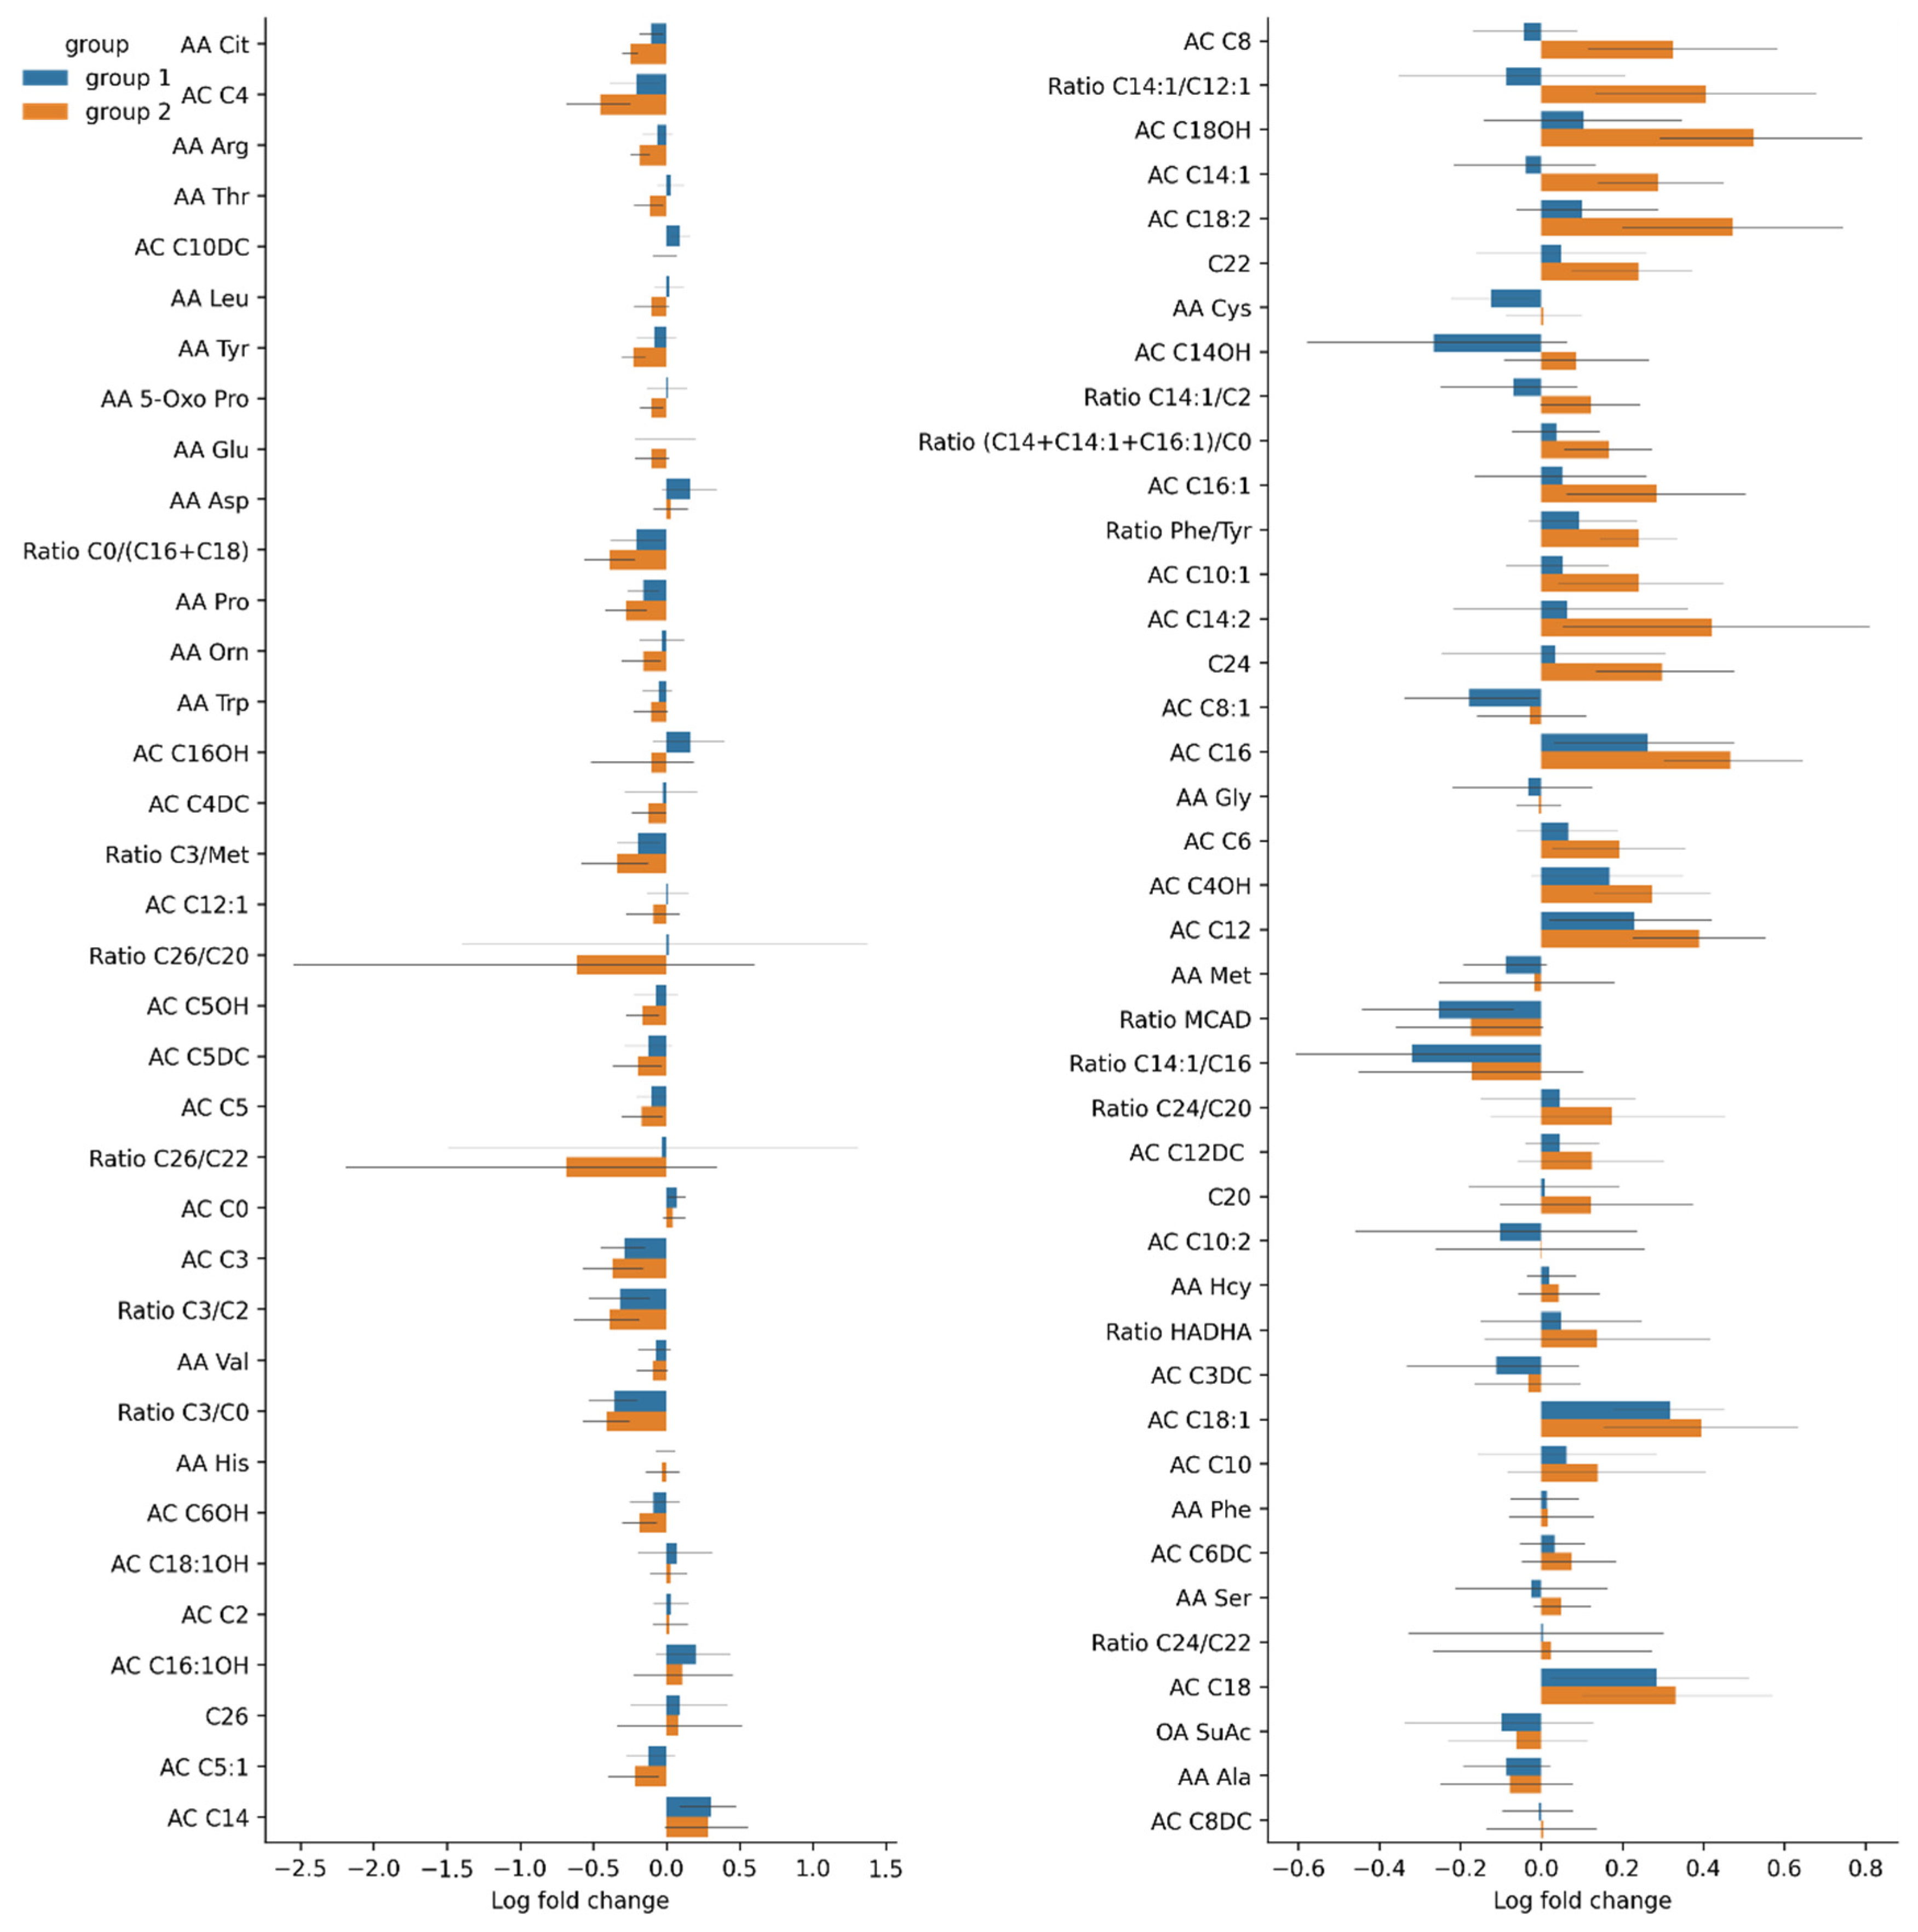
3.3.3. Changes in Serum Amino Acid Levels
3.4. Changes in the Gut Microbiome Composition and Metabolic Profile in Groups with Different Post-TBI Recovery Rates
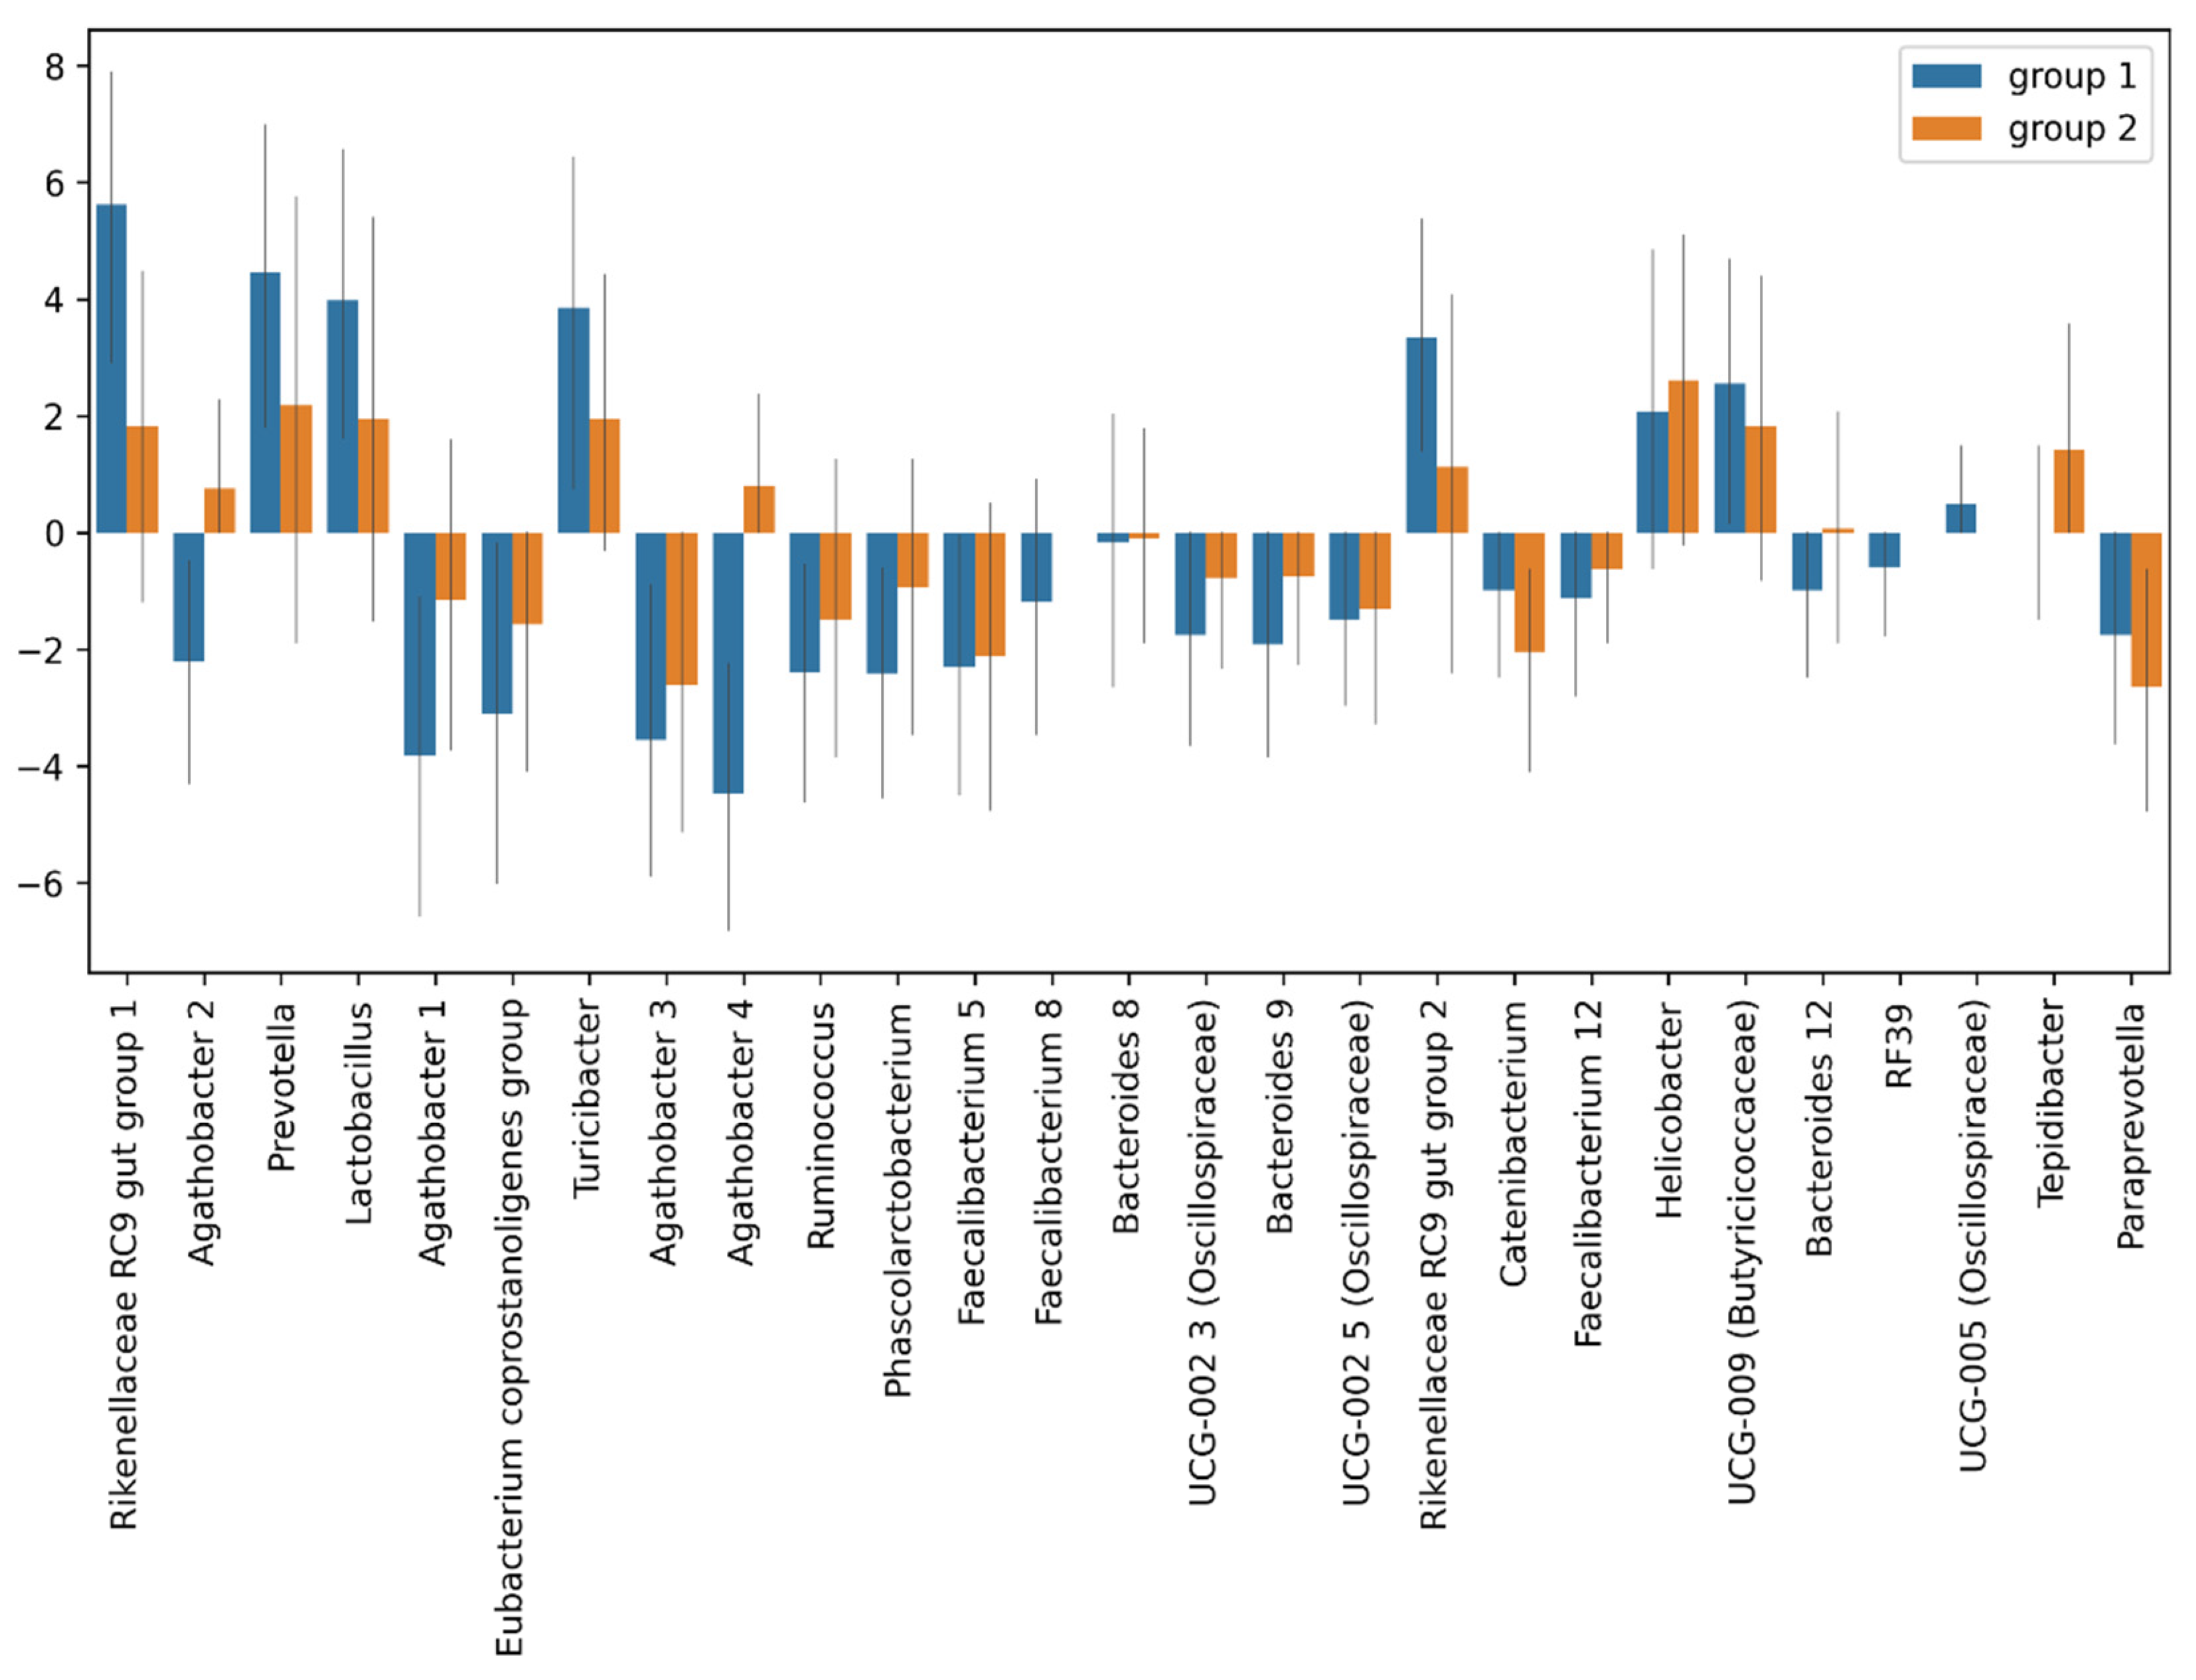
3.4.1. Taxonomic Composition and Differential Abundance of Bacterial Communities
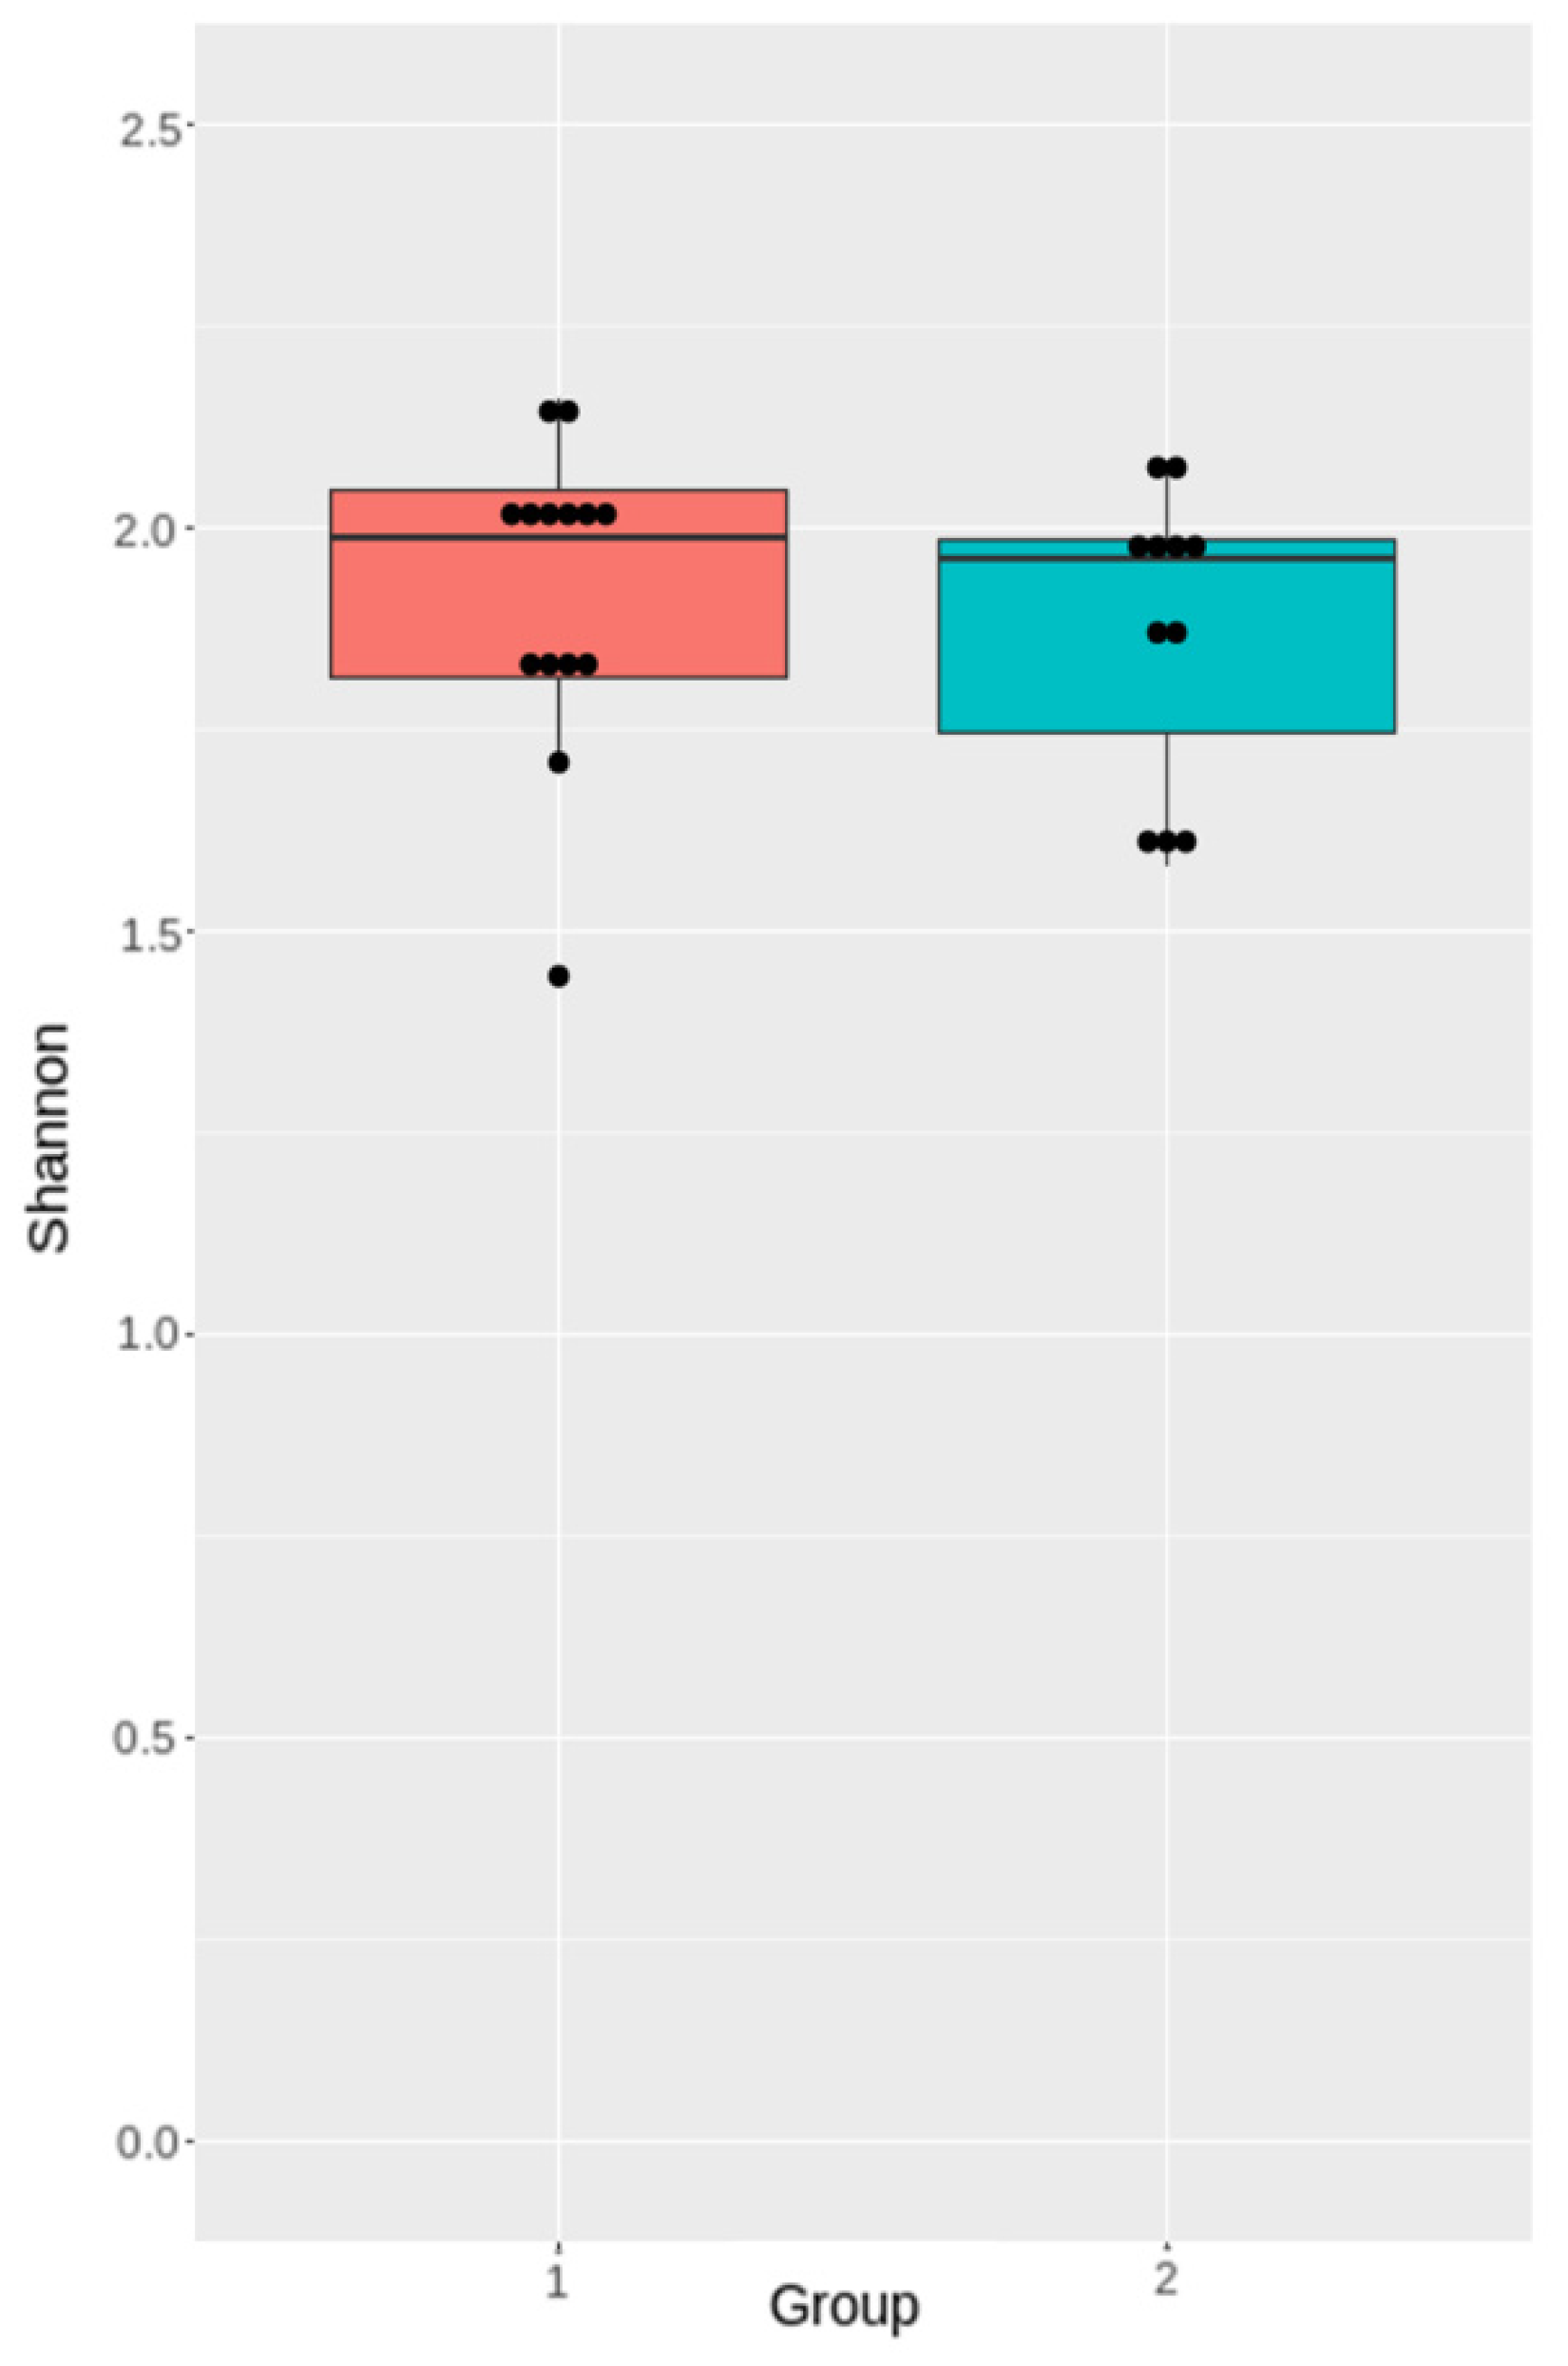
3.4.2. Analysis of Microbiota Diversity
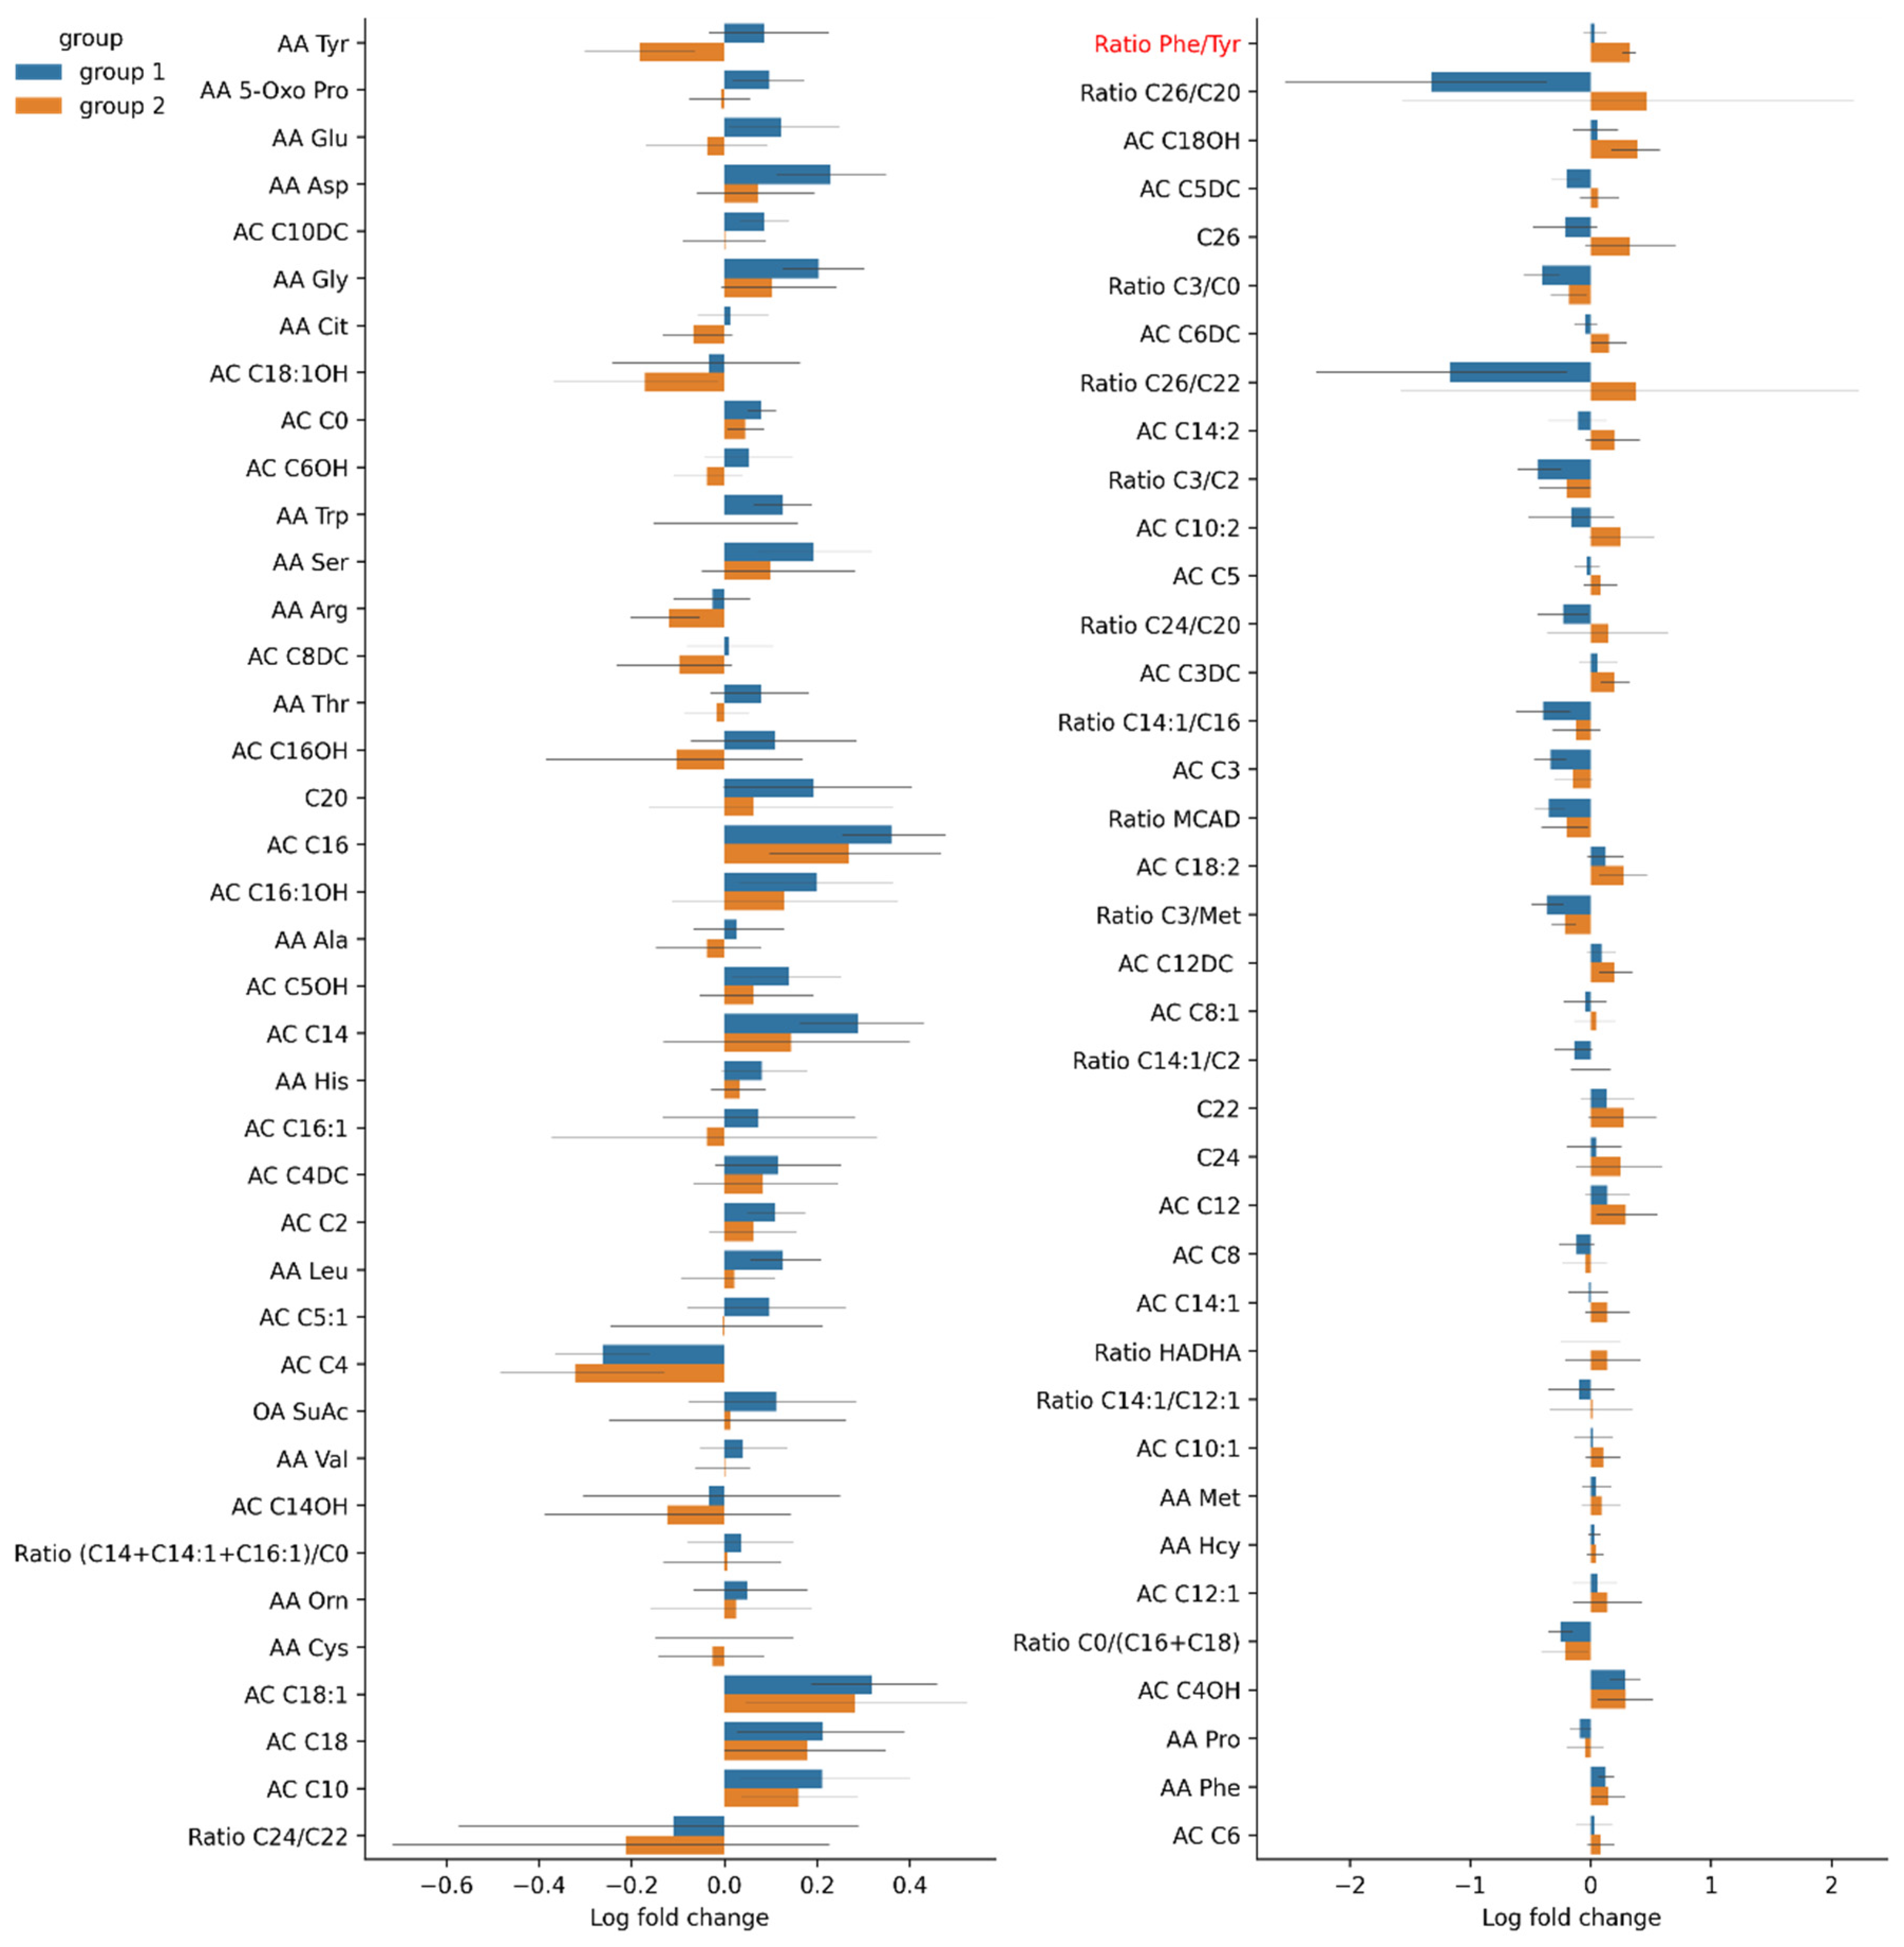
3.4.3. Changes in Serum Amino Acid Levels in Group 1 and Group 2
4. Discussion
5. Conclusions
Author Contributions
Funding
Institutional Review Board Statement
Informed Consent Statement
Data Availability Statement
Conflicts of Interest
References
- Eapen, B.C.; Cifu, D.X. Traumatic Brain Injury Rehabilitation, An Issue of Physical Medicine and Rehabilitation Clinics of North America; Elsevier Health Sciences: Amsterdam, The Netherlands, 2017. [Google Scholar]
- Kemp, C.D.; Johnson, J.C.; Riordan, W.P.; Cotton, B.A. How we die: The impact of nonneurologic organ dysfunction after severe traumatic brain injury. Am. Surg. 2008, 74, 866–872. [Google Scholar] [CrossRef] [PubMed]
- Brenner, L.A.; Stamper, C.E.; Hoisington, A.J.; Stearns-Yoder, K.A.; Stanislawksi, M.A.; Brostow, D.P. Microbial Diversity and Community Structures Among Those with Moderate to Severe TBI: A United States-Veteran Microbiome Project Study. J. Head Trauma Rehabil. 2020, 35, 332–341. [Google Scholar] [CrossRef] [PubMed]
- Morais, L.H.; Schreiber, H.L.; Mazmanian, S.K. The gut microbiota–brain axis in behaviour and brain disorders. Nat. Rev. Microbiol. 2020, 19, 241–255. [Google Scholar] [CrossRef] [PubMed]
- Houlden, A.; Goldrick, M.; Brough, D.; Vizi, E.S.; Lénárt, N.; Martinecz, B.; Roberts, I.S.; Denes, A. Brain injury induces specific changes in the caecal microbiota of mice via altered autonomic activity and mucoprotein production. Brain Behav. Immun. 2016, 57, 10–20. [Google Scholar] [CrossRef]
- Sharon, G.; Sampson, T.R.; Geschwind, D.H.; Mazmanian, S.K. The Central Nervous System and the Gut Microbiome. Cell 2016, 167, 915–932. [Google Scholar] [CrossRef] [Green Version]
- Hsiao, E.Y.; McBride, S.W.; Hsien, S.; Sharon, G.; Hyde, E.R.; McCue, T. Microbiota modulate behavioral and physiological abnormalities associated with neurodevelopmental disorders. Cell 2013, 155, 1451–1463. [Google Scholar] [CrossRef] [Green Version]
- Braber-Ymker, M.D.; Lammens, M.; Van Putten, M.J.; Nagtegaal, I. The enteric nervous system and the musculature of the colon are altered in patients with spina bifida and spinal cord injury. Virchows Arch. 2017, 470, 175–184. [Google Scholar] [CrossRef] [Green Version]
- Stanley, D.; Mason, L.J.; Mackin, K.E.; Srikhanta, Y.; Lyras, D.; Prakash, M.; Nurgali, K.; Venegas, A.; Hill, M.; Moore, R.J.; et al. Translocation and dissemination of commensal bacteria in post-stroke infection. Nat. Med. 2016, 22, 1277–1284. [Google Scholar] [CrossRef]
- Liu, Y.C.; Qi, Z.W.; Guo, S.G.; Wang, Z.; Yu, X.Z.; Ma, S. Role of corticotrophin releasing hormone in cerebral infarction-related gastrointestinal barrier dysfunction. World J. Emerg. Med. 2011, 2, 59–65. [Google Scholar] [CrossRef] [Green Version]
- Karl, J.P.; Margolis, L.; Madslien, E.H.; Murphy, N.E.; Castellani, J.; Gundersen, Y.; Hoke, A.V.; LeVangie, M.W.; Kumar, R.; Chakraborty, N.; et al. Changes in intestinal microbiota composition and metabolism coincide with increased intestinal permeability in young adults under prolonged physiological stress. Am. J. Physiol. Gastrointest. Liver Physiol. 2017, 312, G559–G571. [Google Scholar] [CrossRef] [Green Version]
- Kigerl, K.A.; Zane, K.; Adams, K.; Sullivan, M.B.; Popovich, P.G. The spinal cord-gut-immune axis as a master regulator of health and neurological function after spinal cord injury. Exp. Neurol. 2019, 323, 113085. [Google Scholar] [CrossRef] [PubMed]
- Treangen, T.J.; Wagner, J.; Burns, M.P.; Villapol, S. Traumatic Brain Injury in Mice Induces Acute Bacterial Dysbiosis within the Fecal Microbiome. Front. Immunol. 2018, 9, 2757. [Google Scholar] [CrossRef] [PubMed] [Green Version]
- Wang, S.; Zhu, K.; Hou, X.; Hou, L. The association of traumatic brain injury, gut microbiota and the corresponding metabolites in mice. Brain Res. 2021, 1762, 147450. [Google Scholar] [CrossRef] [PubMed]
- Nicholson, S.E.; Watts, L.T.; Burmeister, D.M.; Merrill, D.; Scroggins, S.; Zou, Y.; Lai, Z.; Grandhi, R.; Lewis, A.M.; Newton, L.M.; et al. Moderate Traumatic Brain Injury Alters the Gastrointestinal Microbiome in a Time-Dependent Manner. Shock 2019, 52, 240–248. [Google Scholar] [CrossRef] [PubMed]
- Urban, R.J.; Pyles, R.B.; Stewart, C.; Ajami, N.; Randolph, M.K.; Durham, W.J.; Danesi, C.P.; Dillon, E.L.; Summons, M.J.R.; Singh, C.K.; et al. Altered Fecal Microbiome Years after Traumatic Brain Injury. J. Neurotrauma 2020, 37, 1037–1051. [Google Scholar] [CrossRef]
- Soriano, S.; Curry, K.; Sadrameli, S.S.; Wang, Q.; Nute, M.; Reeves, E. Alterations to the gut microbiome after sport-related concussion and subconcussive impacts in a collegiate football players cohort. Brain Behav. Immunity-Health 2020, 21, 100438. [Google Scholar] [CrossRef]
- Braniste, V.; Al-Asmakh, M.; Kowal, C.; Anuar, F.; Abbaspour, A.; Tóth, M.; Korecka, A.; Bakocevic, N.; Ng, L.G.; Kundu, P.; et al. The gut microbiota influences blood-brain barrier permeability in mice. Sci. Transl. Med. 2014, 6, 263ra158. [Google Scholar] [CrossRef] [Green Version]
- Hoyles, L.; Snelling, T.; Umlai, U.K.; Nicholson, J.K.; Carding, S.R.; Glen, R.C.; McArthur, S. Microbiome–host systems interactions: Protective effects of propionate upon the blood–brain barrier. Microbiome 2018, 6, 55. [Google Scholar] [CrossRef] [Green Version]
- Matcovitch-Natan, O.; Winter, D.R.; Giladi, A.; Aguilar, S.V.; Spinrad, A.; Sarrazin, S.; Ben-Yehuda, H.; David, E.; González, F.Z.; Perrin, P.; et al. Microglia development follows a stepwise program to regulate brain homeostasis. Science 2016, 353, aad8670. [Google Scholar] [CrossRef]
- Silva, Y.P.; Bernardi, A.; Frozza, R.L. The Role of Short-Chain Fatty Acids from Gut Microbiota in Gut-Brain Communication. Front. Endocrinol. 2020, 11, 25. [Google Scholar] [CrossRef] [Green Version]
- Strandwitz, P. Neurotransmitter modulation by the gut microbiota. Brain Res. 2018, 1693, 128–133. [Google Scholar] [CrossRef] [PubMed]
- Zhao, L.; Xiong, Q.; Stary, C.M.; Mahgoub, O.K.; Ye, Y.; Gu, L. Bidirectional gut-brain-microbiota axis as a potential link between inflammatory bowel disease and ischemic stroke. J. Neuroinflamm. 2018, 15, 339. [Google Scholar] [CrossRef]
- Kashtanova, D.A.; Tkacheva, O.N. The phenomenon of intestinal permeability and its association with cardiovascular disease. Current status. Cardiovasc. Ther. Prev. 2020, 19, 2474. [Google Scholar] [CrossRef]
- Feeney, D.M.; Boyeson, M.G.; Linn, R.T.; Murray, H.M.; Dail, W.G. Responses to cortical injury: I. Methodology and local effects of contusions in the rat. Brain Res. 1981, 211, 67–77. [Google Scholar] [PubMed]
- Isaev, N.K.; Novikova, S.V.; Stelmashook, E.V.; Barskov, I.V.; Silachev, D.N.; Khaspekov, L.G.; Skulachev, V.P.; Zorov, D.B. Mitochondria-targeted plastoquinone antioxidant SkQR1 decreases trauma-induced neurological deficit in rat. Biochemistry 2012, 77, 996–999. [Google Scholar] [CrossRef]
- Silachev, D.N.; Uchevatkin, A.A.; Pirogov, Y.A.; Zorov, D.B.; Isaev, N.K. Comparative evaluation of two methods for studies of experimental focal ischemia: Magnetic resonance tomography and triphenyltetrazoleum detection of brain injuries. Bull. Exp. Biol. Med. 2009, 147, 269–272. [Google Scholar] [CrossRef] [PubMed]
- Jolkkonen, J.; Puurunen, K.; Rantakömi, S.; Härkönen, A.; Haapalinna, A.; Sivenius, J. Behavioral effects of the alpha(2)-adrenoceptor antagonist, atipamezole, after focal cerebral ischemia in rats. Eur. J. Pharmacol. 2000, 400, 211–219. [Google Scholar] [CrossRef]
- Lee, J.; D’Aigle, J.; Atadja, L.; Quaicoe, V.; Honarpisheh, P.; Ganesh, B.; Hassan, A.; Graf, J.; Petrosino, J.; Putluri, N.; et al. Gut Microbiota–Derived Short-Chain Fatty Acids Promote Poststroke Recovery in Aged Mice. Circ. Res. 2020, 127, 453–465. [Google Scholar] [CrossRef]
- Schallert, T.; Fleming, S.M.; Leigh Leasure, J.; Tillerson, J.L.; Bland, S.T. CNS plasticity and assessment of forelimb sensorimotor outcome in unilateral rat models of stroke, cortical ablation, parkinsonism and spinal cord injury. Neuropharmacology 2000, 39, 777–787. [Google Scholar] [CrossRef]
- Fadrosh, D.W.; Ma, B.; Gajer, P.; Sengamalay, N.; Ott, S.; Brotman, R.M.; Ravel, J. An improved dual-indexing approach for multiplexed 16S rRNA gene sequencing on the Illumina MiSeq platform. Microbiome 2014, 2, 6. [Google Scholar] [CrossRef] [Green Version]
- Matharu, D.; Dhotre, D.; Balasubramanian, N.; Pawar, N.; Sagarkar, S.; Sakharkar, A. Repeated mild traumatic brain injury affects microbial diversity in rat jejunum. J. Biosci. 2019, 44, 120. [Google Scholar] [CrossRef] [PubMed]
- You, W.; Zhu, Y.; Wei, A.; Du, J.; Wang, Y.; Zheng, P.; Tu, M.; Wang, H.; Wen, L.; Yang, X. Traumatic Brain Injury Induces Gastrointestinal Dysfunction and Dysbiosis of Gut Microbiota Accompanied by Alterations of Bile Acid Profile. J. Neurotrauma 2022, 39, 227–237. [Google Scholar] [CrossRef] [PubMed]
- Louis, P.; Flint, H.J. Diversity, metabolism and microbial ecology of butyrate-producing bacteria from the human large intestine. FEMS Microbiol. Lett. 2009, 294, 1–8. [Google Scholar] [CrossRef] [PubMed] [Green Version]
- Bai, L.; Li, T.; Zhang, M.; Wang, S.; Gan, S.; Jia, X. Association of gut microbiota with cerebral cortex and cerebrovascular abnormality in human mild traumatic brain injury. bioRxiv 2020. [Google Scholar] [CrossRef]
- Hua, X.; Zhu, J.; Yang, T.; Guo, M.; Li, Q.; Chen, J.; Li, T. The Gut Microbiota and Associated Metabolites Are Altered in Sleep Disorder of Children with Autism Spectrum Disorders. Front. Psychiatry 2020, 11, 855. [Google Scholar] [CrossRef] [PubMed]
- Bannerman, C.A.; Douchant, K.; Sheth, P.M.; Ghasemlou, N. The gut-brain axis and beyond: Microbiome control of spinal cord injury pain in humans and rodents. Neurobiol. Pain 2020, 9, 100059. [Google Scholar] [CrossRef] [PubMed]
- Accetto, T.; Avguštin, G. Non-oral Prevotella stepping into the spotlight. Anaerobe 2021, 68, 102321. [Google Scholar] [CrossRef] [PubMed]
- Hofer, U. Pro-inflammatory Prevotella? Nat. Rev. Microbiol. 2014, 12, 5. [Google Scholar] [CrossRef]
- Berezow, A.B.; Darveau, R.P. Microbial shift and periodontitis. Periodontology 2000 2011, 55, 36–47. [Google Scholar] [CrossRef]
- Vogt, N.M.; Kerby, R.L.; Dill-McFarland, K.A.; Harding, S.J.; Merluzzi, A.P.; Johnson, S.C.; Carlsson, C.M.; Asthana, S.; Zetterberg, H.; Blennow, K.; et al. Gut microbiome alterations in Alzheimer’s disease. Sci. Rep. 2017, 7, 13537. [Google Scholar] [CrossRef]
- Hou, Y.; Xu, L.; Song, S.; Fan, W.; Wu, Q.; Tong, X.; Yan, H. Oral administration of brain protein combined with probiotics induces immune tolerance through the tryptophan pathway. Front. Mol. Neurosci. 2021, 14, 634631. [Google Scholar] [CrossRef] [PubMed]
- Li, N.; Wang, X.; Sun, C.; Wu, X.; Lu, M.; Si, Y.; Ye, X.; Wang, T.; Yu, X.; Zhao, X.; et al. Change of intestinal microbiota in cerebral ischemic stroke patients. BMC Microbiol. 2019, 19, 191. [Google Scholar] [CrossRef] [Green Version]
- Nagpal, R.; Wang, S.; Solberg Woods, L.C.; Seshie, O.; Chung, S.T.; Shively, C.A.; Register, T.C.; Craft, S.; McClain, D.A.; Yadav, H. Comparative Microbiome Signatures and Short-Chain Fatty Acids in Mouse, Rat, Non-human Primate, and Human Feces. Front. Microbiol. 2018, 9, 2897. [Google Scholar] [CrossRef] [Green Version]
- Du, D.; Tang, W.; Zhou, C.; Sun, X.; Wei, Z.; Zhong, J.; Huang, Z. Fecal Microbiota Transplantation Is a Promising Method to Restore Gut Microbiota Dysbiosis and Relieve Neurological Deficits after Traumatic Brain Injury. Oxidative Med. Cell. Longev. 2021, 2021, 5816837. [Google Scholar] [CrossRef] [PubMed]
- Barnes, D.; Ng, K.; Smits, S.; Sonnenburg, J.; Kassam, Z.; Park, K.T. Competitively Selected Donor Fecal Microbiota Transplantation: Butyrate Concentration and Diversity as Measures of Donor Quality. J. Pediatr. Gastroenterol. Nutr. 2018, 67, 185–187. [Google Scholar] [CrossRef] [PubMed]
- Letson, H.L.; Morris, J.; Biros, E.; Dobson, G.P. Conventional and Specific-Pathogen Free Rats Respond Differently to Anesthesia and Surgical Trauma. Sci. Rep. 2019, 9, 9399. [Google Scholar] [CrossRef] [PubMed]
- Hamilton, S.E.; Badovinac, V.P.; Beura, L.K.; Pierson, M.; Jameson, S.C.; Masopust, D.; Griffith, T.S. New Insights into the Immune System Using Dirty Mice. J. Immunol. 2020, 205, 3–11. [Google Scholar] [CrossRef]
- Masopust, D.; Sivula, C.P.; Jameson, S.C. Of Mice, Dirty Mice, and Men: Using Mice to Understand Human Immunology. J. Immunol. 2017, 199, 383–388. [Google Scholar] [CrossRef] [Green Version]
- Du, J.; Zayed, A.A.; Kigerl, K.A.; Zane, K.; Sullivan, M.B.; Popovich, P.G. Spinal Cord Injury Changes the Structure and Functional Potential of Gut Bacterial and Viral Communities. mSystems 2021, 6, e01356-20. [Google Scholar] [CrossRef]
- Finegold, S.M.; Molitoris, D.; Song, Y.; Liu, C.; Vaisanen, M.; Bolte, E.; McTeague, M.; Sandler, R.; Wexler, H.; Marlowe, E.M.; et al. Gastrointestinal microflora studies in late-onset autism. Clin. Infect. Dis. 2002, 35, S6–S16. [Google Scholar] [CrossRef]
- Hajiaghamemar, M.; Kilbaugh, T.; Arbogast, K.B.; Master, C.L.; Margulies, S.S. Using Serum Amino Acids to Predict Traumatic Brain Injury: A Systematic Approach to Utilize Multiple Biomarkers. Int. J. Mol. Sci. 2020, 21, 1786. [Google Scholar] [CrossRef] [PubMed] [Green Version]
- Amorini, A.M.; Lazzarino, G.; Di Pietro, V.; Signoretti, S.; Lazzarino, G.; Belli, A.; Tavazzi, B. Severity of experimental traumatic brain injury modulates changes in concentrations of cerebral free amino acids. J. Cell. Mol. Med. 2017, 21, 530–542. [Google Scholar] [CrossRef] [PubMed]
- Yabuki, Y.; Shioda, N.; Yamamoto, Y.; Shigano, M.; Kumagai, K.; Morita, M.; Fukunaga, K. Oral L-citrulline administration improves memory deficits following transient brain ischemia through cerebrovascular protection. Brain Res. 2013, 1520, 157–167. [Google Scholar] [CrossRef] [PubMed]
- Crenn, P.; Coudray-Lucas, C.; Thuillier, F.; Cynober, L.; Messing, B. Postabsorptive plasma citrulline concentration is a marker of absorptive enterocyte mass and intestinal failure in humans. Gastroenterology 2000, 119, 1496–1505. [Google Scholar] [CrossRef]
- Jianfeng, G.; Weiming, Z.; Ning, L.; Fangnan, L.; Li, T.; Nan, L.; Jieshou, L. Serum citrulline is a simple quantitative marker for small intestinal enterocytes mass and absorption function in short bowel patients. J. Surg. Res. 2005, 127, 177–182. [Google Scholar] [CrossRef]
- Pan, P.; Song, Y.; Du, X.; Bai, L.; Hua, X.; Xiao, Y.; Yu, X. Intestinal barrier dysfunction following traumatic brain injury. Neurol. Sci. 2019, 40, 1105–1110. [Google Scholar] [CrossRef]
- Louin, G.; Neveux, N.; Cynober, L.; Plotkine, M.; Marchand-Leroux, C.; Jafarian-Tehrani, M. Plasma concentrations of arginine and related amino acids following traumatic brain injury: Proline as a promising biomarker of brain damage severity. Nitric Oxide 2007, 17, 91–97. [Google Scholar] [CrossRef]
- Zheng, F.; Xia, Z.-A.; Zeng, Y.-F.; Luo, J.-K.; Sun, P.; Cui, H.-J.; Wang, Y.; Tang, T.; Zhou, Y.-T. Plasma metabolomics profiles in rats with acute traumatic brain injury. PLoS ONE 2017, 12, e0182025. [Google Scholar]
- Christgen, S.L.; Becker, D.F. Role of Proline in Pathogen and Host Interactions. Antioxid. Redox Signal. 2019, 30, 683–709. [Google Scholar] [CrossRef]
- Liu, M.; Wang, Y.; Yang, C.; Ruan, Y.; Bai, C.; Chu, Q.; Cui, Y.; Chen, C.; Ying, G.; Li, B. Inhibiting both proline biosynthesis and lipogenesis synergistically suppresses tumor growth. J. Exp. Med. 2020, 217, e20191226. [Google Scholar] [CrossRef]
- Andrade, V.S.; Rojas, D.B.; De Andrade, R.B.; Kim, T.D.H.; Vizuete, A.F.; Zanatta, Â.; Wajner, M.; Gonçalves, C.-A.S.; Wannmacher, C.M.D. A Possible Anti-Inflammatory Effect of Proline in the Brain Cortex and Cerebellum of Rats. Mol. Neurobiol. 2018, 55, 4068–4077. [Google Scholar] [CrossRef] [PubMed]
- Delwing, D.; Bavaresco, C.; Wannmacher, C.M.; Wajner, M.; Dutra-Filho, C.; Wyse, A.T. Proline induces oxidative stress in cerebral cortex of rats. Int. J. Dev. Neurosci. 2003, 21, 105–110. [Google Scholar] [CrossRef]
- Zhang, Z.; Rasmussen, L.; Saraswati, M.; Koehler, R.C.; Robertson, C.L.; Kannan, S. Traumatic Injury Leads to Inflammation and Altered Tryptophan Metabolism in the Juvenile Rabbit Brain. J. Neurotrauma 2019, 36, 74–86. [Google Scholar] [CrossRef]
- Saito, A.; Niwa, T.; Maeda, K.; Kobayashi, K.; Yamamoto, Y.; Ohta, K. Tryptophan and indolic tryptophan metabolites in chronic renal failure. Am. J. Clin. Nutr. 1980, 33, 1402–1406. [Google Scholar] [CrossRef] [PubMed] [Green Version]
- Andrianova, N.V.; Popkov, V.A.; Klimenko, N.S.; Tyakht, A.V.; Baydakova, G.V.; Frolova, O.Y.; Zorova, L.D.; Pevzner, I.B.; Zorov, D.B.; Plotnikov, E.Y. Microbiome-Metabolome Signature of Acute Kidney Injury. Metabolites 2020, 10, 142. [Google Scholar] [CrossRef] [PubMed] [Green Version]
- Bounes, F.V.; Faure, G.; Rouget, A.; Conil, J.-M.; Georges, B.; Geeraerts, T.; Fourcade, O.; Minville, V.; Delmas, C. Plasma free carnitine in severe trauma: Influence of the association with traumatic brain injury. Injury 2018, 49, 538–542. [Google Scholar] [CrossRef]
- Ussher, J.R.; Lopaschuk, G.D.; Arduini, A. Gut microbiota metabolism of L-carnitine and cardiovascular risk. Atherosclerosis 2013, 231, 456–461. [Google Scholar] [CrossRef]
- Meyfroidt, G.; Baguley, I.J.; Menon, D.K. Paroxysmal sympathetic hyperactivity: The storm after acute brain injury. Lancet Neurol. 2017, 16, 721–729. [Google Scholar] [CrossRef]


| Amino Acid | 0 Day—Before the Brain Injury | 3rd Day | 7th day | p0–7 | p3–7 | p0–3 |
|---|---|---|---|---|---|---|
| Citrulline. AA Cit | 37.63 (6.303) | 32.65 (5.788) | 31.99 (3.532) | * | * | |
| Tryptophan. AA Trp | 4.76 (1.410) | 4.10 (1.057) | 4.37 (1.090) | * | ||
| Free carnitine. AC C0 | 16.61 (4.049) | 16.48 (4.860) | 17.51 (3.971) | * | ||
| Palmitoylcarnitine.AC C16 | 0.04 (0.011) | 0.04 (0.012) | 0.05 (0.016) | * | ||
| Oleoylcarnitine. AC C18:1 | 0.02 (0.008) | 0.02 (0.011) | 0.033 (0.009) | * | ||
| Propionyl carnitine. AC C3 | 0.81 (0.494) | 0.74 (0.361) | 0.59 (0.394) | * | * | |
| Butyryl carnitine. AC C4 | 0.25 (0.086) | 0.24 (0.079) | 0.18 (0.092) | * | ||
| Ratio free carnitine/(palmitoylcarnitine + stearoylcarnitine). Ratio C0/(C16 + C18) | 349.79 (120.934) | 331.71 (128.36) | 263.67 (93.066) | * | ||
| Ratio propionyl carnitine/free carnitine. Ratio C3/C0 | 0.05 (0.027) | 0.05 (0.026) | 0.034 (0.020) | * | * | |
| Ratio propionyl carnitine/acetylcarnitine. Ratio C3/C2 | 0.07 (0.037) | 0.07 (0.042) | 0.05 (0.038) | * | * | |
| Ratio propionyl carnitine/methionine. Ratio C3/Met | 0.026 (0.020) | 0.03 (0.013) | 0.02 (0.011) | * | ||
| Ratio (hexanoylcarnitine + octanoalkarnitine + decenoalkarnitine)/(palmitoylcarnitine + stearoylcarnitine + oleoylcarnitine). Ratio MCAD | 0.65 (0.239) | 0.68 (0.187) | 0.51 (0.160) | * |
| Amino Acid | Group 1 | Group 2 | p-Value for Pre-TBI | p-Value for Fold Change (Day 3 vs. 7) | ||||
|---|---|---|---|---|---|---|---|---|
| Pre-TBI | Day 3 | Day 7 | Pre-TBI | Day 3 | Day 7 | |||
| Proline. AA Pro | 79.25 (8.379) | 74.34 (13.034) | 68.56 (13.783) | 101.55 (13.671) | 81.27 (19.061) | 78.62 (22.212) | * | 0.44 |
| Ratio phenylalanine/tyrosine. Ratio phe/tyr | 0.89 (0.161) | 0.93 (0.152) | 0.97 (0.172) | 0.87 (0.218) | 0.80 (0.113) | 1.10 (0.143) | * | |
Publisher’s Note: MDPI stays neutral with regard to jurisdictional claims in published maps and institutional affiliations. |
© 2022 by the authors. Licensee MDPI, Basel, Switzerland. This article is an open access article distributed under the terms and conditions of the Creative Commons Attribution (CC BY) license (https://creativecommons.org/licenses/by/4.0/).
Share and Cite
Taraskina, A.; Ignatyeva, O.; Lisovaya, D.; Ivanov, M.; Ivanova, L.; Golovicheva, V.; Baydakova, G.; Silachev, D.; Popkov, V.; Ivanets, T.; et al. Effects of Traumatic Brain Injury on the Gut Microbiota Composition and Serum Amino Acid Profile in Rats. Cells 2022, 11, 1409. https://doi.org/10.3390/cells11091409
Taraskina A, Ignatyeva O, Lisovaya D, Ivanov M, Ivanova L, Golovicheva V, Baydakova G, Silachev D, Popkov V, Ivanets T, et al. Effects of Traumatic Brain Injury on the Gut Microbiota Composition and Serum Amino Acid Profile in Rats. Cells. 2022; 11(9):1409. https://doi.org/10.3390/cells11091409
Chicago/Turabian StyleTaraskina, Anastasiia, Olga Ignatyeva, Darya Lisovaya, Mikhail Ivanov, Lyudmila Ivanova, Viktoriya Golovicheva, Galina Baydakova, Denis Silachev, Vasiliy Popkov, Tatyana Ivanets, and et al. 2022. "Effects of Traumatic Brain Injury on the Gut Microbiota Composition and Serum Amino Acid Profile in Rats" Cells 11, no. 9: 1409. https://doi.org/10.3390/cells11091409
APA StyleTaraskina, A., Ignatyeva, O., Lisovaya, D., Ivanov, M., Ivanova, L., Golovicheva, V., Baydakova, G., Silachev, D., Popkov, V., Ivanets, T., Kashtanova, D., Yudin, V., Makarov, V., Abramov, I., Lukashina, M., Rakova, V., Zagainova, A., Zorov, D., Plotnikov, E., ... Yudin, S. (2022). Effects of Traumatic Brain Injury on the Gut Microbiota Composition and Serum Amino Acid Profile in Rats. Cells, 11(9), 1409. https://doi.org/10.3390/cells11091409