
Metabolic Reprogramming and Its Relationship to Survival in Hepatocellular Carcinoma

 ,
,  and
and 
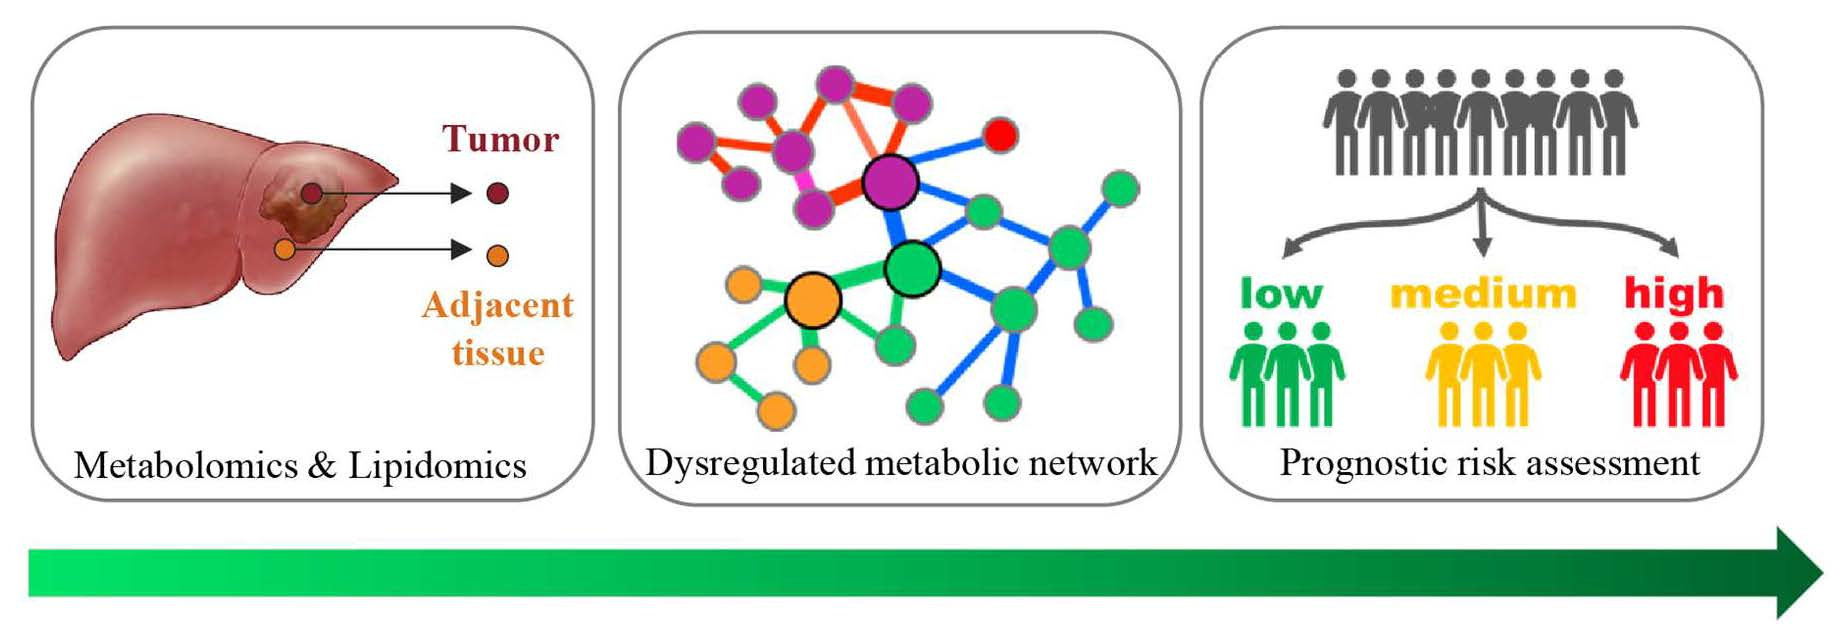
Abstract
:
1. Introduction
2. Materials and Methods
2.1. Subjects
2.2. Nontargeted Metabolomics and Lipidomics Analysis
2.3. Gene Expression Analysis
2.4. Statistical Analysis
3. Results
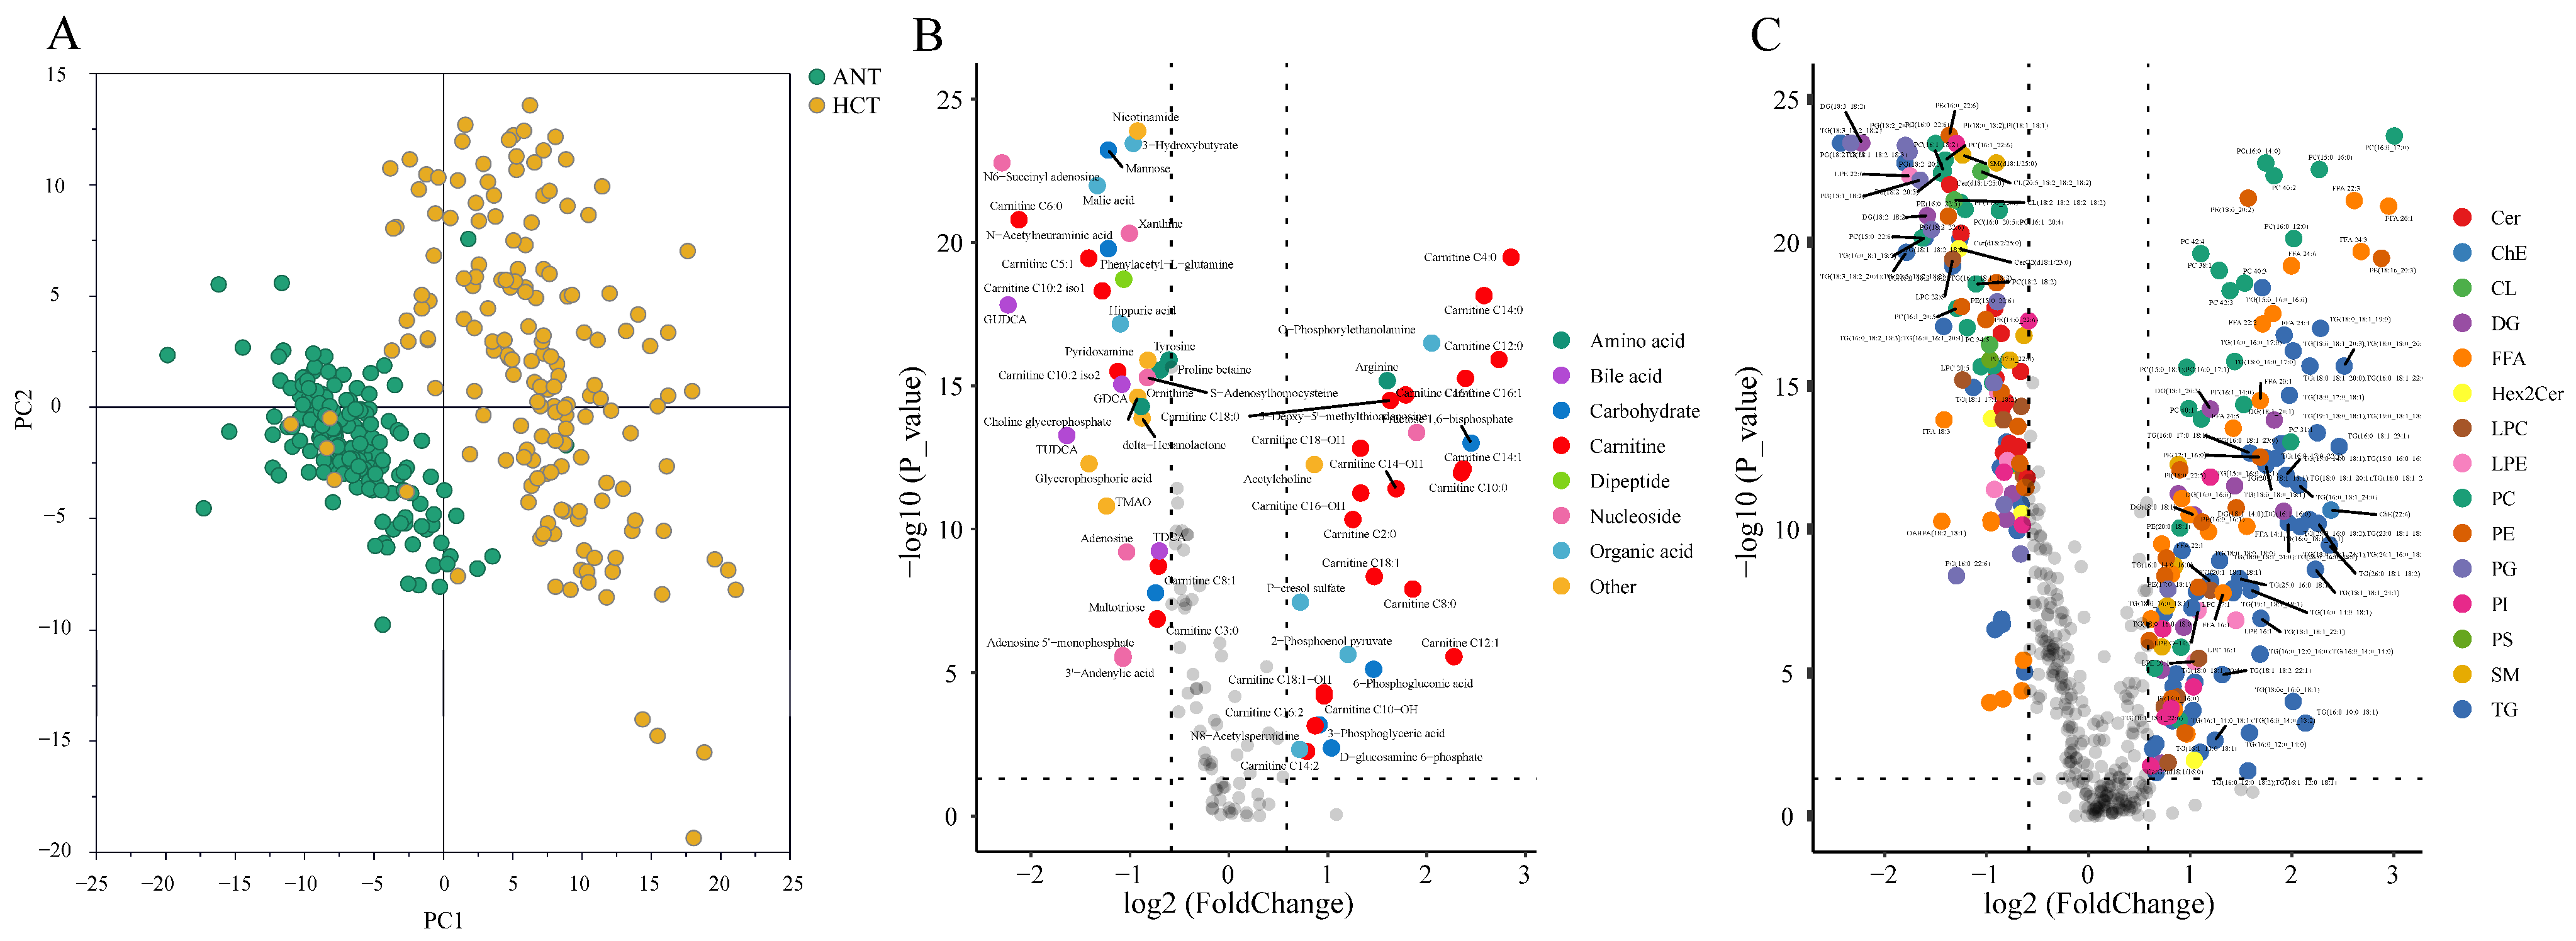
3.1. Comprehensive Characterization of the Liver Tissue Metabolome and Lipidome
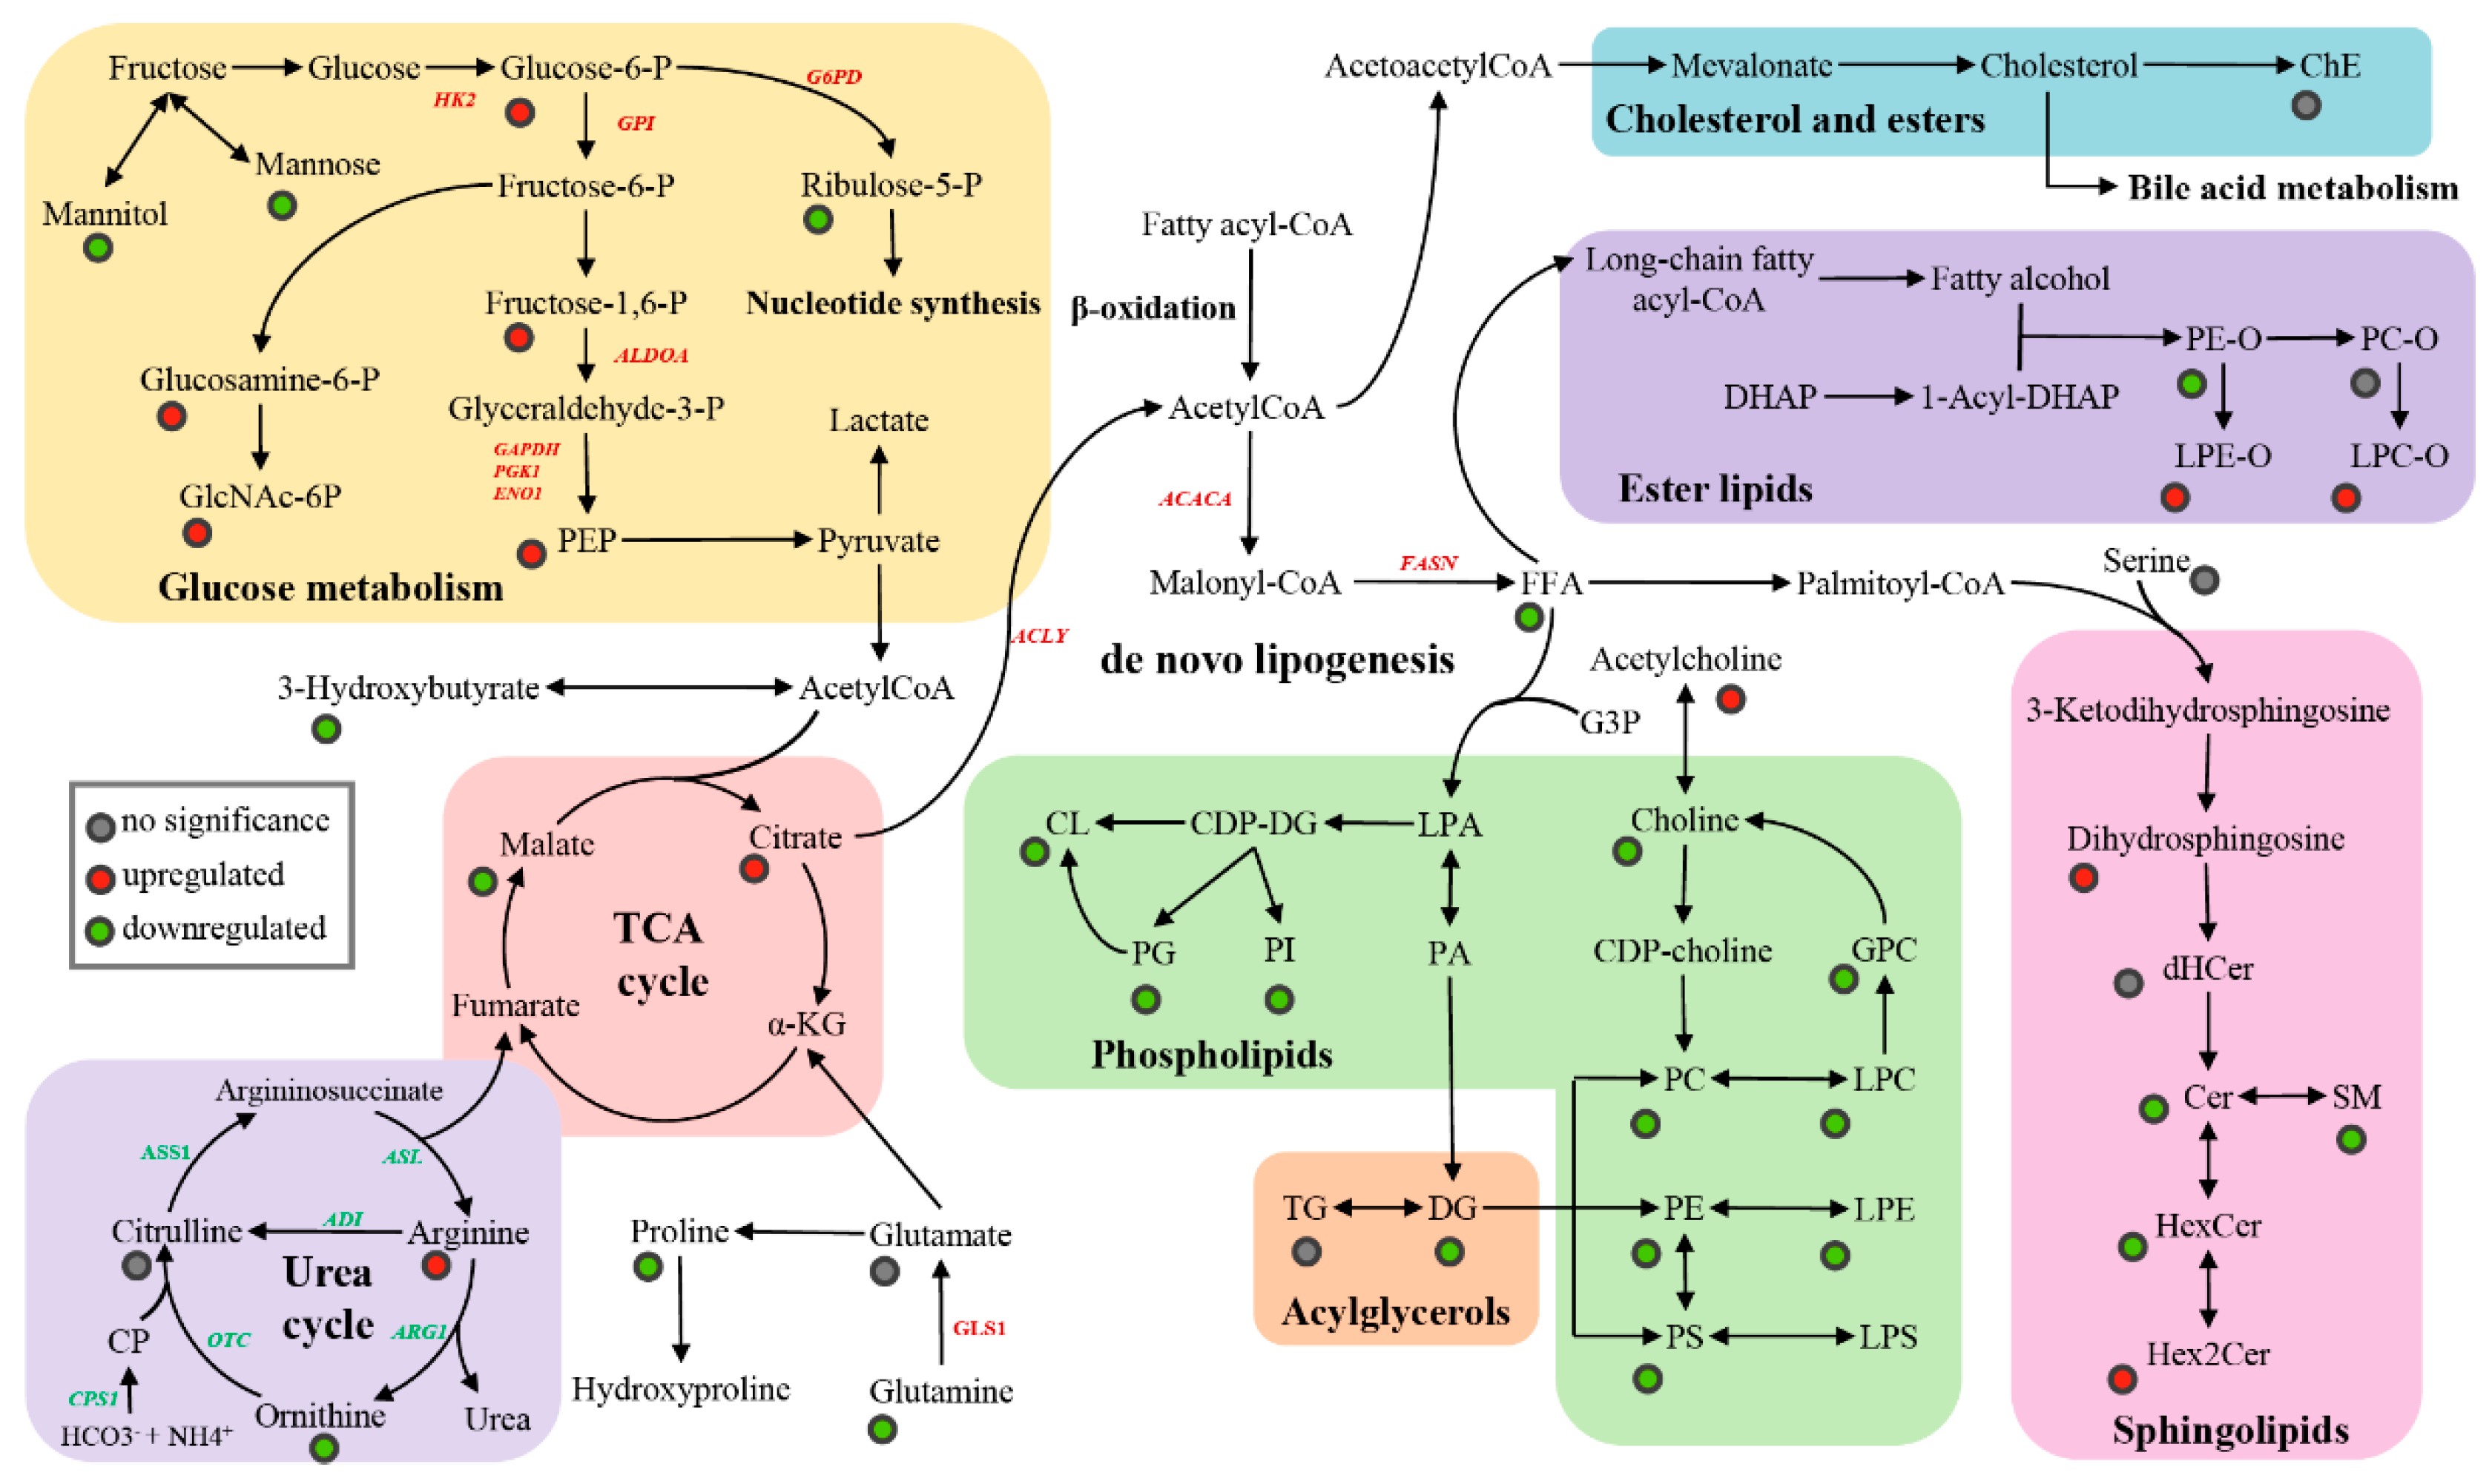
3.2. Metabolic Disruptions in HCT Compared to ANT
3.2.1. Metabolites
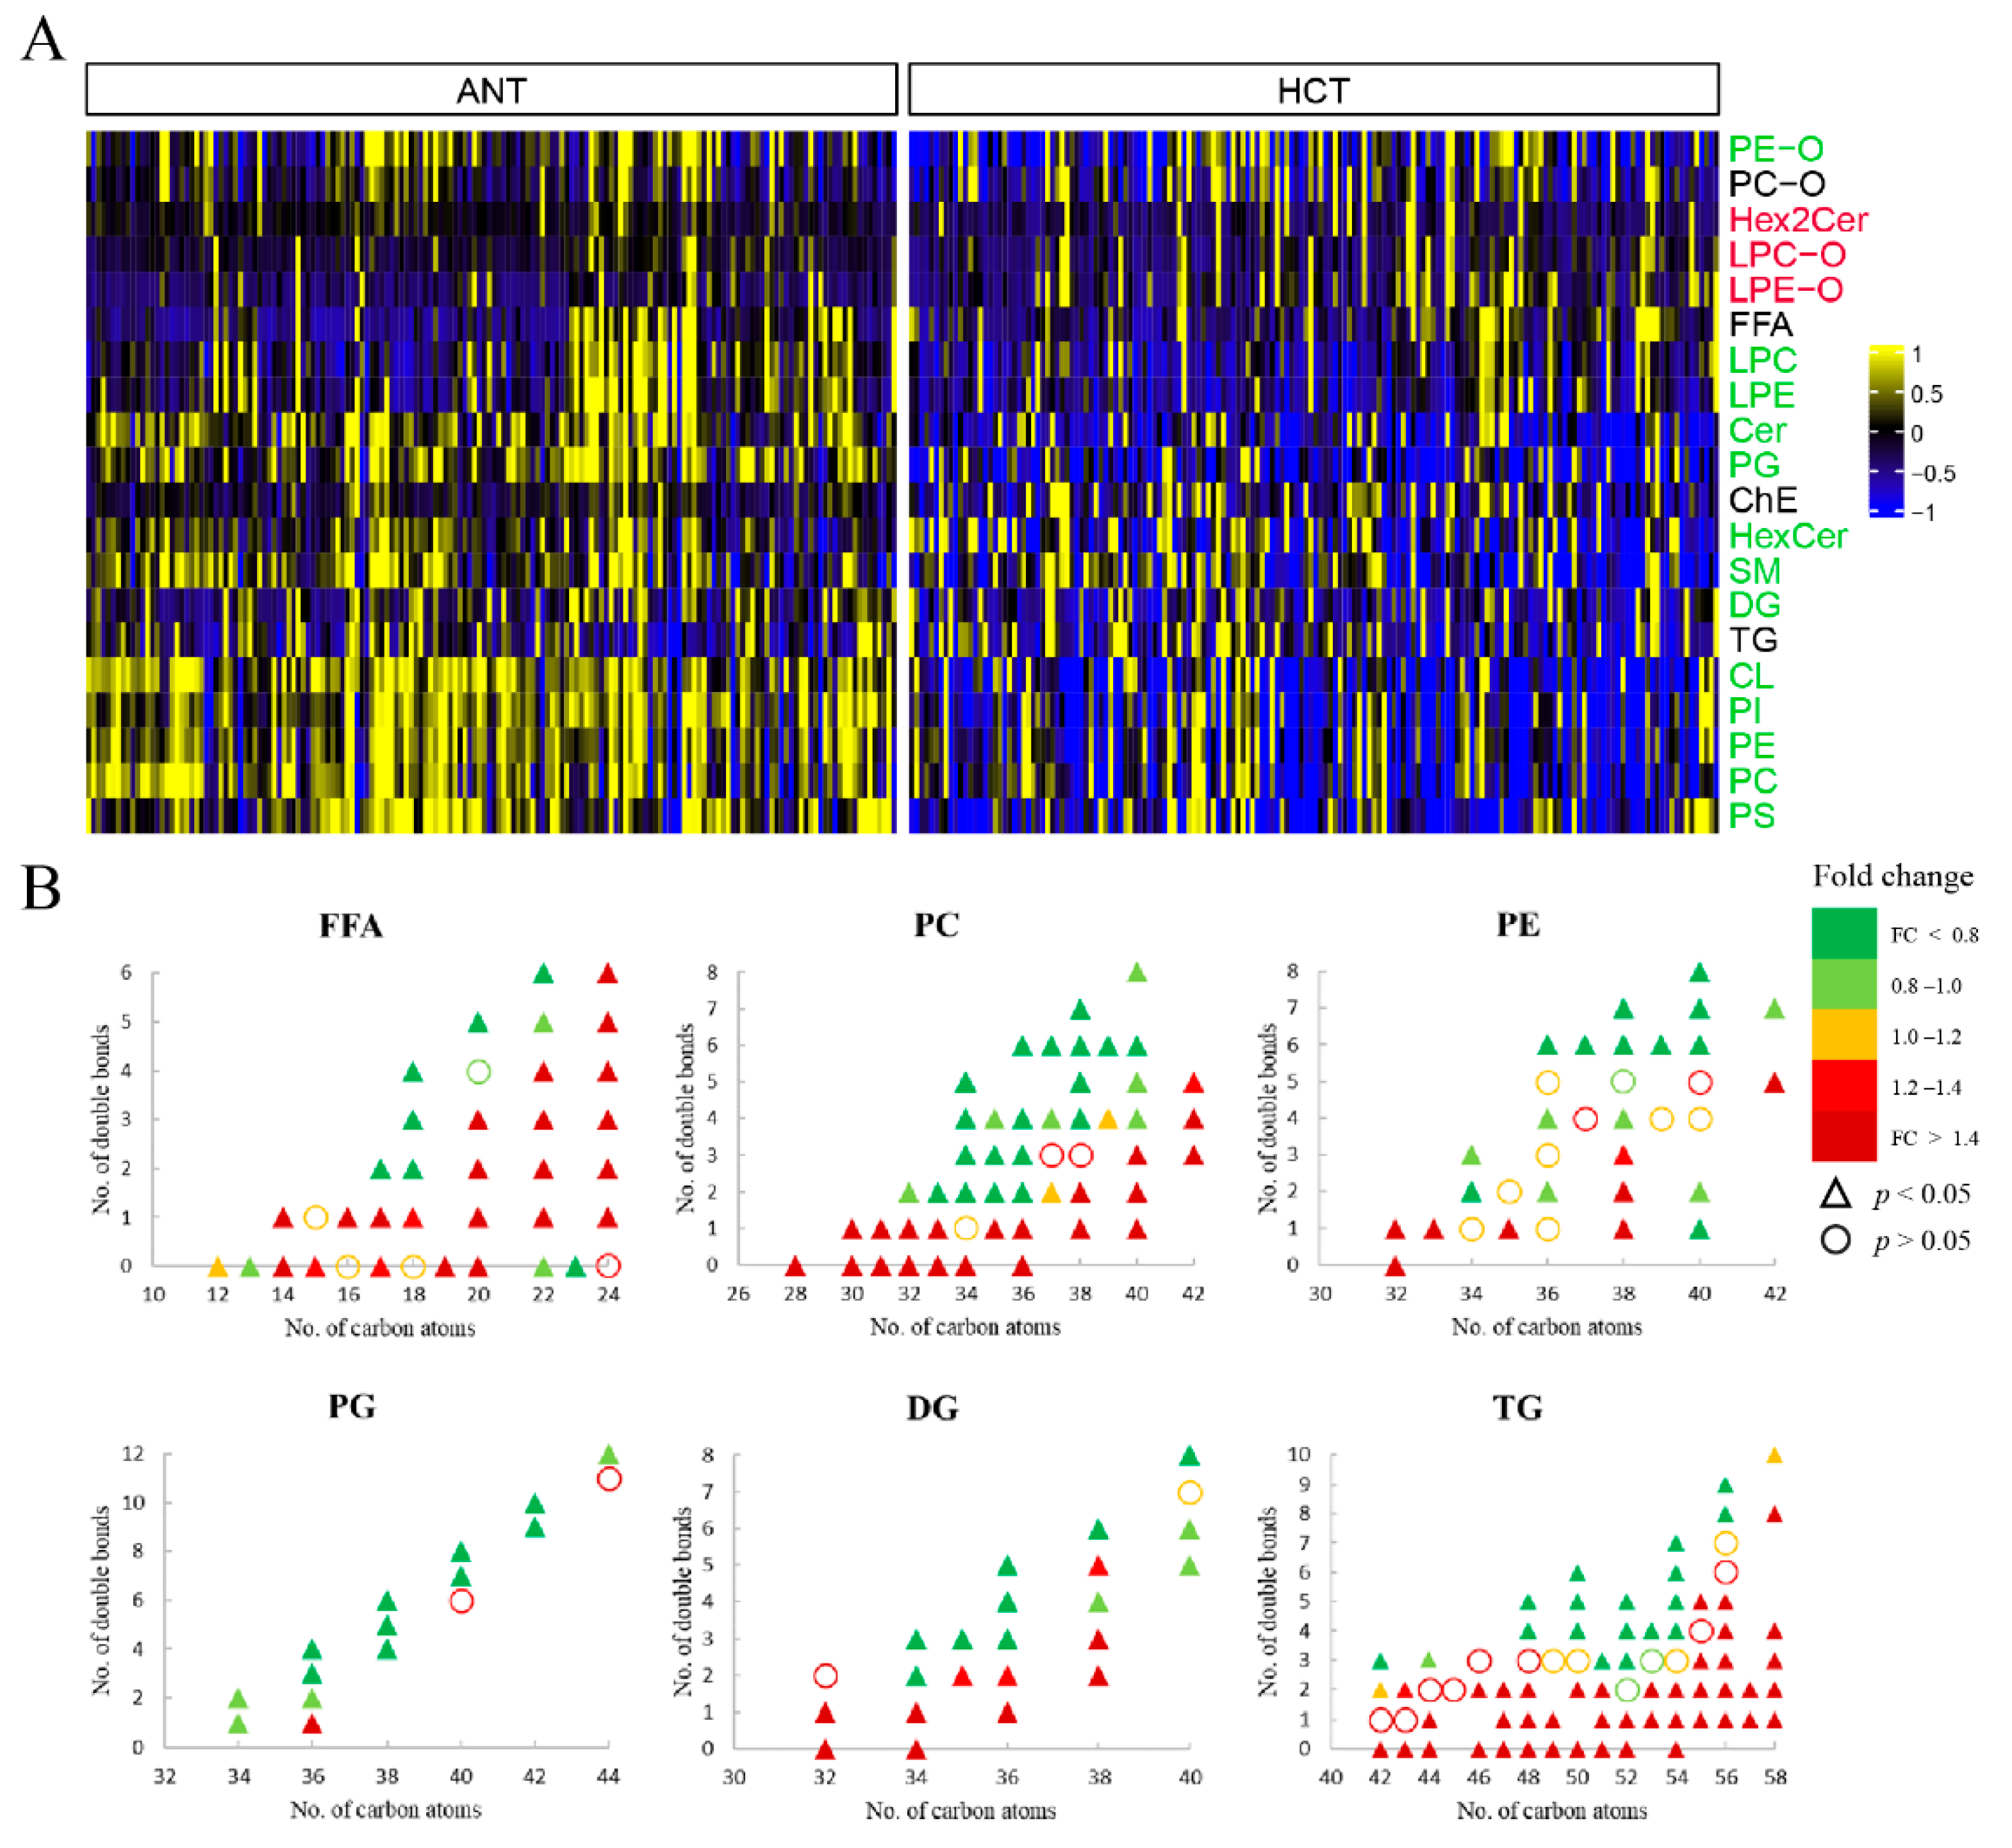
3.2.2. Lipids
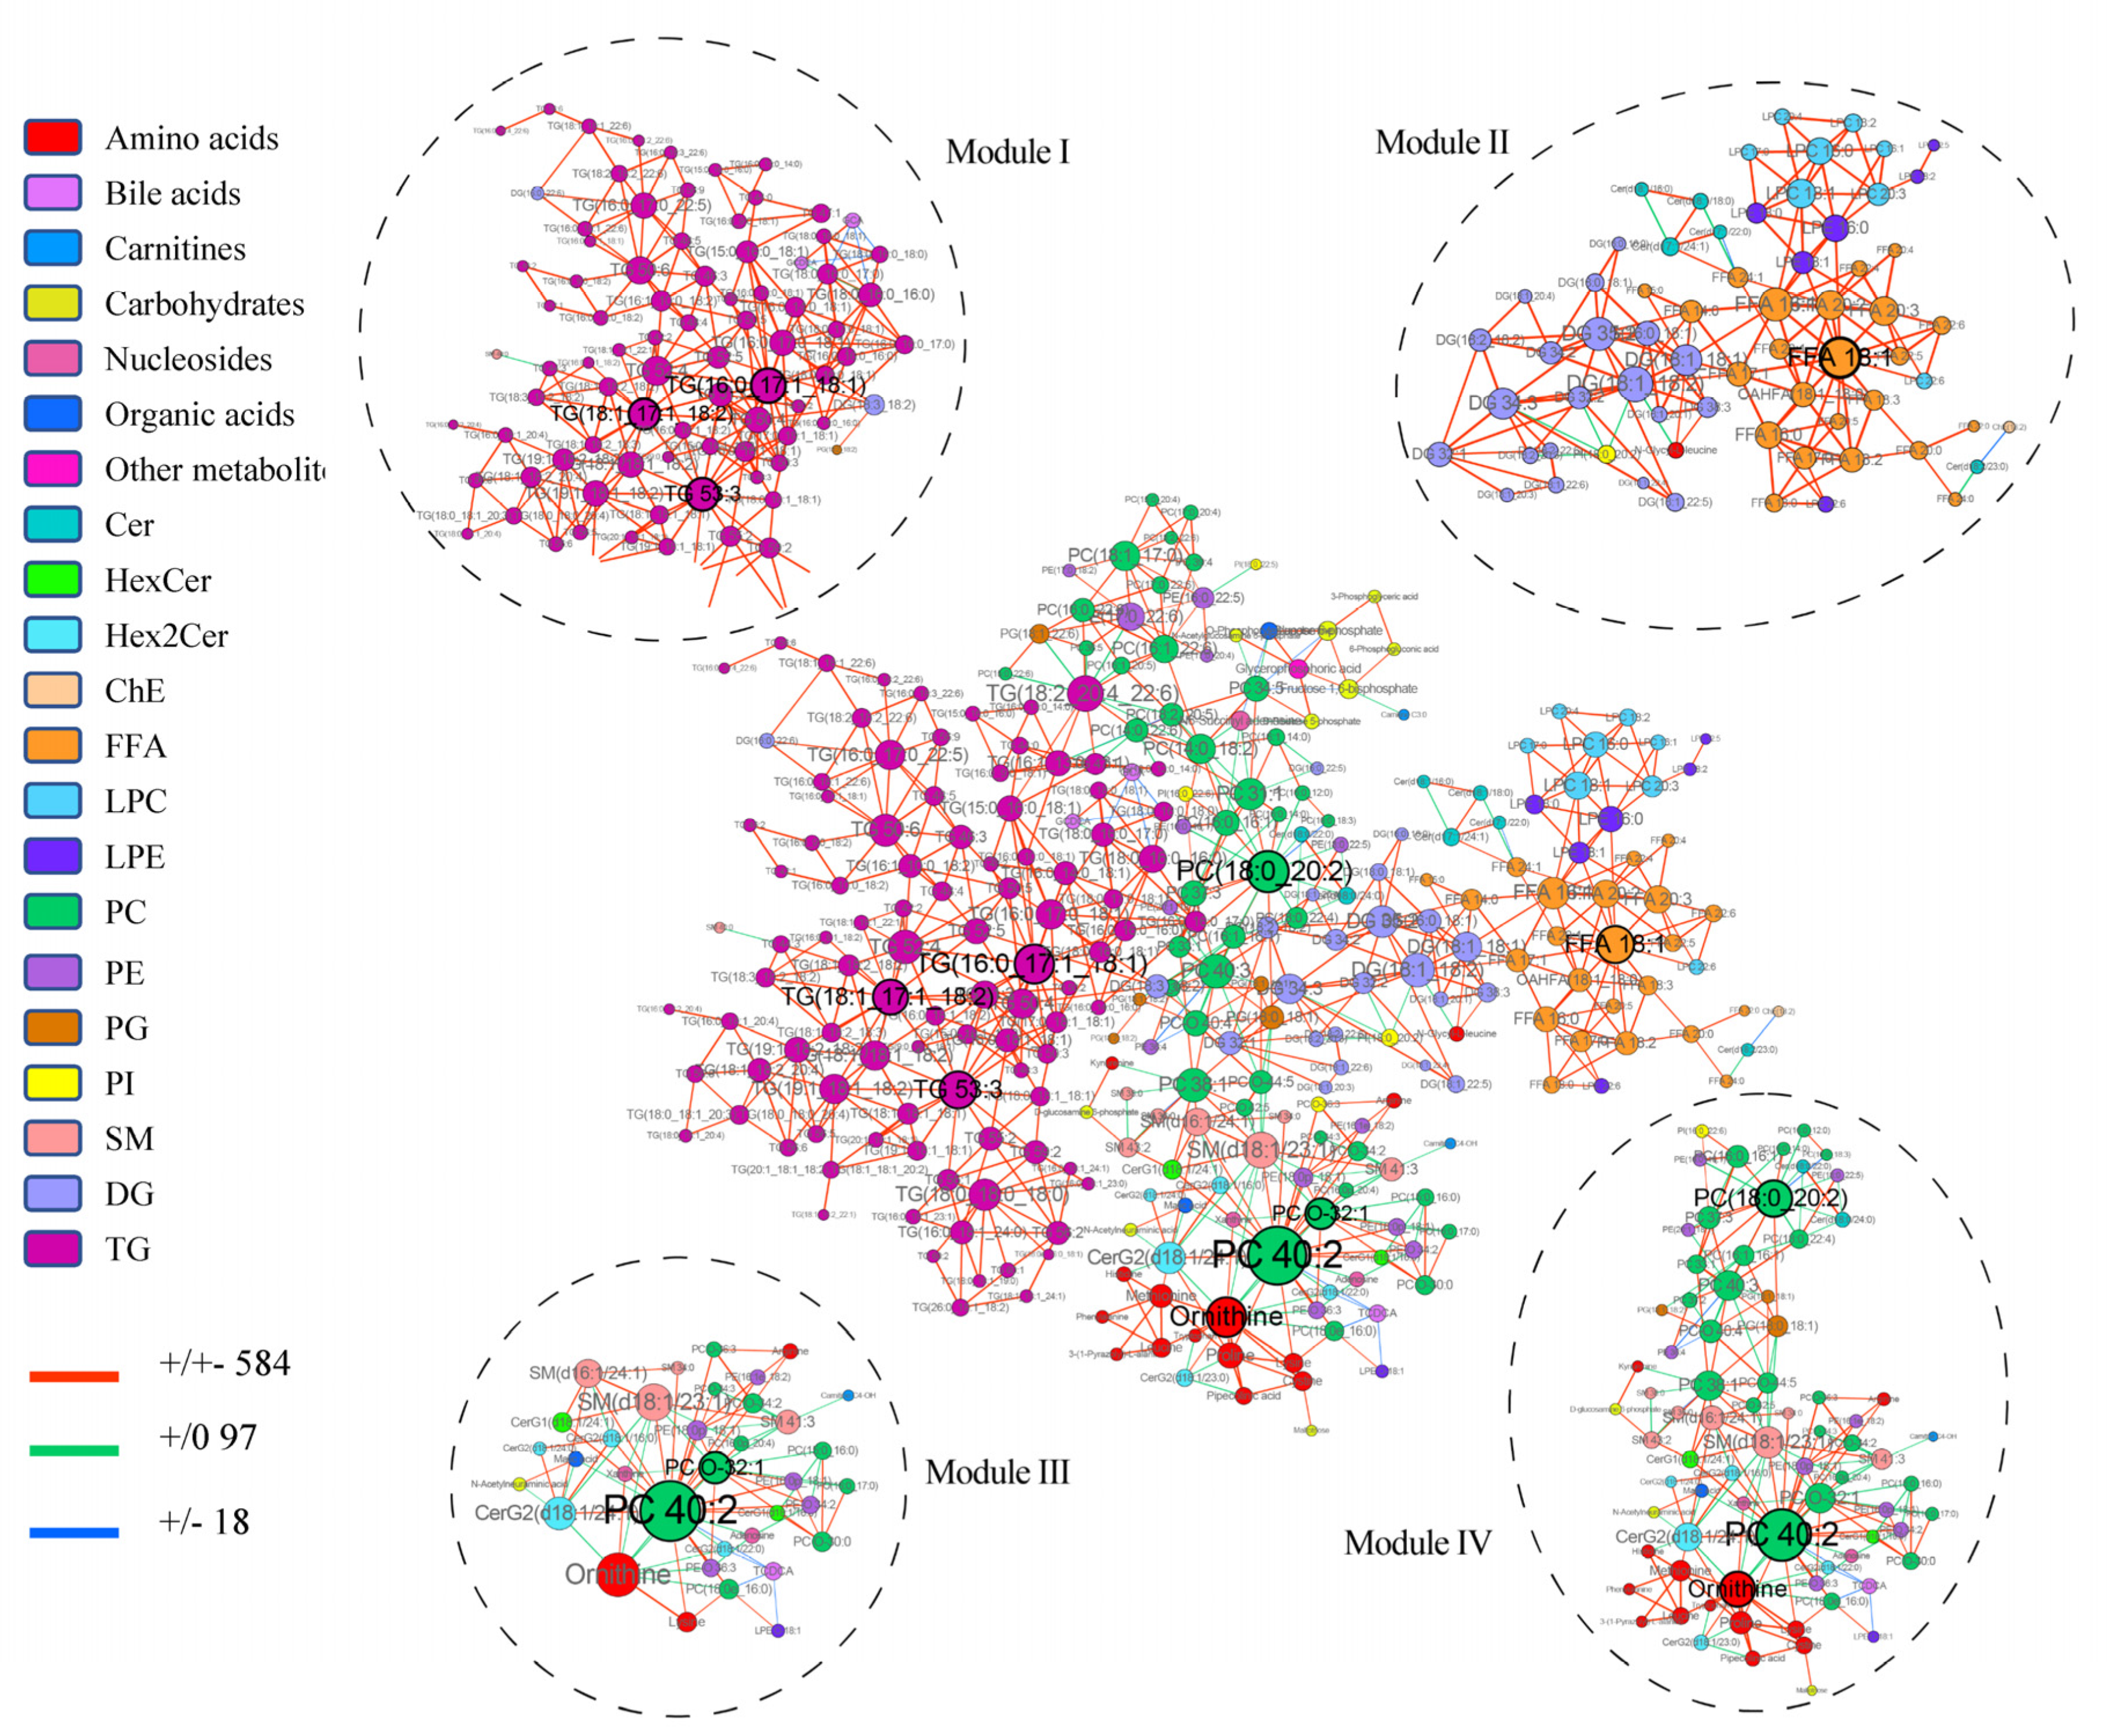
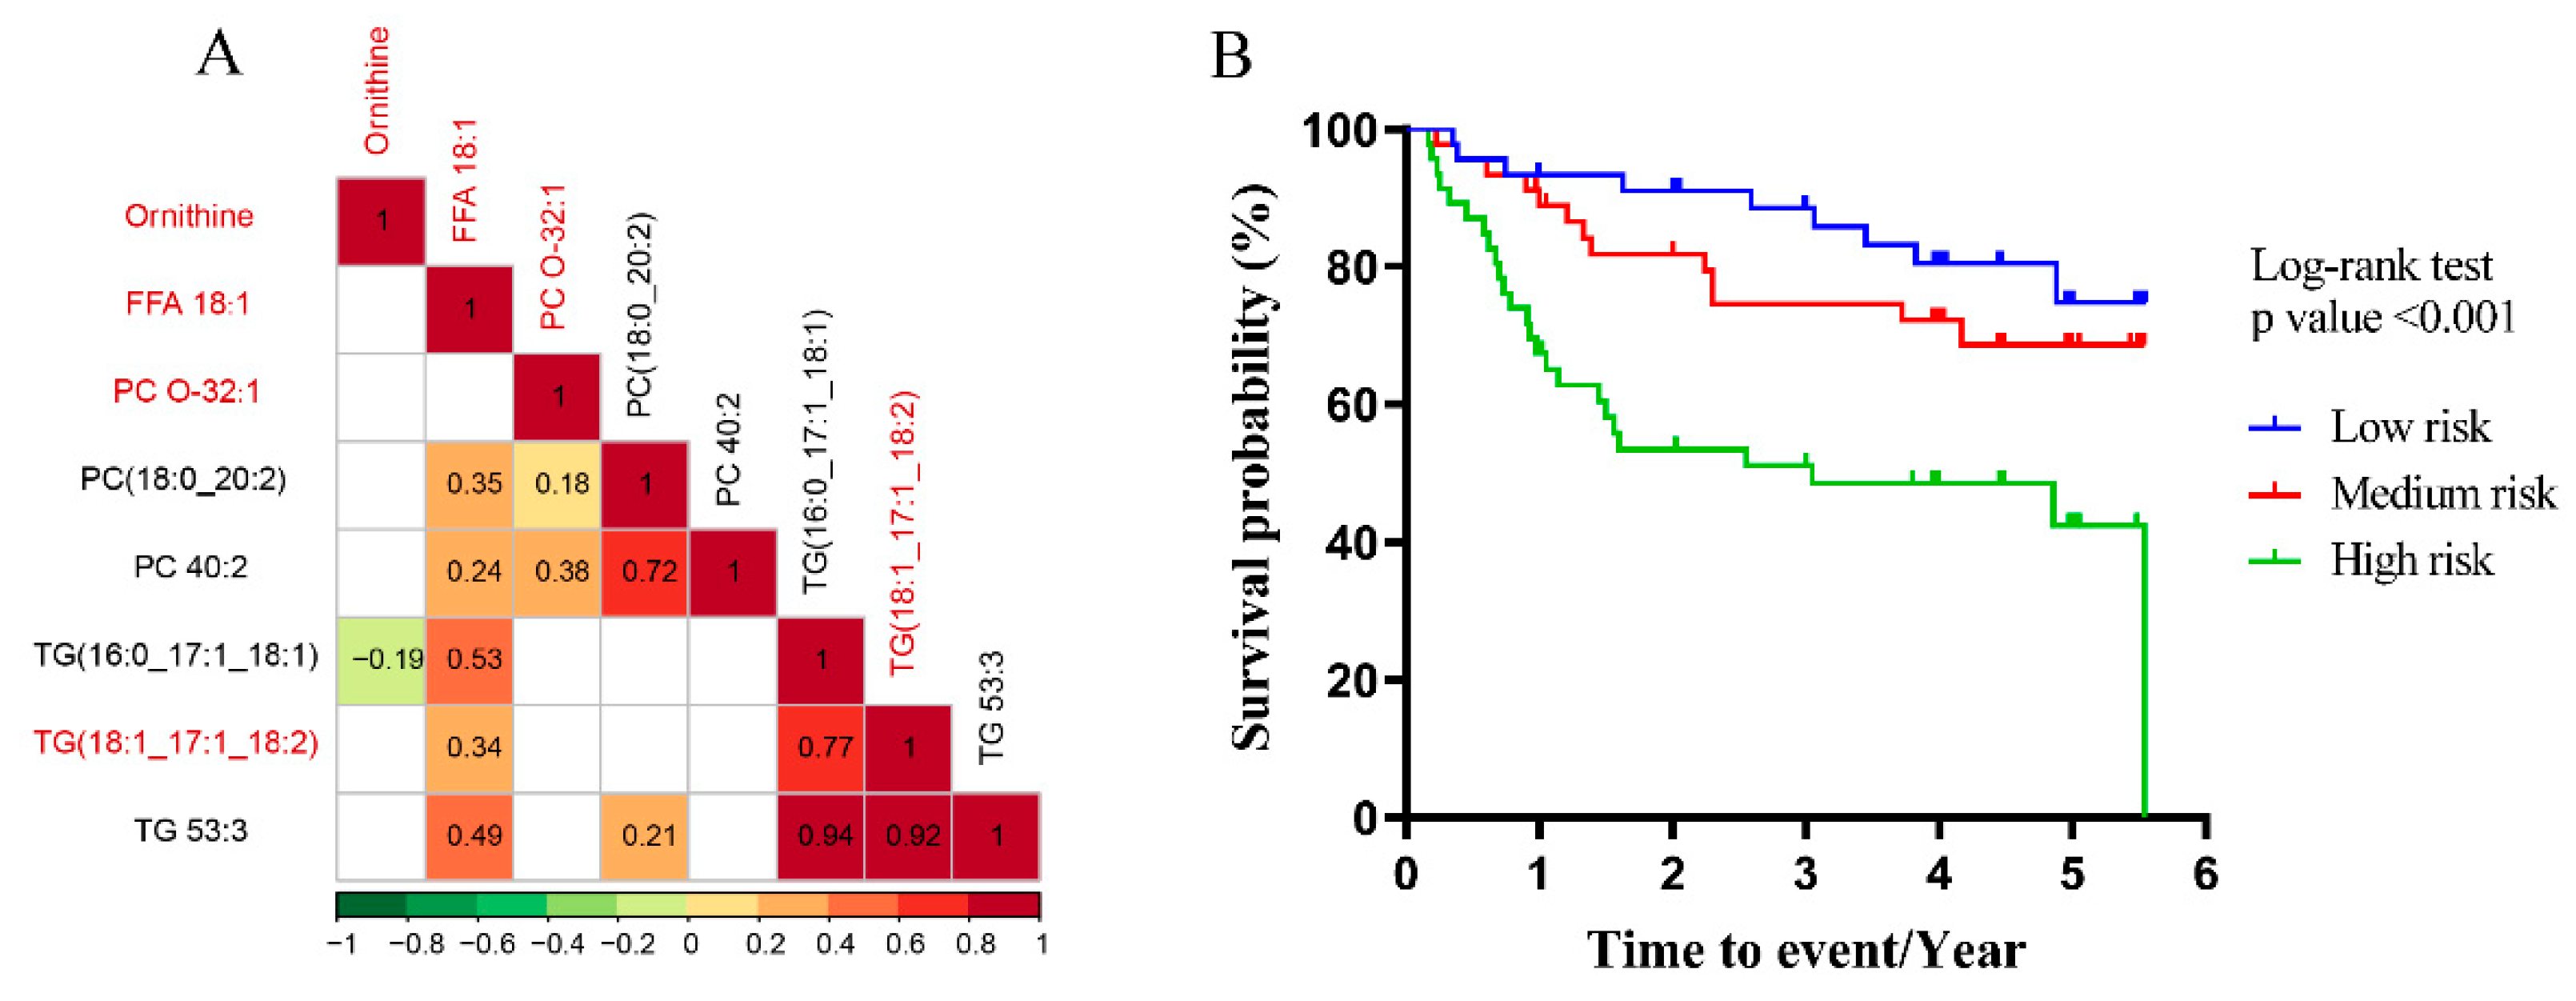
3.3. Multiscale Embedded Correlation Networks to Reveal Dysregulated Modules Associated with Prognosis
4. Discussion
5. Conclusions
Supplementary Materials
Author Contributions
Funding
Institutional Review Board Statement
Informed Consent Statement
Data Availability Statement
Acknowledgments
Conflicts of Interest
Abbreviations
References
- Sung, H.; Ferlay, J.; Siegel, R.L.; Laversanne, M.; Soerjomataram, I.; Jemal, A.; Bray, F. Global cancer statistics 2020: GLOBOCAN estimates of incidence and mortality worldwide for 36 cancers in 185 countries. CA Cancer J. Clin. 2021, 71, 209–249. [Google Scholar] [CrossRef] [PubMed]
- Luo, P.; Yin, P.; Hua, R.; Tan, Y.; Li, Z.; Qiu, G.; Yin, Z.; Xie, X.; Wang, X.; Chen, W.; et al. A Large-Scale, multicenter serum metabolite biomarker identification study for the early detection of hepatocellular carcinoma. Hepatology 2018, 67, 662–675. [Google Scholar] [CrossRef] [PubMed]
- Nault, J.-C.; Villanueva, A. Biomarkers for Hepatobiliary Cancers. Hepatology 2021, 73, 115–127. [Google Scholar] [CrossRef] [PubMed]
- Pavlova, N.N.; Thompson, C.B. The Emerging Hallmarks of Cancer Metabolism. Cell Metab. 2016, 23, 27–47. [Google Scholar] [CrossRef] [Green Version]
- Cancer Genome Atlas Research Network. Comprehensive and Integrative Genomic Characterization of Hepatocellular Carcinoma. Cell 2017, 169, 1327–1341.e23. [Google Scholar] [CrossRef] [Green Version]
- Gao, Q.; Zhu, H.; Dong, L.; Shi, W.; Chen, R.; Song, Z.; Huang, C.; Li, J.; Dong, X.; Zhou, Y.; et al. Integrated Proteogenomic Characterization of HBV-Related Hepatocellular Carcinoma. Cell 2019, 179, 561–577.e22. [Google Scholar] [CrossRef]
- Huang, Q.; Tan, Y.; Yin, P.; Ye, G.; Gao, P.; Lu, X.; Wang, H.; Xu, G. Metabolic Characterization of Hepatocellular Carcinoma Using Nontargeted Tissue Metabolomics. Cancer Res. 2013, 73, 4992–5002. [Google Scholar] [CrossRef] [Green Version]
- Ismail, I.T.; Elfert, A.; Helal, M.; Salama, I.; El-Said, H.; Fiehn, O. Remodeling Lipids in the Transition from Chronic Liver Disease to Hepatocellular Carcinoma. Cancers 2021, 13, 88. [Google Scholar] [CrossRef]
- Johnson, C.H.; Ivanisevic, J.; Siuzdak, G. Metabolomics: Beyond biomarkers and towards mechanisms. Nat. Rev. Mol. Cell Biol. 2016, 17, 451–459. [Google Scholar] [CrossRef] [Green Version]
- Rinschen, M.M.; Ivanisevic, J.; Giera, M.; Siuzdak, G. Identification of bioactive metabolites using activity metabolomics. Nat. Rev. Mol. Cell Biol. 2019, 20, 353–367. [Google Scholar] [CrossRef]
- Intlekofer, A.M.; Dematteo, R.G.; Venneti, S.; Finley, L.W.S.; Lu, C.; Judkins, A.R.; Rustenburg, A.S.; Grinaway, P.B.; Chodera, J.D.; Cross, J.R.; et al. Hypoxia Induces Production of L-2-Hydroxyglutarate. Cell Metab. 2015, 22, 304–311. [Google Scholar] [CrossRef] [Green Version]
- McBrayer, S.K.; Mayers, J.R.; DiNatale, G.J.; Shi, D.D.; Khanal, J.; Chakraborty, A.A.; Sarosiek, K.A.; Briggs, K.J.; Robbins, A.K.; Sewastianik, T.; et al. Transaminase Inhibition by 2-Hydroxyglutarate Impairs Glutamate Biosynthesis and Redox Homeostasis in Glioma. Cell 2018, 175, 101–116.e25. [Google Scholar] [CrossRef] [PubMed] [Green Version]
- Sciacovelli, M.; Goncalves, E.; Johnson, T.I.; Zecchini, V.R.; da Costa, A.S.H.; Gaude, E.; Drubbel, A.V.; Theobald, S.J.; Abbo, S.R.; Tran, M.G.B.; et al. Fumarate is an epigenetic modifier that elicits epithelial-to-Mesenchymal transition. Nature 2016, 537, 544–547. [Google Scholar] [CrossRef]
- Pollard, P.J.; Briere, J.J.; Alam, N.A.; Barwell, J.; Barclay, E.; Wortham, N.C.; Hunt, T.; Mitchell, M.; Olpin, S.; Moat, S.J.; et al. Accumulation of Krebs cycle intermediates and over-expression of HIF1 alpha in tumours which result from germline FH and SDH mutations. Hum. Mol. Genet. 2005, 14, 2231–2239. [Google Scholar] [CrossRef] [PubMed]
- Baltazar, F.; Afonso, J.; Costa, M.; Granja, S. Lactate Beyond a Waste Metabolite: Metabolic Affairs and Signaling in Malignancy. Front. Oncol. 2020, 10, 231. [Google Scholar] [CrossRef] [PubMed] [Green Version]
- Rai, S.K.; Bril, F.; Hatch, H.M.; Xu, Y.; Shelton, L.; Kalavalapalli, S.; Click, A.; Lee, D.; Beecher, C.; Kirby, A.; et al. Targeting pheochromocytoma/paraganglioma with polyamine inhibitors. Metab.-Clin. Exp. 2020, 110, 154297. [Google Scholar] [CrossRef] [PubMed]
- Zhou, L.; Wang, Z.; Hu, C.; Zhang, C.; Kovatcheva-Datchary, P.; Yu, D.; Liu, S.; Ren, F.; Wang, X.; Li, Y.; et al. Integrated Metabolomics and Lipidomics Analyses Reveal Metabolic Reprogramming in Human Glioma with IDH1 Mutation. J. Proteome Res. 2019, 18, 960–969. [Google Scholar] [CrossRef] [PubMed]
- Zhao, X.; Zeng, Z.; Chen, A.; Lu, X.; Zhao, C.; Hu, C.; Zhou, L.; Liu, X.; Wang, X.; Hou, X. Comprehensive strategy to construct in-House database for accurate and batch identification of small molecular metabolites. Anal. Chem. 2018, 90, 7635–7643. [Google Scholar] [CrossRef]
- Chen, S.; Hoene, M.; Li, J.; Li, Y.; Zhao, X.; Haering, H.-U.; Schleicher, E.D.; Weigert, C.; Xu, G.; Lehmann, R. Simultaneous extraction of metabolome and lipidome with methyl tert-butyl ether from a single small tissue sample for ultra-high performance liquid chromatography/mass spectrometry. J. Chromatogr. A 2013, 1298, 9–16. [Google Scholar] [CrossRef]
- Matyash, V.; Liebisch, G.; Kurzchalia, T.V.; Shevchenko, A.; Schwudke, D. Lipid extraction by methyl-tert-butyl ether for high-throughput lipidomics. J. Lipid Res. 2008, 49, 1137–1146. [Google Scholar] [CrossRef] [Green Version]
- Xuan, Q.; Zheng, F.; Yu, D.; Ouyang, Y.; Zhao, X.; Hu, C.; Xu, G. Rapid lipidomic profiling based on ultra-High performance liquid chromatography-mass spectrometry and its application in diabetic retinopathy. Anal. Bioanal. Chem. 2020, 412, 3585–3594. [Google Scholar] [CrossRef] [PubMed]
- Song, W.M.; Zhang, B. Multiscale Embedded Gene Co-expression Network Analysis. PLoS Comput. Biol. 2015, 11, e1004574. [Google Scholar] [CrossRef] [PubMed] [Green Version]
- McKenzie, A.T.; Katsyv, I.; Song, W.M.; Wang, M.; Zhang, B. DGCA: A comprehensive R package for Differential Gene Correlation Analysis. BMC Syst. Biol. 2016, 10, 106. [Google Scholar] [CrossRef] [PubMed] [Green Version]
- Wishart, D.S. Metabolomics for Investigating Physiological and Pathophysiological Processes. Physiol. Rev. 2019, 99, 1819–1875. [Google Scholar] [CrossRef]
- Jin, H.; Wang, S.; Zaal, E.A.; Wang, C.; Wu, H.; Bosma, A.; Jochems, F.; Isima, N.; Jin, G.; Lieftink, C.; et al. A powerful drug combination strategy targeting glutamine addiction for the treatment of human liver cancer. eLife 2020, 9, e56749. [Google Scholar] [CrossRef]
- Yang, L.; Venneti, S.; Nagrath, D. Glutaminolysis: A Hallmark of Cancer Metabolism. Annu. Rev. Biomed. Eng. 2017, 19, 163–194. [Google Scholar] [CrossRef]
- Tang, L.; Zeng, J.; Geng, P.; Fang, C.; Wang, Y.; Sun, M.; Wang, C.; Wang, J.; Yin, P.; Hu, C.; et al. Global Metabolic Profiling Identifies a Pivotal Role of Proline and Hydroxyproline Metabolism in Supporting Hypoxic Response in Hepatocellular Carcinoma. Clin. Cancer Res. 2018, 24, 474–485. [Google Scholar] [CrossRef] [Green Version]
- Melone, M.A.B.; Valentino, A.; Margarucci, S.; Galderisi, U.; Giordano, A.; Peluso, G. The carnitine system and cancer metabolic plasticity. Cell Death Dis. 2018, 9, 228. [Google Scholar] [CrossRef] [Green Version]
- Pope, E.D., 3rd; Kimbrough, E.O.; Vemireddy, L.P.; Surapaneni, P.K.; Copland, J.A., 3rd; Mody, K. Aberrant lipid metabolism as a therapeutic target in liver cancer. Expert Opin. Ther. Targets 2019, 23, 473–483. [Google Scholar] [CrossRef]
- Sangineto, M.; Villani, R.; Cavallone, F.; Romano, A.; Loizzi, D.; Serviddio, G. Lipid Metabolism in Development and Progression of Hepatocellular Carcinoma. Cancers 2020, 12, 1419. [Google Scholar] [CrossRef]
- Budhu, A.; Roessler, S.; Zhao, X.; Yu, Z.; Forgues, M.; Ji, J.; Karoly, E.; Qin, L.X.; Ye, Q.H.; Jia, H.L.; et al. Integrated metabolite and gene expression profiles identify lipid biomarkers associated with progression of hepatocellular carcinoma and patient outcomes. Gastroenterology 2013, 144, 1066–1075.e1. [Google Scholar] [CrossRef] [Green Version]
- Hall, Z.; Chiarugi, D.; Charidemou, E.; Leslie, J.; Scott, E.; Pellegrinet, L.; Allison, M.; Mocciaro, G.; Anstee, Q.M.; Evan, G.I.; et al. Lipid Remodeling in Hepatocyte Proliferation and Hepatocellular Carcinoma. Hepatology 2021, 73, 1028–1044. [Google Scholar] [CrossRef] [PubMed]
- Farinati, F.; Marino, D.; De Giorgio, M.; Baldan, A.; Cantarini, M.; Cursaro, C.; Rapaccini, G.; Del Poggio, P.; Di Nolfo, M.A.; Benvegnu, L.; et al. Diagnostic and Prognostic Role of alpha-Fetoprotein in Hepatocellular Carcinoma: Both or Neither? Am. J. Gastroenterol. 2006, 101, 524–532. [Google Scholar] [CrossRef] [PubMed]
- Reig, M.; Forner, A.; Rimola, J.; Ferrer-Fabrega, J.; Burrel, M.; Garcia-Criado, A.; Kelley, R.K.; Galle, P.R.; Mazzaferro, V.; Salem, R.; et al. BCLC strategy for prognosis prediction and treatment recommendation Barcelona Clinic Liver Cancer (BCLC) staging system. The 2022 update. J. Hepatol. 2021, 76, 681–693. [Google Scholar] [CrossRef]
- Xu, X.F.; Xing, H.; Han, J.; Li, Z.L.; Lau, W.Y.; Zhou, Y.H.; Gu, W.M.; Wang, H.; Chen, T.H.; Zeng, Y.Y.; et al. Risk Factors, Patterns, and Outcomes of Late Recurrence After Liver Resection for Hepatocellular Carcinoma: A Multicenter Study From China. JAMA Surg. 2019, 154, 209–217. [Google Scholar] [CrossRef] [PubMed]
- Hall, M.A. Correlation-Based Feature Selection for Machine Learning. Ph.D. Thesis, The University of Waikato, Hamilton, New Zealand, 1999. [Google Scholar]
- Wong, T.-L.; Ng, K.-Y.; Tan, K.V.; Chan, L.-H.; Zhou, L.; Che, N.; Hoo, R.L.C.; Lee, T.K.; Richard, S.; Lo, C.-M.; et al. CRAF Methylation by PRMT6 Regulates Aerobic Glycolysis-Driven Hepatocarcinogenesis via ERK-Dependent PKM2 Nuclear Relocalization and Activation. Hepatology 2020, 71, 1279–1296. [Google Scholar] [CrossRef] [PubMed]
- Abou-Alfa, G.K.; Qin, S.; Ryoo, B.Y.; Lu, S.N.; Yen, C.J.; Feng, Y.H.; Lim, H.Y.; Izzo, F.; Colombo, M.; Sarker, D.; et al. Phase III randomized study of second line ADI-PEG 20 plus best supportive care versus placebo plus best supportive care in patients with advanced hepatocellular carcinoma. Ann. Oncol. 2018, 29, 1402–1408. [Google Scholar] [CrossRef] [PubMed]
- Bai, C.; Wang, H.; Dong, D.; Li, T.; Yu, Z.; Guo, J.; Zhou, W.; Li, D.; Yan, R.; Wang, L.; et al. Urea as a By-Product of Ammonia Metabolism Can Be a Potential Serum Biomarker of Hepatocellular Carcinoma. Front. Cell Dev. Biol. 2021, 9, 650748. [Google Scholar] [CrossRef]
- Wu, T.; Luo, G.; Lian, Q.; Sui, C.; Tang, J.; Zhu, Y.; Zheng, B.; Li, Z.; Zhang, Y.; Zhang, Y.; et al. Discovery of a Carbamoyl Phosphate Synthetase 1-Deficient HCC Subtype With Therapeutic Potential Through Integrative Genomic and Experimental Analysis. Hepatology 2021, 74, 3249–3268. [Google Scholar] [CrossRef]
- Tomomura, M.; Tomomura, A.; AbuMusa, D.M.A.; Saheki, T. Long-Chain fatty acids suppress the induction of urea cycle enzyme genes by glucocorticoid action. FEBS Lett. 1996, 399, 310–312. [Google Scholar] [CrossRef] [Green Version]
- Madiraju, A.K.; Alves, T.; Zhao, X.; Cline, G.W.; Zhang, D.; Bhanot, S.; Samuel, V.T.; Kibbey, R.G.; Shulman, G.I. Argininosuccinate synthetase regulates hepatic AMPK linking protein catabolism and ureagenesis to hepatic lipid metabolism. Proc. Natl. Acad. Sci. USA 2016, 113, E3423–E3430. [Google Scholar] [CrossRef] [PubMed] [Green Version]
- Jain, A.; Sharma, B.C.; Mahajan, B.; Srivastava, S.; Kumar, A.; Sachdeva, S.; Sonika, U.; Dalal, A. L-Ornithine L-Aspartate in acute treatment of severe hepatic encephalopathy: A double-Blind randomized controlled trial. Hepatology 2021. [Google Scholar] [CrossRef]
- Vinciguerra, M.; Sgroi, A.; Veyrat-Durebex, C.; Rubbia-Brandt, L.; Buhler, L.H.; Foti, M. Unsaturated Fatty Acids Inhibit the Expression of Tumor Suppressor Phosphatase and Tensin Homolog (PTEN) Via MicroRNA-21 Up-Regulation in Hepatocytes. Hepatology 2009, 49, 1176–1184. [Google Scholar] [CrossRef]
- Vinciguerra, M.; Carrozzino, F.; Peyrou, M.; Carlone, S.; Montesano, R.; Benelli, R.; Foti, M. Unsaturated fatty acids promote hepatoma proliferation and progression through downregulation of the tumor suppressor PTEN. J. Hepatol. 2009, 50, 1132–1141. [Google Scholar] [CrossRef] [PubMed]
- Ackerman, D.; Tumanov, S.; Qiu, B.; Michalopoulou, E.; Spata, M.; Azzam, A.; Xie, H.; Simon, M.C.; Kamphorst, J.J. Triglycerides Promote Lipid Homeostasis during Hypoxic Stress by Balancing Fatty Acid Saturation. Cell Rep. 2018, 24, 2596–2605.e5. [Google Scholar] [CrossRef] [PubMed] [Green Version]


| Characteristic | All (n = 166) | Patients with Follow-Up (n = 136) | |
|---|---|---|---|
| Age, mean ± SD | 49.3 ± 10.9 | 49.6 ± 11 | |
| Gender, n (%) | |||
| Female | 21 (12.7%) | 19 (14.0%) | |
| Male | 144 (86.7%) | 117 (86.0%) | |
| na | 1 (0.6%) | 0 | |
| Smoking, n (%) | 80 (48.2%) | 66 (48.5%) | |
| Alcohol abuse, n (%) | 33 (19.9%) | 27 (19.9%) | |
| Family History | 34 (20.5%) | 29 (21.3%) | |
| HBsAg +, n (%) | 136 (81.9%) | 112 (82.4%) | |
| AFP, >400 μg/L, n (%) | 67 (40.4%) | 55 (40.4%) | |
| PLT (×10/L, mean ± SD) | 164.5 ± 63.4 | 165 ± 63.3 | |
| TBA (umol/L, mean ± SD) | 11.6 ± 15.4 | 10.6 ± 13.3 | |
| CEA (μg/L, mean ± SD) | 2.8 ± 2.8 | 3 ± 2.9 | |
| CA19-9 (U/mL, mean ± SD) | 19.6 ± 17.1 | 19.8 ± 17.9 | |
| Tumor Nodules, n (%) | 69 (41.6%) | 58 (42.6%) | |
| MVI, n (%) | 63 (38.0%) | 54 (39.7%) | |
| Multiple Tumor, n (%) | 26 (15.7%) | 19 (14.0%) | |
| Maximum Tumor Diameter, mean ± SD | 7.1 ± 4.6 | 7 ± 4.5 | |
| TNM Stage, n (%) | |||
| Ⅰ | 76 (45.8%) | 64 (47.1%) | |
| Ⅱ | 39 (23.5%) | 31 (22.8%) | |
| Ⅲ | 11 (6.6%) | 7 (5.1%) | |
| IV | 39 (23.5%) | 34 (25%) | |
| na | 1 (0.6%) | 0 | |
| BCLC Stage, n (%) | |||
| A | 107 (64.5%) | 91 (66.9%) | |
| B | 19 (11.4%) | 11 (8.1%) | |
| C | 39 (23.5%) | 34 (25.0%) | |
| na | 1 (0.6%) | 0 | |
| ALBI Grade, n (%) | |||
| 1 | 122 (73.5%) | 104 (76.5%) | |
| 2 | 136 (81.9%) | 29 (21.3%) | |
| na | 8 (4.8%) | 3 (2.2%) |
Publisher’s Note: MDPI stays neutral with regard to jurisdictional claims in published maps and institutional affiliations. |
© 2022 by the authors. Licensee MDPI, Basel, Switzerland. This article is an open access article distributed under the terms and conditions of the Creative Commons Attribution (CC BY) license (https://creativecommons.org/licenses/by/4.0/).
Share and Cite
Wang, Q.; Tan, Y.; Jiang, T.; Wang, X.; Li, Q.; Li, Y.; Dong, L.; Liu, X.; Xu, G. Metabolic Reprogramming and Its Relationship to Survival in Hepatocellular Carcinoma. Cells 2022, 11, 1066. https://doi.org/10.3390/cells11071066
Wang Q, Tan Y, Jiang T, Wang X, Li Q, Li Y, Dong L, Liu X, Xu G. Metabolic Reprogramming and Its Relationship to Survival in Hepatocellular Carcinoma. Cells. 2022; 11(7):1066. https://doi.org/10.3390/cells11071066
Chicago/Turabian StyleWang, Qingqing, Yexiong Tan, Tianyi Jiang, Xiaolin Wang, Qi Li, Yanli Li, Liwei Dong, Xinyu Liu, and Guowang Xu. 2022. "Metabolic Reprogramming and Its Relationship to Survival in Hepatocellular Carcinoma" Cells 11, no. 7: 1066. https://doi.org/10.3390/cells11071066
APA StyleWang, Q., Tan, Y., Jiang, T., Wang, X., Li, Q., Li, Y., Dong, L., Liu, X., & Xu, G. (2022). Metabolic Reprogramming and Its Relationship to Survival in Hepatocellular Carcinoma. Cells, 11(7), 1066. https://doi.org/10.3390/cells11071066