


Oxygen Gradient Induced in Microfluidic Chips Can Be Used as a Model for Liver Zonation

 , ,
, , 
Abstract

1. Introduction
2. Materials and Methods
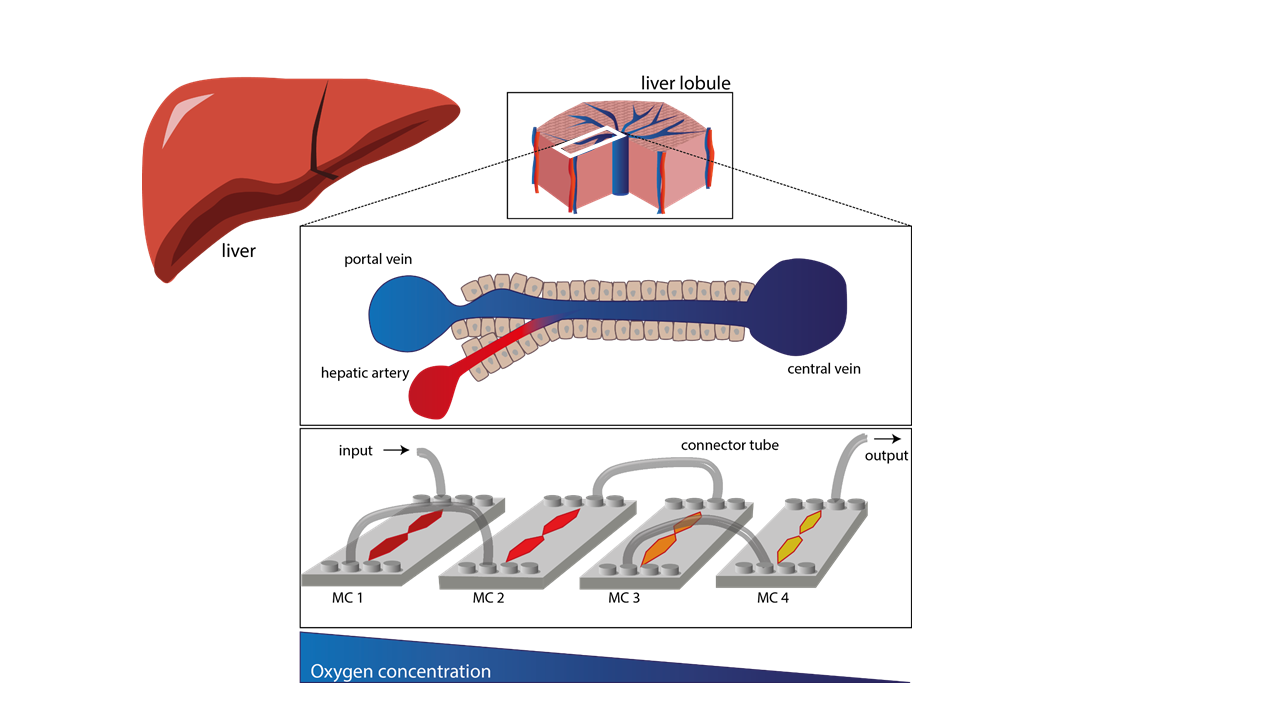
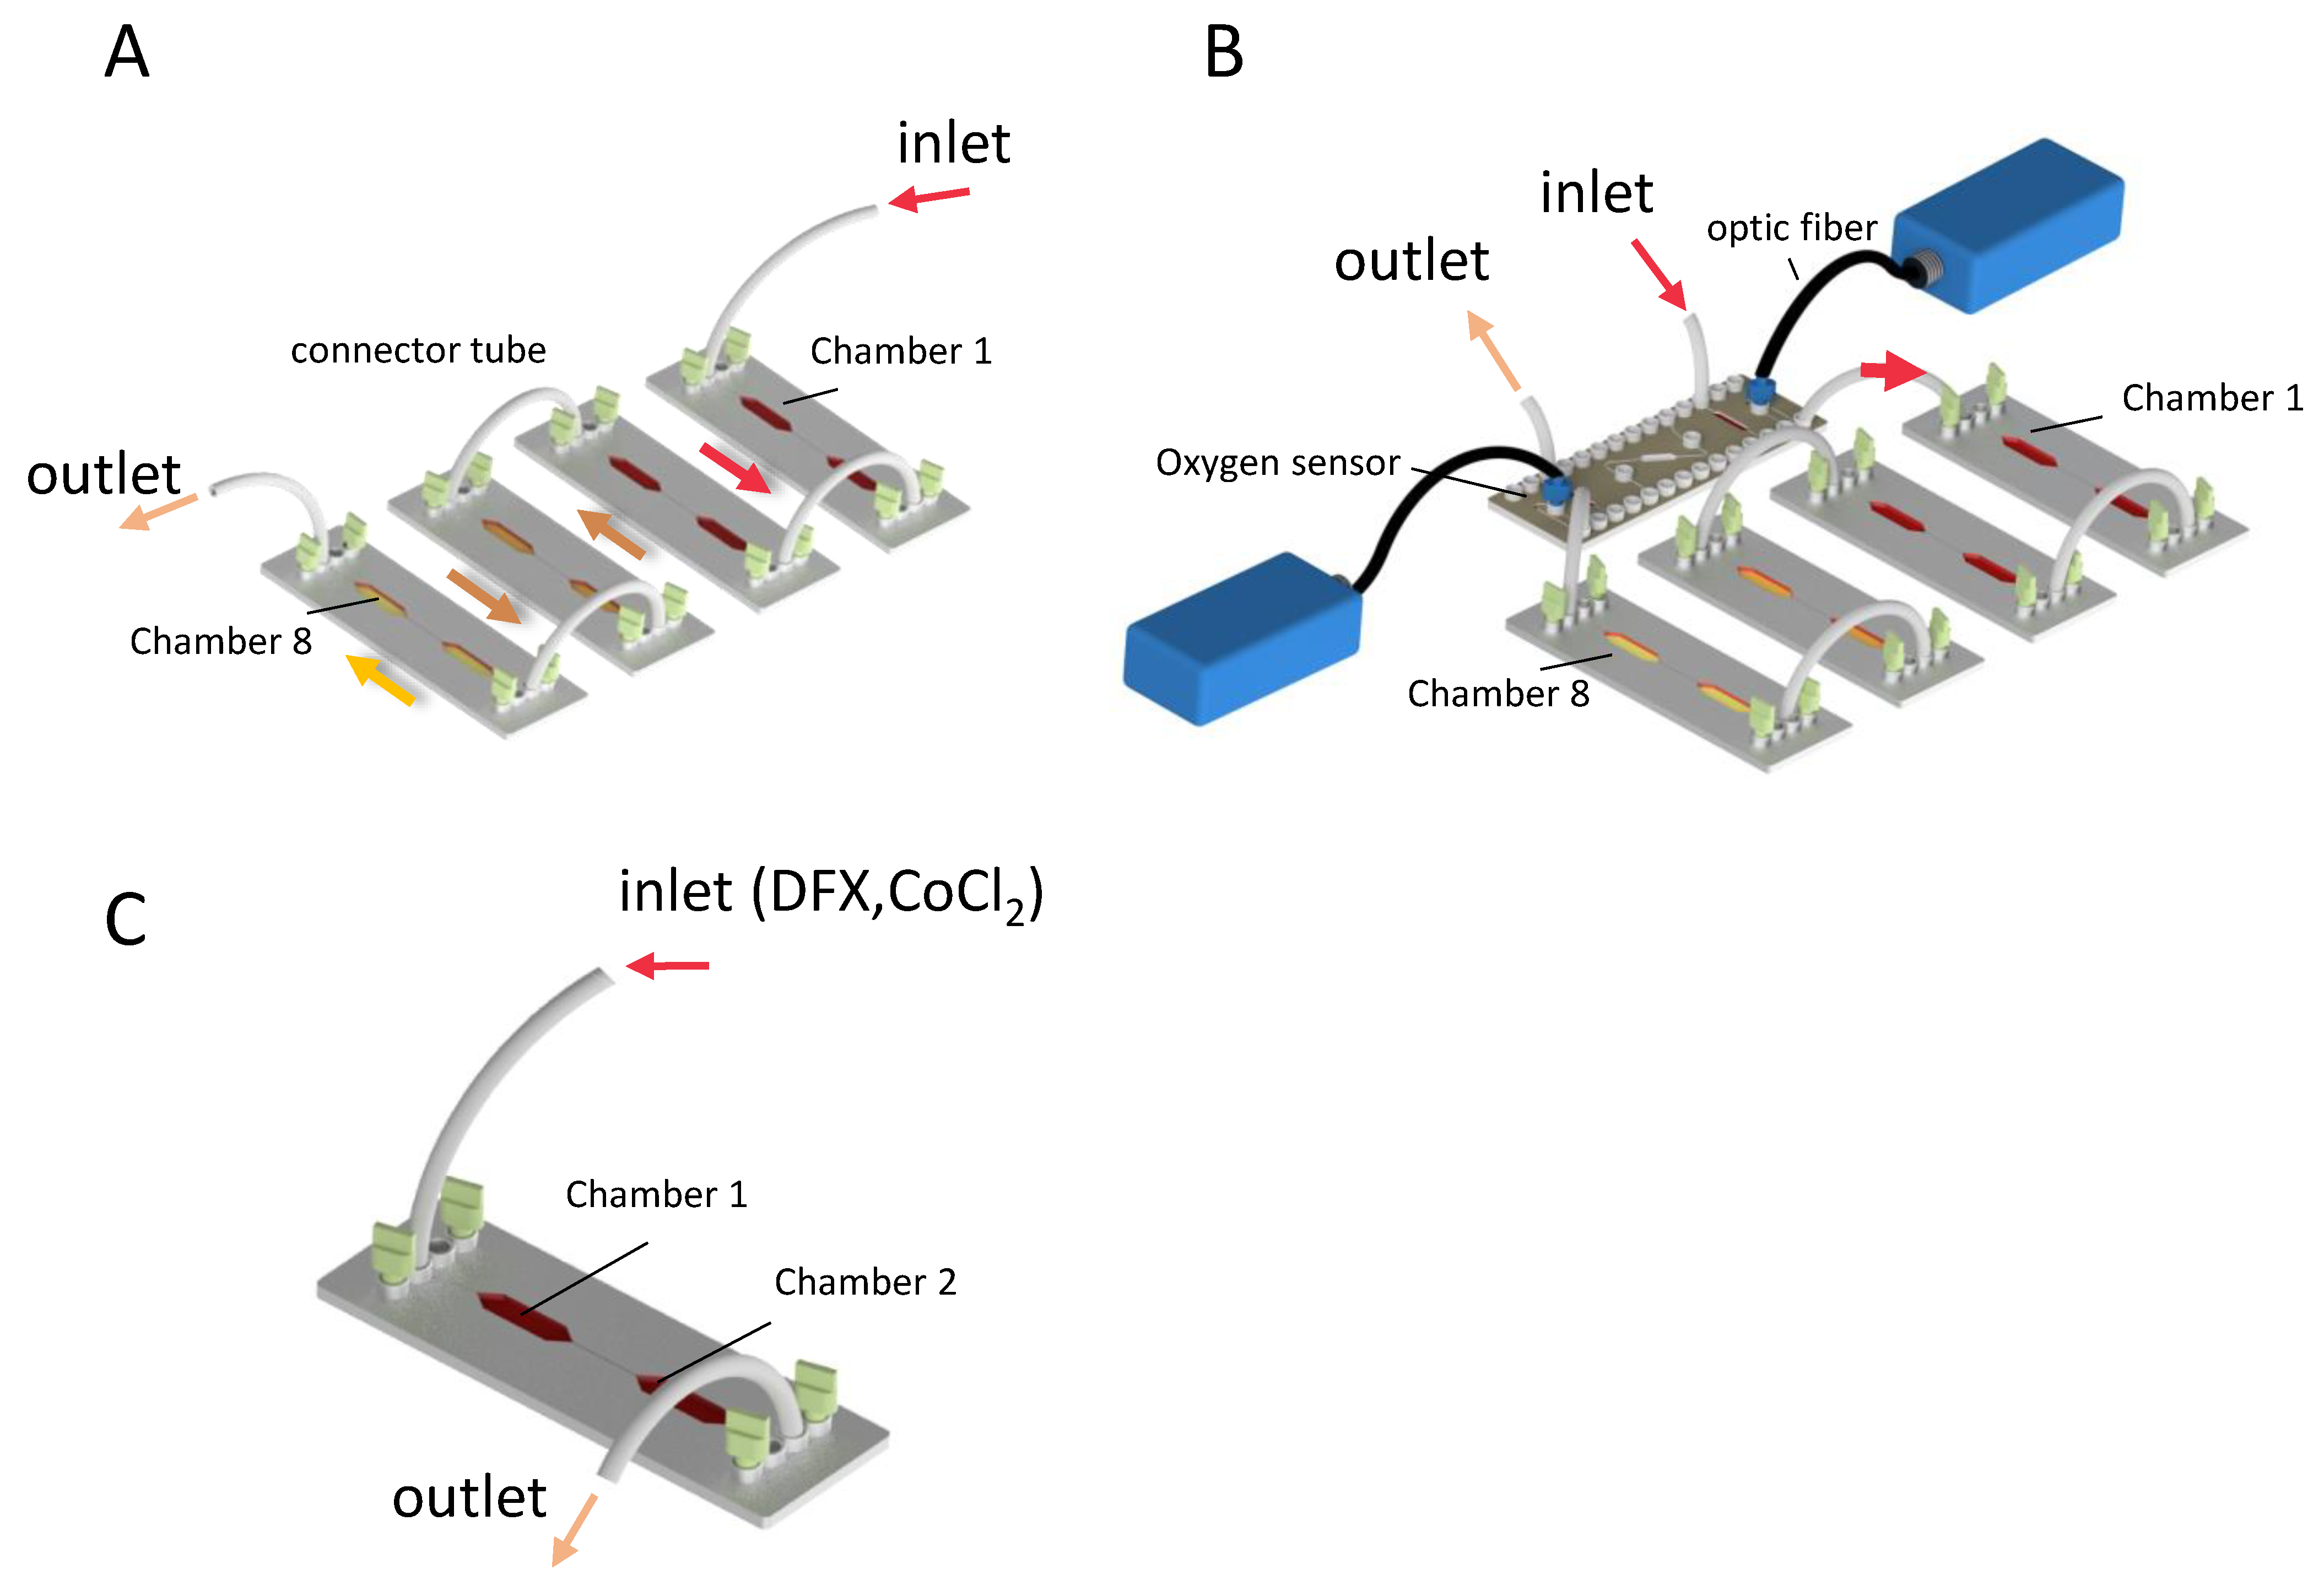
2.1. Microfluidic Chips
2.2. Oxygen Measurement
2.3. Chemical Induction of Hypoxia
2.4. Measuring Cell Byproducts by Collecting Media Flowthrough
2.5. Cell Fixation
2.6. IF Staining
2.7. Antisense RNA Preparation
2.8. FISH Staining
2.9. Imaging
2.10. Image Analysis
3. Results
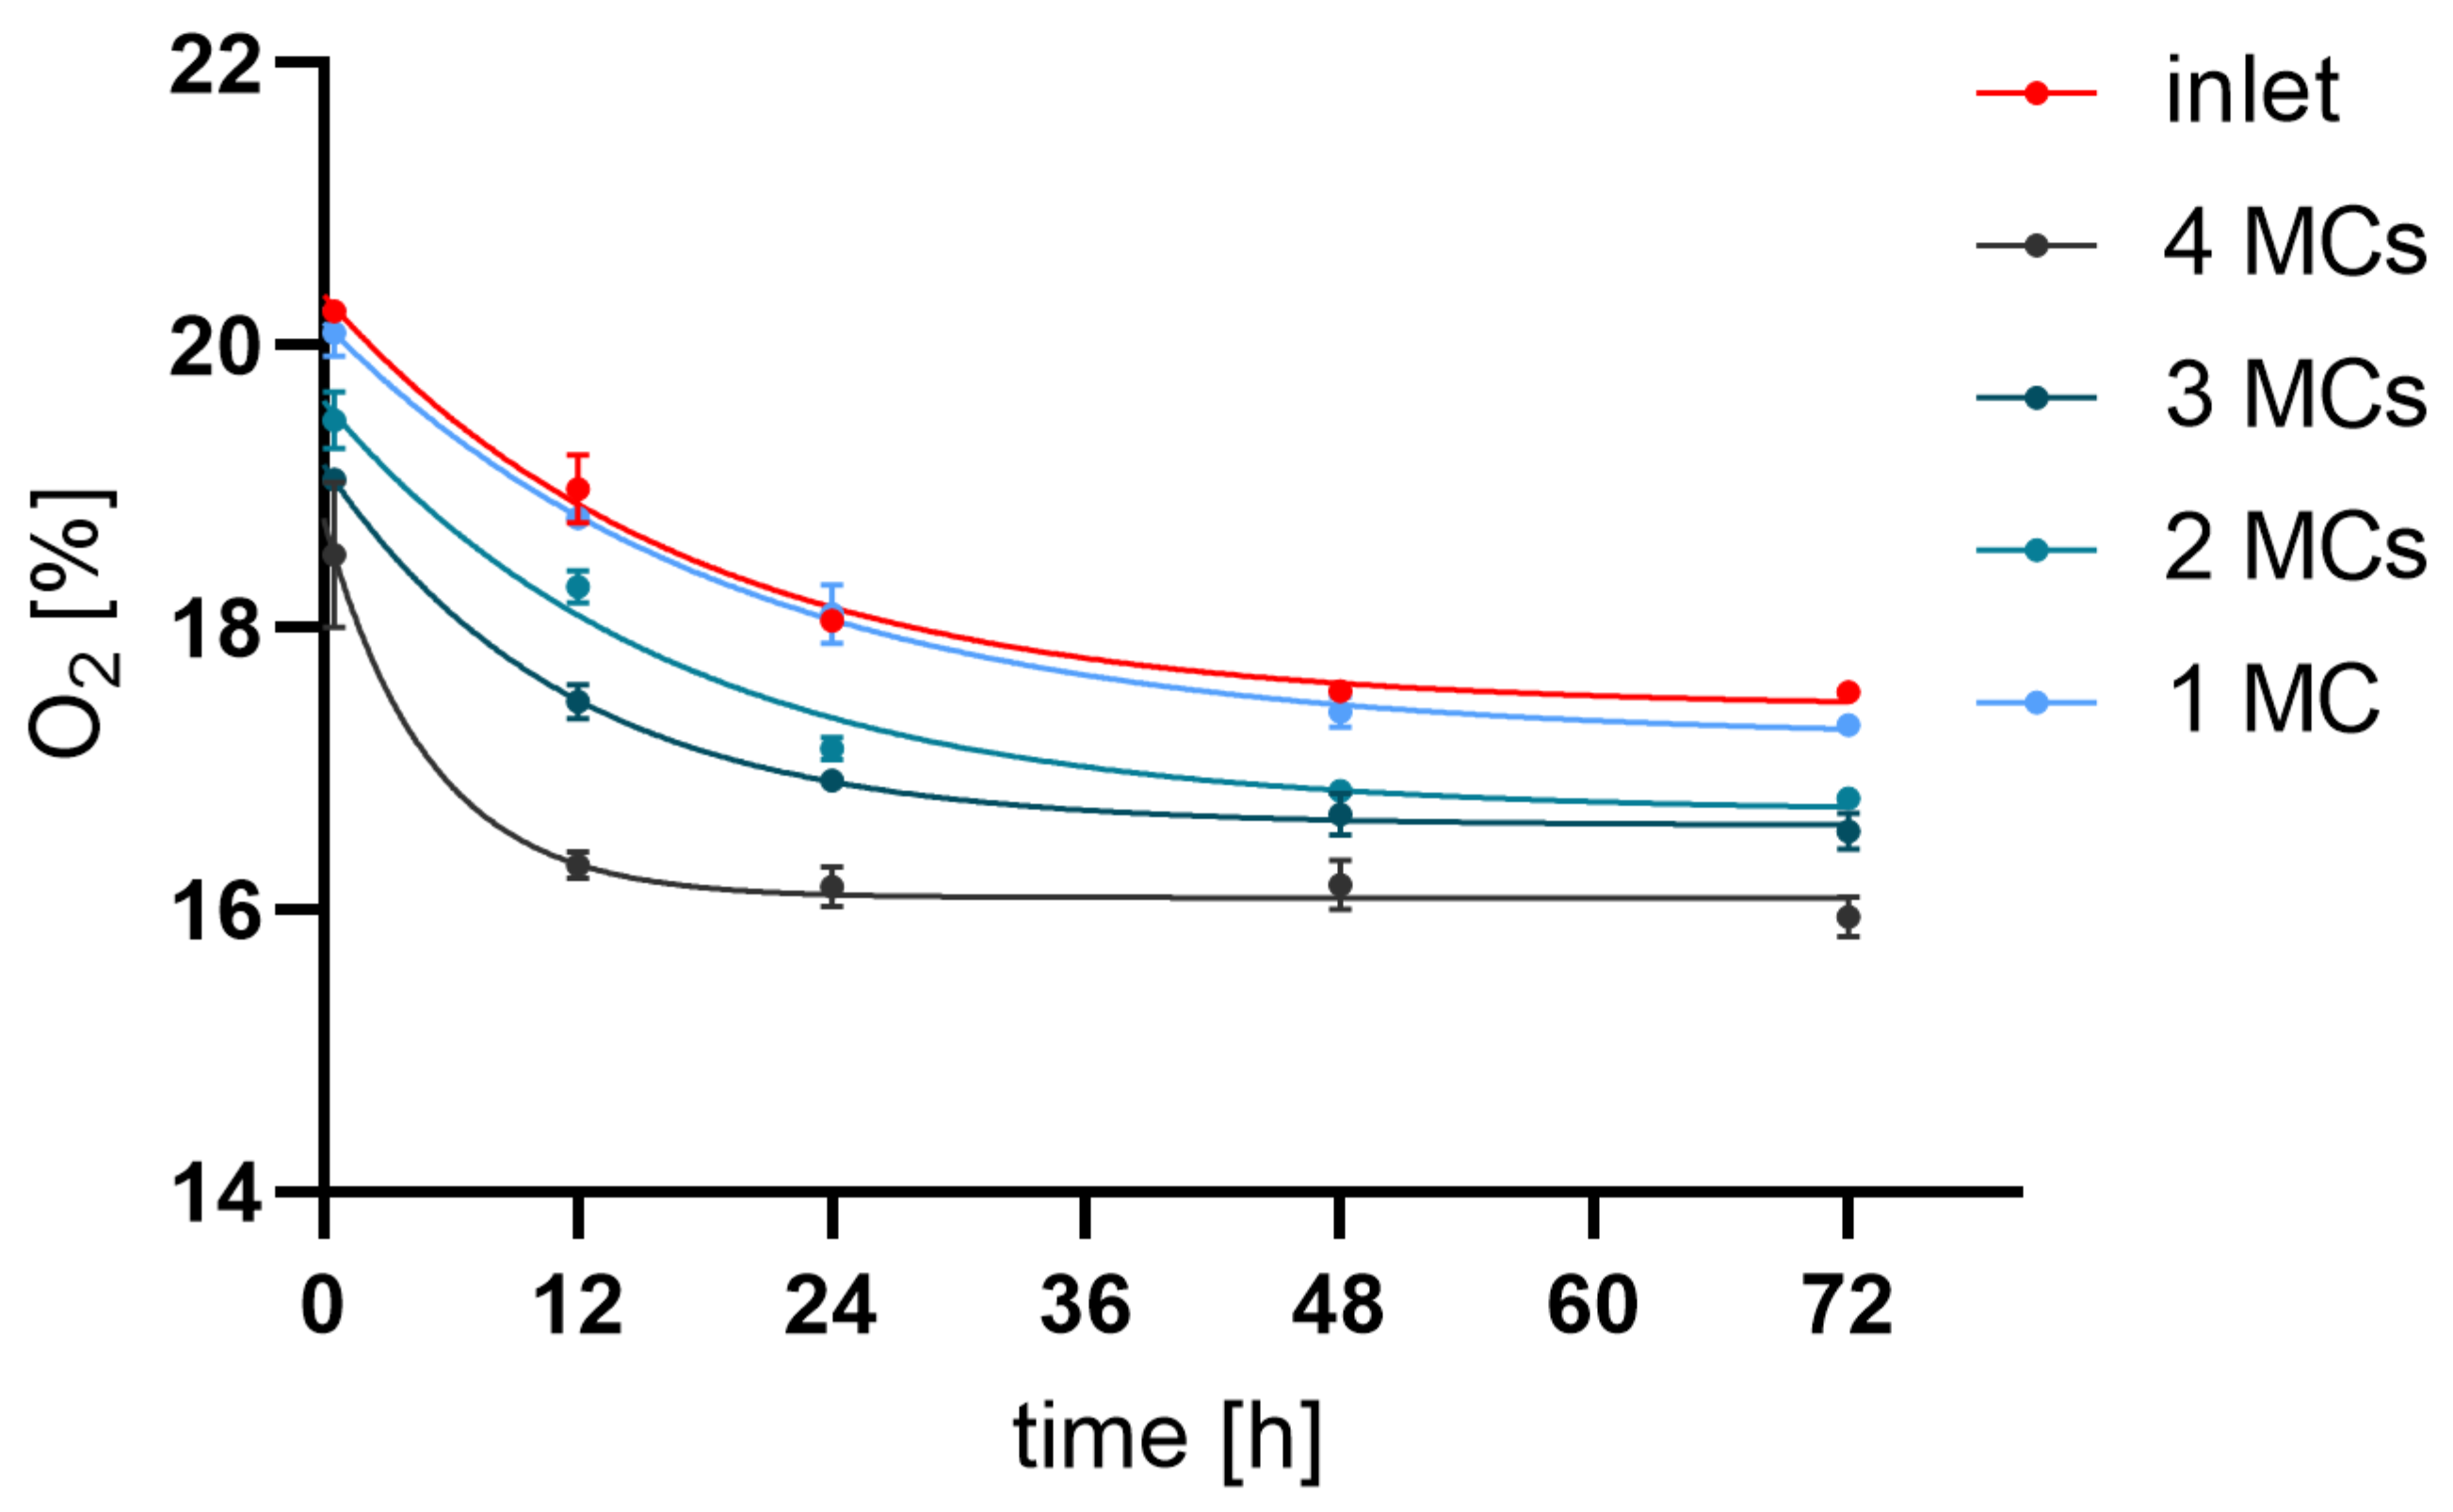
3.1. Oxygen Level
3.2. Cell Byproducts in Media Flowthrough
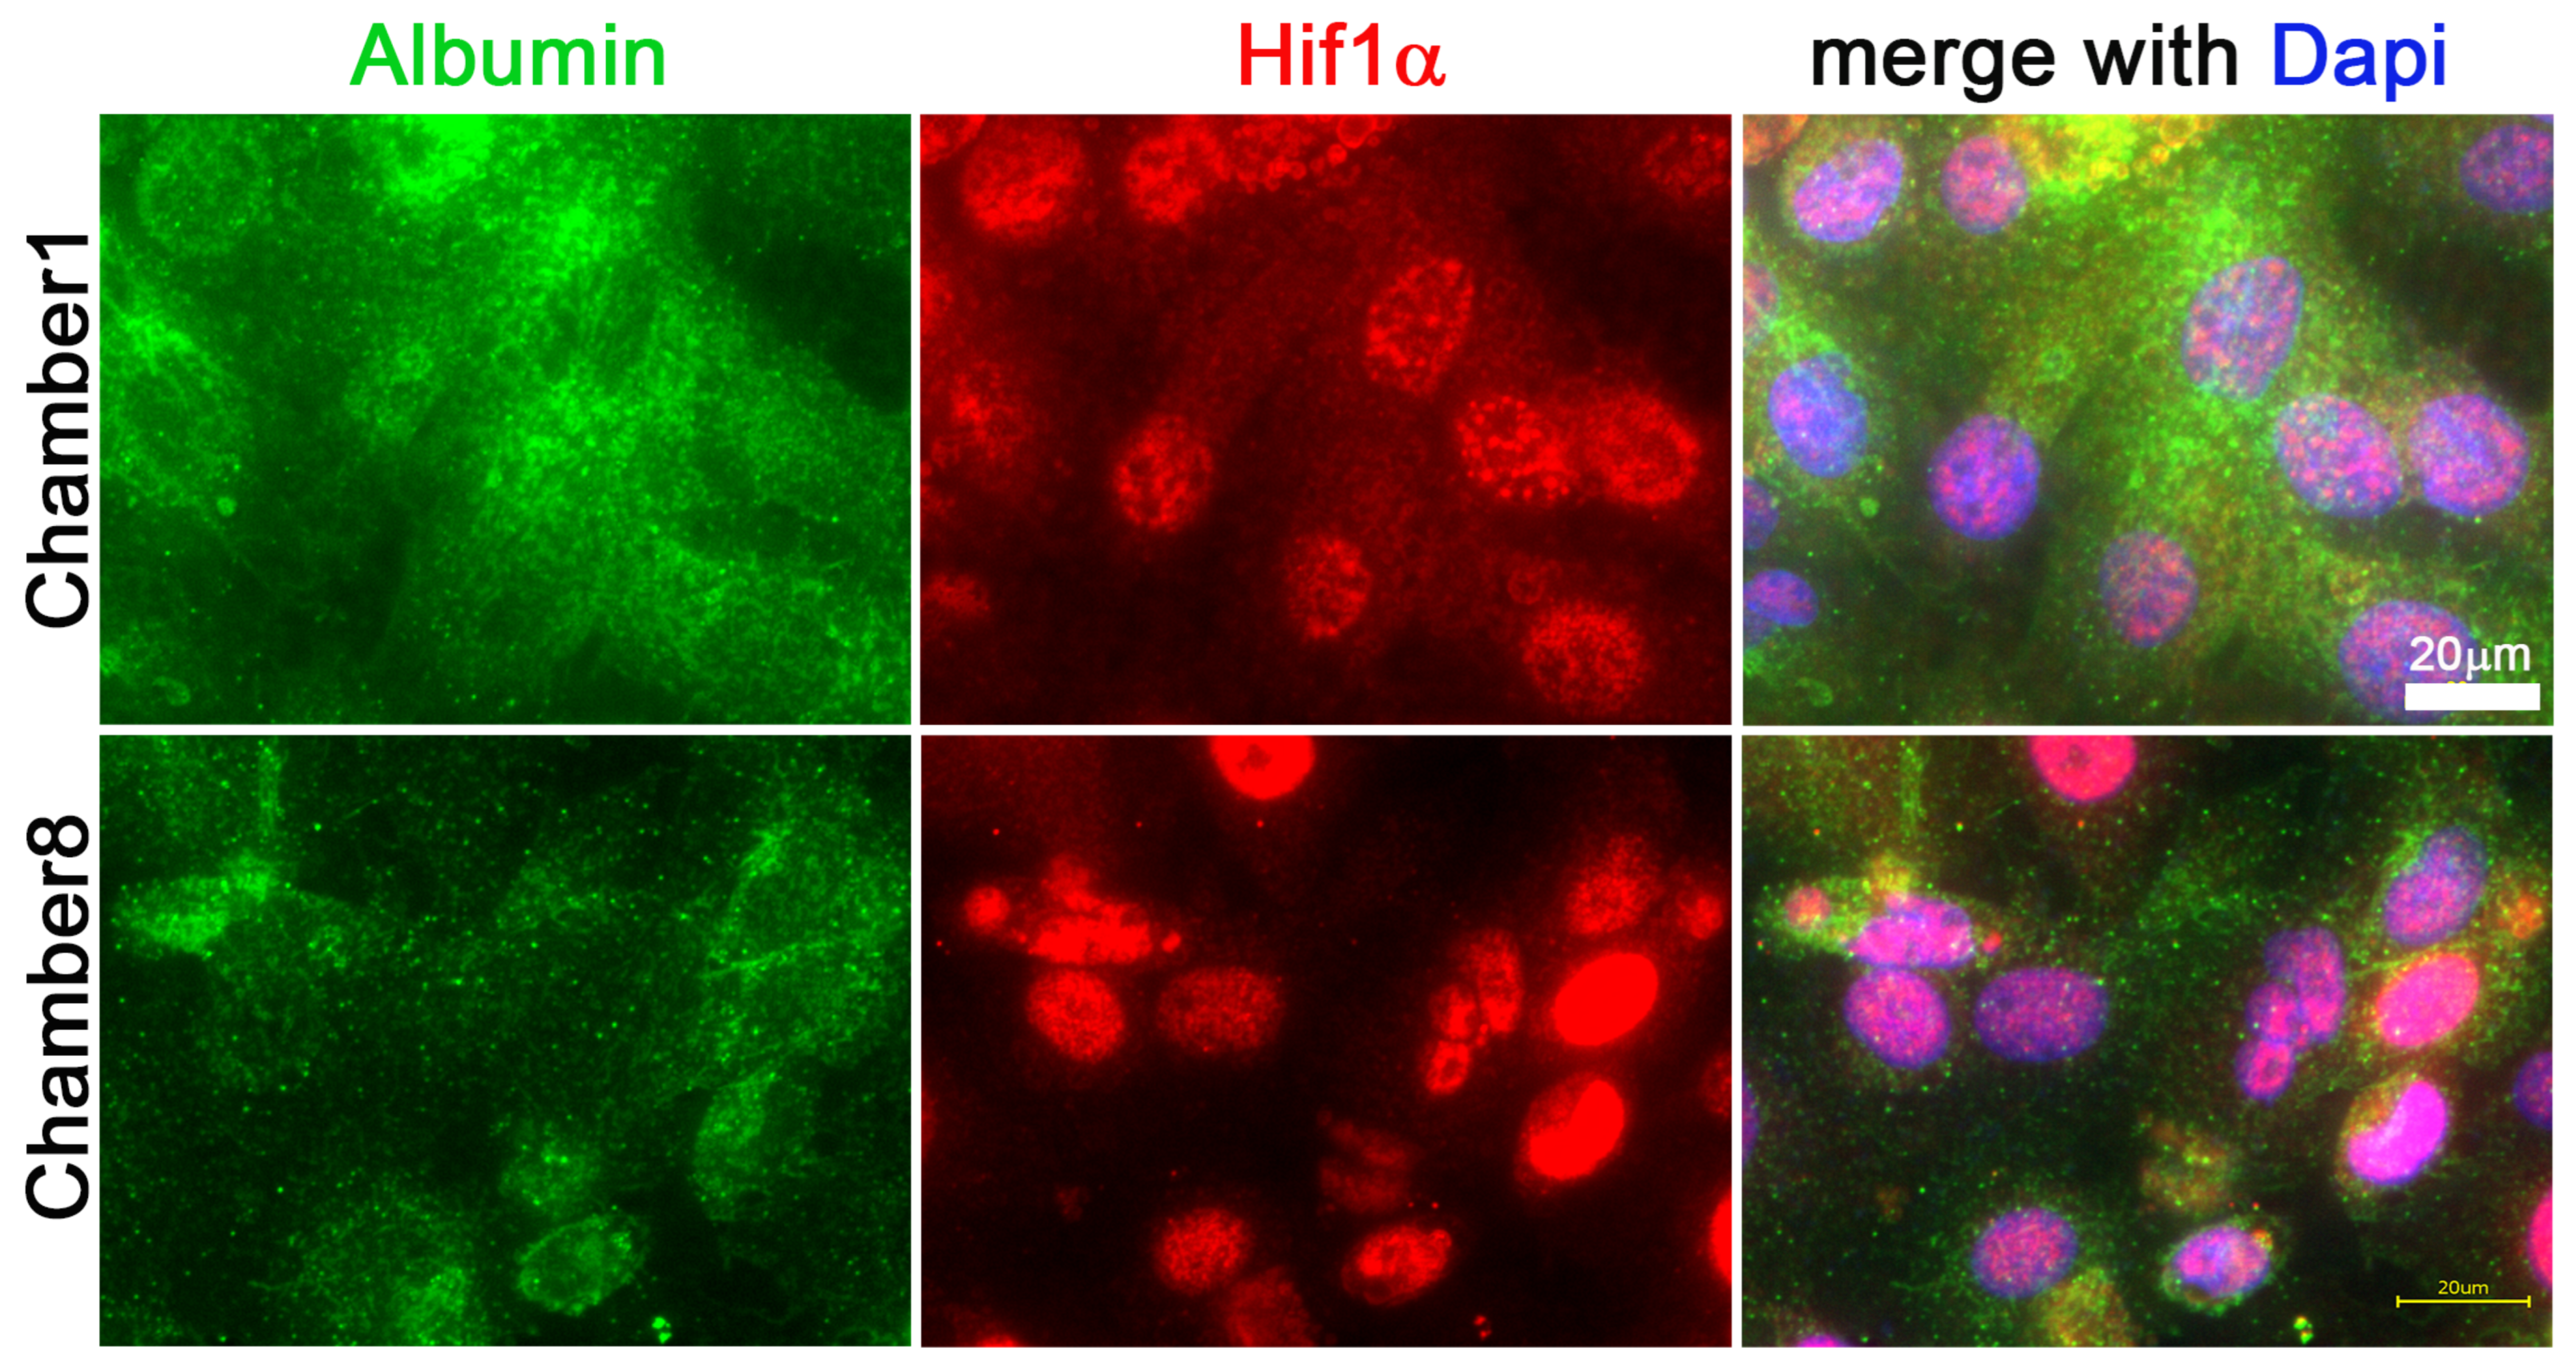
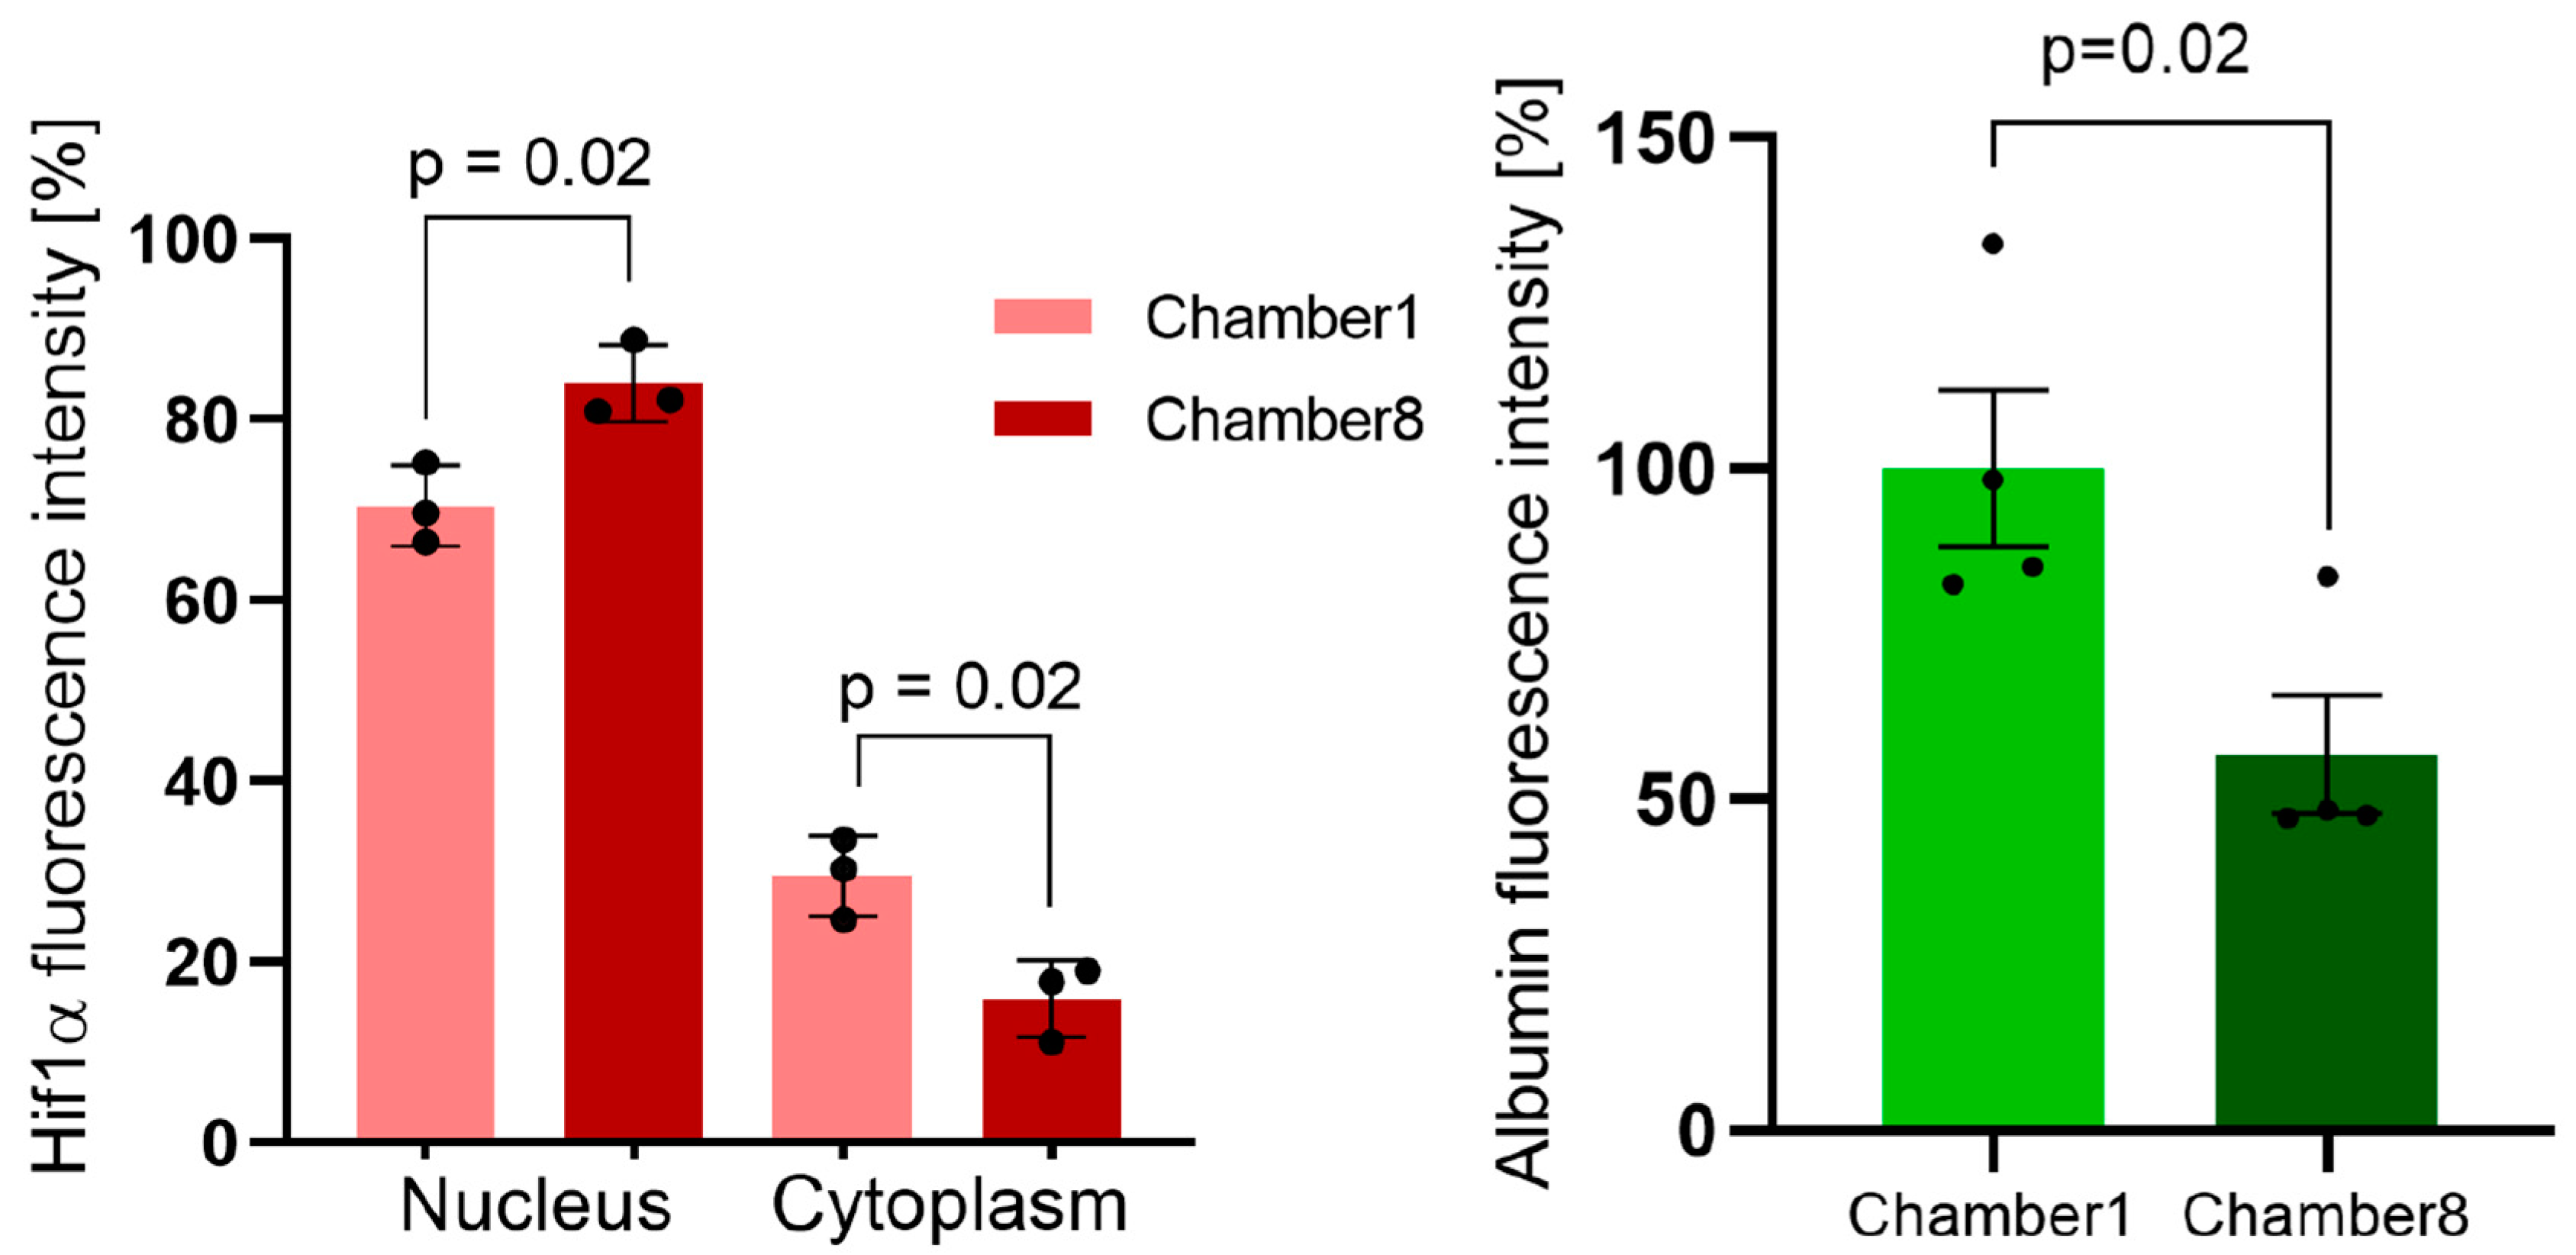
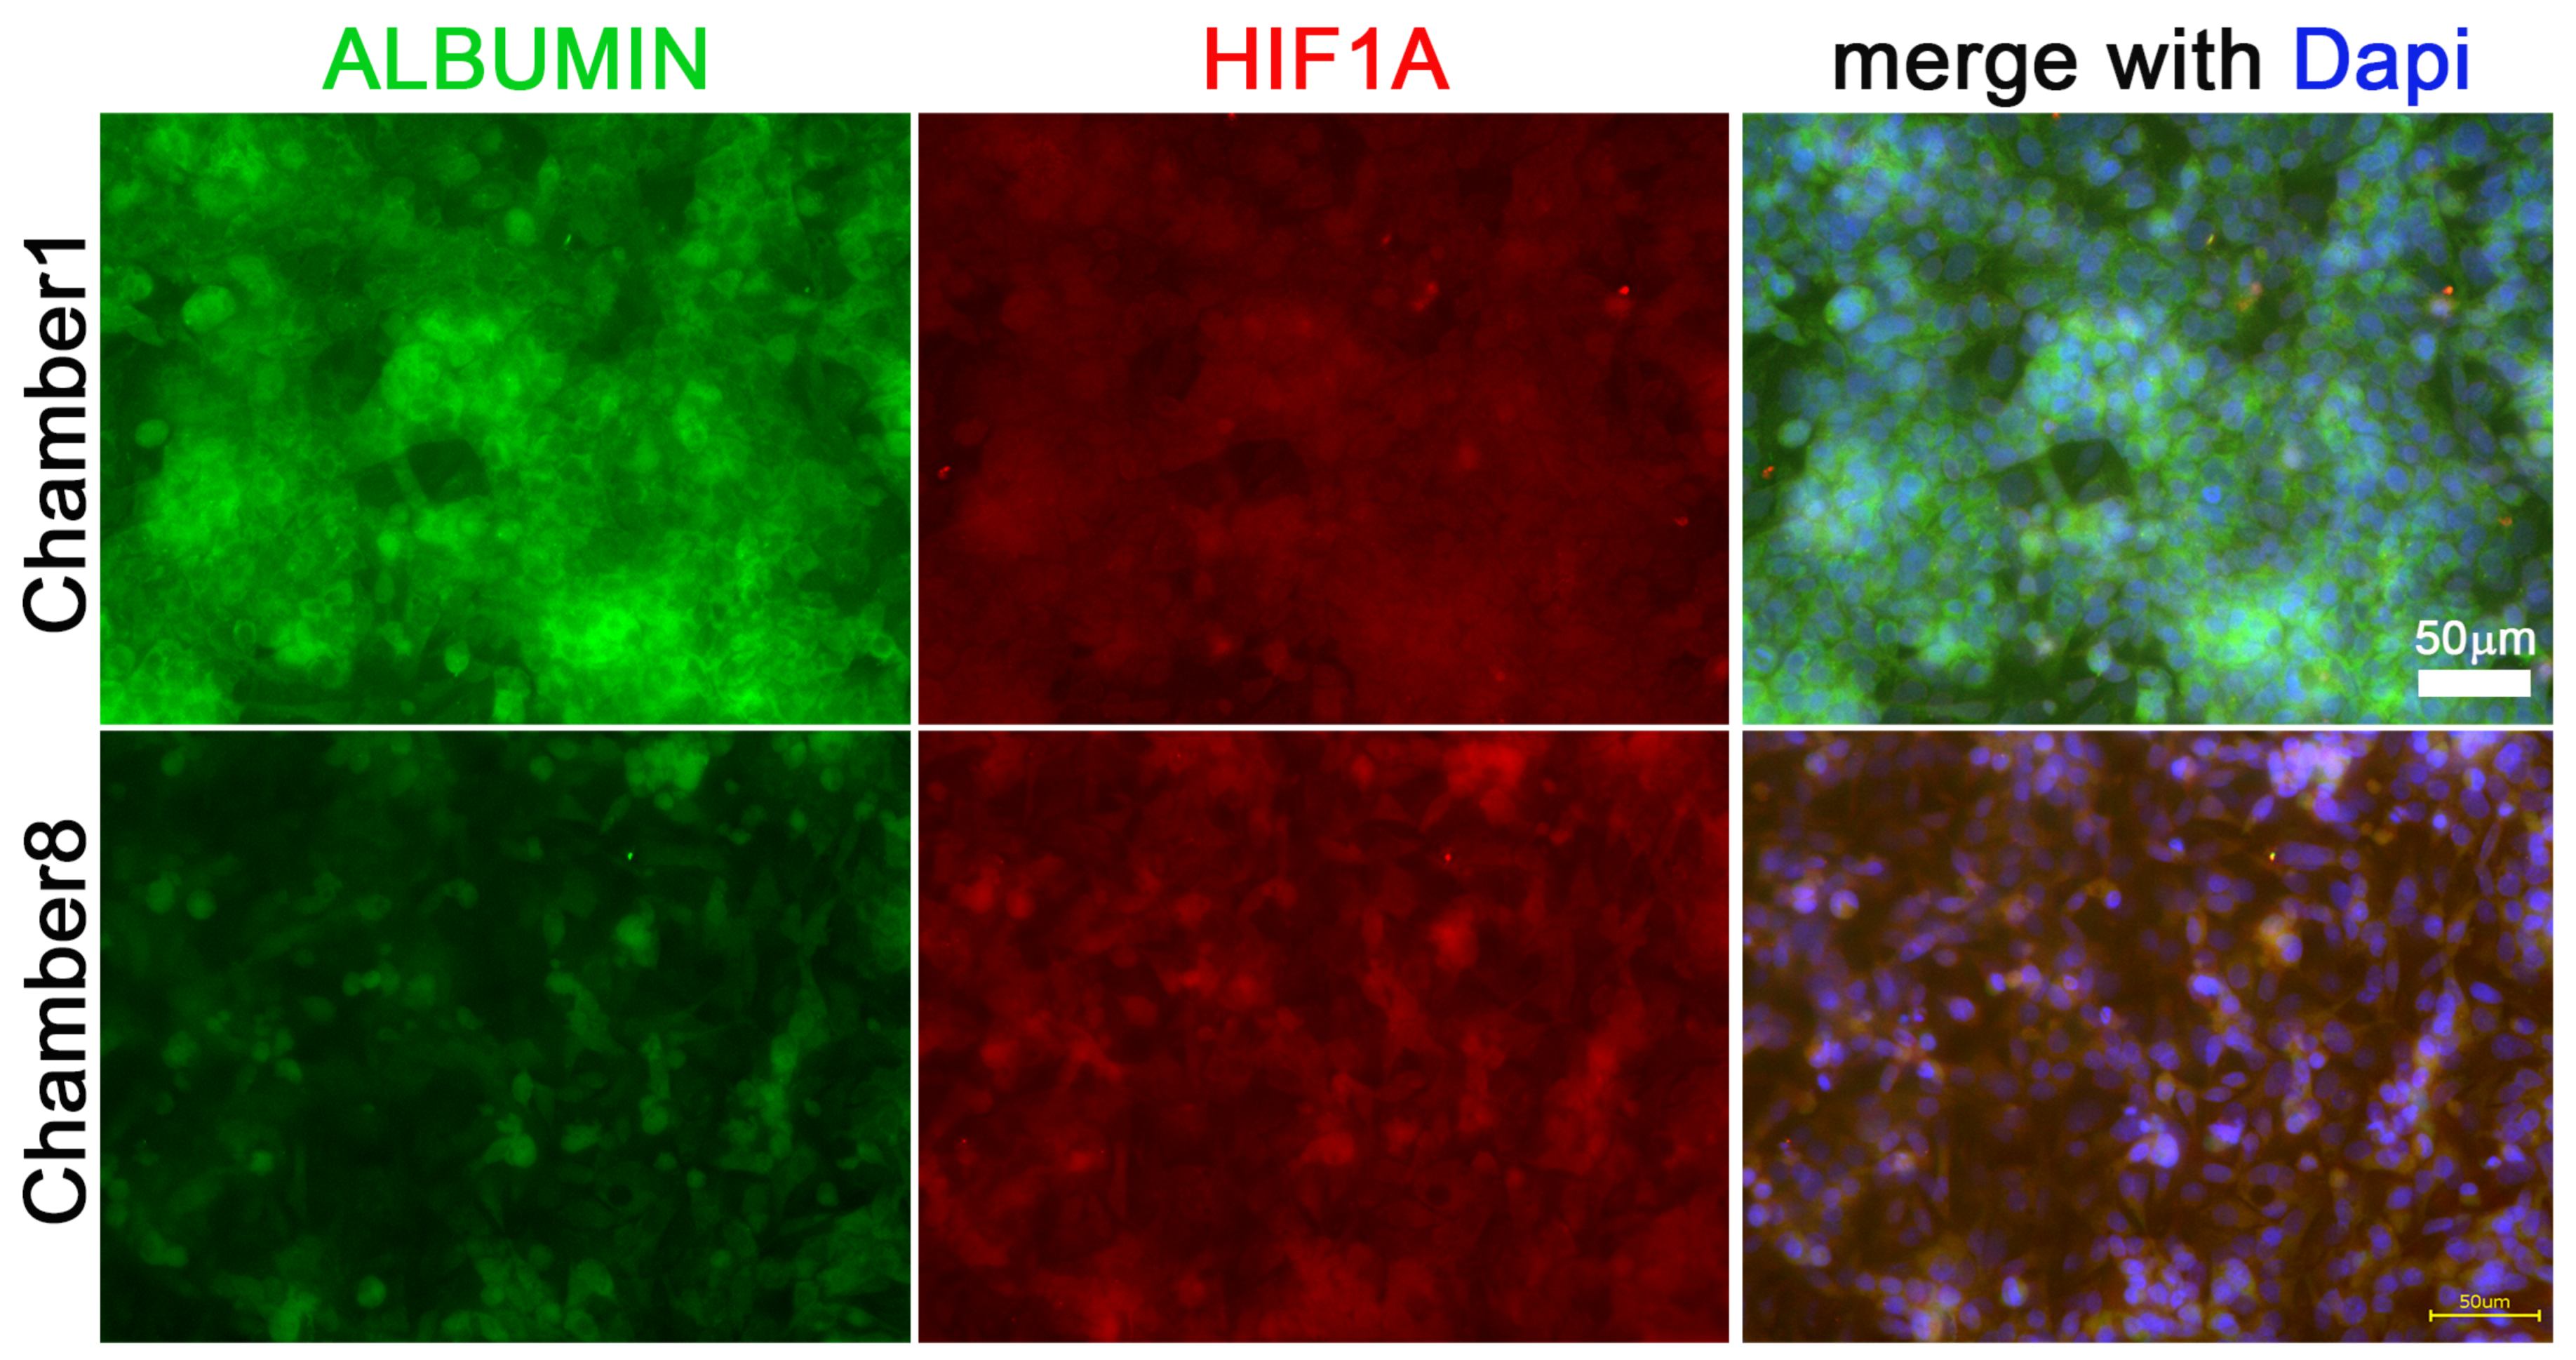
3.3. Hif1α and Albumin Protein Expressions across the Oxygen Gradient
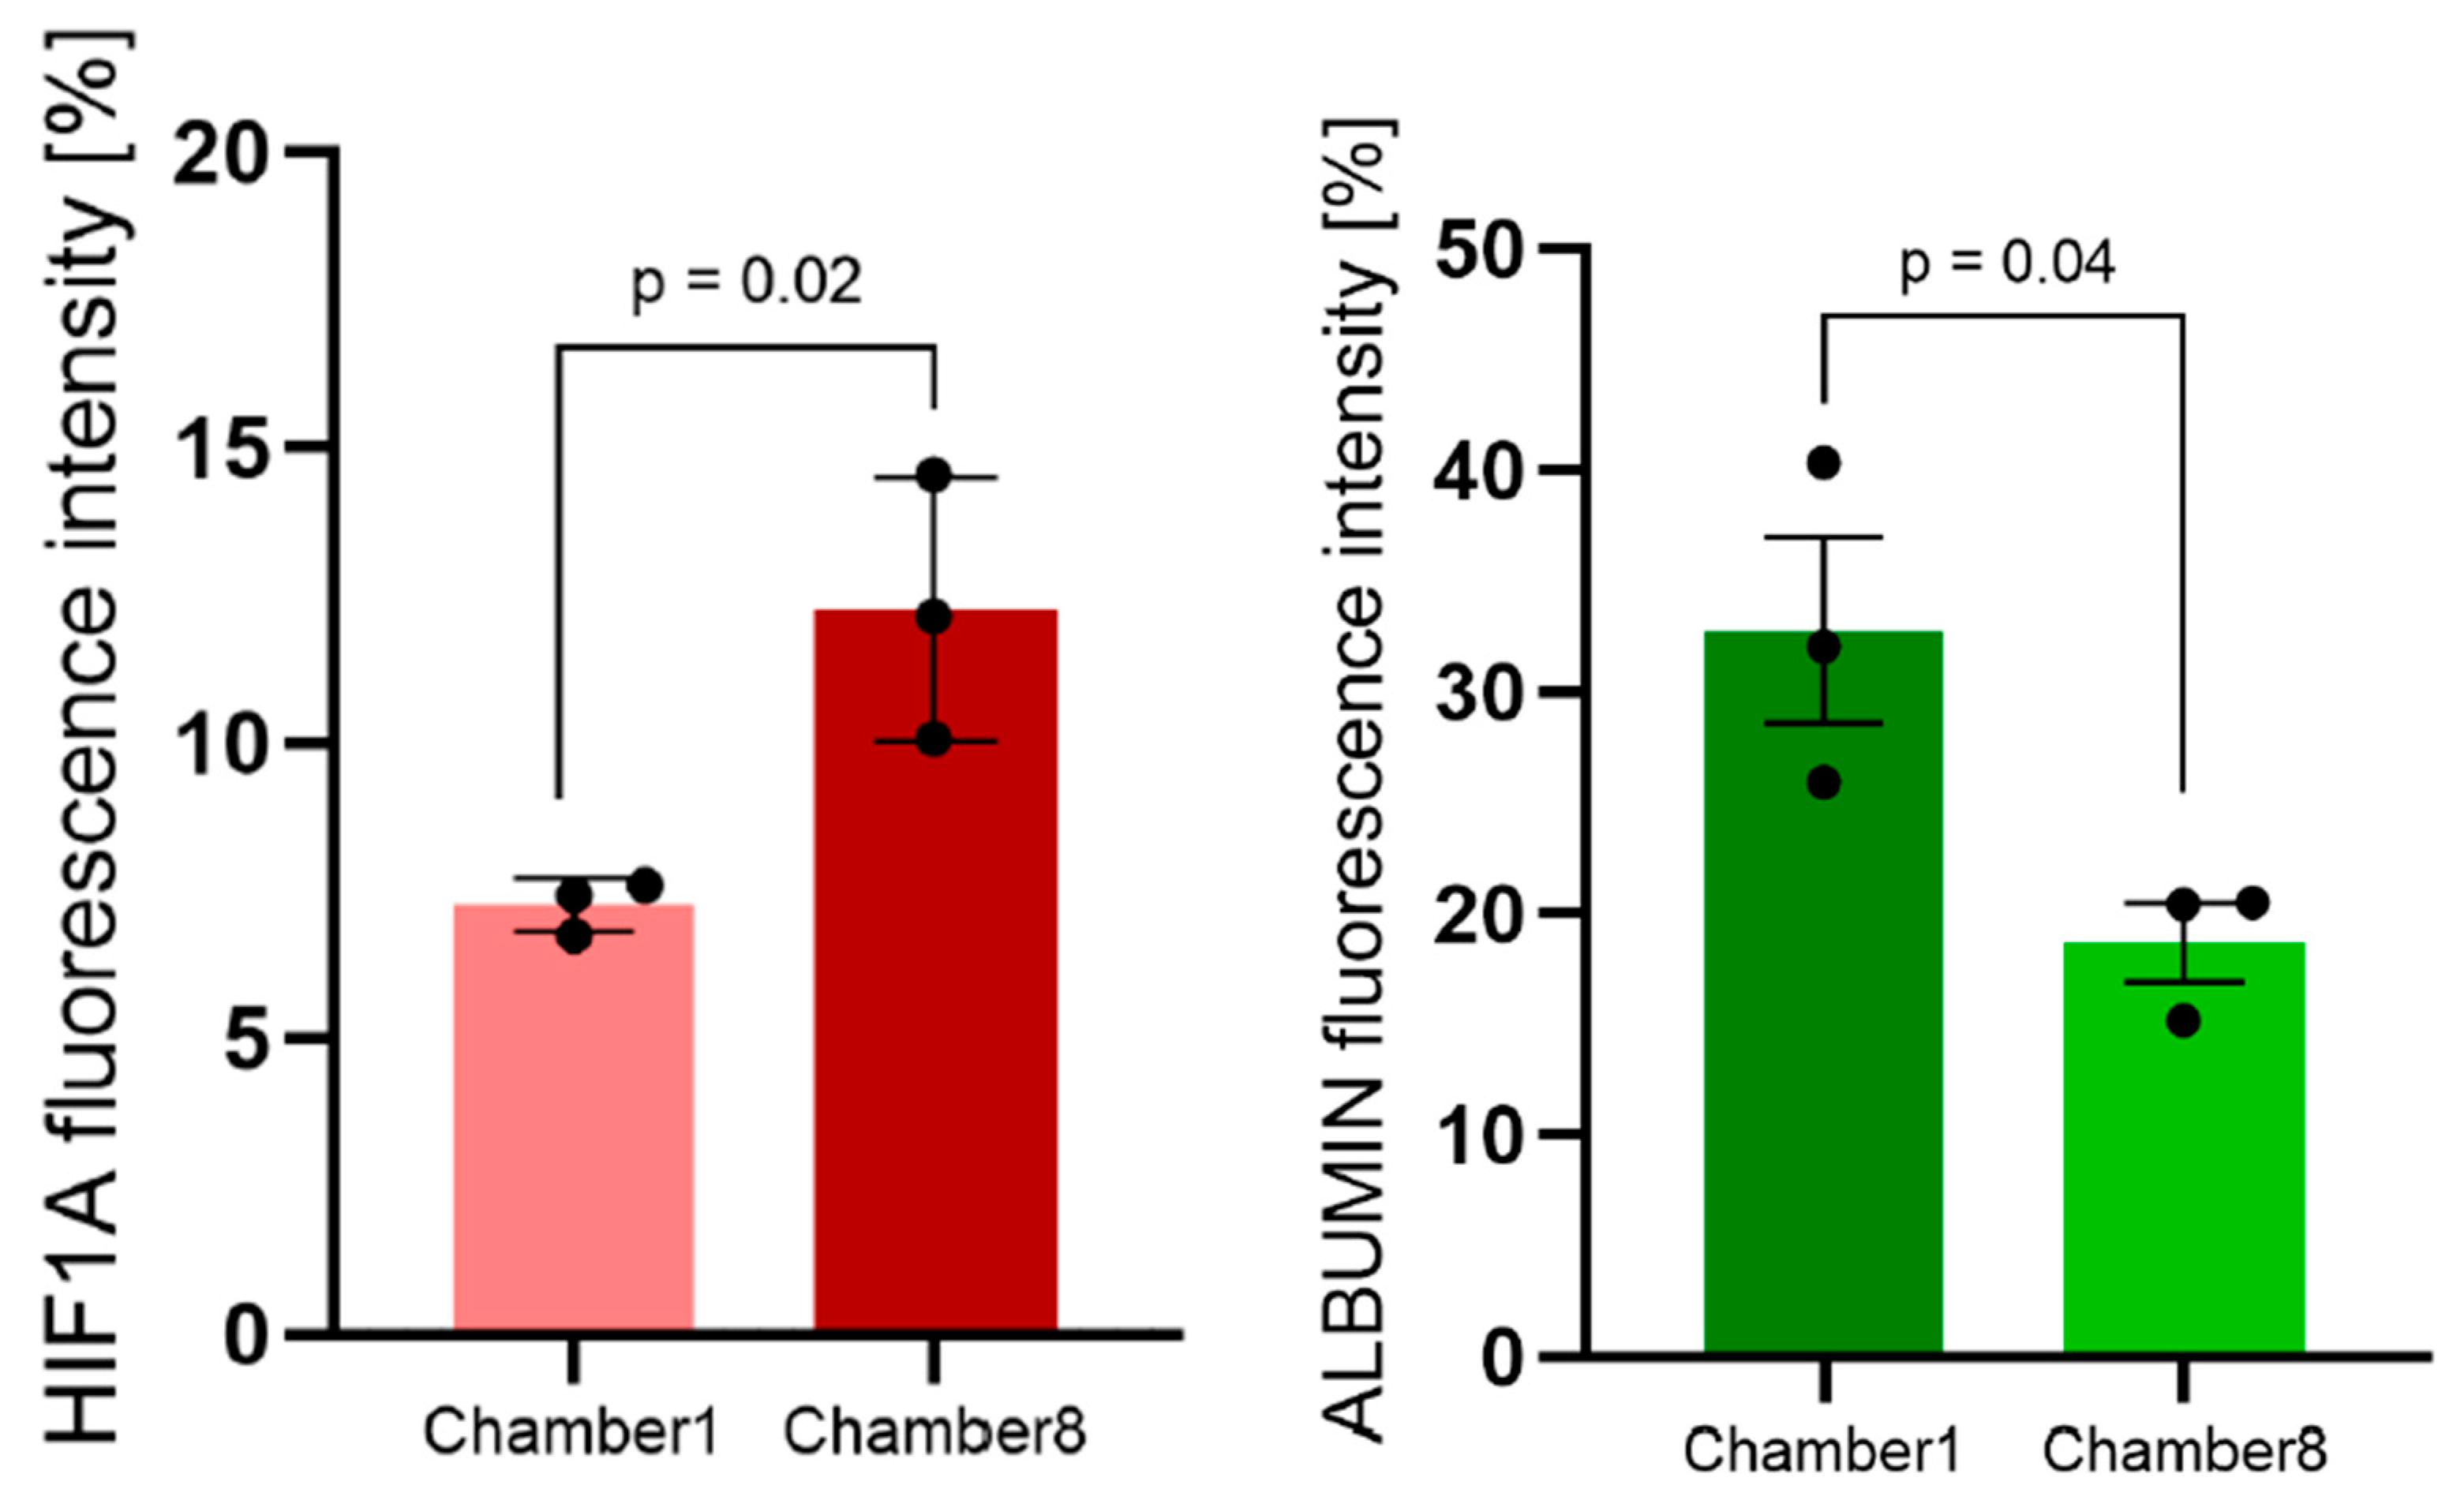
3.4. HIF1A and ALBUMIN mRNA Expressions
3.5. Cells Treated with CoCl2 or DFX
4. Discussion
5. Conclusions
Supplementary Materials
Author Contributions
Funding
Institutional Review Board Statement
Informed Consent Statement
Data Availability Statement
Acknowledgments
Conflicts of Interest
References
- Semenza, G.L. Hydroxylation of HIF-1: Oxygen sensing at the molecular level. Physiology 2004, 19, 176–182. [Google Scholar] [CrossRef]
- Semenza, G.L.; Wang, G.L. A nuclear factor induced by hypoxia via de novo protein synthesis binds to the human erythropoietin gene enhancer at a site required for transcriptional activation. Mol. Cell Biol. 1992, 12, 5447–5454. [Google Scholar] [CrossRef]
- Berra, E.; Benizri, E.; Ginouves, A.; Volmat, V.; Roux, D.; Pouyssegur, J. HIF prolyl-hydroxylase 2 is the key oxygen sensor setting low steady-state levels of HIF-1alpha in normoxia. EMBO J. 2003, 22, 4082–4090. [Google Scholar] [CrossRef]
- Kamura, T.; Sato, S.; Iwai, K.; Czyzyk-Krzeska, M.; Conaway, R.C.; Conaway, J.W. Activation of HIF1alpha ubiquitination by a reconstituted von Hippel-Lindau (VHL) tumor suppressor complex. Proc. Natl. Acad. Sci. USA 2000, 97, 10430–10435. [Google Scholar] [CrossRef] [PubMed]
- Salceda, S.; Caro, J. Hypoxia-inducible Factor 1a (HIF-1a) Protein is rapidly degraded by the ubiquitin-Proteasome System under normoxic conditions. J. Biol. Chem. 1997, 272, 22642–22647. [Google Scholar] [CrossRef]
- Kaelin, W.G., Jr.; Ratcliffe, P.J. Oxygen sensing by metazoans: The central role of the HIF hydroxylase pathway. Mol. Cell 2008, 30, 393–402. [Google Scholar] [CrossRef] [PubMed]
- Wenger, R.H.; Stiehl, D.P.; Camenisch, G. Integration of oxygen signaling at the consensus HRE. Sci. STKE 2005, 2005, re12. [Google Scholar] [CrossRef]
- Chaillou, T. Skeletal muscle fiber type in hypoxia: Adaptation to high-altitude exposure and under conditions of pathological hypoxia. Front. Physiol. 2018, 9, 1450. [Google Scholar] [CrossRef]
- Lunde, I.G.; Anton, S.L.; Bruusgaard, J.C.; Rana, Z.A.; Ellefsen, S.; Gundersen, K. Hypoxia inducible factor 1 links fast-patterned muscle activity and fast muscle phenotype in rats. J. Physiol. 2011, 589, 1443–1454. [Google Scholar] [CrossRef] [PubMed]
- Pisani, D.F.; Dechesne, C.A. Skeletal muscle HIF-1alpha expression is dependent on muscle fiber type. J. Gen. Physiol. 2005, 126, 173–178. [Google Scholar] [CrossRef]
- Semenza, G.L. HIF-1 and mechanisms of hypoxia sensing. Curr. Opin. Cell Biol. 2001, 13, 167–171. [Google Scholar] [CrossRef]
- Zheng, J. Energy metabolism of cancer: Glycolysis versus oxidative phosphorylation (Review). Oncol. Lett. 2012, 4, 1151–1157. [Google Scholar] [CrossRef]
- Evans, T.W. Review article: Albumin as a drug--biological effects of albumin unrelated to oncotic pressure. Aliment. Pharmacol. Ther. 2002, 16 (Suppl. 5), 6–11. [Google Scholar] [CrossRef]
- Gebhardt, R. Metabolic zonation of the liver: Regulation and implications for liver function. Pharmacol. Ther. 1992, 53, 275–354. [Google Scholar] [CrossRef] [PubMed]
- Cunningham, R.P.; Porat-Shliom, N. Liver zonation—Revisiting old questions with new technologies. Front. Physiol. 2021, 12, 732929. [Google Scholar] [CrossRef]
- Godoy, P.; Hewitt, N.J.; Albrecht, U.; Andersen, M.E.; Ansari, N.; Bhattacharya, S.; Bode, J.G.; Bolleyn, J.; Borner, C.; Bottger, J.; et al. Recent advances in 2D and 3D in vitro systems using primary hepatocytes, alternative hepatocyte sources and non-parenchymal liver cells and their use in investigating mechanisms of hepatotoxicity, cell signaling and ADME. Arch. Toxicol. 2013, 87, 1315–1530. [Google Scholar] [CrossRef] [PubMed]
- Semenza, G.L.; Roth, P.H.; Fang, H.M.; Wang, G.L. Transcriptional regulation of genes encoding glycolytic enzymes by hypoxia-inducible factor 1. J. Biol. Chem. 1994, 269, 23757–23763. [Google Scholar] [CrossRef]
- Woo, K.J.; Lee, T.J.; Park, J.W.; Kwon, T.K. Desferrioxamine, an iron chelator, enhances HIF-1alpha accumulation via cyclooxygenase-2 signaling pathway. Biochem. Biophys. Res. Commun. 2006, 343, 8–14. [Google Scholar] [CrossRef]
- Chiu, D.T.; Jeon, N.L.; Huang, S.; Kane, R.S.; Wargo, C.J.; Choi, I.S.; Ingber, D.E.; Whitesides, G.M. Patterned deposition of cells and proteins onto surfaces by using three-dimensional microfluidic systems. Proc. Natl. Acad. Sci. USA 2000, 97, 2408–2413. [Google Scholar] [CrossRef]
- Palacio-Castaneda, V.; Velthuijs, N.; Le Gac, S.; Verdurmen, W.P.R. Oxygen control: The often overlooked but essential piece to create better in vitro systems. Lab. Chip. 2022, 22, 1068–1092. [Google Scholar] [CrossRef]
- Sin, A.; Chin, K.C.; Jamil, M.F.; Kostov, Y.; Rao, G.; Shuler, M.L. The design and fabrication of three-chamber microscale cell culture analog devices with integrated dissolved oxygen sensors. Biotechnol. Prog. 2004, 20, 338–345. [Google Scholar] [CrossRef]
- Viravaidya, K.; Sin, A.; Shuler, M.L. Development of a microscale cell culture analog to probe naphthalene toxicity. Biotechnol. Prog. 2004, 20, 316–323. [Google Scholar] [CrossRef]
- Zhang, B.Y.; Korolj, A.; Lai, B.F.L.; Radisic, M. Advances in organ-on-a-chip engineering. Nat. Rev. Mater. 2018, 3, 257–278. [Google Scholar] [CrossRef]
- Alborzinia, H.; Can, S.; Holenya, P.; Scholl, C.; Lederer, E.; Kitanovic, I.; Wolfl, S. Real-time monitoring of cisplatin-induced cell death. PLoS ONE 2011, 6, e19714. [Google Scholar] [CrossRef]
- Theobald, J.; Ghanem, A.; Wallisch, P.; Banaeiyan, A.; Andrade-Navarro, M.; Taškova, K.; Haltmeier, M.; Kurtz, A.; Becker, H.; Reuter, S.; et al. Liver-kidney-on-chip to study toxicity of drug metabolites. ACS Biomater. Sci. Eng. 2018, 4, 78–89. [Google Scholar] [CrossRef]
- Ghafoory, S.; Varshney, R.; Robison, T.; Kouzbari, K.; Woolington, S.; Murphy, B.; Xia, L.; Ahamed, J. Platelet TGF-beta1 deficiency decreases liver fibrosis in a mouse model of liver injury. Blood Adv. 2018, 2, 470–480. [Google Scholar] [CrossRef]
- Ghafoory, S.; Breitkopf-Heinlein, K.; Li, Q.; Dzieran, J.; Scholl, C.; Dooley, S.; Wolfl, S. A fast and efficient polymerase chain reaction-based method for the preparation of in situ hybridization probes. Histopathology 2012, 61, 306–313. [Google Scholar] [CrossRef]
- Gebhardt, R.; Matz-Soja, M. Liver zonation: Novel aspects of its regulation and its impact on homeostasis. World J. Gastroenterol. 2014, 20, 8491–8504. [Google Scholar] [CrossRef]
- Ghafoory, S.; Breitkopf-Heinlein, K.; Li, Q.; Scholl, C.; Dooley, S.; Wolfl, S. Zonation of nitrogen and glucose metabolism gene expression upon acute liver damage in mouse. PLoS ONE 2013, 8, e78262. [Google Scholar] [CrossRef]
- Lee-Montiel, F.T.; George, S.M.; Gough, A.H.; Sharma, A.D.; Wu, J.; DeBiasio, R.; Vernetti, L.A.; Taylor, D.L. Control of oxygen tension recapitulates zone-specific functions in human liver microphysiology systems. Exp. Biol. Med. 2017, 242, 1617–1632. [Google Scholar] [CrossRef]
- Tonon, F.; Giobbe, G.G.; Zambon, A.; Luni, C.; Gagliano, O.; Floreani, A.; Grassi, G.; Elvassore, N. In vitro metabolic zonation through oxygen gradient on a chip. Sci. Rep. 2019, 9, 1–10. [Google Scholar] [CrossRef]
- Brennan, M.D.; Rexius-Hall, M.L.; Elgass, L.J.; Eddington, D.T. Oxygen control with microfluidics. Lab. Chip. 2014, 14, 4305–4318. [Google Scholar] [CrossRef]
- Kubis, H.P.; Hanke, N.; Scheibe, R.J.; Gros, G. Accumulation and nuclear import of HIF1 alpha during high and low oxygen concentration in skeletal muscle cells in primary culture. Biochim. Biophys. Acta 2005, 1745, 187–195. [Google Scholar] [CrossRef]
- Guo, R.; Xu, X.; Lu, Y.; Xie, X. Physiological oxygen tension reduces hepatocyte dedifferentiation in in vitro culture. Sci. Rep. 2017, 7, 5923. [Google Scholar] [CrossRef]
- Kietzmann, T. Metabolic zonation of the liver: The oxygen gradient revisited. Redox. Biol. 2017, 11, 622–630. [Google Scholar] [CrossRef]


| Antibodies | Species | Company | Lot | Ratio |
|---|---|---|---|---|
| Anti-Albumin | Mouse | R&D system, Minneapolis, MN, USA | MAB1455 | 1:250 |
| Anti-Hif1α | Rabbit (polyclonal) | Atlas antibodies, Bromma, Sweden | HPA001275 | 1:250 |
| 2nd Anti-rabbit 594 nm | Goat | Sigma-Aldrich, St. Louis, MA, USA | SAB4600107 | 1:250 |
| 2nd Anti-mouse 488 nm | Goat | Cell signaling, Danvers, MA, USA | 4408 s | 1:250 |
| Gene | NCBI Reference Sequence | Primer Sequence | |
|---|---|---|---|
| Human ALBUMIN | NM_000477.7 | Forward | CAGTGAATTGATTTAGGTGACACTATAGAAGTGCTGCTGACTTGCCTTCATTAGCTGC |
| Reverse | CAGTGAATTGTAATACGACTCACTATAGGGAGACCTGTTCACCAAGGATTCTGTGCAG | ||
| Human HIF1A | NM_001530.4 | Forward | CAGTGAATTGATTTAGGTGACACTATAGAAGTGCATGGAAGGTATTGCACTGCACAGG |
| Reverse | CAGTGAATTGTAATACGACTCACTATAGGGAGACAGCACTACTTCGAAGTGGCTTTGG |
| Time | Inlet | Outlet | |||
|---|---|---|---|---|---|
| All Conditions | 1MC | 2MCs | 3MCs | 4MCs | |
| 30 min | 20.25 ± 0.06 | 20.09 ± 0.29 | 19.46 ± 0.34 | 19.05 ± 0.09 | 18.52 ± 1.26 |
| 12 h | 18.99 ± 0.42 | 18.77 ± 0.08 | 18.29 ± 0.20 | 17.48 ± 0.25 | 16.31 ± 0.23 |
| 24 h | 18.05 ± 0.10 | 18.10 ± 0.36 | 17.15 ± 0.14 | 16.92 ± 0.16 | 16.16 ± 0.35 |
| 48 h | 17.55 ± 0.09 | 17.40 ± 0.19 | 16.84 ± 0.07 | 16.68 ± 0.30 | 16.18 ± 0.43 |
| 72 h | 17.55 ± 0.05 | 17.31 ± 0.12 | 16.79 ± 0.09 | 16.56 ± 0.27 | 15.95 ± 0.36 |
Publisher’s Note: MDPI stays neutral with regard to jurisdictional claims in published maps and institutional affiliations. |
© 2022 by the authors. Licensee MDPI, Basel, Switzerland. This article is an open access article distributed under the terms and conditions of the Creative Commons Attribution (CC BY) license (https://creativecommons.org/licenses/by/4.0/).
Share and Cite
Ghafoory, S.; Stengl, C.; Kopany, S.; Mayadag, M.; Mechtel, N.; Murphy, B.; Schattschneider, S.; Wilhelmi, N.; Wölfl, S. Oxygen Gradient Induced in Microfluidic Chips Can Be Used as a Model for Liver Zonation. Cells 2022, 11, 3734. https://doi.org/10.3390/cells11233734
Ghafoory S, Stengl C, Kopany S, Mayadag M, Mechtel N, Murphy B, Schattschneider S, Wilhelmi N, Wölfl S. Oxygen Gradient Induced in Microfluidic Chips Can Be Used as a Model for Liver Zonation. Cells. 2022; 11(23):3734. https://doi.org/10.3390/cells11233734
Chicago/Turabian StyleGhafoory, Shahrouz, Christina Stengl, Stefan Kopany, Mert Mayadag, Nils Mechtel, Brennah Murphy, Sebastian Schattschneider, Niklas Wilhelmi, and Stefan Wölfl. 2022. "Oxygen Gradient Induced in Microfluidic Chips Can Be Used as a Model for Liver Zonation" Cells 11, no. 23: 3734. https://doi.org/10.3390/cells11233734
APA StyleGhafoory, S., Stengl, C., Kopany, S., Mayadag, M., Mechtel, N., Murphy, B., Schattschneider, S., Wilhelmi, N., & Wölfl, S. (2022). Oxygen Gradient Induced in Microfluidic Chips Can Be Used as a Model for Liver Zonation. Cells, 11(23), 3734. https://doi.org/10.3390/cells11233734