
Mutation of Tyrosine Sites in the Human Alpha-Synuclein Gene Induces Neurotoxicity in Transgenic Mice with Soluble Alpha-Synuclein Oligomer Formation


 and
and 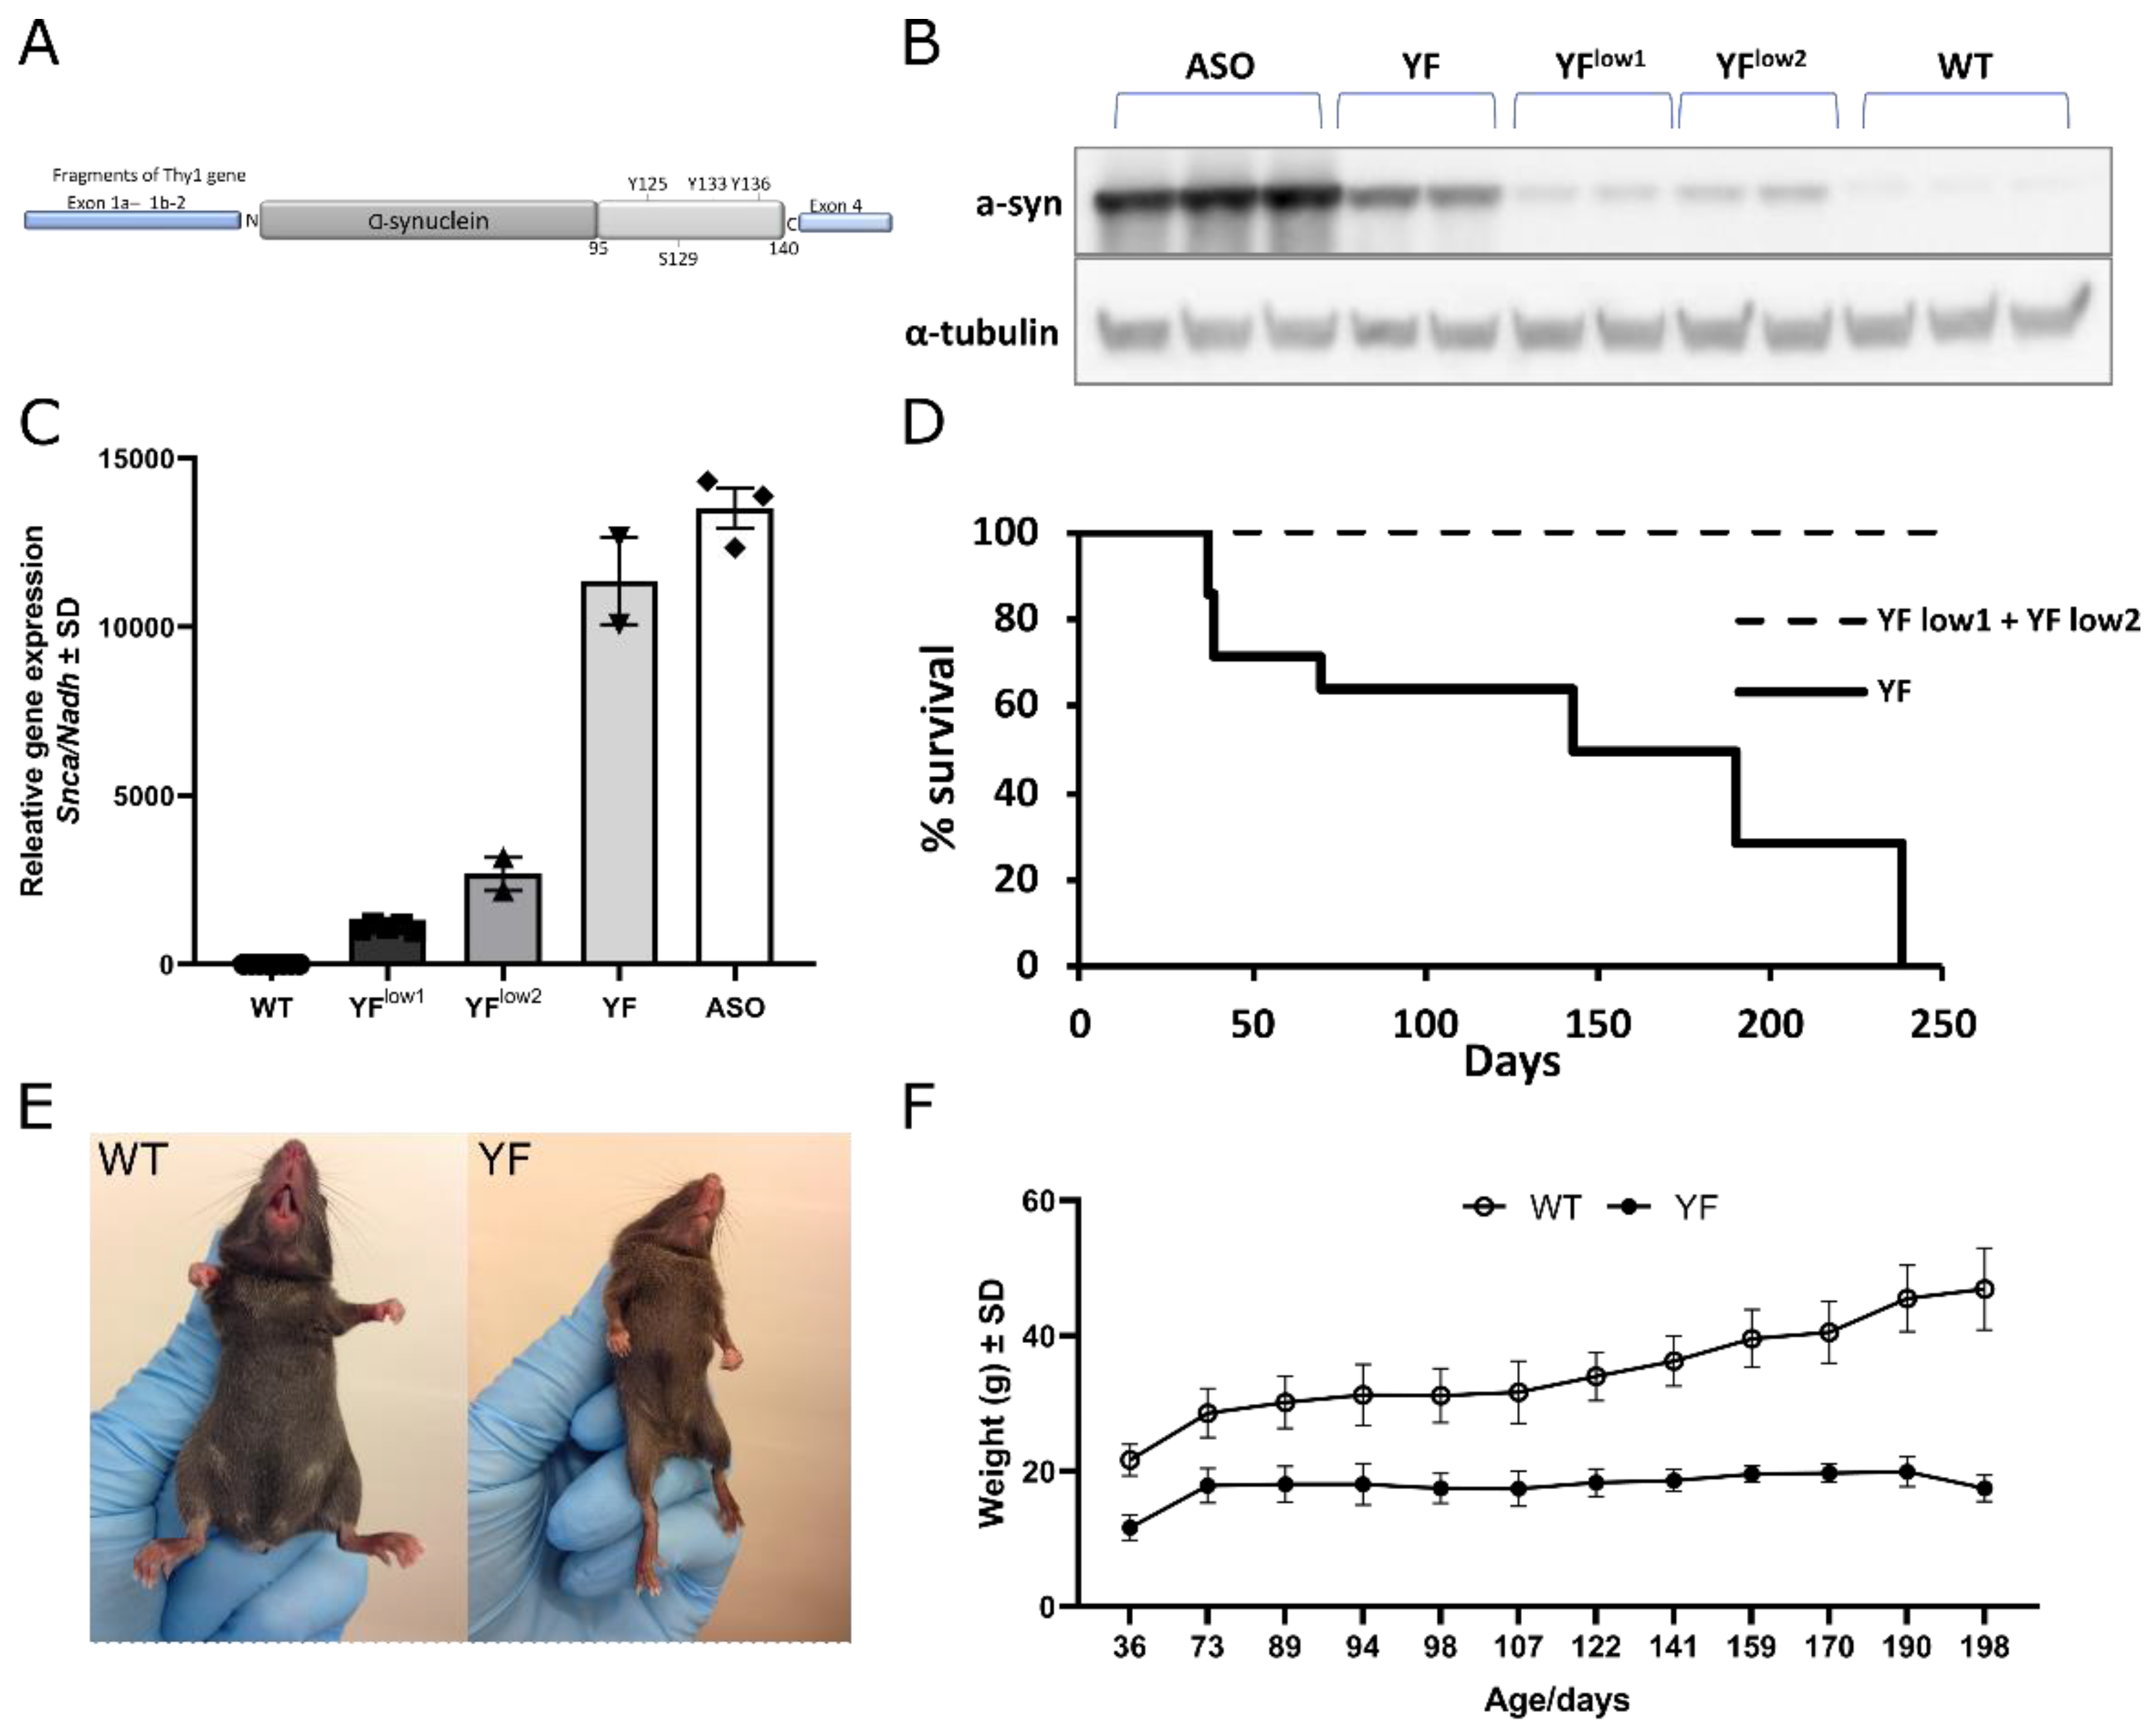
Abstract
1. Introduction
2. Materials and Methods
2.1. Generation of Transgenic Mouse Lines
2.2. Behavioral Tests
2.2.1. Open Field
2.2.2. Rotarod
2.2.3. Elevated Maze
2.2.4. Object Exploration Test
2.2.5. Force Test
2.2.6. Hind-Limb Clasping Test
2.2.7. Adhesive Removal Test
2.2.8. Gait Analysis
2.3. mRNA Extraction and qPCR
2.4. Western Blotting
2.5. Immunohistochemistry
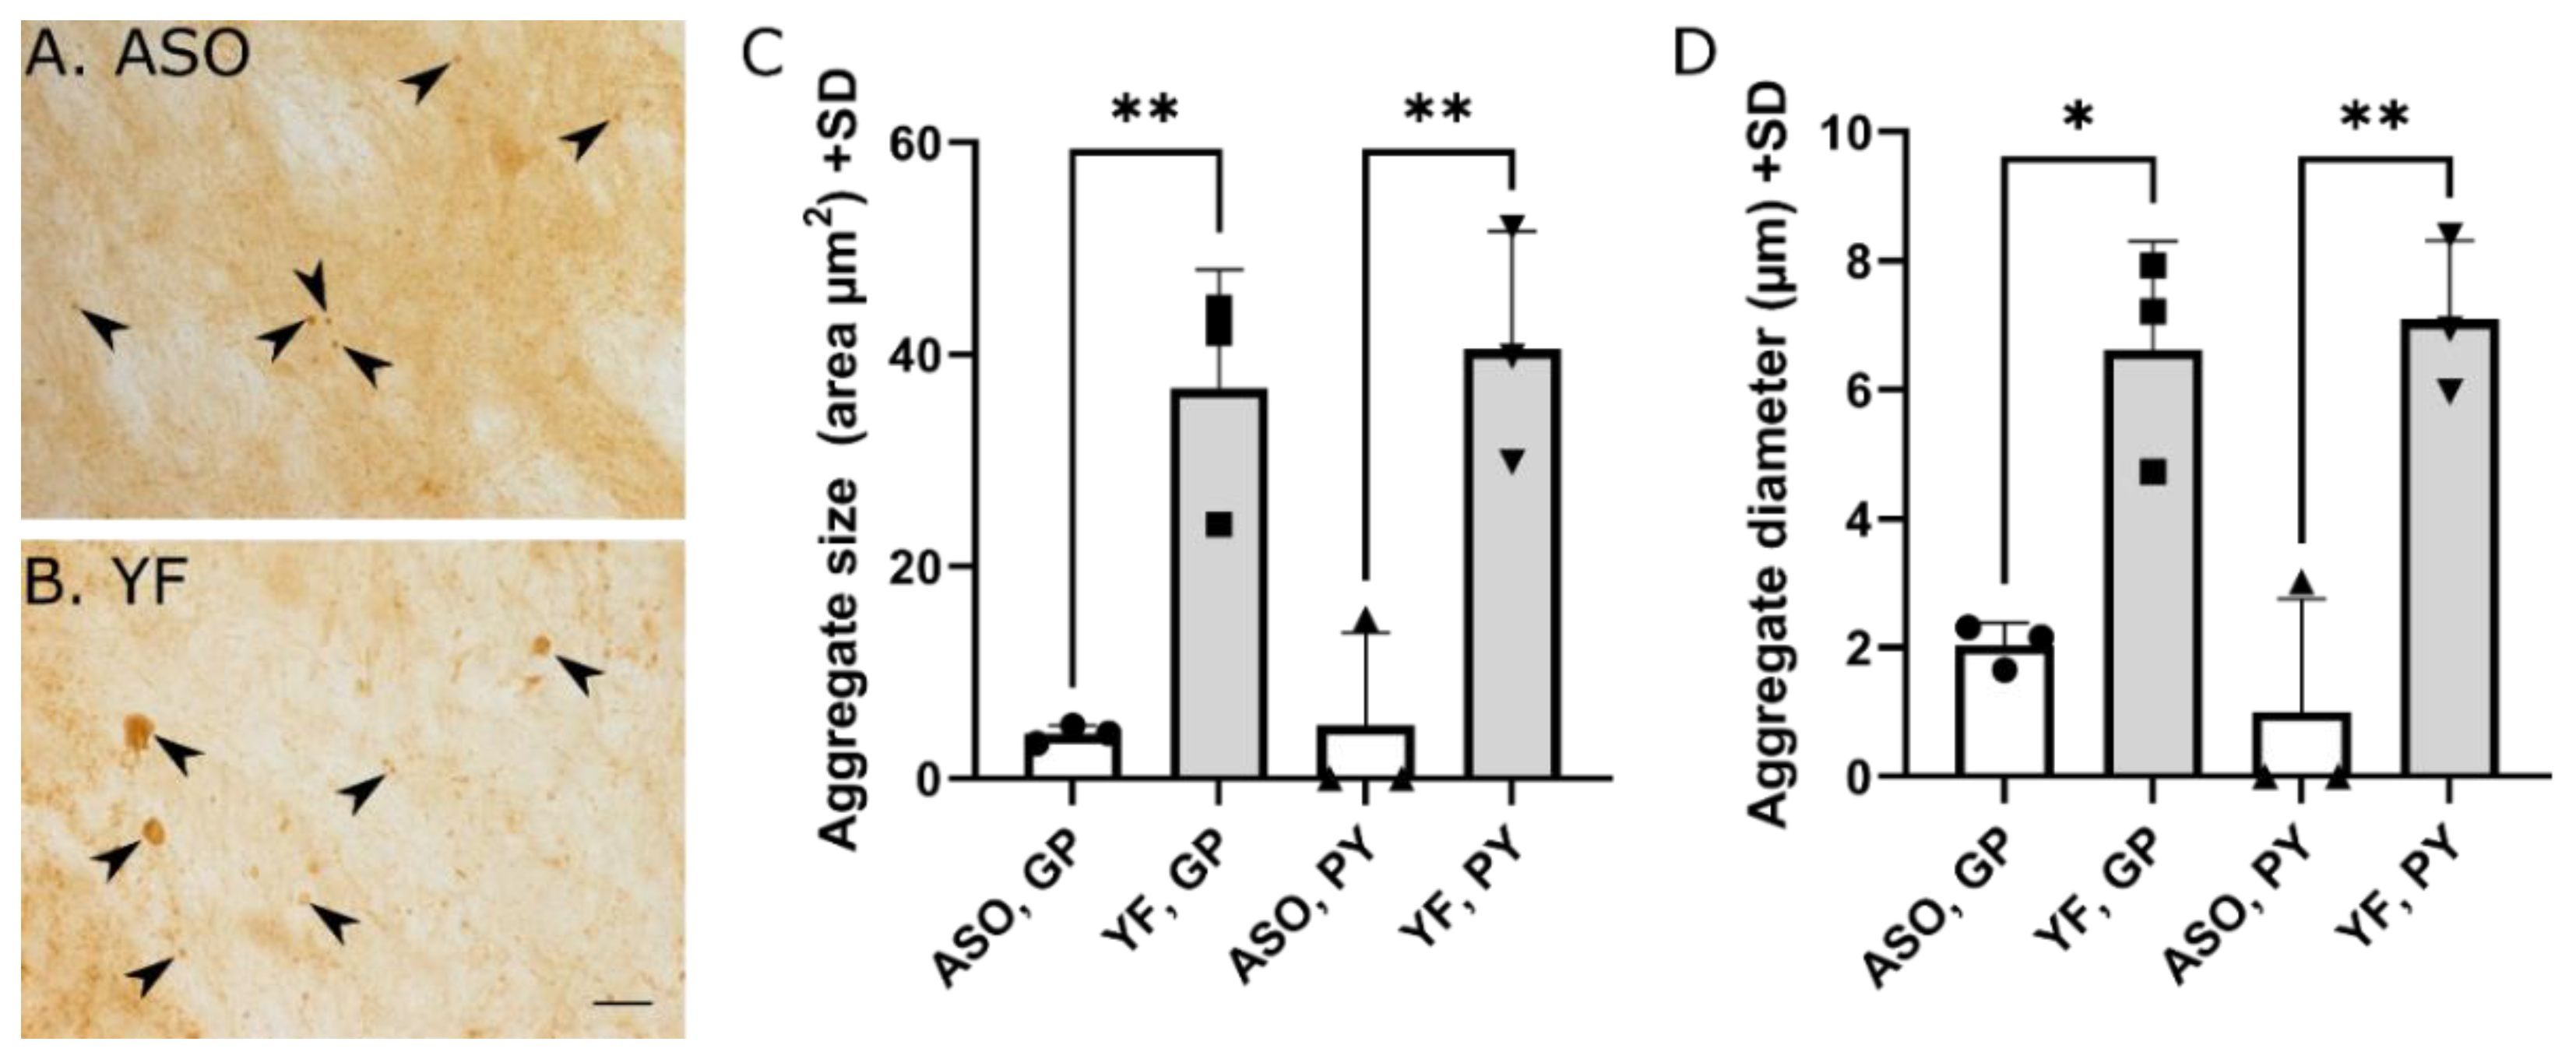
2.6. Quantification of Aggregate Size
2.7. Oligomer/Total α-Synuclein ELISA
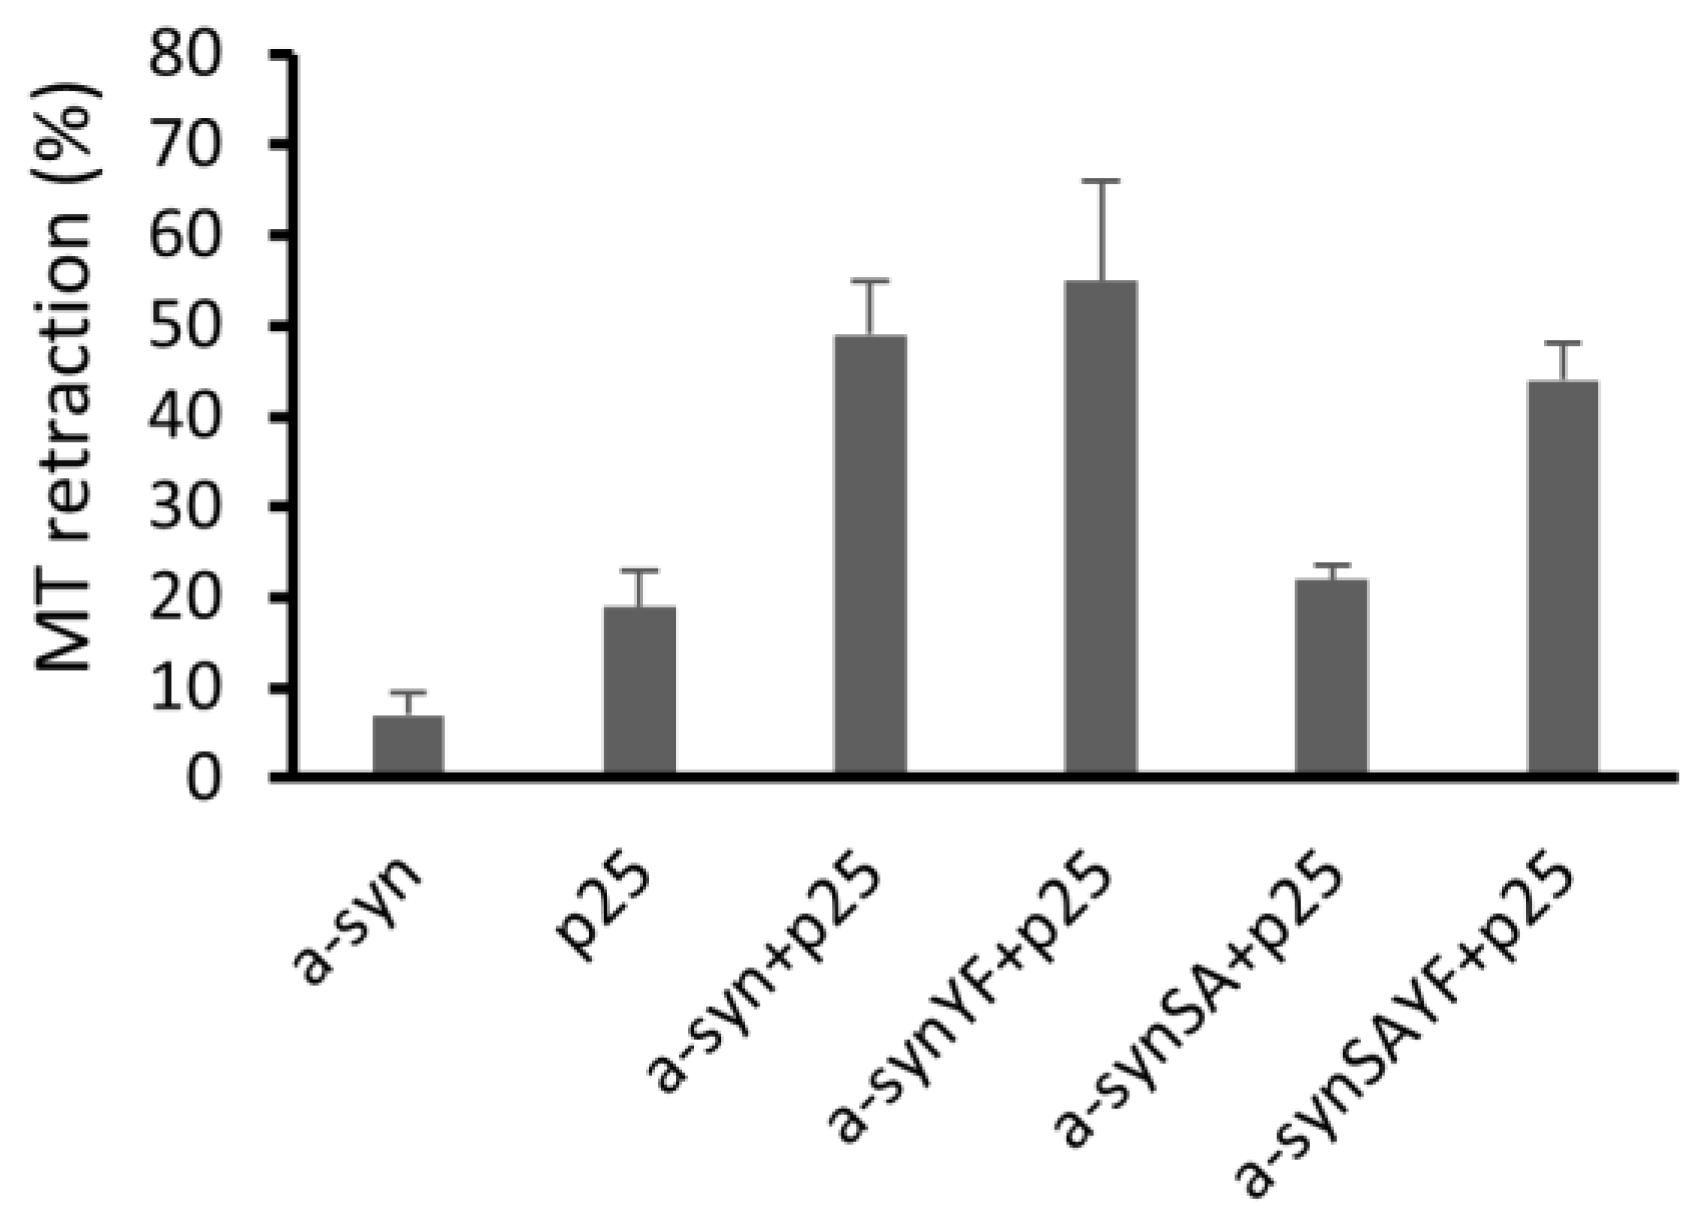
2.8. Microtubule Retraction Assay
2.9. Statistics
3. Results
3.1. YF Mice Express α-Synuclein at Lower Levels Than ASO Mice
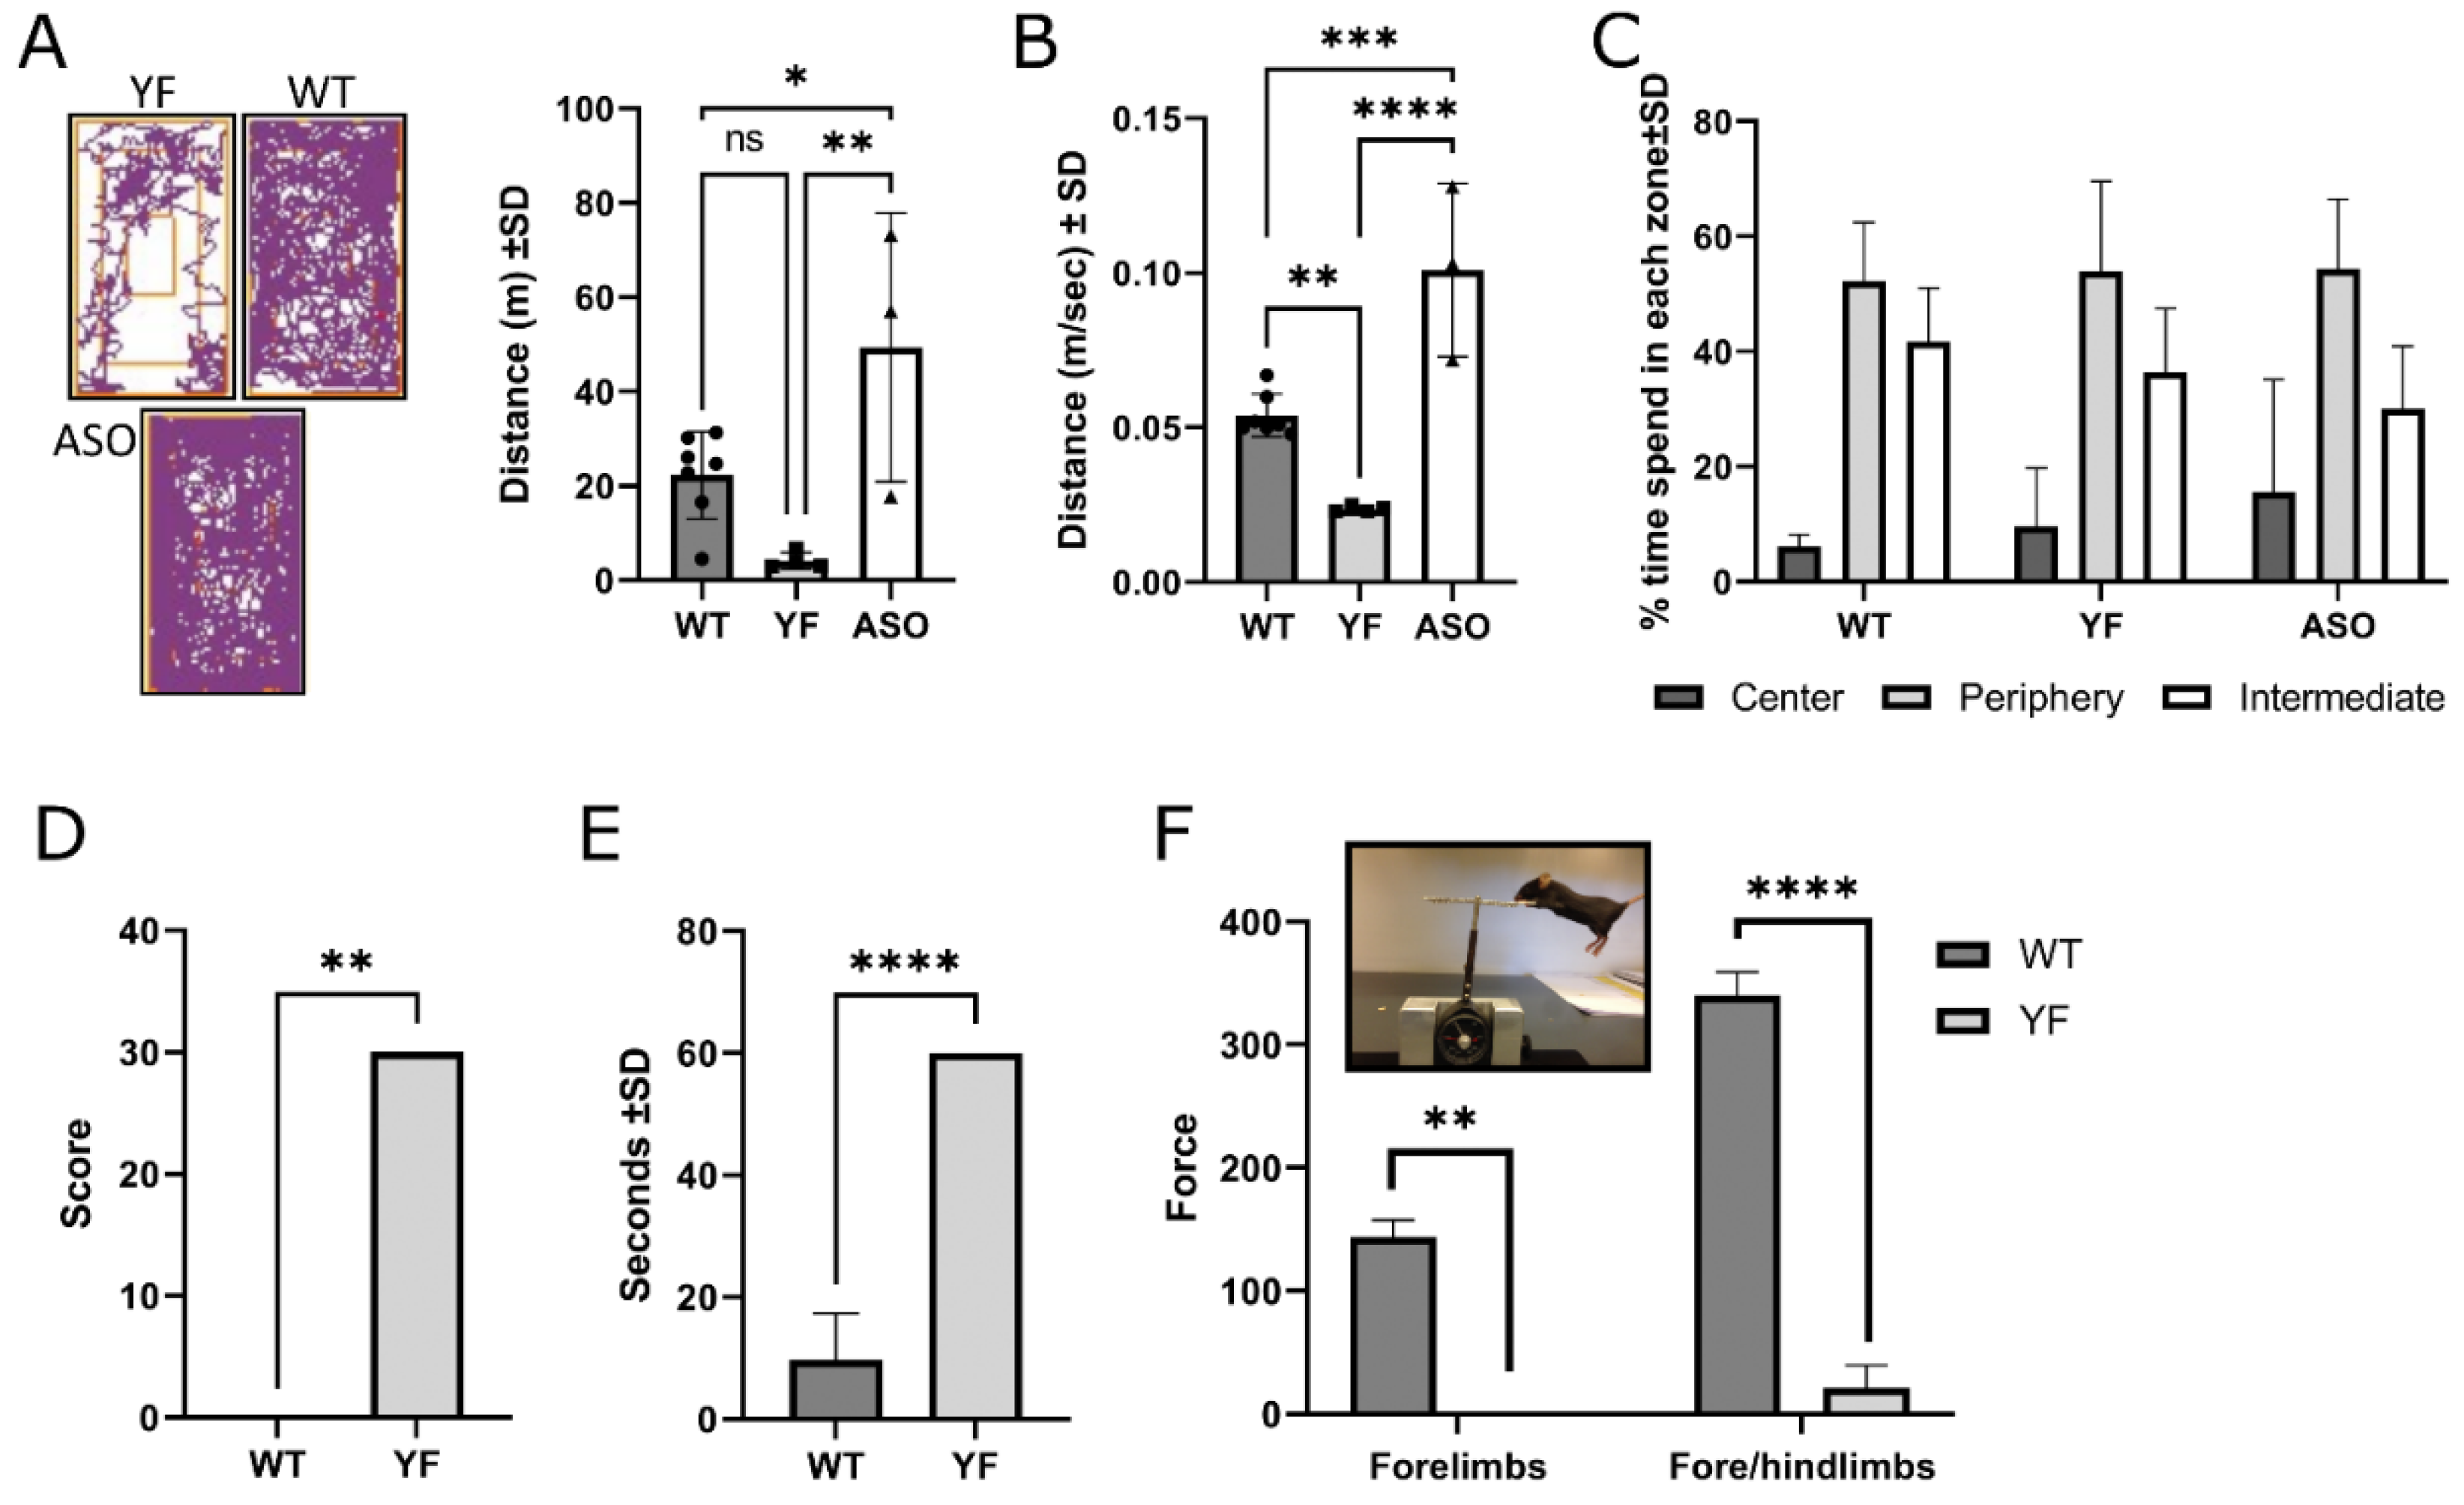
3.2. YF Mice Are Severely Motor-Impaired
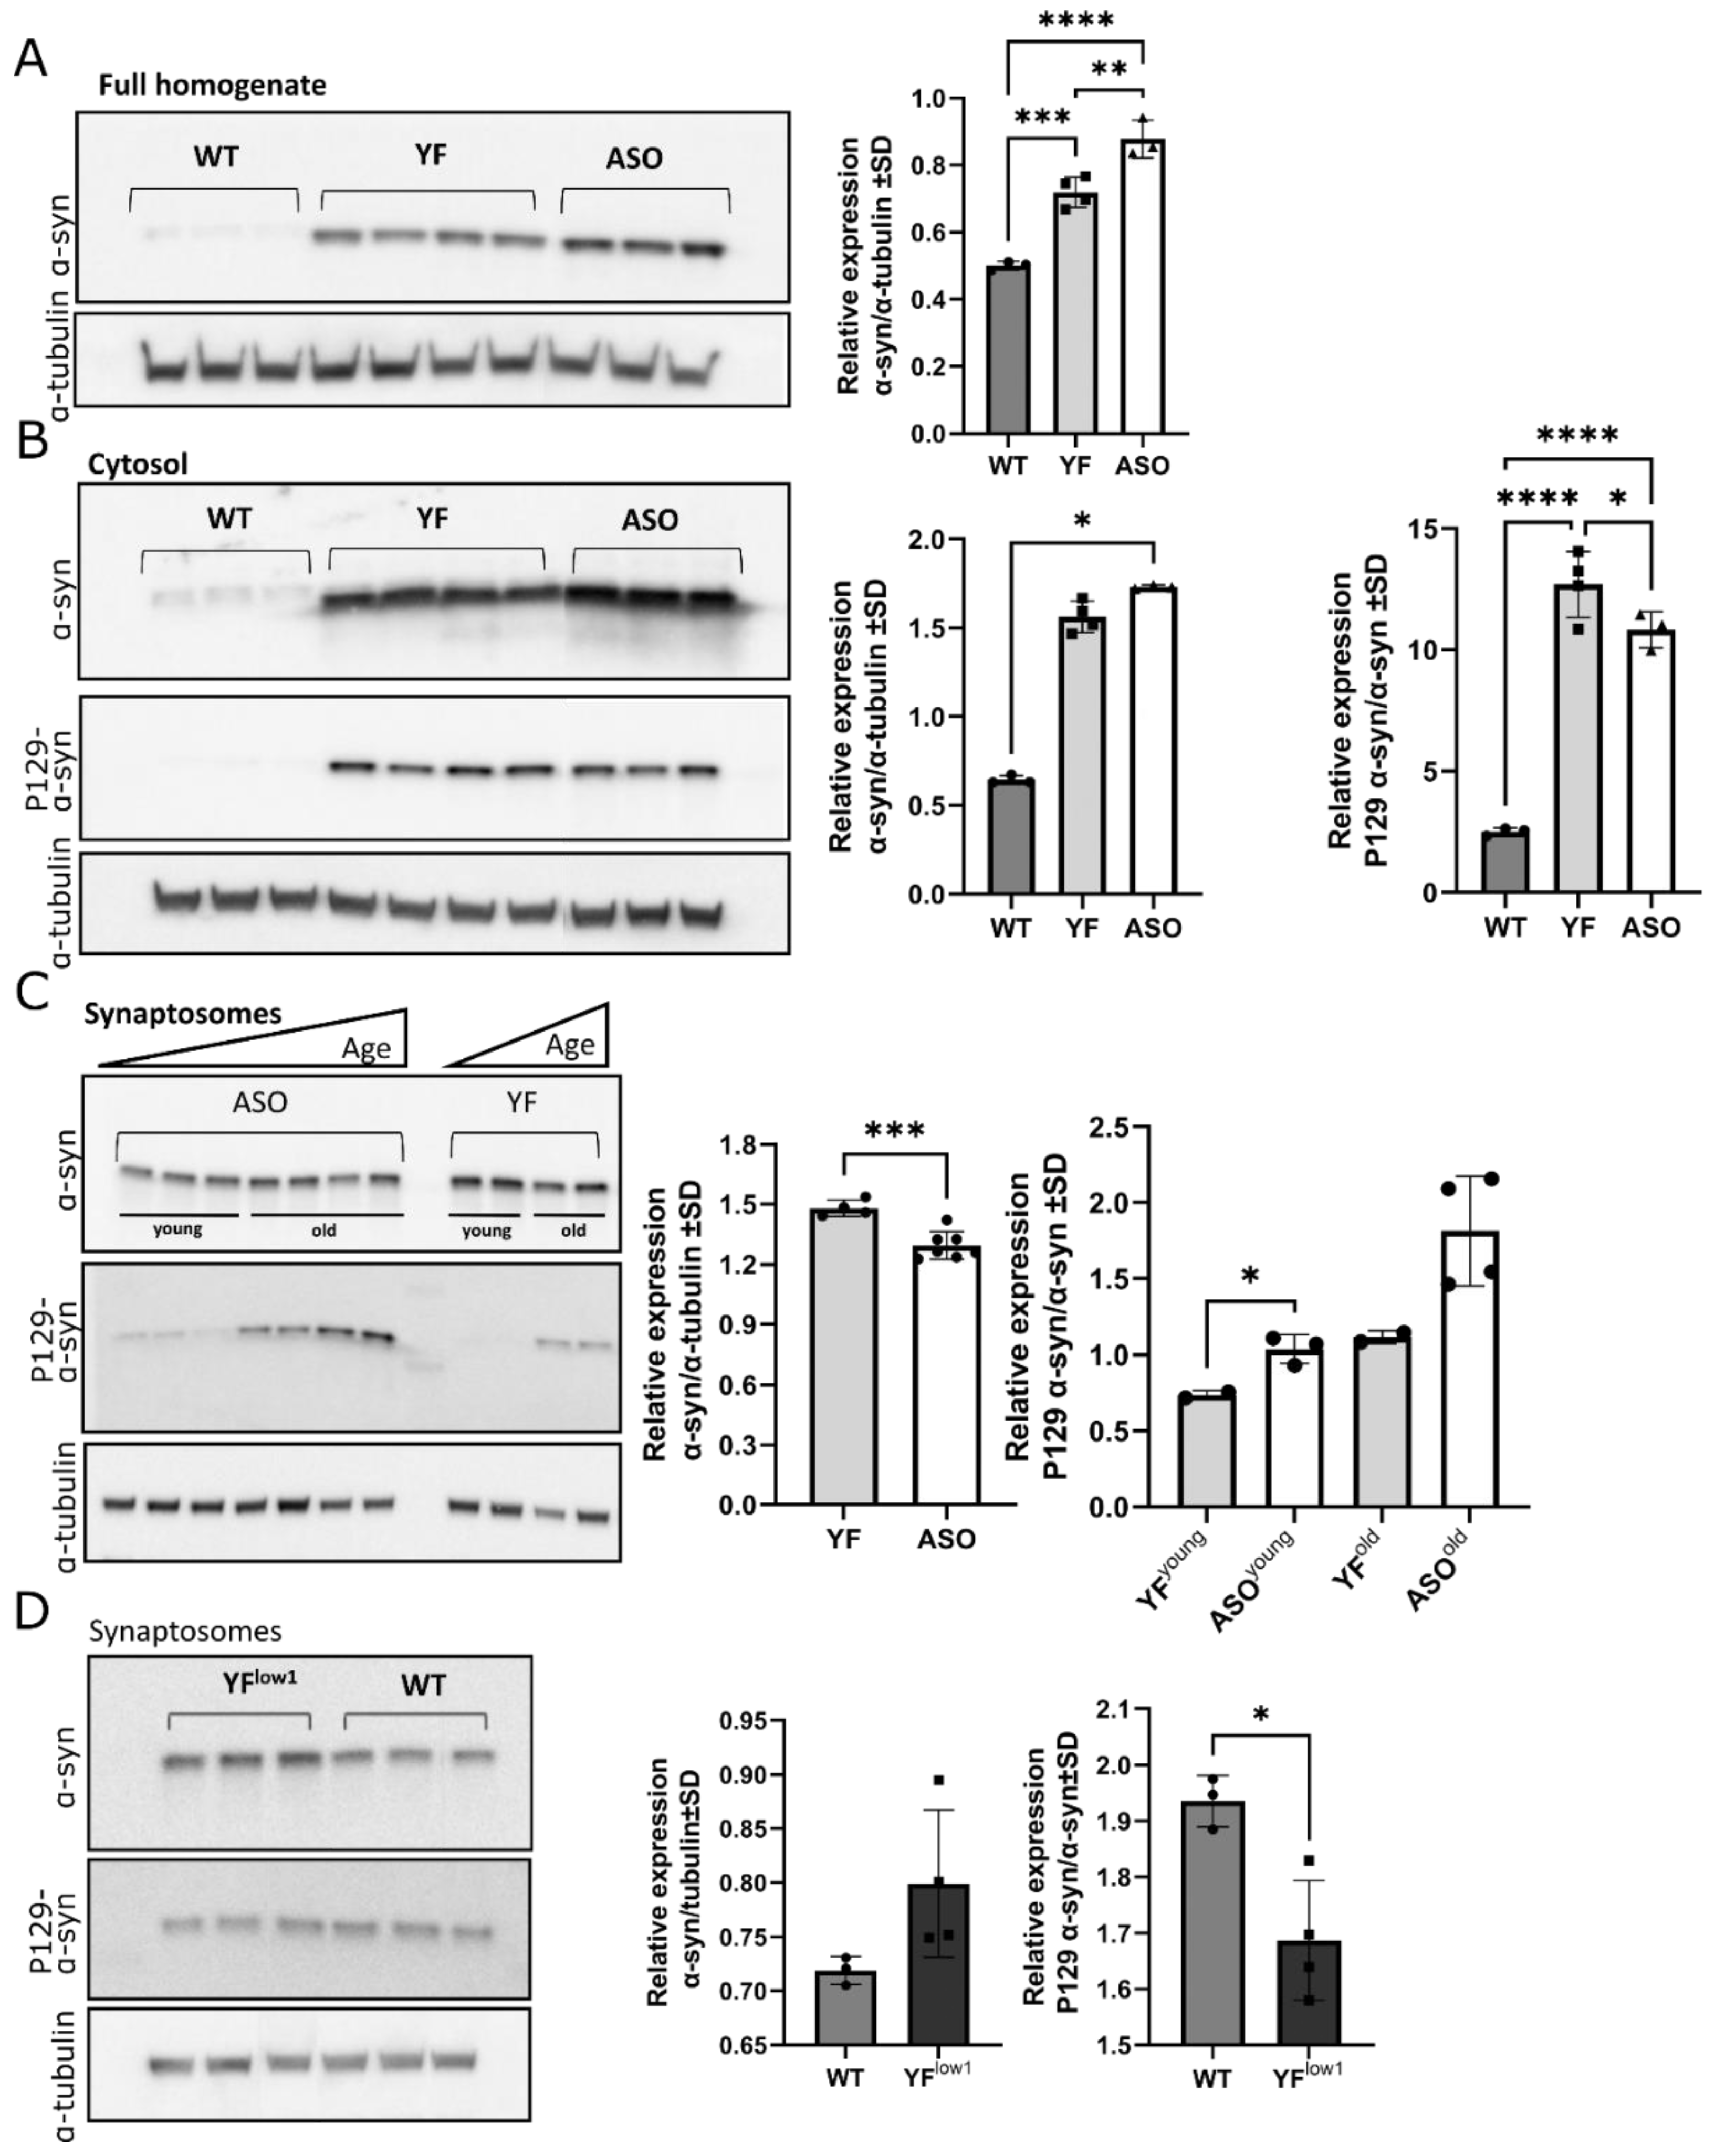
3.3. YF Mice Accumulate α-Synuclein in the Synaptosomes
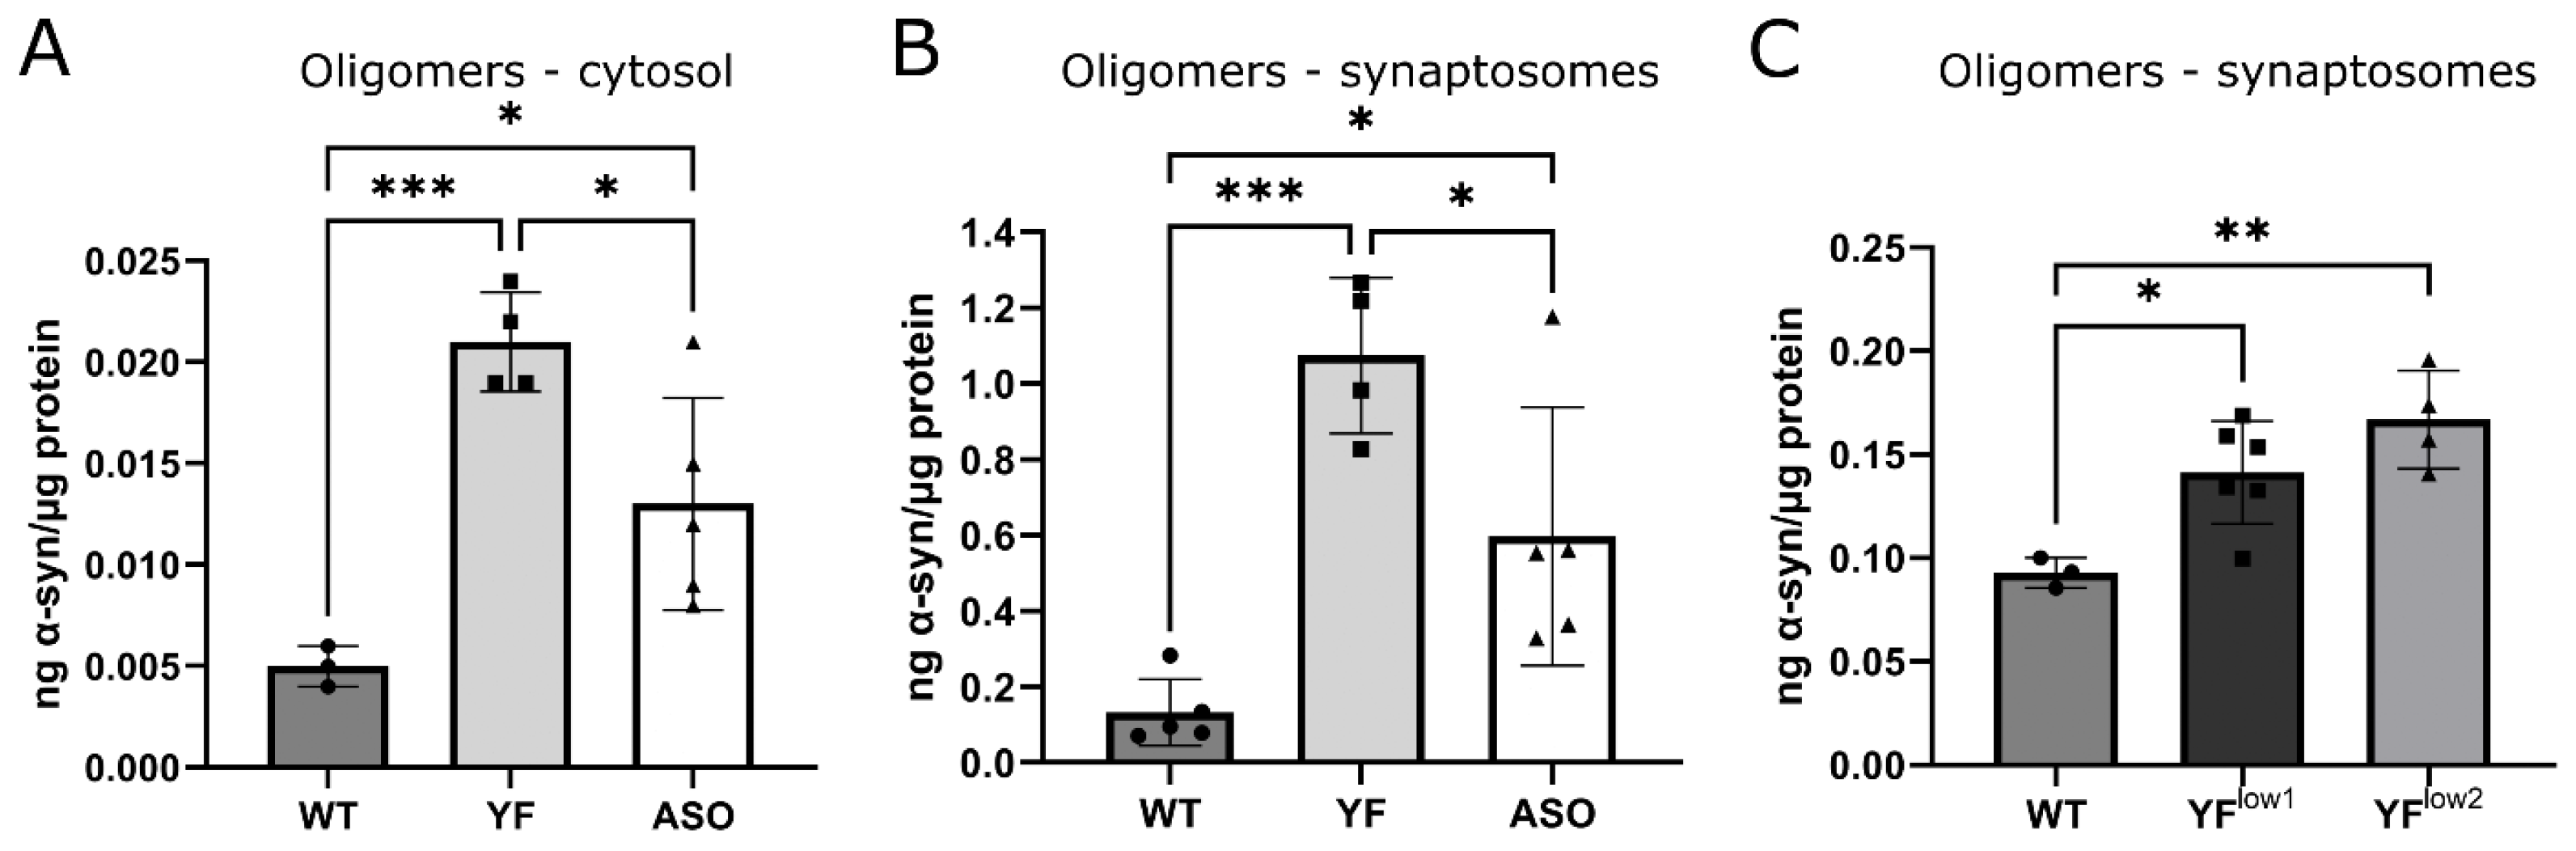
3.4. YF Mice Have High Amounts of Soluble α-Synuclein Oligomers
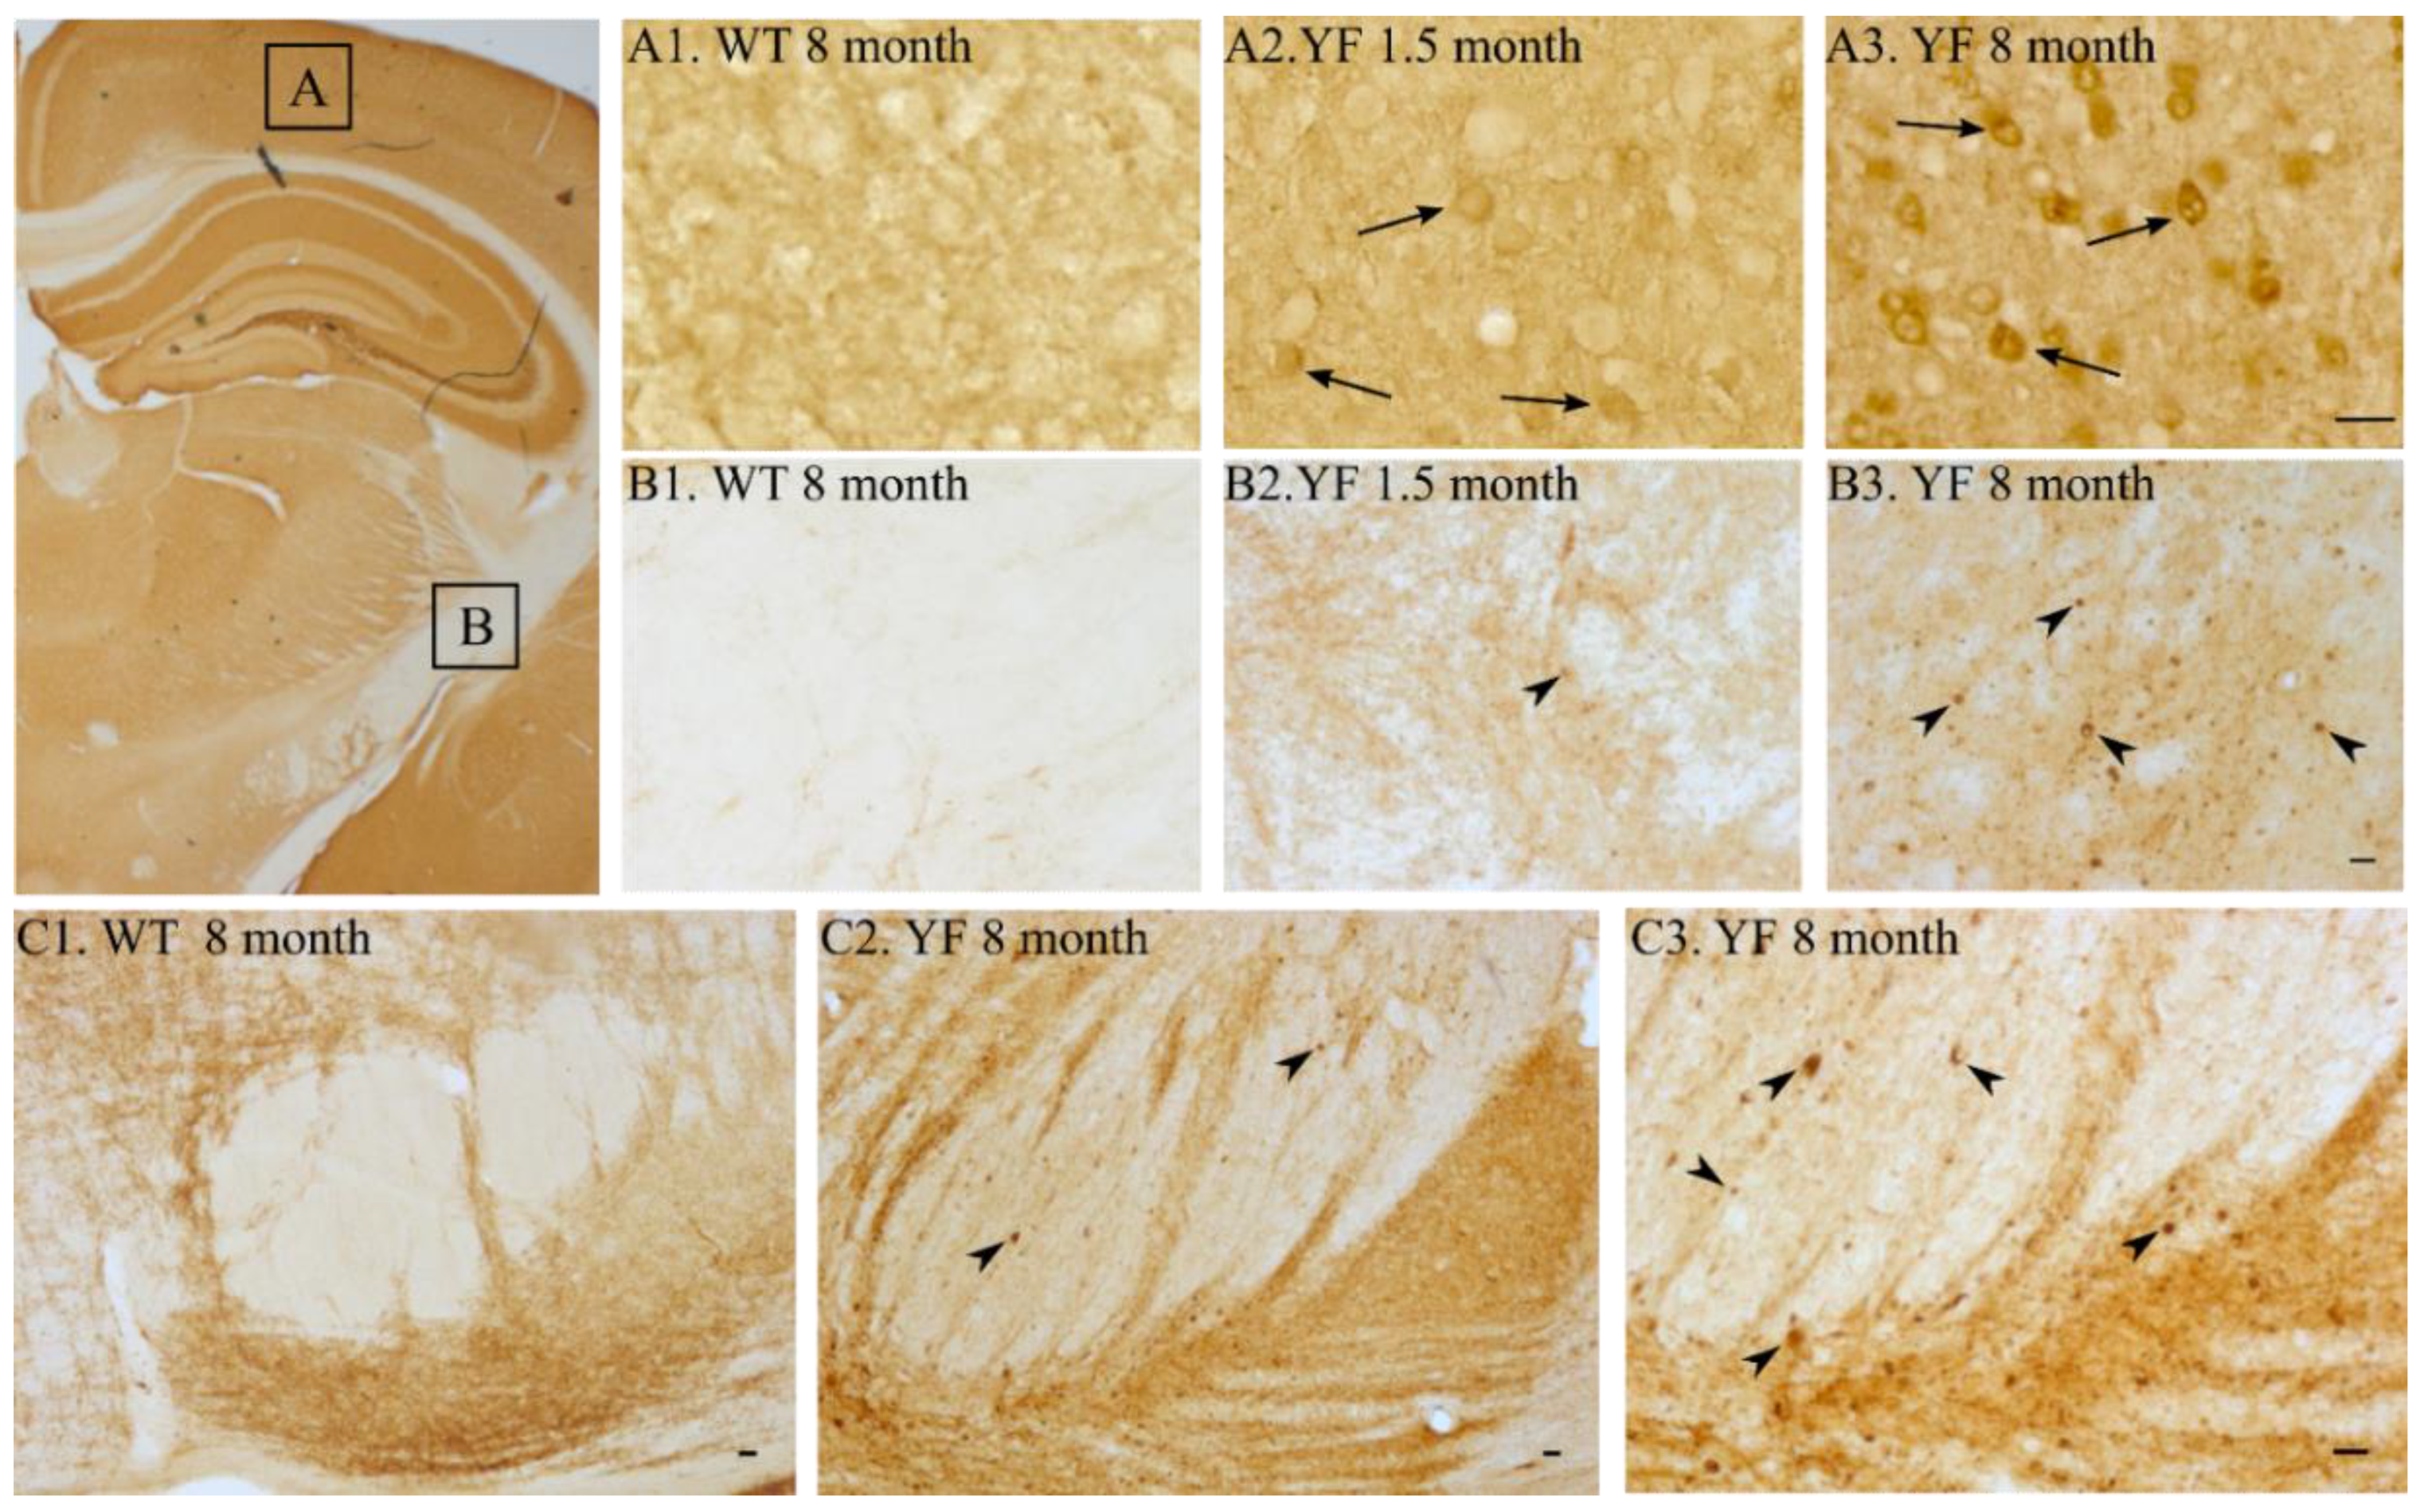
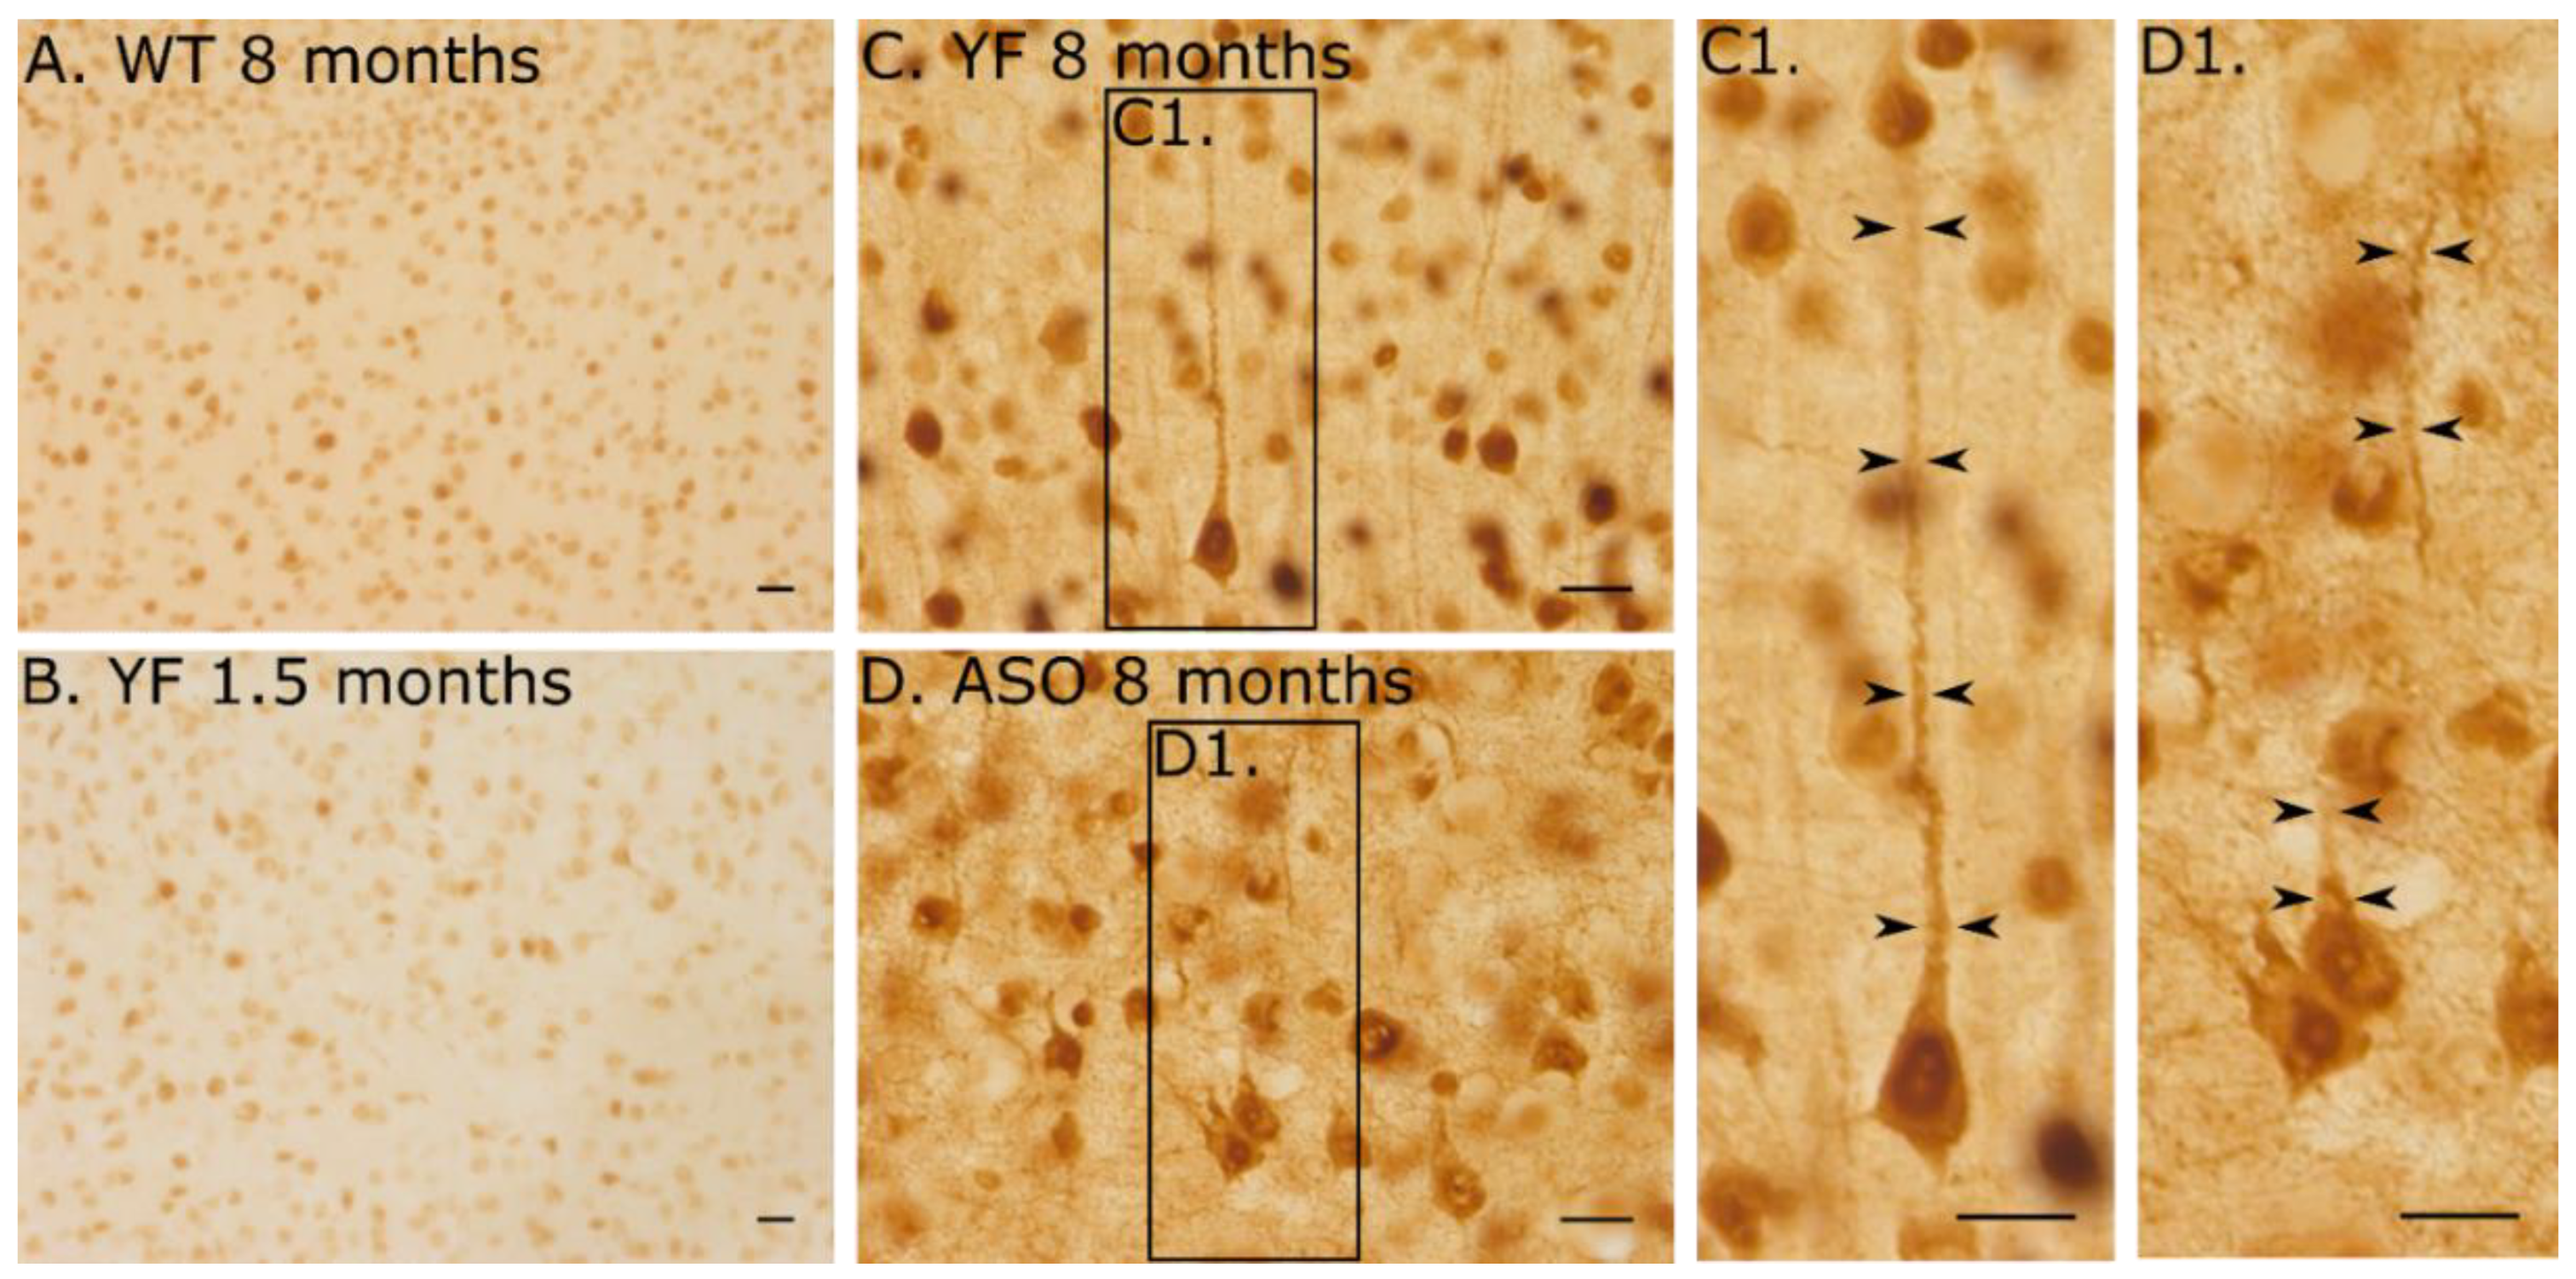
3.5. YF Have High Amounts of α-Synuclein in Cerebral Cortex and Limbic Structures
4. Discussion
Supplementary Materials
Author Contributions
Funding
Institutional Review Board Statement
Informed Consent Statement
Data Availability Statement
Acknowledgments
Conflicts of Interest
Abbreviations
References
- Upcott, M.; Chaprov, K.D.; Buchman, V.L. Toward a Disease-Modifying Therapy of Alpha-Synucleinopathies: New Molecules and New Approaches Came into the Limelight. Molecules 2021, 26, 7351. [Google Scholar] [CrossRef] [PubMed]
- Anderson, J.P.; Walker, D.E.; Goldstein, J.M.; De Laat, R.; Banducci, K.; Caccavello, R.J.; Barbour, R.; Huang, J.; Kling, K.; Lee, M.; et al. Phosphorylation of Ser-129 Is the Dominant Pathological Modification of Alpha-Synuclein in Familial and Sporadic Lewy Body Disease. J. Biol. Chem. 2006, 281, 29739–29752. [Google Scholar] [CrossRef] [PubMed]
- Elfarrash, S.; Jensen, N.M.; Ferreira, N.; Schmidt, S.I.; Gregersen, E.; Vestergaard, M.V.; Nabavi, S.; Meyer, M.; Jensen, P.H. Polo-like Kinase 2 Inhibition Reduces Serine-129 Phosphorylation of Physiological Nuclear Alpha-Synuclein but Not of the Aggregated Alpha-Synuclein. PLoS ONE 2021, 16, e0252635. [Google Scholar] [CrossRef]
- Fujiwara, H.; Hasegawa, M.; Dohmae, N.; Kawashima, A.; Masliah, E.; Goldberg, M.S.; Shen, J.; Takio, K.; Iwatsubo, T. Alpha-Synuclein Is Phosphorylated in Synucleinopathy Lesions. Nat. Cell Biol. 2002, 4, 160–164. [Google Scholar] [CrossRef] [PubMed]
- Arawaka, S.; Sato, H.; Sasaki, A.; Koyama, S.; Kato, T. Mechanisms Underlying Extensive Ser129-Phosphorylation in α-Synuclein Aggregates. Acta Neuropathol. Commun. 2017, 5, 48. [Google Scholar] [CrossRef]
- Paleologou, K.E.; Schmid, A.W.; Rospigliosi, C.C.; Kim, H.Y.; Lamberto, G.R.; Fredenburg, R.A.; Lansbury, P.T.; Fernandez, C.O.; Eliezer, D.; Zweckstetter, M.; et al. Phosphorylation at Ser-129 but Not the Phosphomimics S129E/D Inhibits the Fibrillation of Alpha-Synuclein. J. Biol. Chem. 2008, 283, 16895–16905. [Google Scholar] [CrossRef]
- Pinho, R.; Paiva, I.; Jerčić, K.G.; Fonseca-Ornelas, L.; Gerhardt, E.; Fahlbusch, C.; Garcia-Esparcia, P.; Kerimoglu, C.; Pavlou, M.A.S.; Villar-Piqué, A.; et al. Nuclear Localization and Phosphorylation Modulate Pathological Effects of Alpha-Synuclein. Hum. Mol. Genet. 2019, 28, 31–50. [Google Scholar] [CrossRef]
- Kosten, J.; Binolfi, A.; Stuiver, M.; Verzini, S.; Theillet, F.X.; Bekei, B.; Van Rossum, M.; Selenko, P. Efficient Modification of Alpha-Synuclein Serine 129 by Protein Kinase CK1 Requires Phosphorylation of Tyrosine 125 as a Priming Event. ACS Chem. Neurosci. 2014, 5, 1203–1208. [Google Scholar] [CrossRef]
- Kleinknecht, A.; Popova, B.; Lázaro, D.F.; Pinho, R.; Valerius, O.; Outeiro, T.F.; Braus, G.H. C-Terminal Tyrosine Residue Modifications Modulate the Protective Phosphorylation of Serine 129 of α-Synuclein in a Yeast Model of Parkinson’s Disease. PLoS Genet. 2016, 12, e1006098. [Google Scholar] [CrossRef]
- McFarland, M.A.; Ellis, C.E.; Markey, S.P.; Nussbaum, R.L. Proteomics Analysis Identifies Phosphorylation-Dependent Alpha-Synuclein Protein Interactions. Mol. Cell. Proteom. 2008, 7, 2123–2137. [Google Scholar] [CrossRef]
- El Turk, F.; De Genst, E.; Guilliams, T.; Fauvet, B.; Hejjaoui, M.; Di Trani, J.; Chiki, A.; Mittermaier, A.; Vendruscolo, M.; Lashuel, H.A.; et al. Exploring the Role of Post-Translational Modifications in Regulating α-Synuclein Interactions by Studying the Effects of Phosphorylation on Nanobody Binding. Protein Sci. 2018, 27, 1262–1274. [Google Scholar] [CrossRef] [PubMed]
- Chen, L.; Periquet, M.; Wang, X.; Negro, A.; McLean, P.J.; Hyman, B.T.; Feany, M.B. Tyrosine and Serine Phosphorylation of Alpha-Synuclein Have Opposing Effects on Neurotoxicity and Soluble Oligomer Formation. J. Clin. Investig. 2009, 119, 3257–3265. [Google Scholar] [CrossRef] [PubMed][Green Version]
- Sano, K.; Iwasaki, Y.; Yamashita, Y.; Irie, K.; Hosokawa, M.; Satoh, K.; Mishima, K. Tyrosine 136 Phosphorylation of α-Synuclein Aggregates in the Lewy Body Dementia Brain: Involvement of Serine 129 Phosphorylation by Casein Kinase 2. Acta Neuropathol. Commun. 2021, 9, 182. [Google Scholar] [CrossRef] [PubMed]
- Popova, B.; Kleinknecht, A.; Braus, G.H. Posttranslational Modifications and Clearing of α-Synuclein Aggregates in Yeast. Biomolecules 2015, 5, 617–634. [Google Scholar] [CrossRef]
- Rockenstein, E.; Mallory, M.; Hashimoto, M.; Song, D.; Shults, C.W.; Lang, I.; Masliah, E. Differential Neuropathological Alterations in Transgenic Mice Expressing Alpha-Synuclein from the Platelet-Derived Growth Factor and Thy-1 Promoters. J. Neurosci. Res. 2002, 68, 568–578. [Google Scholar] [CrossRef] [PubMed]
- Kubo, S.I.; Kitami, T.; Noda, S.; Shimura, H.; Uchiyama, Y.; Asakawa, S.; Minoshima, S.; Shimizu, N.; Mizuno, Y.; Hattori, N. Parkin Is Associated with Cellular Vesicles. J. Neurochem. 2001, 78, 42–54. [Google Scholar] [CrossRef]
- Jensen, P.H.; Islam, K.; Kenney, J.; Nielsen, M.S.; Power, J.; Gai, W.P. Microtubule-Associated Protein 1B Is a Component of Cortical Lewy Bodies and Binds Alpha-Synuclein Filaments. J. Biol. Chem. 2000, 275, 21500–21507. [Google Scholar] [CrossRef]
- Thomsen, M.S.; Andersen, M.V.; Christoffersen, P.R.; Jensen, M.D.; Lichota, J.; Moos, T. Neurodegeneration with Inflammation Is Accompanied by Accumulation of Iron and Ferritin in Microglia and Neurons. Neurobiol. Dis. 2015, 81, 108–118. [Google Scholar] [CrossRef]
- Schindelin, J.; Arganda-Carreras, I.; Frise, E.; Kaynig, V.; Longair, M.; Pietzsch, T.; Preibisch, S.; Rueden, C.; Saalfeld, S.; Schmid, B.; et al. Fiji: An Open-Source Platform for Biological-Image Analysis. Nat Methods 2012, 9, 676–682. [Google Scholar] [CrossRef]
- Berkhoudt Lassen, L.; Gregersen, E.; Kathrine Isager, A.; Betzer, C.; Hahn Kofoed, R.; Henning Jensen, P. ELISA Method to Detect α-Synuclein Oligomers in Cell and Animal Models. PLoS ONE 2018, 13, e0196056. [Google Scholar] [CrossRef]
- Richter-Landsberg, C.; Heinrich, M. OLN-93: A New Permanent Oligodendroglia Cell Line Derived From Primary Rat Brain Glial Cultures. J. Neurosci. Res. 1996, 45, 161–173. [Google Scholar] [CrossRef]
- Kragh, C.L.; Lund, L.B.; Febbraro, F.; Hansen, H.D.; Wei-Ping, G.; El-Agnaf, O.; Richter-Landsberg, C.; Jensen, P.H. Alpha-Synuclein Aggregation and Ser-129 Phosphorylation-Dependent Cell Death in Oligodendroglial Cells. J. Biol. Chem. 2009, 284, 10211–10222. [Google Scholar] [CrossRef] [PubMed]
- Kragh, C.L.; Gysbers, A.M.; Rockenstein, E.; Murphy, K.; Halliday, G.M.; Masliah, E.; Jensen, P.H. Prodegenerative IκBα Expression in Oligodendroglial α-Synuclein Models of Multiple System Atrophy. Neurobiol. Dis. 2014, 63, 171–183. [Google Scholar] [CrossRef] [PubMed]
- Sampson, T.R.; Debelius, J.W.; Thron, T.; Janssen, S.; Shastri, G.G.; Ilhan, Z.E.; Challis, C.; Schretter, C.E.; Rocha, S.; Gradinaru, V.; et al. Gut Microbiota Regulate Motor Deficits and Neuroinflammation in a Model of Parkinson’s Disease. Cell 2016, 167, 1469–1480.e12. [Google Scholar] [CrossRef]
- Rabl, R.; Breitschaedel, C.; Flunkert, S.; Duller, S.; Amschl, D.; Neddens, J.; Niederkofler, V.; Rockenstein, E.; Masliah, E.; Roemer, H.; et al. Early Start of Progressive Motor Deficits in Line 61 α-Synuclein Transgenic Mice. BMC Neurosci. 2017, 18, 22. [Google Scholar] [CrossRef]
- Amende, I.; Kale, A.; McCue, S.; Glazier, S.; Morgan, J.P.; Hampton, T.G. Gait Dynamics in Mouse Models of Parkinson’s Disease and Huntington’s Disease. J. Neuroeng. Rehabil. 2005, 2, 20. [Google Scholar] [CrossRef]
- Fernagut, P.O.; Diguet, E.; Labattu, B.; Tison, F. A Simple Method to Measure Stride Length as an Index of Nigrostriatal Dysfunction in Mice. J. Neurosci. Methods 2002, 113, 123–130. [Google Scholar] [CrossRef]
- Fusco, G.; Chen, S.W.; Williamson, P.T.F.; Cascella, R.; Perni, M.; Jarvis, J.A.; Cecchi, C.; Vendruscolo, M.; Chiti, F.; Cremades, N.; et al. Structural Basis of Membrane Disruption and Cellular Toxicity by α-Synuclein Oligomers. Science 2017, 358, 1440–1443. [Google Scholar] [CrossRef]
- Sugeno, N.; Takeda, A.; Hasegawa, T.; Kobayashi, M.; Kikuchi, A.; Mori, F.; Wakabayashi, K.; Itoyama, Y. Serine 129 Phosphorylation of Alpha-Synuclein Induces Unfolded Protein Response-Mediated Cell Death. J. Biol. Chem. 2008, 283, 23179–23188. [Google Scholar] [CrossRef]
- Mirza, B.; Hadberg, H.; Thomsen, P.; Moos, T. The Absence of Reactive Astrocytosis Is Indicative of a Unique Inflammatory Process in Parkinson’s Disease. Neuroscience 1999, 95, 425–432. [Google Scholar] [CrossRef]
- Graham, D.R.; Sidhu, A. Mice Expressing the A53T Mutant Form of Human Alpha-Synuclein Exhibit Hyperactivity and Reduced Anxiety-like Behavior. J. Neurosci. Res. 2010, 88, 1777–1783. [Google Scholar] [CrossRef] [PubMed]
- Selenko, P.; Frueh, D.P.; Elsaesser, S.J.; Haas, W.; Gygi, S.P.; Wagner, G. In Situ Observation of Protein Phosphorylation by High-Resolution NMR Spectroscopy. Nat. Struct. Mol. Biol. 2008, 15, 321–329. [Google Scholar] [CrossRef] [PubMed]


Publisher’s Note: MDPI stays neutral with regard to jurisdictional claims in published maps and institutional affiliations. |
© 2022 by the authors. Licensee MDPI, Basel, Switzerland. This article is an open access article distributed under the terms and conditions of the Creative Commons Attribution (CC BY) license (https://creativecommons.org/licenses/by/4.0/).
Share and Cite
Lassen, L.B.; Thomsen, M.S.; Basso, E.; Füchtbauer, E.-M.; Füchtbauer, A.; Outeiro, T.F.; Jensen, P.H.; Moos, T. Mutation of Tyrosine Sites in the Human Alpha-Synuclein Gene Induces Neurotoxicity in Transgenic Mice with Soluble Alpha-Synuclein Oligomer Formation. Cells 2022, 11, 3673. https://doi.org/10.3390/cells11223673
Lassen LB, Thomsen MS, Basso E, Füchtbauer E-M, Füchtbauer A, Outeiro TF, Jensen PH, Moos T. Mutation of Tyrosine Sites in the Human Alpha-Synuclein Gene Induces Neurotoxicity in Transgenic Mice with Soluble Alpha-Synuclein Oligomer Formation. Cells. 2022; 11(22):3673. https://doi.org/10.3390/cells11223673
Chicago/Turabian StyleLassen, Louise Berkhoudt, Maj Schneider Thomsen, Elisa Basso, Ernst-Martin Füchtbauer, Annette Füchtbauer, Tiago Fleming Outeiro, Poul Henning Jensen, and Torben Moos. 2022. "Mutation of Tyrosine Sites in the Human Alpha-Synuclein Gene Induces Neurotoxicity in Transgenic Mice with Soluble Alpha-Synuclein Oligomer Formation" Cells 11, no. 22: 3673. https://doi.org/10.3390/cells11223673
APA StyleLassen, L. B., Thomsen, M. S., Basso, E., Füchtbauer, E.-M., Füchtbauer, A., Outeiro, T. F., Jensen, P. H., & Moos, T. (2022). Mutation of Tyrosine Sites in the Human Alpha-Synuclein Gene Induces Neurotoxicity in Transgenic Mice with Soluble Alpha-Synuclein Oligomer Formation. Cells, 11(22), 3673. https://doi.org/10.3390/cells11223673