
cfDNA and DNases: New Biomarkers of Sepsis in Preterm Neonates—A Pilot Study

 ,
, 
Abstract
:1. Introduction
2. Materials and Methods
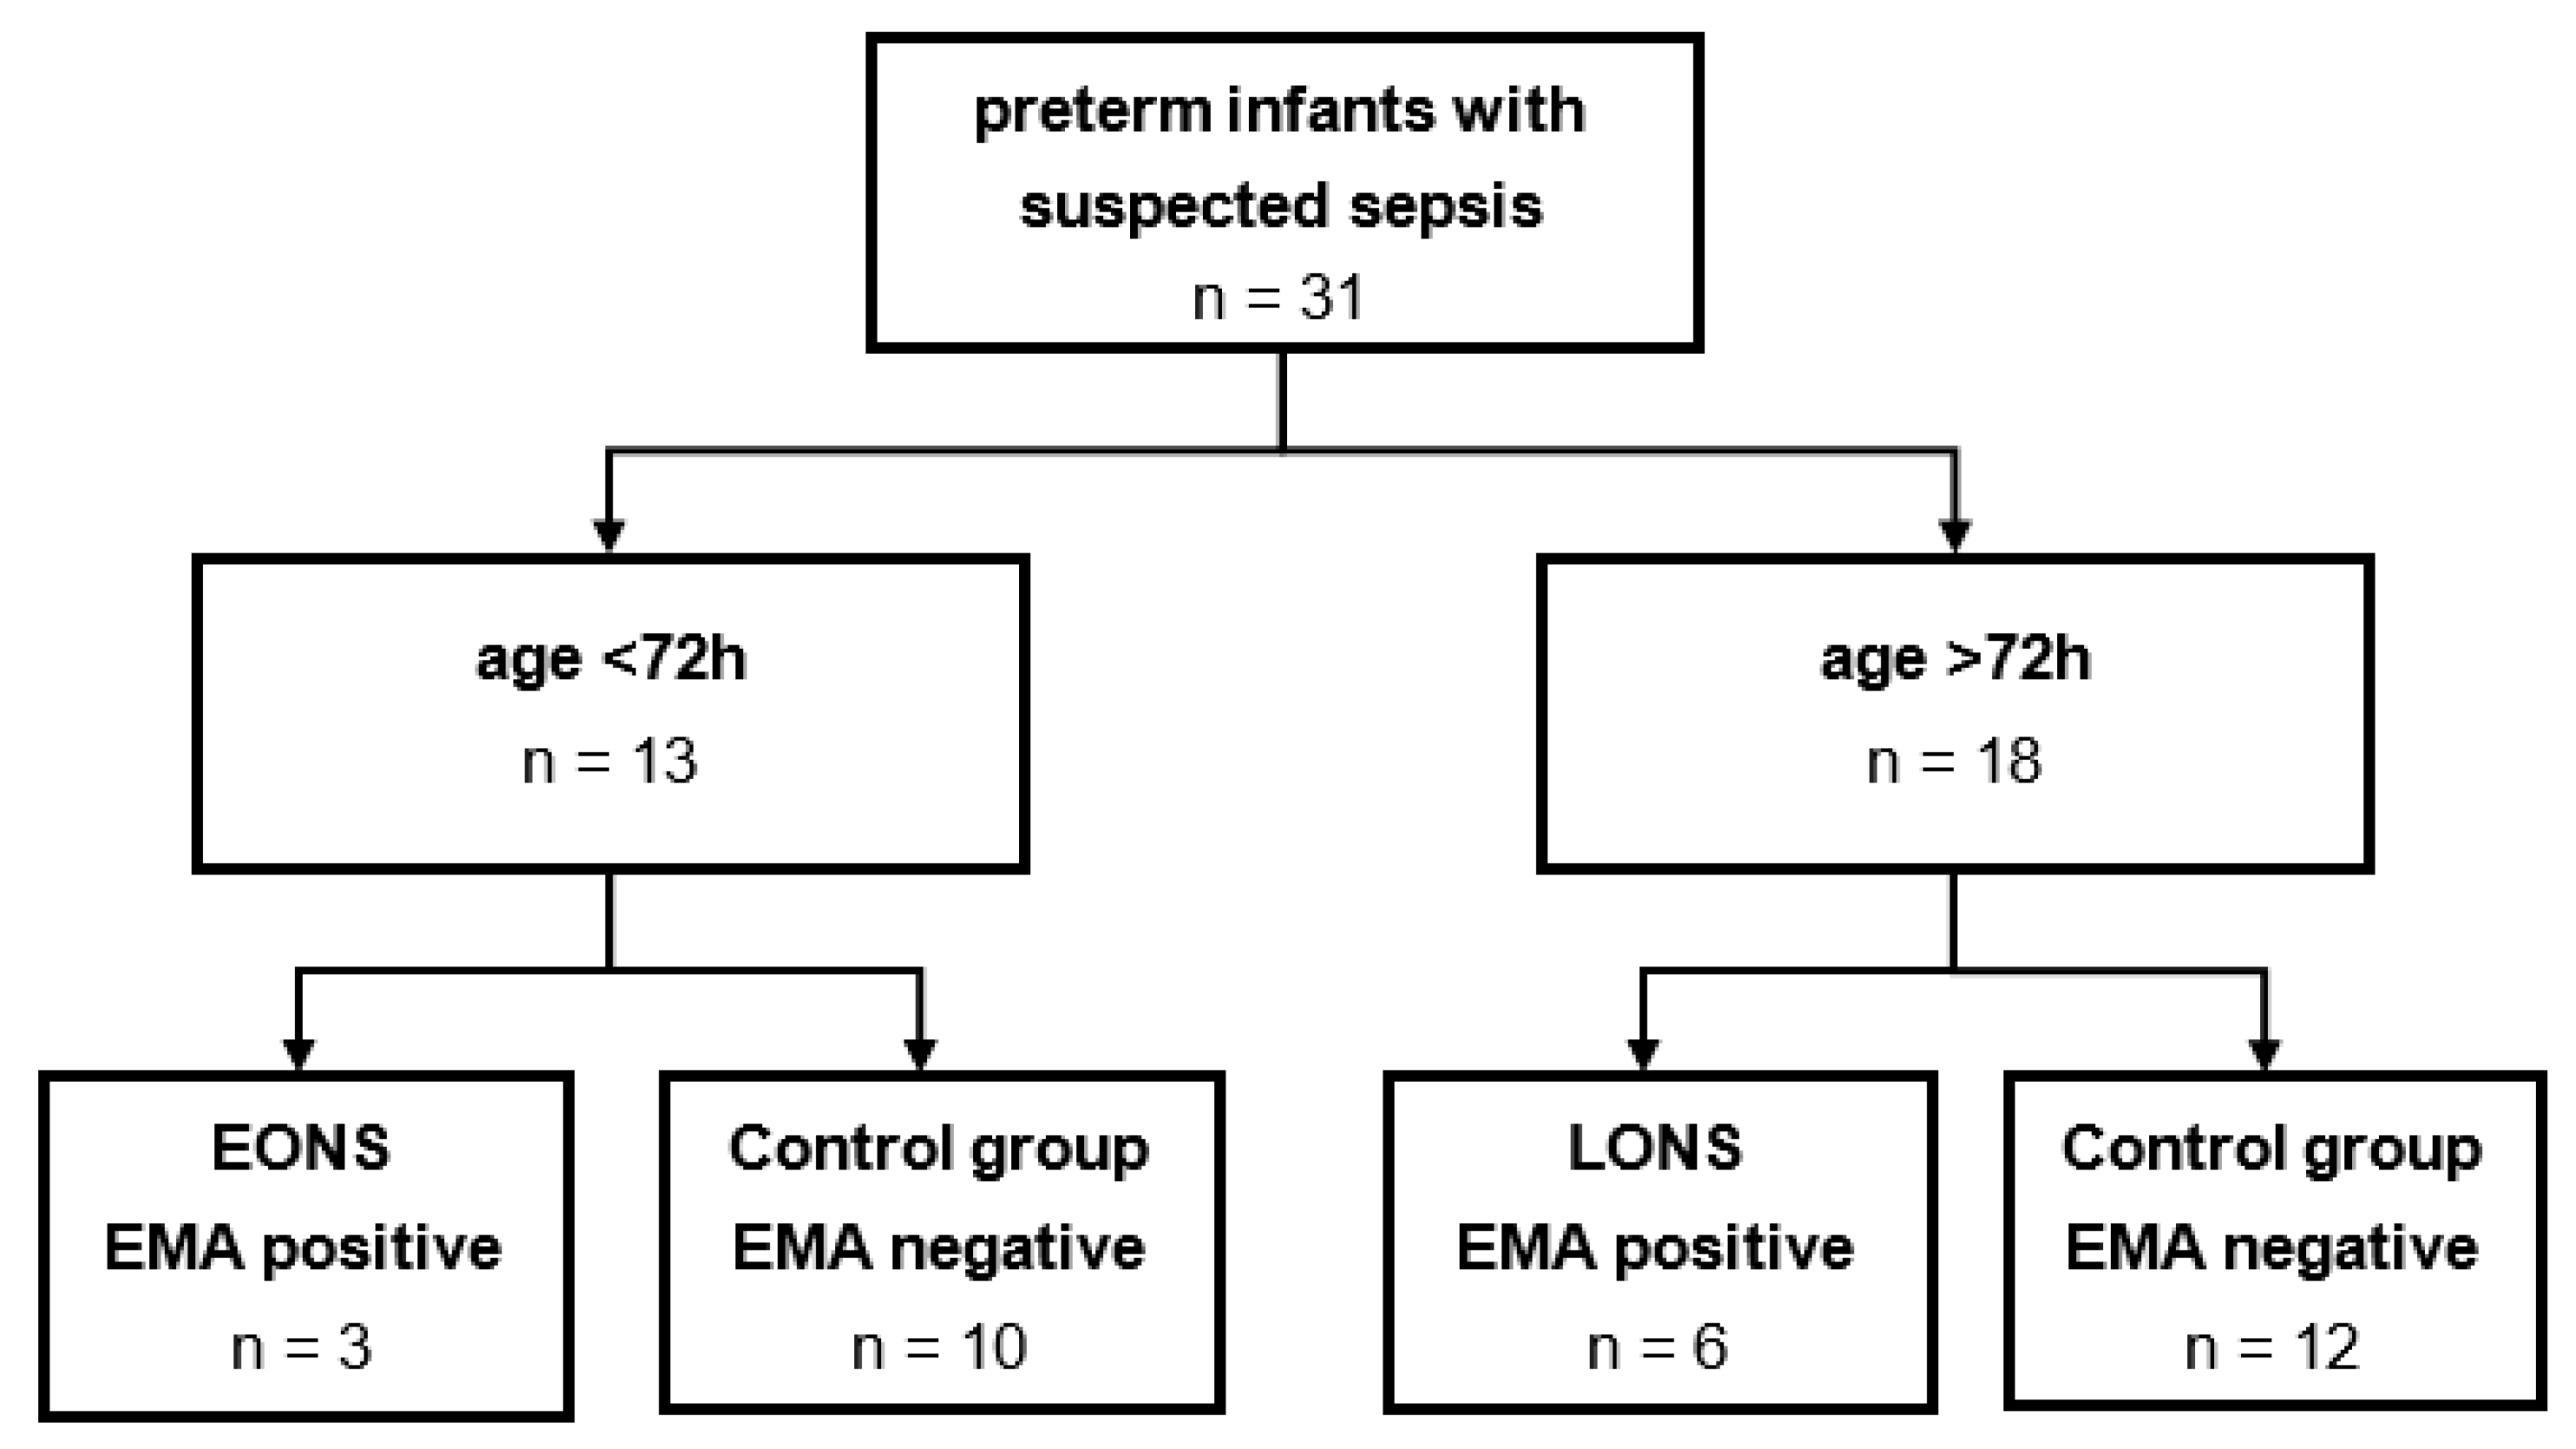
2.1. Study Design
2.2. Sample Preparation
2.3. Circulating Free Deoxyribonucleic Acid (cfDNA)
2.4. Nucleosome
2.5. Deoxyribonuclease I (DNase I) ELISA
2.6. Neutrophile Elastase (NE) ELISA
2.7. Citrullinated Histone 3 (H3Cit) ELISA
2.8. Statistics
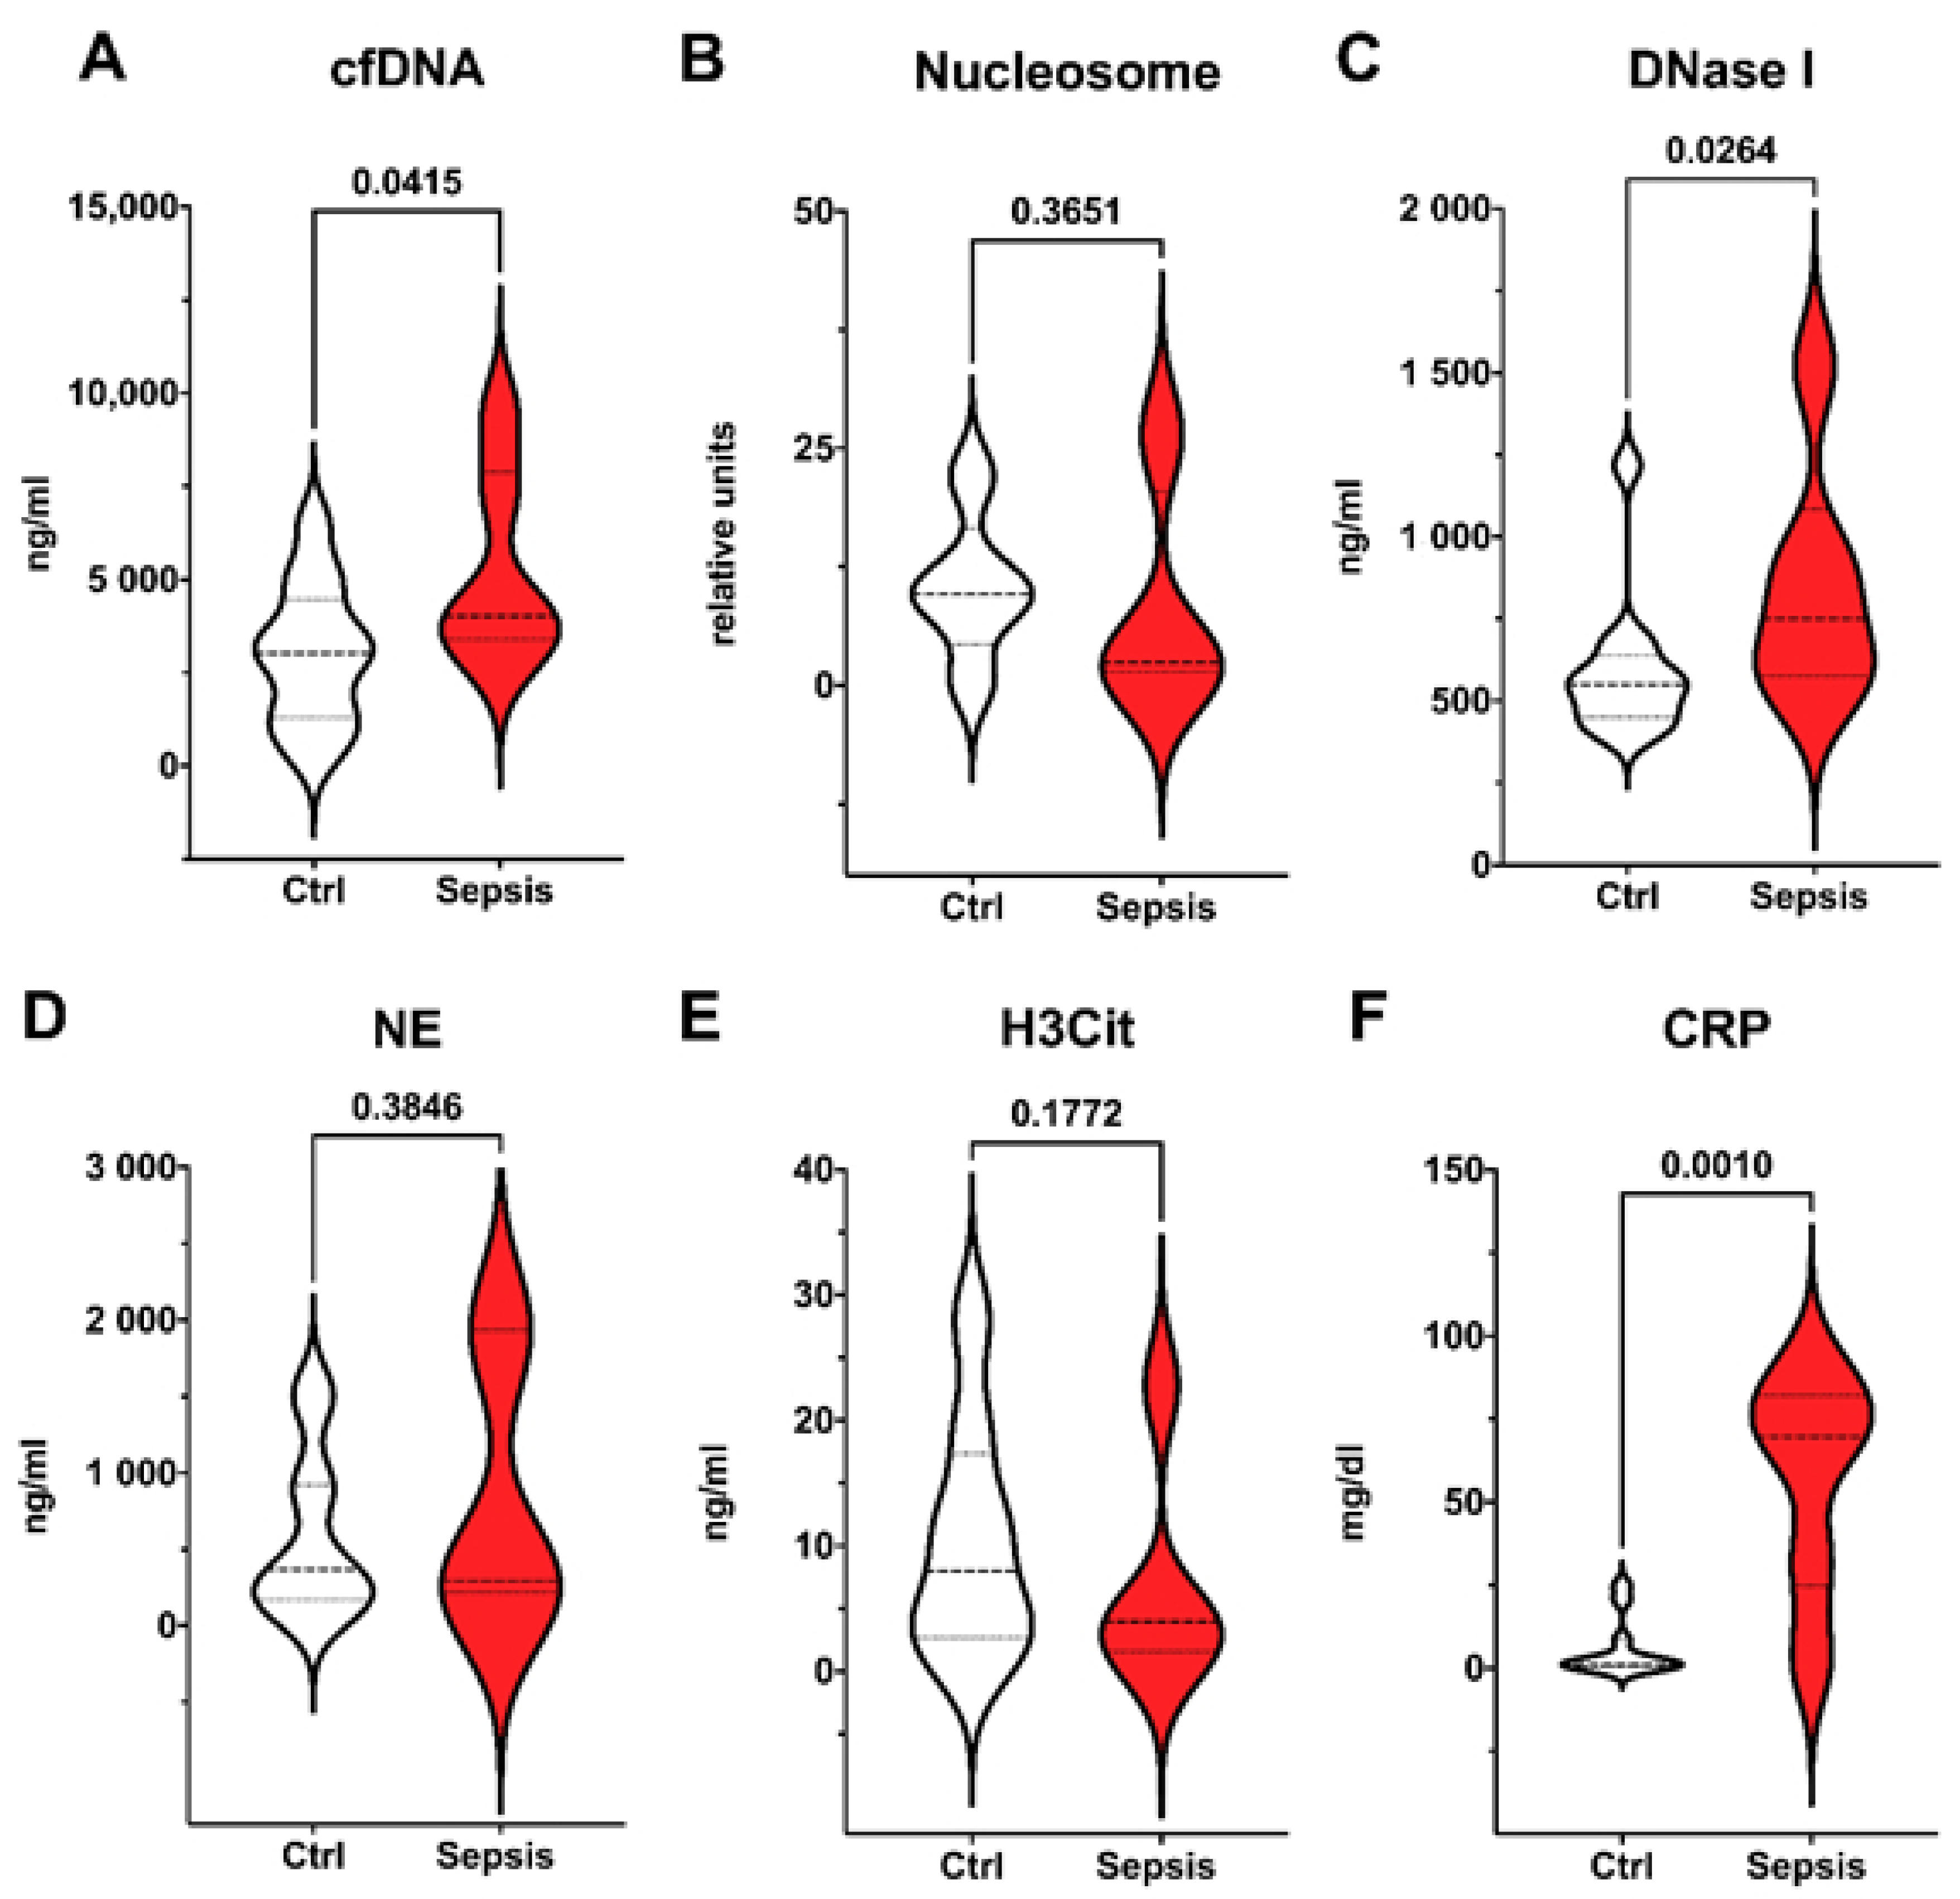
3. Results
4. Discussion
5. Conclusions
Author Contributions
Funding
Institutional Review Board Statement
Informed Consent Statement
Data Availability Statement
Conflicts of Interest
References
- Shane, A.L.; Sánchez, P.J.; Stoll, B.J. Neonatal sepsis. Lancet 2017, 390, 1770–1780. [Google Scholar] [CrossRef]
- Fleischmann-Struzek, C.; Goldfarb, D.M.; Schlattmann, P.; Schlapbach, L.J.; Reinhart, K.; Kissoon, N. The global burden of paediatric and neonatal sepsis: A systematic review. Lancet Respir. Med. 2018, 6, 223–230. [Google Scholar] [CrossRef]
- Procianoy, R.S.; Silveira, R.C. The challenges of neonatal sepsis management. J. Pediatr. 2020, 96, 80–86. [Google Scholar] [CrossRef] [PubMed]
- Tsai, M.-H.; Hsu, J.-F.; Chu, S.-M.; Lien, R.; Huang, H.-R.; Chiang, M.-C.; Fu, R.-H.; Lee, C.-W.; Huang, Y.-C. Incidence, Clinical Characteristics and Risk Factors for Adverse Outcome in Neonates with Late-onset Sepsis. Pediatr. Infect. Dis. J. 2014, 33, e7–e13. [Google Scholar] [CrossRef] [PubMed]
- Simonsen, K.A.; Anderson-Berry, A.L.; Delair, S.F.; Dele Davies, H. Early-Onset Neonatal Sepsis. Clin. Microbiol. Rev. 2014, 27, 21–47. [Google Scholar] [CrossRef] [Green Version]
- European Medicines Agency (EMA). Report on the Expert Meeting on Neonatal and Paediatric Sepsis London; European Medicines Agency (EMA): Amsterdam, The Netherlands, 2010.
- Wynn, J.L. Defining neonatal sepsis. Curr. Opin. Pediatr. 2016, 28, 135–140. [Google Scholar] [CrossRef] [PubMed] [Green Version]
- Odabasi, I.O.; Bulbul, A. Neonatal Sepsis. Sisli. Etfal. Hastan. Tip. Bul. 2020, 54, 142–158. [Google Scholar] [CrossRef]
- Mantovani, A.; Cassatella, M.A.; Costantini, C.; Jaillon, S. Neutrophils in the activation and regulation of innate and adaptive immunity. Nat. Rev. Immunol. 2011, 11, 519–531. [Google Scholar] [CrossRef]
- Brinkmann, V.; Reichard, U.; Goosmann, C.; Fauler, B.; Uhlemann, Y.; Weiss, D.S.; Weinrauch, Y.; Zychlinsky, A. Neutrophil extracellular traps kill bacteria. Science 2004, 303, 1532–1535. [Google Scholar] [CrossRef]
- Manda, A.; Pruchniak, M.P.; Arazna, M.; Demkow, U.A. Neutrophil extracellular traps in physiology and pathology. Centr. Eur. J. Immunol. 2014, 39, 116–121. [Google Scholar] [CrossRef] [Green Version]
- Altrichter, J.; Zedler, S.; Kraft, R.; Faist, E.; Mitzner, S.R.; Sauer, M.; Windolf, J.; Scholz, M.; Lögters, T. Neutrophil-derived circulating free DNA (cf-DNA/NETs), a potential prognostic marker for mortality in patients with severe burn injury. Eur. J. Trauma Emerg. Surg. 2010, 36, 551–557. [Google Scholar] [CrossRef]
- Shen, X.-F.; Cao, K.; Jiang, J.-P.; Guan, W.-X.; Du, J.-F. Neutrophil dysregulation during sepsis: An overview and update. J. Cell. Mol. Med. 2017, 21, 1687–1697. [Google Scholar] [CrossRef] [PubMed] [Green Version]
- Borges, L.; Pithon-Curi, T.C.; Curi, R.; Hatanaka, E. COVID-19 and Neutrophils: The Relationship between Hyperinflammation and Neutrophil Extracellular Traps. Mediat. Inflamm. 2020, 2020, 1–7. [Google Scholar] [CrossRef]
- World Health Organisation. WHO: Recommended definitions, terminology and format for statistical tables related to the per-inatal period and use of a new certificate for cause of perinatal deaths. Modifications recommended by FIGO as amended October 14, 1976. Acta Obstet. Gynecol. Scand. 1977, 56, 247–253. [Google Scholar] [CrossRef]
- Fuchs, T.A.; Kremer Hovinga, J.A..; Schatzberg, D.; Wagner, D.D.; Lämmle, B. Circulating DNA and myeloperoxidase indicate disease activity in patients with thrombotic microangiopathies. Blood 2012, 120, 1157–1164. [Google Scholar] [CrossRef] [Green Version]
- Stiel, C.U.; Ebenebe, C.U.; Trochimiuk, M.; Raluy, L.P.; Vincent, D.; Singer, D.; Reinshagen, K.; Boettcher, M. Markers of NETosis Do Not Predict Neonatal Early Onset Sepsis: A Pilot Study. Front. Pediatr. 2020, 7, 555. [Google Scholar] [CrossRef] [Green Version]
- Puopolo, K.M.; Benitz, W.E.; Zaoutis, T.E. Management of neonates born at ≥35 0/7 weeks’ gestation with suspected or proven early-onset bacterial sepsis. Pediatrics 2018, 142, 1–10. [Google Scholar] [CrossRef] [PubMed] [Green Version]
- Margraf, S.; Lögters, T.; Reipen, J.; Altrichter, J.; Scholz, M.; Windolf, J. Neutrophil-derived circulating free DNA (cf-DNA/NETs): A potential prognostic marker for posttraumatic development of inflammatory second hit and sepsis. Shock 2008, 30, 352–358. [Google Scholar] [CrossRef]
- Yost, C.C.; Schwertz, H.; Cody, M.J.; Wallace, J.A.; Campbell, R.A.; Vieira-De-Abreu, A.; Araujo, C.V.; Schubert, S.; Harris, E.S.; Rowley, J.W.; et al. Neonatal NET-inhibitory factor and related peptides inhibit neutrophil extracellular trap formation. J. Clin. Investig. 2016, 126, 3783–3798. [Google Scholar] [CrossRef]
- Melvan, J.N.; Bagby, G.J.; Welsh, D.A.; Nelson, S.; Zhang, P. Neonatal Sepsis and Neutrophil Insufficiencies. Int. Rev. Immunol. 2010, 29, 315–348. [Google Scholar] [CrossRef] [Green Version]
- Golonka, R.M.; Yeoh, B.S.; Petrick, J.L.; Weinstein, S.J.; Albanes, D.; Gewirtz, A.T.; McGlynn, K.A.; Vijay-Kumar, M. Deoxyribonuclease I Activity, Cell-Free DNA, and Risk of Liver Cancer in a Prospective Cohort. JNCI Cancer Spectr. 2018, 2, 1–6. [Google Scholar] [CrossRef] [Green Version]
- Papayannopoulos, V.; Metzler, K.D.; Hakkim, A.; Zychlinsky, A. Neutrophil elastase and myeloperoxidase regulate the formation of neutrophil extracellular traps. J. Cell Biol. 2010, 191, 677–691. [Google Scholar] [CrossRef] [Green Version]
- Jiménez-Alcázar, M.; Kim, N.; Fuchs, T.A. Circulating Extracellular DNA: Cause or Consequence of Thrombosis? Semin. Thromb. Hemost. 2017, 43, 553–561. [Google Scholar] [CrossRef]
- Cheng, Z.; Abrams, S.T.; Toh, J.; Wang, S.S.; Wang, Z.; Yu, Q.; Yu, W.; Toh, C.-H.; Wang, G. The Critical Roles and Mechanisms of Immune Cell Death in Sepsis. Front. Immunol. 2020, 11, 1–10. [Google Scholar] [CrossRef]
- Hashiba, M.; Huq, A.; Tomino, A.; Hirakawa, A.; Hattori, T.; Miyabe, H.; Tsuda, M.; Takeyama, N. Neutrophil extracellular traps in patients with sepsis. J. Surg. Res. 2015, 194, 248–254. [Google Scholar] [CrossRef]
- Sandquist, M.; Wong, H.R. Biomarkers of sepsis and their potential value in diagnosis, prognosis and treatment. Expert Rev. Clin. Immunol. 2014, 10, 1349–1356. [Google Scholar] [CrossRef] [PubMed] [Green Version]
- Rhodes, A.; Wort, S.J.; Thomas, H.; Collinson, P.; David, E.D. Plasma DNA concentration as a predictor of mortality and sepsis in critically ill patients. Crit. Care 2006, 10, 1–7. [Google Scholar] [CrossRef] [Green Version]
- Keyel, P.A. Dnases in health and disease. Dev. Biol. 2017, 429, 1–11. [Google Scholar] [CrossRef]
- Lee, K.H.; Cavanaugh, L.; Leung, H.; Yan, F.; Ahmadi, Z.; Chong, B.H.; Passam, F. Quantification of NETs-associated markers by flow cytometry and serum assays in patients with thrombosis and sepsis. Int. J. Lab. Hematol. 2018, 40, 392–399. [Google Scholar] [CrossRef] [PubMed]
- Grunwell, J.R.; Stephenson, S.T.; Mohammad, A.F.; Jones, K.; Mason, C.; Opolka, C.; Fitzpatrick, A.M. Differential type I interferon response and primary airway neutrophil extracellular trap release in children with acute respiratory distress syndrome. Sci. Rep. 2020, 10, 1–12. [Google Scholar] [CrossRef] [PubMed]


| EMA Sepsis Scoring System | |
|---|---|
| Clinical | Laboratory |
| Body temperature: | Leukocyte count: |
| >38.5 °C or | <4000/mm³ or >20.000/mm³ |
| <36 °C and/or temperature irregularities | Immature/total neutrophil ratio: |
| Cardiovascular instability: | ≥0.2 |
| Bradycardia or tachycardia and/or | Platelet Count: |
| rhythm irregularity | <100.000/mm³ |
| Urine amount < 1 mL/kg/h | CRP: |
| Hypotension | >15 mg/L (1.5 mg/dL) |
| Impaired peripheral perfusion | Procalcitonin: |
| Skin and subcutaneous lesions: | ≥2 ng/mL |
| Petechiae | Blood sugar monitoring (at least twice): |
| Sclerema | Hyperglycemia (>180 mg/dL) |
| Respiratory Instability: | Hypoglycemia (<45 mg/dL) |
| Apnea or | Metabolic acidosis: |
| Tachypnea or | Base deficit >10 mEq/L or |
| Increased oxygen demand or | Serum lactate >2 mmol/L |
| Increased need for ventilation support | |
| Gastrointestinal: | |
| Nutritional intolerance | |
| Insufficient breastfeeding | |
| Abdominal distension | |
| Non-specific: | |
| Irritability | |
| Lethargy | |
| Hypotonia | |
| EONS (n = 3) | Controls (n = 10) | p | |
|---|---|---|---|
| Age (d) | 2 (1) | 1.5 (0.71) | n.s. |
| Gestational age (weeks) | 26.76 (0.78) | 29.89 (4.53) | n.s. |
| Gender (female) | 1/3 (33.33%) | 3/10 (30%) | n.s. |
| Mortality | 2/3 (66.67%) | 0/10 (0%) | 0.038 |
| Positive blood culture | 0/3 (0%) | 0/10 (0%) | n.s. |
| Leucocytes (109/L) | 37.9 (31.77) | 24.32 (22.97) | n.s. |
| Platelets (109/L) | 111.0 (64.09) | 270.5 (78.85) | 0.012 |
| Blood gas analysis | |||
| pH | 7.204 (0.15) | 7.313 (0.06) | n.s. |
| pO2 (mm/Hg) | 41.07 (10.04) | 32.07 (4.95) | n.s. |
| pCO2 (mm/Hg) | 48.97 (9.96) | 49.86 (11.03) | n.s. |
| Lactate (mmol/L) | 11.27 (11.03) | 2.44 (1.48) | 0.023 |
| Base deficit | −7.45 (7.99) | −2.171 (2.06) | n.s. |
| Glucose (mg/dL) | 178.0 (36.59) | 96.44 (42.21) | 0.018 |
| LONS (n = 6) | Controls (n = 12) | p | |
|---|---|---|---|
| Age (d) | 44.01 (35.63) | 25.58 (22.72) | n.s. |
| Gestational age (weeks) | 26.52 (2.07) | 28.99 (3.64) | n.s. |
| Gender (female) | 2/6 (33.33%) | 5/12 (41.67%) | n.s. |
| Mortality | 1/6 (16.67%) | 0/12 (0%) | n.s. |
| Positive blood culture | 1/6 (16.67%) | 0/12 (0%) | n.s. |
| Leucocytes (109/L) | 9.2 (2.63) | 12.58 (5.87) | n.s. |
| Platelets (109/L) | 207.2 (150.5) | 476.6 (140.5) | 0.006 |
| Blood gas analysis | |||
| pH | 7.314 (0.12) | 7.340 (0.07) | n.s. |
| pO2 (mm/Hg) | 36.82 (8.03) | 33.9 (9.57) | n.s. |
| pCO2 (mm/Hg) | 60.6 (20.81) | 52.89 (9.98) | n.s. |
| Lactate (mmol/L) | 2.38 (1.39) | 1.48 (0.39) | n.s. |
| Base deficit | −1.45 (0.21) | −4.1 (3.31) | n.s. |
| Glucose (mg/dL) | 163.2 (120.9) | 97.89 (23.78) | n.s. |
| No. | 1 | 2 | 3 | 4 | 5 | 6 | 7 | 8 | 9 |
|---|---|---|---|---|---|---|---|---|---|
| Study group | EONS | EONS | EONS | LONS | LONS | LONS | LONS | LONS | LONS |
| Mortality | x | x | x | ||||||
| Proven infection | x | ||||||||
| Clinical: | |||||||||
| Body temperature | x | x | |||||||
| Cardiovascular instability | x | x | x | x | x | ||||
| Urine amount < 1 mL/kg/h | x | x | |||||||
| Hypotension | x | x | |||||||
| Impaired peripheral perfusion | x | x | |||||||
| Petechiae | |||||||||
| Sclerema | |||||||||
| Respiratory instability | x | x | x | x | x | x | x | x | |
| Nutritional intolerance | x | x | |||||||
| Abdominal distension | |||||||||
| Irritability | x | x | |||||||
| Lethargy | x | x | |||||||
| Positive items | 3 | 5 | 2 | 2 | 3 | 3 | 3 | 4 | 2 |
| Laboratory: | |||||||||
| Leucocyte count | x | x | |||||||
| Neutrophil ratio | |||||||||
| Platelet count | x | x | x | x | |||||
| CRP | x | x | x | x | x | ||||
| Procalcitonin | |||||||||
| Hyperglycemia | x | x | x | ||||||
| Hypoglycemia | x | ||||||||
| Base deficit | x | x | x | ||||||
| Serum lactate | x | x | x | x | x | x | |||
| Positive items | 4 | 4 | 2 | 2 | 3 | 2 | 2 | 2 | 3 |
| EMA positive | x | x | x | x | x | x | x | x | x |
Publisher’s Note: MDPI stays neutral with regard to jurisdictional claims in published maps and institutional affiliations. |
© 2022 by the authors. Licensee MDPI, Basel, Switzerland. This article is an open access article distributed under the terms and conditions of the Creative Commons Attribution (CC BY) license (https://creativecommons.org/licenses/by/4.0/).
Share and Cite
Lenz, M.; Maiberger, T.; Armbrust, L.; Kiwit, A.; Von der Wense, A.; Reinshagen, K.; Elrod, J.; Boettcher, M. cfDNA and DNases: New Biomarkers of Sepsis in Preterm Neonates—A Pilot Study. Cells 2022, 11, 192. https://doi.org/10.3390/cells11020192
Lenz M, Maiberger T, Armbrust L, Kiwit A, Von der Wense A, Reinshagen K, Elrod J, Boettcher M. cfDNA and DNases: New Biomarkers of Sepsis in Preterm Neonates—A Pilot Study. Cells. 2022; 11(2):192. https://doi.org/10.3390/cells11020192
Chicago/Turabian StyleLenz, Moritz, Thomas Maiberger, Lina Armbrust, Antonia Kiwit, Axel Von der Wense, Konrad Reinshagen, Julia Elrod, and Michael Boettcher. 2022. "cfDNA and DNases: New Biomarkers of Sepsis in Preterm Neonates—A Pilot Study" Cells 11, no. 2: 192. https://doi.org/10.3390/cells11020192
APA StyleLenz, M., Maiberger, T., Armbrust, L., Kiwit, A., Von der Wense, A., Reinshagen, K., Elrod, J., & Boettcher, M. (2022). cfDNA and DNases: New Biomarkers of Sepsis in Preterm Neonates—A Pilot Study. Cells, 11(2), 192. https://doi.org/10.3390/cells11020192