
Transcriptomic Biomarkers for Tuberculosis: Validation of NPC2 as a Single mRNA Biomarker to Diagnose TB, Predict Disease Progression, and Monitor Treatment Response

 , , and
Abstract
1. Introduction
2. Materials and Methods
2.1. Ethics Statements
2.2. Terminology
2.3. Inclusion Criteria for Eligible Published Datasets
2.4. Acquisition and Normalization of Datasets
2.5. Statistical Analysis
3. Results
3.1. Cross-Sectional Studies: Group Comparisons and ROC Analysis
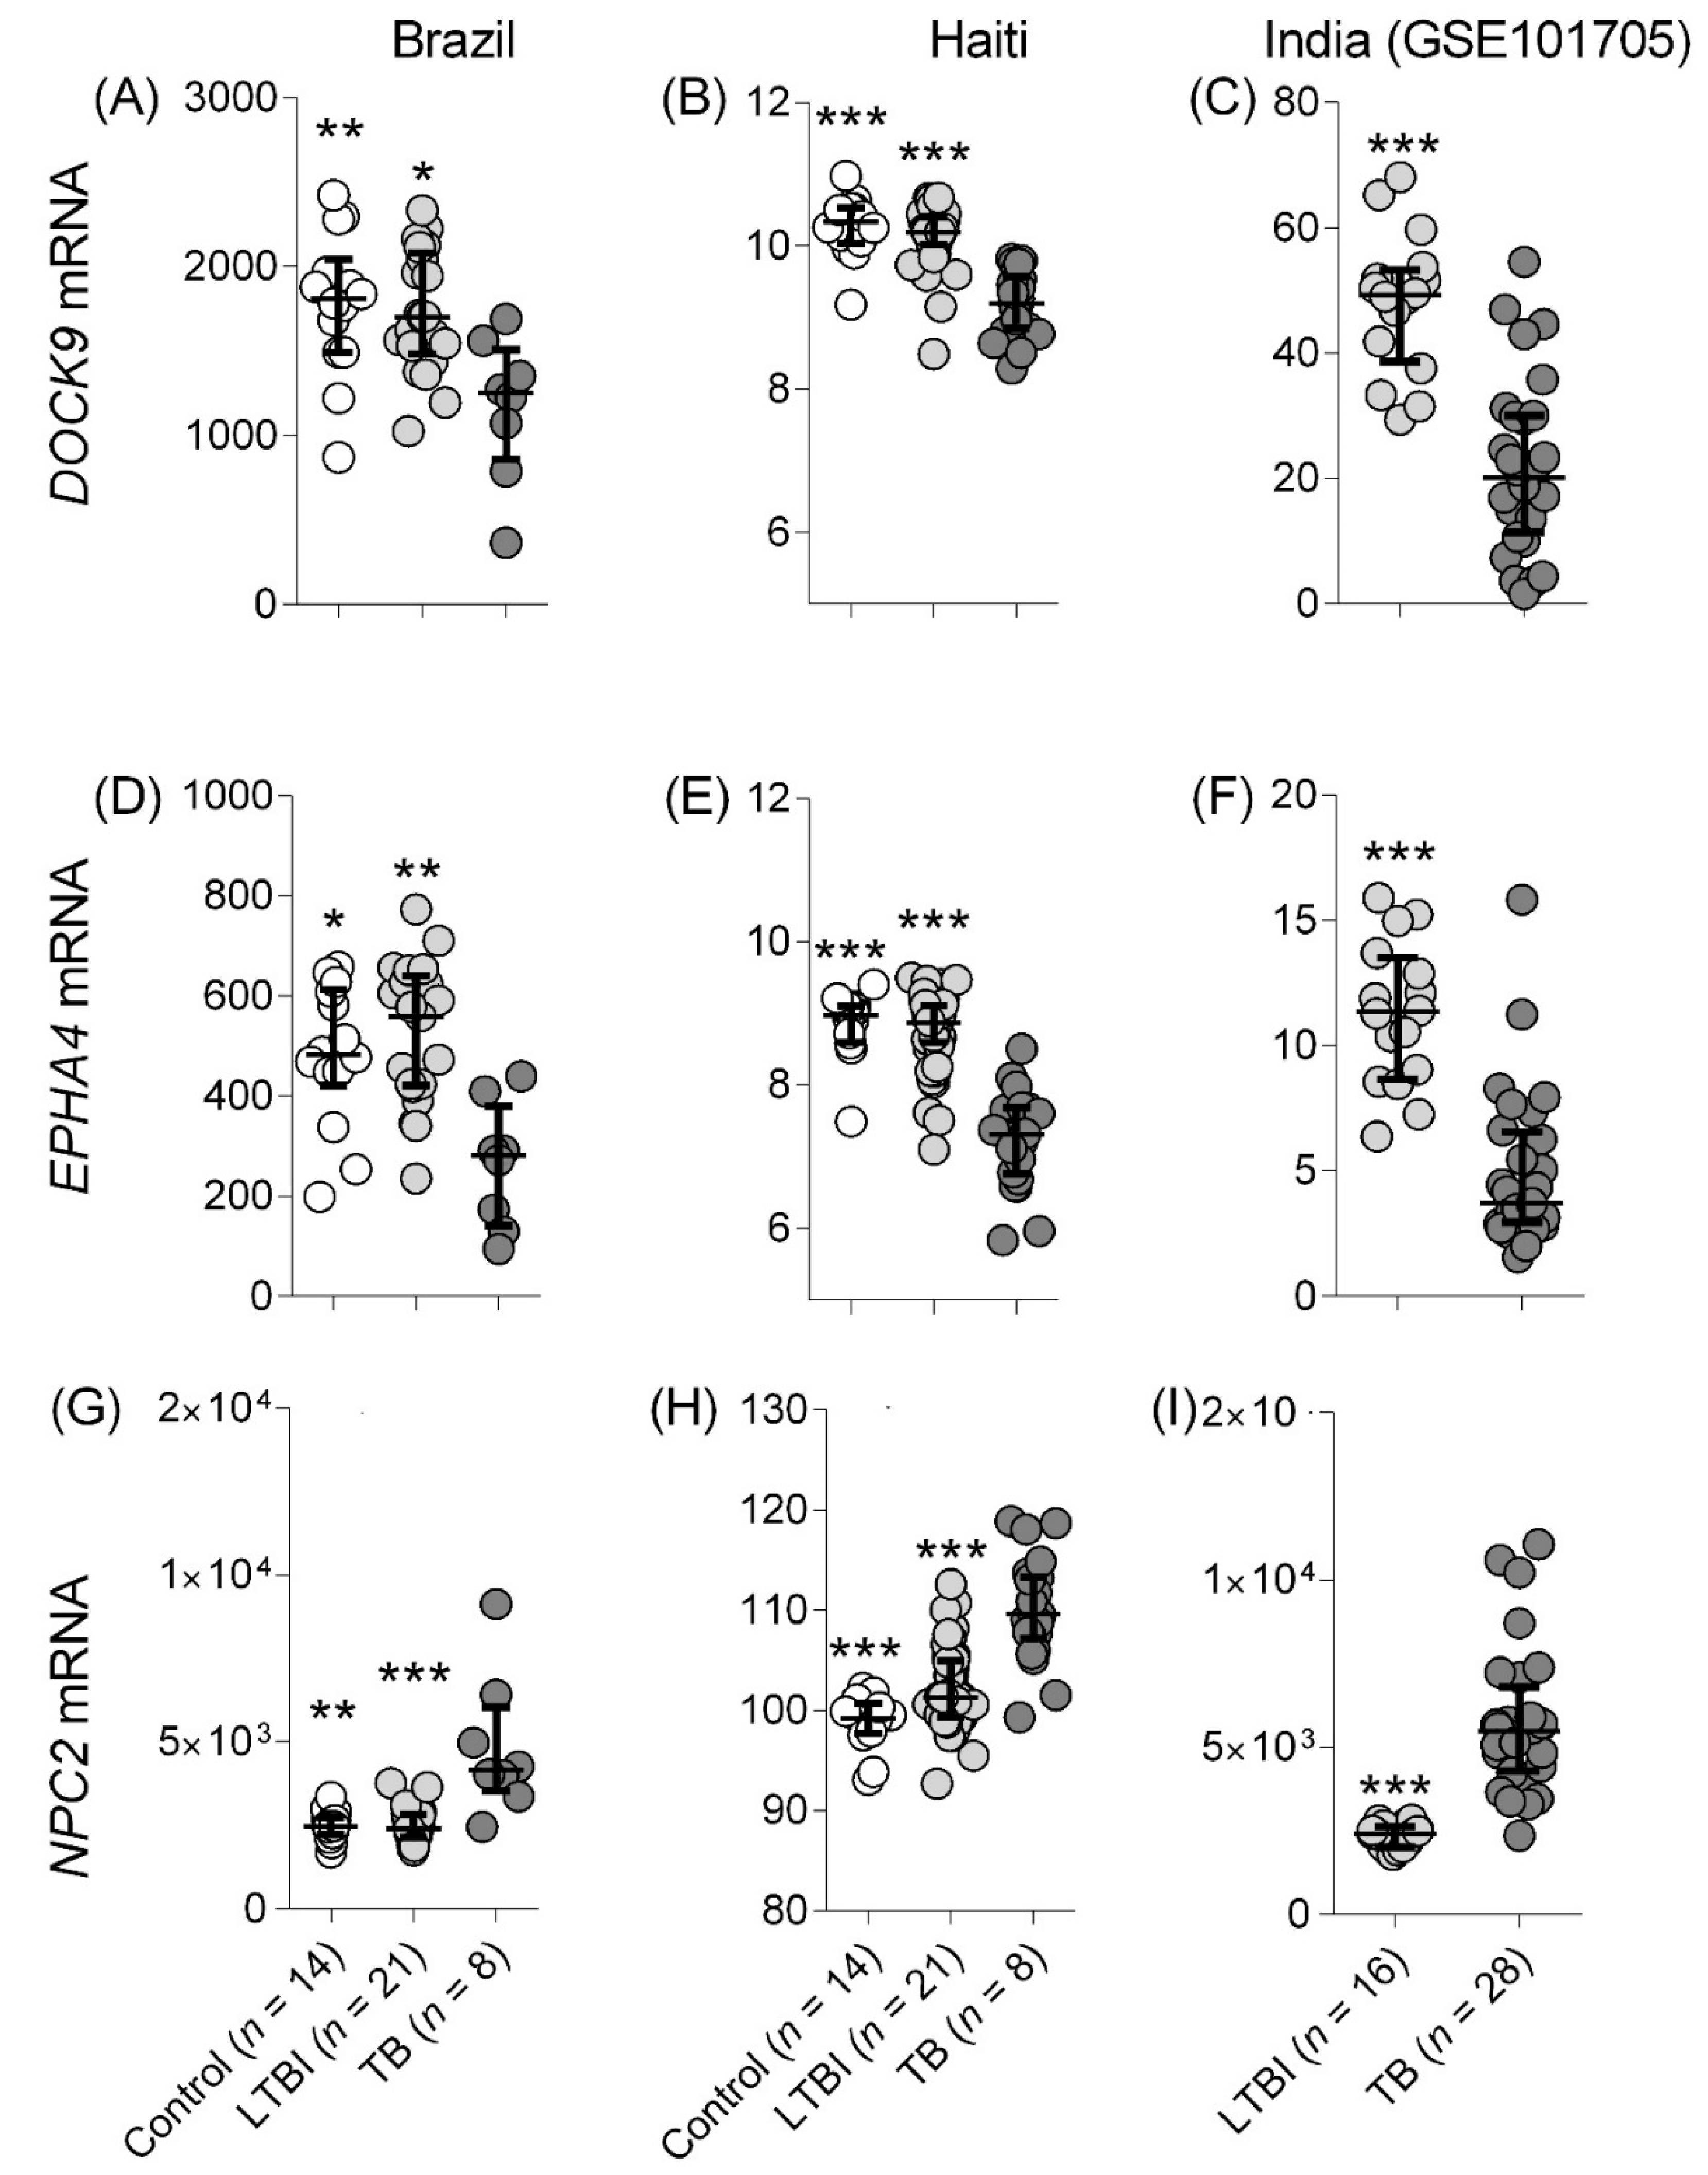
3.1.1. TB Detection
Studies Comparing with Control and LTBI
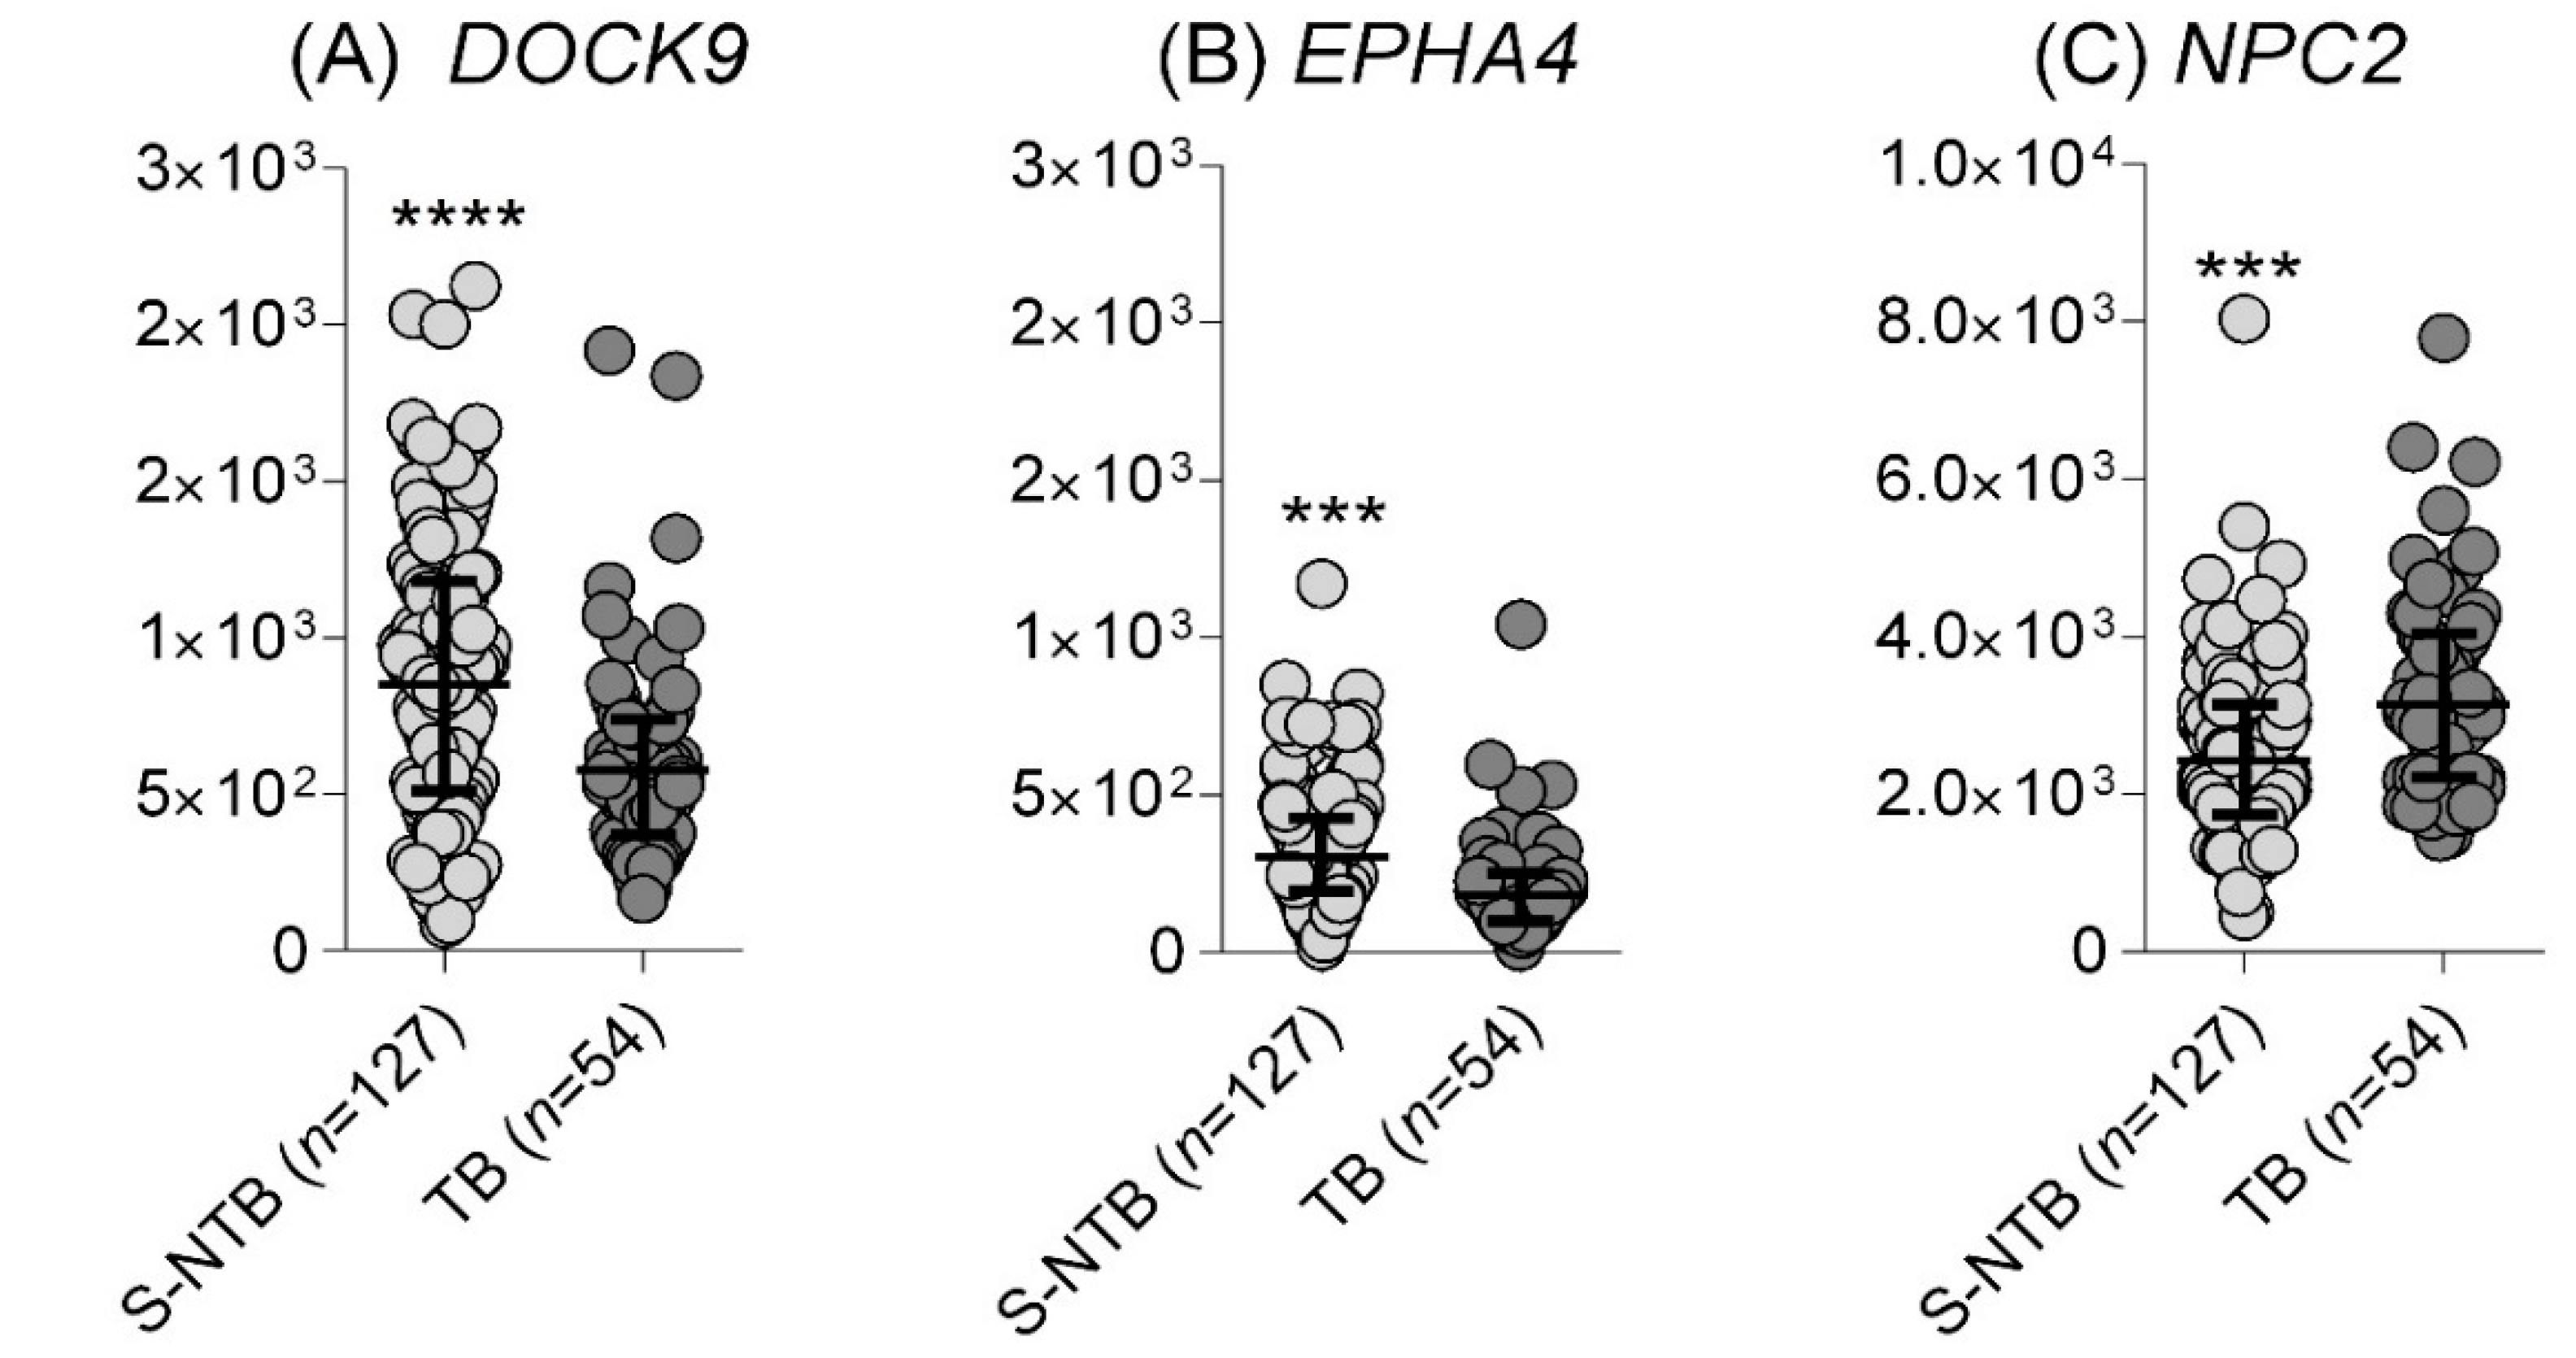
Identification of TB in Individuals Presenting with Respiratory Symptoms
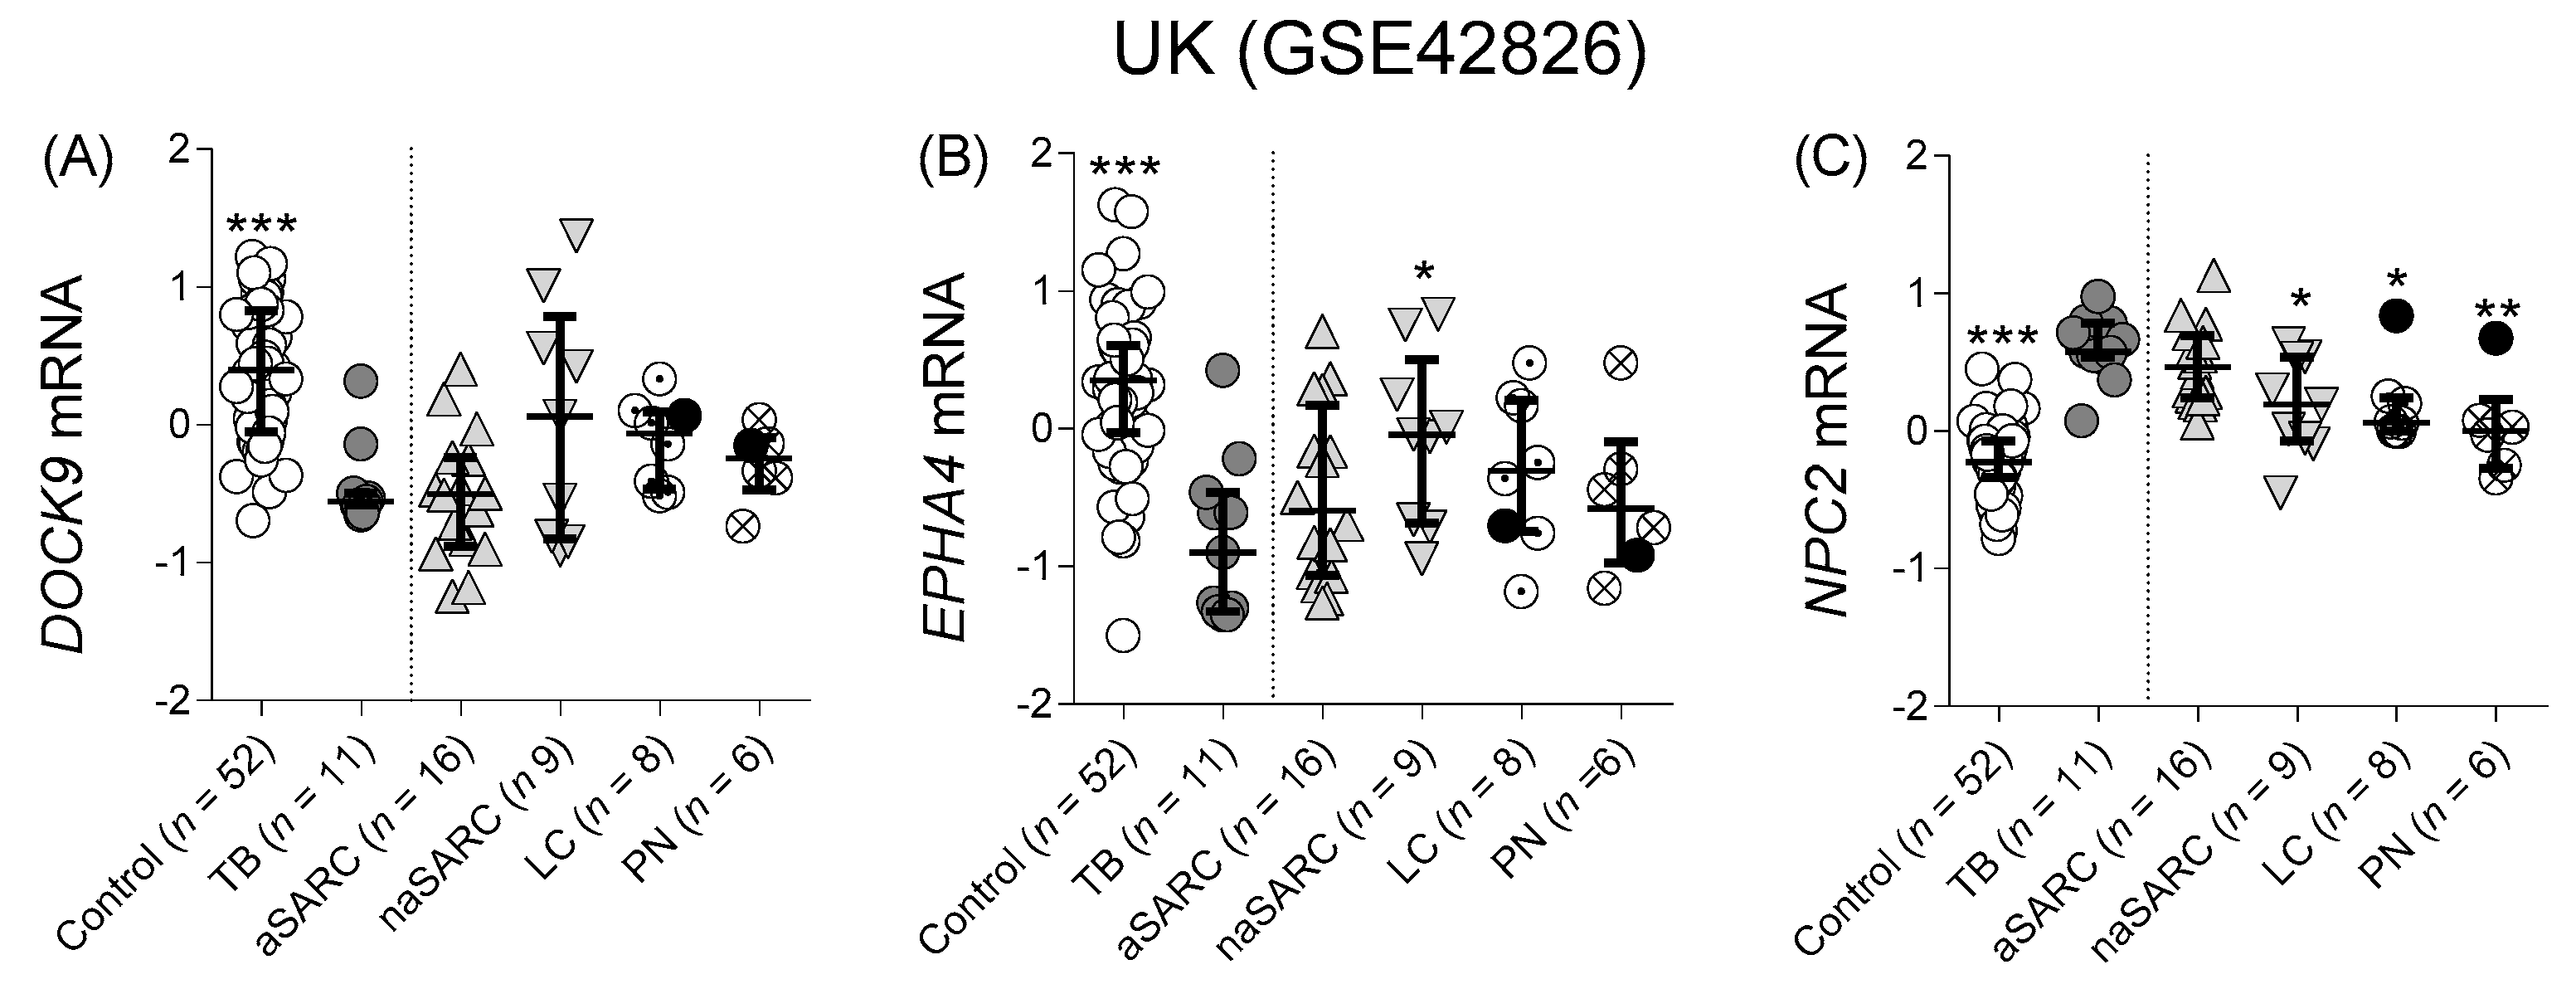
Differentiation from Other Pulmonary Diseases
3.2. Prospective Studies: Group Comparisons and ROC Analysis
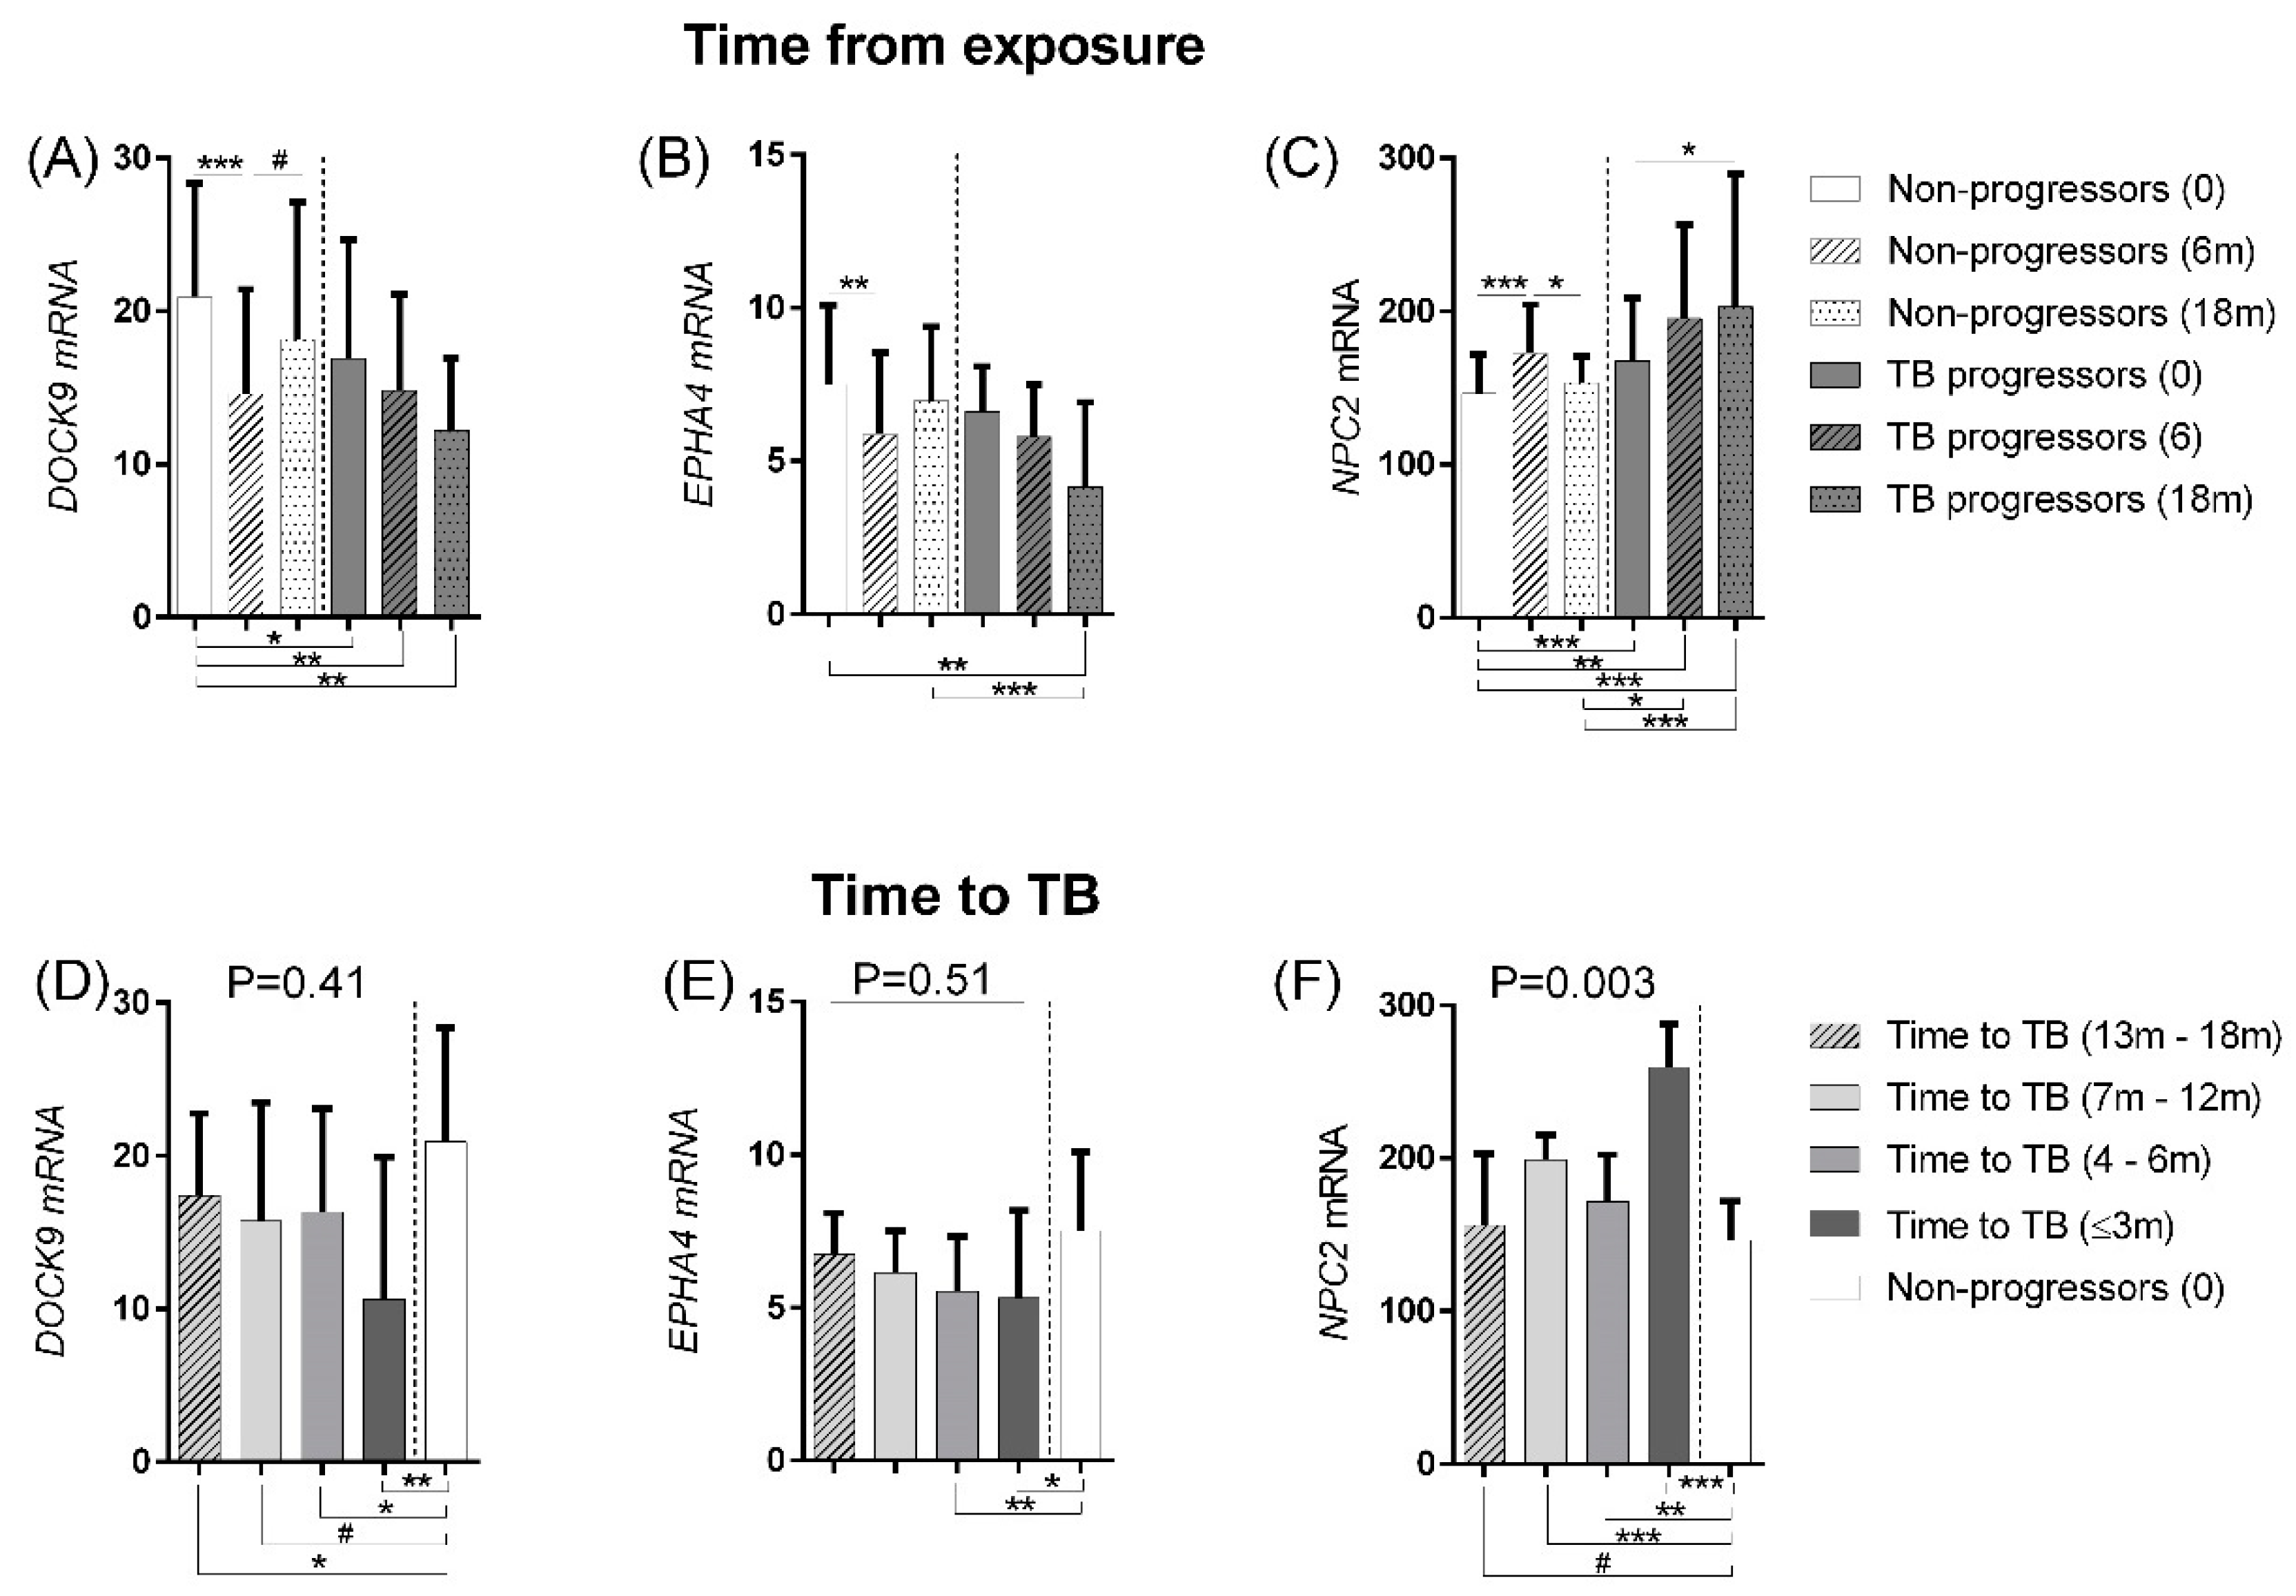
3.2.1. Disease Progression
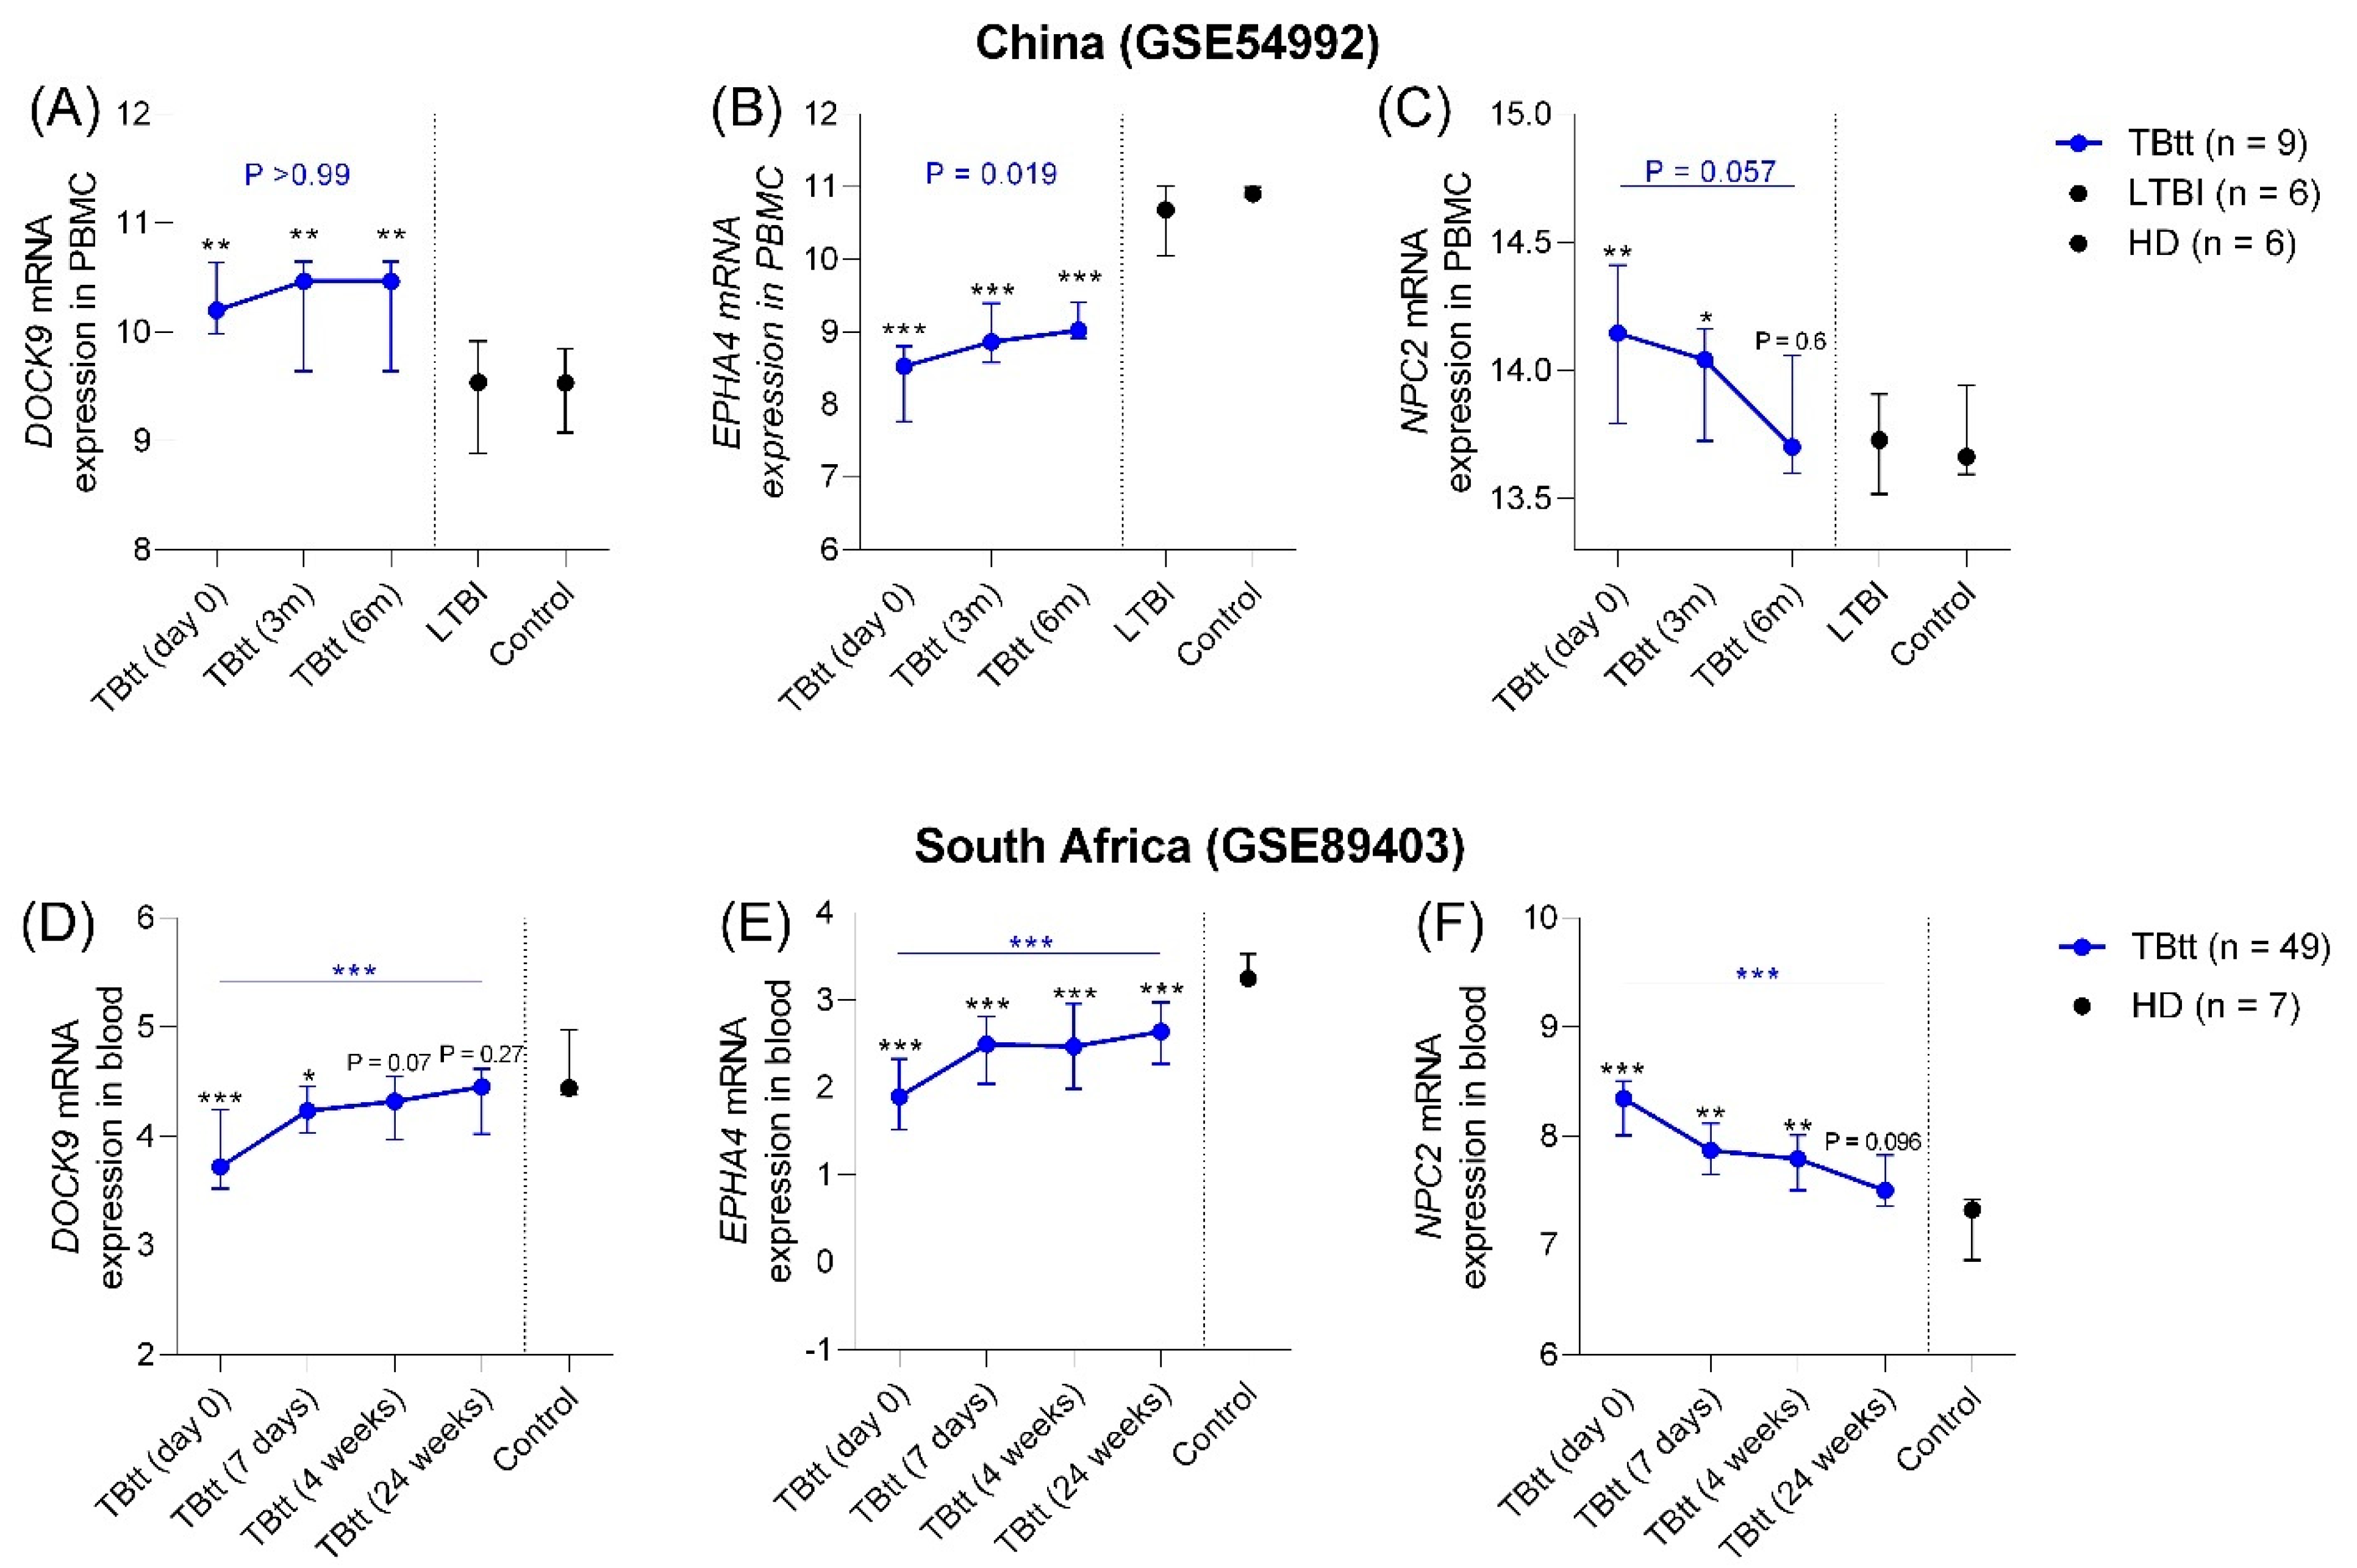
3.2.2. Correlation with Completion of Anti-TB Treatment
3.3. NPC2 Accuracy: Sensitivity and Specificity Analysis
4. Discussion
5. Conclusions
Supplementary Materials
Author Contributions
Funding
Institutional Review Board Statement
Informed Consent Statement
Data Availability Statement
Acknowledgments
Conflicts of Interest
References
- WHO. Global Tuberculosis Report; WHO: Geneva, Switzerland, 2020. [Google Scholar]
- Andersen, P.; Munk, M.; Pollock, J.; Doherty, T. Specific immune-based diagnosis of tuberculosis. Lancet 2000, 356, 1099–1104. [Google Scholar] [CrossRef]
- Denholm, J. Immigration screening for latent tuberculosis infection. Med. J. Aust. 2013, 199, 654. [Google Scholar] [CrossRef]
- Gocmen, O.; Babayigit, C.; Ozer, B.; Inandi, T.; Ozer, C.; Duran, N. Performance of QuantiFERON-TB Gold In-Tube test and Tuberculin Skin Test for diagnosis of latent tuberculosis infection in BCG vaccinated health care workers. Med. Sci. Monit. 2014, 20, 521–529. [Google Scholar] [CrossRef] [PubMed]
- Behr, M.A.; Kaufmann, E.; Duffin, J.; Edelstein, P.H.; Ramakrishnan, L. Latent Tuberculosis: Two Centuries of Confusion. Am. J. Respir. Crit. Care Med. 2021. [Google Scholar] [CrossRef] [PubMed]
- Turner, C.T.; Gupta, R.; Tsaliki, E.; Roe, J.K.; Mondal, P.; Nyawo, G.R.; Palmer, Z.; Miller, R.F.; Reeve, B.W.; Theron, G.; et al. Blood transcriptional biomarkers for active pulmonary tuberculosis in a high-burden setting: A prospective, observational, diagnostic accuracy study. Lancet Respir. Med. 2020, 8, 407–419. [Google Scholar] [CrossRef]
- Thompson, E.G.; Du, Y.; Malherbe, S.T.; Shankar, S.; Braun, J.; Valvo, J.; Ronacher, K.; Tromp, G.; Tabb, D.; Alland, D.; et al. Host blood RNA signatures predict the outcome of tuberculosis treatment. Tuberculosis 2017, 107, 48–58. [Google Scholar] [CrossRef] [PubMed]
- Gupta, R.K.; Turner, C.T.; Venturini, C.; Esmail, H.; Rangaka, M.X.; Copas, A.; Lipman, M.; Abubakar, I.; Noursadeghi, M. Concise whole blood transcriptional signatures for incipient tuberculosis: A systematic review and patient-level pooled meta-analysis. Lancet Respir. Med. 2020, 8, 395–406. [Google Scholar] [CrossRef]
- World Health Organization. High-Priority Target Product Profiles for New Tuberculosis Diagnostics Report of a Consensus Meeting; World Health Organization: Geneva, Switzerland, 2014. [Google Scholar]
- De Araujo, L.S.; Vaas, L.A.I.; Ribeiro-Alves, M.; Geffers, R.; Mello, F.C.Q.; De Almeida, A.S.; Moreira, A.D.S.R.; Kritski, A.L.; Silva, J.R.L.; Moraes, M.O.; et al. Transcriptomic Biomarkers for Tuberculosis: Evaluation of DOCK9, EPHA4, and NPC2 mRNA Expression in Peripheral Blood. Front. Microbiol. 2016, 7, 1586. [Google Scholar] [CrossRef]
- De Araujo, L.S.; Ribeiro-Alves, M.; Leal-Calvo, T.; Leung, J.; Durán, V.; Samir, M.; Talbot, S.; Tallam, A.; Mello, F.C.d.; Geffers, R.; et al. Reprogramming of small non-coding RNA populations in peripheral blood reveals host biomarkers for latent and active Mycobacterium tuberculosis Infection. mBio 2019, 10, 6. [Google Scholar] [CrossRef]
- Yang, J.; Zhang, Z.; Roe, S.M.; Marshall, C.J.; Barford, D. Activation of Rho GTPases by DOCK Exchange Factors Is Mediated by a Nucleotide Sensor. Science 2009, 325, 1398–1402. [Google Scholar] [CrossRef]
- Bisson, N.; Poitras, L.; Mikryukov, A.; Tremblay, M.; Moss, T. EphA4 signaling regulates blastomere adhesion in the Xenopus embryo by recruiting Pak1 to suppress Cdc42 function. Mol. Biol. Cell 2007, 18, 1030–1043. [Google Scholar] [CrossRef]
- Pernis, A.B. Rho GTPase-mediated pathways in mature CD4+ T cells. Autoimmun. Rev. 2009, 8, 199–203. [Google Scholar] [CrossRef] [PubMed]
- Subramanian, K.; Balch, W.E. NPC1/NPC2 function as a tag team duo to mobilize cholesterol: Fig. 1. Proc. Natl. Acad. Sci. USA 2008, 105, 15223–15224. [Google Scholar] [CrossRef] [PubMed]
- Yu, X.; Li, X.; Zhao, G.; Xiao, J.; Mo, Z.; Yin, K.; Jiang, Z.; Fu, Y.; Zha, X.; Tang, C. OxLDL up-regulates Niemann-Pick type C1 expression through ERK1/2/COX-2/PPAR -signaling pathway in macrophages. Acta Biochim. et Biophys. Sin. 2012, 44, 119–128. [Google Scholar] [CrossRef][Green Version]
- Tseng, W.-C.; Loeb, H.E.; Pei, W.; Morris, C.H.T.; Xu, L.; Cluzeau, C.V.; Wassif, C.A.; Feldman, B.; Burgess, S.M.; Pavan, W.J.; et al. Modeling Niemann-Pick disease type C1 in zebrafish: A robust platform for in vivo screening of candidate therapeutic compounds. Dis. Model. Mech. 2018, 11. [Google Scholar] [CrossRef] [PubMed]
- Wheelwright, M.; Kim, E.W.; Inkeles, M.S.; De Leon, A.; Pellegrini, M.; Krutzik, S.R.; Liu, P.T. All-TransRetinoic Acid–Triggered Antimicrobial Activity against Mycobacterium tuberculosis Is Dependent on NPC2. J. Immunol. 2014, 192, 2280–2290. [Google Scholar] [CrossRef]
- World Health Organization. Development of a Target Product Profile (TPP) and a Framework for Evaluation for a Test for Predicting Progression from Tuberculosis Infection to Active Disease; World Health Organization: Geneva, Switzerland, 2017. [Google Scholar]
- Walsh, K.F.; McAulay, K.; Lee, M.H.; Vilbrun, S.C.; Mathurin, L.; Francois, D.J.; Zimmerman, M.; Kaya, F.; Zhang, N.; Saito, K.; et al. Early Bactericidal Activity Trial of Nitazoxanide for Pulmonary Tuberculosis. Antimicrob. Agents Chemother. 2020, 64. [Google Scholar] [CrossRef]
- Wipperman, M.F.; Bhattarai, S.K.; Vorkas, C.K.; Maringati, V.S.; Taur, Y.; Mathurin, L.; McAulay, K.; Vilbrun, S.C.; Francois, D.; Bean, J.; et al. Gastrointestinal microbiota composition predicts peripheral inflammatory state during treatment of human tuberculosis. Nat. Commun. 2021, 12, 1–17. [Google Scholar] [CrossRef]
- Barrett, T. NCBI GEO: Mining millions of expression profiles--database and tools. Nucleic Acids Res. 2004, 33, D562–D566. [Google Scholar] [CrossRef]
- Bloom, C.I.; Berry, M.P.; Rozakeas, F.; Redford, P.S.; Wang, Y.; Xu, Z.; Wilkinson, K.A.; Wilkinson, R.J.; Kendrick, Y.; Devouassoux, G.; et al. Transcriptional blood signatures distinguish pulmonary tuberculosis, pulmonary sar-coidosis, pneumonias and lung cancers. PLoS ONE 2013, 8, e70630. [Google Scholar] [CrossRef]
- Suliman, S.; Thompson, E.G.; Sutherland, J.; Rd, J.W.; Ota, M.O.C.; Shankar, S.; Penn-Nicholson, A.; Thiel, B.; Erasmus, M.; Maertzdorf, J.; et al. Four-Gene Pan-African Blood Signature Predicts Progression to Tuberculosis. Am. J. Respir. Crit. Care Med. 2018, 197, 1198–1208. [Google Scholar] [CrossRef] [PubMed]
- Cai, Y.; Yang, Q.; Tang, Y.; Zhang, M.; Liu, H.; Zhang, G.; Deng, Q.; Huang, J.; Gao, Z.; Zhou, B.; et al. Increased Complement C1q Level Marks Active Disease in Human Tuberculosis. PLoS ONE 2014, 9, e92340. [Google Scholar] [CrossRef] [PubMed]
- Leong, S.; Zhao, Y.; Joseph, N.M.; Hochberg, N.; Sarkar, S.; Pleskunas, J.; Hom, D.; Lakshminarayanan, S.; Horsburgh, C.; Roy, G.; et al. Existing blood transcriptional classifiers accurately discriminate active tuberculosis from latent infection in individuals from south India. Tuberculosis 2018, 109, 41–51. [Google Scholar] [CrossRef]
- Barrett, T.; Wilhite, S.E.; Ledoux, P.; Evangelista, C.; Kim, I.F.; Tomashevsky, M.; Marshall, K.A.; Phillippy, K.H.; Sherman, P.M.; Holko, M.; et al. NCBI GEO: Archive for functional genomics data sets–update. Nucleic Acids Res. 2013, 41, D991–D995. [Google Scholar] [CrossRef]
- Al Mahi, N.; Najafabadi, M.F.; Pilarczyk, M.; Kouril, M.; Medvedovic, M. GREIN: An Interactive Web Platform for Re-analyzing GEO RNA-seq Data. Sci. Rep. 2019, 9, 1–9. [Google Scholar] [CrossRef]
- Wang, C.; Gong, B.; Bushel, P.R.; Thierry-Mieg, J.; Thierry-Mieg, D.; Xu, J.; Fang, H.; Hong, H.; Shen, J.; Su, Z.; et al. The concordance between RNA-seq and microarray data depends on chemical treatment and transcript abundance. Nat. Biotechnol. 2014, 32, 926–932. [Google Scholar] [CrossRef]
- Ishige, I.; Usui, Y.; Takemura, T.; Eishi, Y. Quantitative PCR of mycobacterial and propionibacterial DNA in lymph nodes of Japanese patients with sarcoidosis. Lancet 1999, 354, 120–123. [Google Scholar] [CrossRef]
- Brownell, I.; Ramírez-Valle, F.; Sanchez, M.; Prystowsky, S. Evidence for Mycobacteria in Sarcoidosis. Am. J. Respir. Cell Mol. Biol. 2011, 45, 899–905. [Google Scholar] [CrossRef]
- Abe, C.; Iwai, K.; Mikami, R.; Hosoda, Y. Frequent isolation of propionibacterium acnes from sarcoidosis lymph nodes. Zent. Bakteriol. Mikrobiol. Hygiene. 1. Abt. Originale. A Med. Mikrobiol. Infekt. Parasitol. 1984, 256, 541–547. [Google Scholar] [CrossRef]
- Homma, J.Y.; Abe, C.; Chosa, H.; Ueda, K.; Saegusa, J.; Nakayama, M.; Homma, H.; Washizaki, M.; Okano, H. Bacteriological investigation on biopsy specimens from patients with sarcoidosis. Jpn. J. Exp. Med. 1978, 48, 251–255. [Google Scholar]
- Riedmaier, I.; Pfaffl, M. Transcriptional biomarkers—High throughput screening, quantitative verification, and bioinformatical validation methods. Methods 2013, 59, 3–9. [Google Scholar] [CrossRef]
- Theron, G.; Venter, R.; Smith, L.; Esmail, A.; Randall, P.; Sood, V.; Oelfese, S.; Calligaro, G.; Warren, R.; Dheda, K. False-Positive Xpert MTB/RIF Results in Retested Patients with Previous Tuberculosis: Frequency, Profile, and Prospective Clinical Outcomes. J. Clin. Microbiol. 2018, 56. [Google Scholar] [CrossRef]


| Study | Publication Year | Study Country | Method | Diagnostic Groups | Public ID | Reference | |||||
|---|---|---|---|---|---|---|---|---|---|---|---|
| Control | S-NTB | LTBI | TB | TBtt | OD | ||||||
| Cross-sectional | 2016 2019 | Brazil | RNAseq | 14 d | - | 21 e | 8 f | - | - | GSE84076 GSE131174 | [10] [11] |
| 2019 | Haiti | RNAseq | 14 | - | 41 | 22 | - | - | Not deposited | [20,21] | |
| 2017 | India | RNAseq | - | - | 28 | 16 | - | - | GSE101705 | [26] | |
| 2012 | UK | Microarray | 52 | - | - | 11 | - | 39 c | GSE42826 | [23] | |
| 2020 | SA | RNAseq | - | 127 | - | 54 | - | - | E-MTAB-8290 | [6] | |
| 2017 | Pan A | RNAseq | 208 a | - | - | 64 b | - | - | GSE94438 | [24] | |
| Prospective | 2014 | China | Microarray | 6 | - | - | 6 | 9 | - | GSE54992 | [25] |
| 2016 | SA | RNAseq | 7 | - | - | - | 49 | - | GSE89403 | [7] | |
| Study | Platform | Age Group | Study Site | TB Incidence ¥ | Study Period (Month/Year) | Specimen | Reference Negative (n) | Reference Positive (n) | AUROC (95% CI) | ||
|---|---|---|---|---|---|---|---|---|---|---|---|
| DOCK9 | EPHA4 | NPC2 | |||||||||
| de Araujo et al | RNAseq | Adults | Brazil | 45 | 03/2010–08/2013 | Whole blood | Control (14) | TB (6) | 0.86 | 0.89 | 0.94 |
| (0.70 to 1.0) | (0.76 to 1.0) | (0.81 to 1.0) | |||||||||
| LTBI (21) | 0.86 | 0.91 | 0.94 | ||||||||
| (0.71 to 1.0) | (0.80 to 1.0) | (0.83 to 1.0) | |||||||||
| Haiti | RNAseq | Adults | Haiti | 176 | 02/2016–08/2020 | Whole blood | Control (14) | TB (22) | 0.96 | 0.97 | 0.91 |
| (0.89 to 1.0) | (0.92 to 1.0) | (0.79 to 1.0) | |||||||||
| IGRApos (41) | 0.95 | 0.96 | 0.89 | ||||||||
| (0.89 to 1.0) | (0.92 to 1.0) | (0.80 to 0.98) | |||||||||
| GSE101705 | RNAseq | Adults | India | 199 | NA | Whole blood | LTBI (28) | TB (16) | 0.92 | 0.93 | 0.98 |
| (0.84 to 1.0) | (0.85 to 1.0) | (0.93 to 1.0) | |||||||||
| GSE42826 | Microarray | Adults | United Kingdom | 8 | 09/2009–03/2012 | Whole blood | Control (52) | TB (11) | 0.93 | 0.90 | 0.99 |
| (0.84 to 1.0) | (0.79 to 1.0) | (0.97 to 1.0) | |||||||||
| aSARC (16) | 0.51 | 0.69 | 0.66 | ||||||||
| (0.29 to 0.74) | (0.47 to 0.90) | (0.45 to 0.87) | |||||||||
| naSARC (9) | 0.61 | 0.80 | 0.87 | ||||||||
| (0.31 to 0.91) | (0.60 to 1.0) | (0.71 to 1.0) | |||||||||
| LC (8) | 0.88 | 0.75 | 0.86 | ||||||||
| (0.71 to 1.0) | (0.53 to 0.97) | (0.65 to 1.0) | |||||||||
| PN (6) | 0.71 | 0.68 | 0.88 | ||||||||
| (0.41 to 1.0) | (0.42 to 0.94) | (0.68 to 1.0) | |||||||||
| Mean (all of the above) | Control (80) | TB (55) | 0.92 | 0.92 | 0.95 | ||||||
| (0.79 to 1.0) | (0.81 to 1.0) | (0.84 to 1.0) | |||||||||
| LTBI (90) | 0.91 | 0.93 | 0.94 | ||||||||
| (0.87 to 0.99) | (0.87 to 1.0) | (0.83 to 1.0) | |||||||||
| OD (37) | 0.65 | 0.63 | 0.73 | ||||||||
| (0.50 to 0.80) | (0.62to 0.79) | (0.56 to 0.90) | |||||||||
| Study or GEO Accession Number | Country | Comparison | Sensitivity and Specificity Analysis Adjusted to: | ||||||||||
|---|---|---|---|---|---|---|---|---|---|---|---|---|---|
| Maximum Youden Index | TPP for a Community-Based Triage or Referral Test to Identify People Suspected of Having TB a | TPP for a Test for Predicting Progression from TB Infection to Active Disease a | |||||||||||
| Minimum SENSITIVITY: ≥90% | Minimum SPECIFICITY: ≥70% | Minimum SENSITIVITY: ≥75 | Minimum SPECIFICITY: ≥75 | ||||||||||
| Sensitivity (95% CI) | Specificity (95% CI) | Sensitivity (95% CI) | Specificity (95% CI) | Sensitivity (95% CI) | Specificity (95% CI) | Sensitivity (95% CI) | Specificity (95% CI) | Sensitivity (95% CI) | Specificity (95% CI) | ||||
| Cross-sectional analyses | |||||||||||||
| Control or LTBI vs TB | |||||||||||||
| de Araujo et al 2016 | BR | Control (n = 14) b | vs TB (n = 6) | 87.5 (47.4–99.7) | 100 (76.8–100) | 100 (63.1–100) | 50 (23–77) | 87.5 (47.4–99.7) | 100 (76.8–100) | 87.5 (47.4–99.7) | 100 (76.8–100) | 87.5 (47.4–99.7) | 100 (76.8–100) |
| LTBI (n = 21) | 75 (34.9–96.8) | 100 (83.9–100) | 100 (63.1–100) | 57.1 (34–78.2) | 87.5 (47.4–99.7) | 90.5 (69.6–98.9) | 75 (34.9–96.8) | 100 (83.9–100) | 87.5 (47.4–99.7) | 90.5 (69.6–98.8) | |||
| Haiti | H | Control (n = 14) c | vs TB (n = 22) | 90.9 (70.8–98.9) | 100 (75.3–100) | 90.9 (70.8–98.9) | 100 (75.3–100) | 95.5 (77.2–99.9) | 76.9 (46.2–95) | 90.9 (70.8–98.9) | 100 (75.3–100) | 95.5 (77.2–99.9) | 76.9 (46.2–95) |
| LTBI (n = 41) | 72.7 (49.8–89.3) | 90.2 (76.8–97.3) | 90.9 (70.8–98.9) | 78.1 (62.4–89.4) | 90.9 (70.8–98.9) | 70.7 (54.5–83.9) | 77.3 (54.6–92.2) | 87.8 (73.8–95.9) | 90.9 (70.8–98.9) | 78.1 (62.4–89.4) | |||
| GSE101705 | I | LTBI (n = 28) | vs TB (n = 16) | 96.4 (81.7–99.9) | 100 (79.4–100) | 96.4 (81.7–99.9) | 100 (79.4–100) | 96.4 (81.7–99.9) | 100 (79.4–100) | 96.4 (81.7–99.9) | 100 (79.4–100) | 96.4 (81.7–99.9) | 75 (47.6–92.7) |
| OD vs TB | |||||||||||||
| GSE42826 | UK | Control (n = 52) c | vs TB (n = 11) | 100 (71.5–100) | 90.4 (79–96.8) | 90.9 (58.7–99.8) | 96.2 (86.8–99.5) | 100 (71.5–100) | 71.2 (56.9–82.9) | 81.8 (48.2–97.7) | 100 (93.2–100) | 100 (71.5–100) | 75 (61.1–86) |
| aSARC (n = 16) | 81.8 (48.2–97.8) | 56.3 (29.9–80.3) | 90.9 (58.7–99.8) | 43.8 (19.8–70.1) | 45.5 (16.8–76.6) | 75 (47.6–92.8) | 81.8 (48.2–97.7) | 56.3 (29.9–80.3) | 45.5 (16.8–76.6) | 75 (47.6–92.7) | |||
| naSARC (n = 9) | 72.7 (39–94) | 88.9 (51.8–99.7) | 90.9 (58.7–99.8) | 66.7 (29.9–92.5) | 81.8 (48.2–97.7) | 77.8 (40–97.2) | 81.8 (48.2–97.7) | 77.8 (40–97.2) | 81.8 (48.2–97.7) | 77.8 (40–97) | |||
| LC (n = 8) | 81.8 (48.2–97.7) | 87.5 (47.4–99.7) | 90.9 (58.7–99.8) | 87.5 (47.4–99.7) | 90.9 (58.7–99.8) | 75 (34.9–96.8) | 81.8 (48.2–97.7) | 87.5 (47.4–99.7) | 90.9 (58.7–99.8) | 87.5 (47.4–99.7) | |||
| PN (n = 6) | 90.9 (58.7–99.8) | 83.3 (35.9–99.6) | 90.9 (58.7–99.8) | 83.3 (35.9–99.6) | 90.9 (58.7–99.8) | 83.3 (35.9–99.6) | 81.8 (48.2–97.7) | 87.5 (47.4–99.7) | 90.9 (58.7–99.8) | 83.3 (35.9–99.6) | |||
| Mean | |||||||||||||
| All of the above | Control (n = 80) c | TB (n = 55) | 92.8 (76.8–100) | 96.8 (83–100) | 93.9 (80.9–100) | 82.1 (12.9–100) | 94.3 (78.6–100) | 82.7 (44.8–100) | 86.7 (75.3–98.2) | 100 (100–100) | 94.3 (78.6–100) | 84 (49.4–100) | |
| LTBI (n = 90) | 81.4 (48.9–100) | 96.7 (82.7–100) | 95.8 (84.4–100) | 78.4 (25.1–100) | 91.6 (80.4–100) | 87.1 (49.9–100) | 82.9 (53.7–100) | 95.9 (78.4–100) | 91.6 (80.4–100) | 81.2 (60.8–100) | |||
| OD (n = 39) | 81.8 (70–93.6) | 79 (54.6–100) | 90.9 (90.9–90.9) | 70.3 (38.8–100) | 77.3 (42.9–100) | 77.8 (71.6–84) | NA | NA | NA | NA | |||
| Symptomatic respiratory | |||||||||||||
| E-MTAB-8290 | SA | S-NTB (n = 127) | TB (n = 54) | 61.1 (46.9–74.1) | 67.8 (58.9–75.7) | 90.7 (79.7–96.9) | 26 (18.6–34.5) | 57.4 (43.2–70.8) | 70 (61.3–77.9) | 75.9 (62.4–86.5) | 49.6 (40.6–58.6) | 64.81 (50.6–77.3) | 91.3 (85.0–95.6) |
| Prospective analyses | |||||||||||||
| GSE94438 | PA | Control (n = 208) | vs TB(≤3 m) (n = 13) | 92.3 (64–99.8) | 83.2 (77.4–88) | 92.3 (64–99.8) | 83.2 (77.4–88) | 100 (75.3–100) | 74.5 (68–80.39) | 76.9 (46.2–95) | 87.5 (82.2–91.7) | 92.3 (64–99.8) | 75 (68.5–80.7) |
| Control (n = 208) | vs TB(4–6m) (n = 34) | 76.5 (58.8–89.3) | 53.9 (46.8–60.8) | 91.2 (76.3–98.1) | 23.1 (17.5–29.4) | 52.9 (35.1–70.2) | 70.2 (63.5–76.3) | 76.5 (58.8–89.3) | 53.9 (46.8–60.8) | 50 (32.4–67.6) | 75 (68.5–80.7) | ||
| Control (n = 208) | vs TB(7–12m) (n = 19) | 57.9 (33.5–79.8) | 90.4 (85.5–94) | 94.7 (74–99.9) | 31.3 (25–38) | 63.2 (38.4–83.7) | 76 (69.6–81.6) | 79 (54.4–94) | 61.1 (54.7–67.7) | 63.2 (38.4–83.7) | 75 (68.5–80.7) | ||
| Control (n = 208) | vs TB(13–18m) (n = 32) | 84.4 (67.2–94.7) | 44.7 (37.8–51.7) | 90.6 (75–98) | 30.3 (24.1–379) | 40.6 (23.7–59.4) | 70.2 (63.5–76.3) | 75 (56.6–88.5) | 50 (43–57) | 34.4 (18.6–53.2) | 75 (68.5–80.7) | ||
Publisher’s Note: MDPI stays neutral with regard to jurisdictional claims in published maps and institutional affiliations. |
© 2021 by the authors. Licensee MDPI, Basel, Switzerland. This article is an open access article distributed under the terms and conditions of the Creative Commons Attribution (CC BY) license (https://creativecommons.org/licenses/by/4.0/).
Share and Cite
de Araujo, L.S.; Ribeiro-Alves, M.; Wipperman, M.F.; Vorkas, C.K.; Pessler, F.; Saad, M.H.F. Transcriptomic Biomarkers for Tuberculosis: Validation of NPC2 as a Single mRNA Biomarker to Diagnose TB, Predict Disease Progression, and Monitor Treatment Response. Cells 2021, 10, 2704. https://doi.org/10.3390/cells10102704
de Araujo LS, Ribeiro-Alves M, Wipperman MF, Vorkas CK, Pessler F, Saad MHF. Transcriptomic Biomarkers for Tuberculosis: Validation of NPC2 as a Single mRNA Biomarker to Diagnose TB, Predict Disease Progression, and Monitor Treatment Response. Cells. 2021; 10(10):2704. https://doi.org/10.3390/cells10102704
Chicago/Turabian Stylede Araujo, Leonardo S., Marcelo Ribeiro-Alves, Matthew F. Wipperman, Charles Kyriakos Vorkas, Frank Pessler, and Maria Helena Féres Saad. 2021. "Transcriptomic Biomarkers for Tuberculosis: Validation of NPC2 as a Single mRNA Biomarker to Diagnose TB, Predict Disease Progression, and Monitor Treatment Response" Cells 10, no. 10: 2704. https://doi.org/10.3390/cells10102704
APA Stylede Araujo, L. S., Ribeiro-Alves, M., Wipperman, M. F., Vorkas, C. K., Pessler, F., & Saad, M. H. F. (2021). Transcriptomic Biomarkers for Tuberculosis: Validation of NPC2 as a Single mRNA Biomarker to Diagnose TB, Predict Disease Progression, and Monitor Treatment Response. Cells, 10(10), 2704. https://doi.org/10.3390/cells10102704