Article

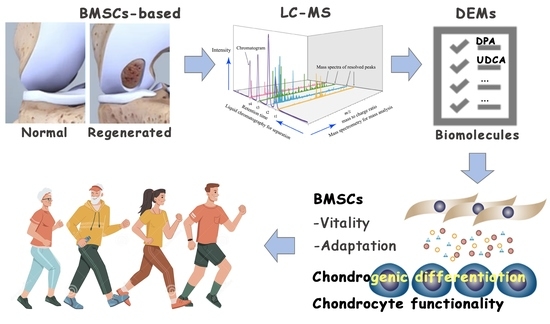
Cartilaginous Metabolomics Reveals the Biochemical-Niche Fate Control of Bone Marrow-Derived Stem Cells

1
Department of Sports Medicine, The Affiliated Hospital of Qingdao University, Qingdao 266000, China
2
Institute of Sports Medicine and Rehabilitation, Qingdao University, Qingdao 266000, China
3
Shandong Institute of Traumatic Orthopedics, Medical Research Center, The Affiliated Hospital of Qingdao University, Qingdao 266590, China
4
Department of Orthopedics, The Third Hospital of Hebei Medical University, Shijiazhuang 050051, China
5
Department of Orthopedics, The Affiliated Hospital of Qingdao University, Qingdao 266000, China
*
Authors to whom correspondence should be addressed.
Cells 2022, 11(19), 2951; https://doi.org/10.3390/cells11192951
Submission received: 22 July 2022 / Revised: 14 August 2022 / Accepted: 14 September 2022 / Published: 21 September 2022

Abstract

:
Joint disorders have become a global health issue with the growth of the aging population. Screening small active molecules targeting chondrogenic differentiation of bone marrow-derived stem cells (BMSCs) is of urgency. In this study, microfracture was employed to create a regenerative niche in rabbits (n = 9). Cartilage samples were collected four weeks post-surgery. Microfracture-caused morphological (n = 3) and metabolic (n = 6) changes were detected. Non-targeted metabolomic analysis revealed that there were 96 differentially expressed metabolites (DEMs) enriched in 70 pathways involved in anti-inflammation, lipid metabolism, signaling transduction, etc. Among the metabolites, docosapentaenoic acid 22n-3 (DPA) and ursodeoxycholic acid (UDCA) functionally facilitated cartilage defect healing, i.e., increasing the vitality and adaptation of the BMSCs, chondrogenic differentiation, and chondrocyte functionality. Our findings firstly reveal the differences in metabolomic activities between the normal and regenerated cartilages and provide a list of endogenous biomolecules potentially involved in the biochemical-niche fate control for chondrogenic differentiation of BMSCs. Ultimately, the biomolecules may serve as anti-aging supplements for chondrocyte renewal or as drug candidates for cartilage regenerative medicine.

Graphical Abstract

1. Introduction

Age-related changes in the chondrocyte renewal in the articular cartilage predispose individuals to osteoarthritis [1,2]. Regenerative medicine aims to restore tissue functionality by harnessing the differentiation potential of stem cells in tissue replacement therapies [3]. Microfracture (MF) is a commonly used surgical method to stimulate cartilage regeneration, involving drilling on the subchondral bone to access the resident bone marrow-derived stem cells (BMSCs) [4] and creating a biochemical niche to induce chondrogenesis and sustain chondrocyte functionality [5]. However, the outcome of MF is correlated with age; i.e., greater improvement is only shown in young patients [6]. This may be due to BMSC aging, failure in chondrogenic differentiation, and dysfunction of the resident chondrocytes in old people [7,8]. Thus, the fate of the activated BMSCs plays a determinative role in the modeling and remodeling of cartilage, which are affected by both intrinsic and extrinsic factors.
The biochemical niche which is created by a variety of small molecules (metabolites) filling in the defect site in MF controls the fate of the activated resident BMSCs [9,10]. For example, omega-3 polyunsaturated fatty acids (ω-3 PUFAs), including docosapentaenoic acid 22n-3 (DPA) [11], maintain the self-renewal of embryonic stem cells [12]. The amino acids, such as tryptophan, modulate the senescence of mesenchymal stromal/stem cells (MSCs) by regulating mitochondrial integrity and function [13]. Yet, the excess reactive oxygen species (ROS), oxidative markers, impair stem cell self-renewal capacity [1,14,15]; subsequentially, the ROS-induced DNA damage causes replicative senescence in MSCs [16]. The excess ROS and related oxidative stress are correlated with the progression of osteoarthritis, characterized by the changes in the hyaline cartilage markers, i.e., an increased catabolism of proteoglycan aggrecan (ACAN) and a loss of type II collagen (COL2A1) [17]. Moreover, dietary intake of ω-3 PUFAs attenuates osteoarthritis-associated cartilage degradation [18]. Hence, we hypothesize that the metabolic cues in the regenerative niche contribute to BMSC activity and rebalance a hostile joint environment, which is of paramount importance for the fate control of BMSCs in chondrogenesis.
The aim of this study was to discover biomolecules with the potential to serve as anti-aging supplements for chondrocyte renewal or as drug candidates for cartilage regenerative medicine. In this study, MF was employed in healthy rabbits to create a regenerative niche for BMSCs, which maximizes the detection of the key components in cartilage regeneration and excludes the background noise in deteriorative joints. Non-targeted metabolomics was performed to determine the metabolic differences between the normal (NOR) and regenerated (REG) cartilages. A list of cartilage regeneration-related endogenous small molecules, i.e., the differentially expressed metabolites (DEMs), were identified. Two of the metabolites, DPA and ursodeoxycholic acid (UDCA), were picked to determine their specific effects on cartilage regeneration, i.e., BMSC vitality, chondrogenic differentiation, and chondrocyte functionality, based on the chondrocyte-protective role of ω-3 PUFAs [19] and the chondrocyte-differentiation-facilitating role of cholesterol (the substrate of UDCA) [20].

2. Materials and Methods

2.1. Rabbit Microfracture Model

The animal study was approved by the Ethics Committee of Experimental Animals of the Affiliated Hospital of Qingdao University (No. AHQU-MAL20210419). A self-controlled design was used in this study. Male New Zealand white rabbits (10–12 weeks in age, 2.0–2.5 kg in weight, n = 9) were anesthetized through ear vein administration of 3% w/v pentobarbital sodium at a dosage of 1.0 mg/kg. After sterilization, a 2–3 cm anteromedial parapatellar incision was made on the left knee, and the patella was everted. An articular cartilage defect (Ø ~ 4 × 6 mm, 2 mm in depth) was created on the trochlear groove of the left distal femur with a sterilized cranial drill bit (ØO = 2.1 mm, RWD, Shenzhen, China) (Figure 1A). Afterward, the debris was removed and hemostasis was achieved. All rabbits were treated with gentamycin for three days after the surgery.

2.2. Tissue Collection

The rabbits were sacrificed by CO2 asphyxiation, and the paired cartilage samples from both the left and right distal femurs (n = 9) were collected based on the reported protocol [19]. For histochemical analysis (n = 3), three pairs of trochlear grooves were kept in 4% paraformaldehyde in phosphate-buffered saline (PBS) for 24 h and then decalcified in EDTA (14% w/v, pH 7.4) for 21 days at 4 °C until measurement. For metabolomic analysis (n = 6), six pairs of cartilage tissues were washed with PBS and then stored at −80 °C until analysis.

2.3. Histochemistry

The decalcified tissues were embedded in paraffin, and then sagittal sections were cut at 3 μm. Hematoxylin–eosin (H&E) staining was conducted to determine the cellular regularity of cartilage using a commercial kit (G1120, Solarbio, Beijing, China) according to the published procedure [20]. A commercial kit (G1371, Solarbio) was used for the Safranin-O/Fast Green staining, in which the depth of the reddish color is correlated with the content of ACAN [21], by following the company’s instructions. All the slices were dehydrated, transparentized, and then mounted with neutral resin for microscopic observation (Leica, Herlev, Denmark). Images were representative results of three biological repeats.

2.4. Metabolomics

2.4.1. Sample Preparation for Liquid Chromatography–Mass Spectrometry

L-2-Chlorophenylalanine (20 µL, 0.3 mg/mL in methanol) was used as the internal standard. The cartilage sample (30 mg) was mixed with ice-cooled methanol (400 µL, 80%), precooled for 2 min at −20 °C, and then ground at 60 Hz for 2 min. After ultrasonic extraction, the solution was centrifuged at 13,000 rpm for 10 min at 4 °C. Then, 300 µL of the supernatant was evaporated and re-dissolved with 200 µL methanol (20%). The mixture was incubated for 2 h at −20 °C and then centrifuged at 11,400× g (TGL-16MS, Shanghai Lu Xiangyi Centrifuge Instrument Co., Ltd., Shanghai, China) for 10 min at 4 °C. Afterward, 150 µL of the liquid supernatant from each tube was collected, filtered by an organic phase pinhole filter (0.22 μm), and then stored at −80 °C until analysis.

2.4.2. Liquid Chromatography–Mass Spectrometry

Liquid chromatography–mass spectrometry (LC-MS) analysis was conducted by following a published protocol [22]. Briefly, the LC was performed using an ACQUITY UPLC HSS T3 1.8-micron column at 45 °C. The mobile phase contained water and acetonitrile with 0.1% formic acid; gradient elution was conducted at a flow rate of 0.35 mL/min. All samples were kept at 4 °C during the analysis. The injection volume was 2 μL. The MS was performed on an AB TripleTOF 6600 plus system, with electrospray ionization using both positive and negative ion modes. The full mass scan range was set at 100–1000 mass to charge ratio (m/z).

2.4.3. Bioinformatics Data Processing

The raw data obtained from LC-MS were analyzed using Progenesis QI v2.3 (Nonlinear Dynamics, Newcastle, UK) with main parameters of 5 ppm/10 ppm precursor tolerance, 10 ppm/20 ppm product tolerance, and 5% product ion threshold. The compounds were identified based on the RT-m/z pairs. The supervised orthogonal partial least squares discriminant analysis (OPLS-DA) analysis was employed to distinguish the metabolic profiles of the NOR and REG groups, and a volcano plot was employed to visualize the alterations of the metabolite concentrations.

2.4.4. Identification of the Differentially Expressed Metabolites

The metabolites were identified using Progenesis QI v2.3, according to the Human Metabolome database (http://www.hmdb.ca/, assessed on 20 June 2007), Lipid Maps database (V2.3, http://www.lipidmaps.org/, assessed 15 July on 2003), the Metlin database, and the self-built database of Shanghai Lu-Ming Biotech Co. Ltd. (Shanghai, China). To identify the DEMs in the NOR and REG groups, the thresholds were set based on the variable importance in projection (VIP) >1.0 and p < 0.05 from the paired Student’s t-test. Moreover, the DEMs were further searched using online databases, including the Aging Atlas (https://ngdc.cncb.ac.cn/aging/metabolomics, assessed on 29 October 2020) and Regeneration Roadmap (https://ngdc.cncb.ac.cn/regeneration/metabolomics, assessed on 30 September 2021).

2.4.5. Pathway Enrichment Analysis

The pathway enrichment analysis for the DEMs was performed using the Kyoto Encyclopedia of Genes and Genomes database (KEGG, https://www.kegg.jp/kegg/pathway.html, assessed 22 March on 1995) through matching IDs (the KEGG ID of the corresponding DEM). A pathway with a p-value < 0.05 was considered a significant one.

2.5. Cell Culture and Differentiation Induction

2.5.1. Bone Marrow-Derived Stem Cell Culture

Passage (P) 2 of human BMSCs was purchased from Haixing Biosciences (BMHX-C106, Suzhou, China). The BMSCs were cultured in the Human BMSCs Growth Medium (HyCyte, BMHX-G101, Haixing Biosciences) supplemented with 1% penicillin/streptomycin, 1% glutamine, and 10% fetal bovine serum under the condition of 5% CO2 in the air at 37 °C.

2.5.2. Chondrogenic Differentiation

The chondrogenic differentiation in monolayer culture was induced according to the previous protocol with minor modifications [23]. Briefly, P4 BMSCs were cultured using a Human BMSCs Chondrogenic Differentiation Kit (BMHX-D203R, Haixing Biosciences) for three weeks. The differentiated chondrocytes were maintained in the chondrocyte growth medium, i.e., the DMEM/F12 medium with 10% FBS and 1% penicillin/streptomycin.

2.6. Stimuli and Chemicals Administrated

The oxidative stress and DNA damage to BMSCs were created by employing hydrogen peroxide (H2O2, 3%, LIRCON, Dezhou, China) and mitomycin C (MC, GC12353, GLPBIO, Montclair, CA, USA), respectively [24,25]. The dosages of H2O2 (250 μM) and MC (1 μM) were selected based on a previous study [24] and our pilot experiments (Supplementary Figure S1). The effects of UDCA (HY-13771, MCE, Monmouth Junction, NJ, USA) and DPA (GC31637, GLPBIO) on the vitality of BMSCs were examined under both control and challenge states. Various concentrations of the biomolecules (0, 5, 10, 50, and 100 µM) were added to the culture medium to determine the DEM’s contribution to the vitality of BMSCs, while the biomolecules were added with the stimulus to determine the DEM’s role under the H2O2 and MC challenged conditions. Thereafter, an optional dosage, 50 μM for both UDCA and DPA, was used in this study for identifying the effects of small molecules on chondrogenic differentiation and chondrocyte functionality.

2.7. Cell Vitality

The cell vitality was detected using the Cell Counting Kit-8 (CCK-8, C6005, NCM Biotech, Suzhou, China) after 24 h of incubation with and without small molecules. The optical density was read at 450 nm using a multimode plate reader (PerkinElmer, Waltham, MA, USA).
The data of the CCK-8 assay were presented as mean ± standard error (SEM). Statistical analyses and graphics were conducted using GraphPad Prism version 7.0 (San Diego, CA, USA). The effects of the small molecules under control and challenge conditions were revealed by a one-way ANOVA analysis. The Dunnett test was used to partition differences among the dosages. A value of p < 0.05 was considered to be statistically significant.

2.8. Immunofluorescence

The cells were grown on glass coverslips (ØO = 14 mm). The immunofluorescence was determined according to the method previously described with some modifications [26]. Briefly, the cells were incubated with anti-ACAN (1:500, bs-1223R, Boiss, Beijing, China) overnight at 4 °C after fixation and permeabilization. The goat anti-rabbit 594 secondary antibody (1:500, bs-0295G-AF594, Boiss) was applied for 2 h at RT. The cells were counterstained with phalloidin (C1033, Beyotime, Shanghai, China) to determine the cytoskeletal arrangement [27], and the nuclei were identified after staining with DAPI (S2110, Solarbio) for 30 min at RT. The images were taken under a Leica DM 6000B microscope (Leica, Herlev, Denmark) and were representatives of three repeats.

2.9. Real-Time PCR

Total RNA was extracted using NcmZol Reagent (M5100, NCM Biotech). The concentration and quality of RNA were measured using a spectrophotometer (Nanodrop 2000c, Thermo Fisher, Waltham, MA, USA). Reverse transcription was conducted using the Reverse Transcription Reagent Pack (Applied Biosystems, Thermo Fisher). Real-time PCR analysis was carried out using Quantstudio 5 (Applied Biosystems) with the SYBR Green Master Mix (Applied Vazyme, Nanjing, China) and gene-specific primers (Table 1) of the key transcriptional factor for chondrogenic differentiation (SRY-related high mobility group-box gene 9, SOX9) and the chondrogenic indicators (ACAN and COL2A1) [21,28]. The Ct-value of β-actin mRNA was used as the internal control. The relative mRNA expression levels were analyzed using the 2−ΔΔCt method [29]. The unpaired Students’ t-test was applied to determine the difference between DPA or UDCA treatment with the CON group. A value of p < 0.05 was considered to be statistically significant.

3. Results

3.1. The Histomorphologic Changes in the Regenerated Cartilage

Compared to the NOR cartilage, the REG cartilage lost its transparent color and smooth and glistening appearance, replaced with a rough surface with fissures (Figure 1B). The REG cartilage also lost the regularity seen in the H&E-stained NOR cartilage, i.e., a highly organized structure composed of four zones (Figure 1C,D). Specifically, the thickness of the REG cartilage layer at the defect site was lower than that of the NOR group, while the chondrocytes in the REG group were more compactly organized than those in the NOR group (Figure 1C–F). Furthermore, the shape of the chondrocytes in the NOR group was plumper and more round (Figure 1C,E) than that of the chondrocytes in the REG group (Figure 1D,F). Moreover, the reddish-stained ACAN content in the REG cartilage (Figure 1E) was lower than that in the NOR cartilage (Figure 1F).

3.2. The Metabolomic Changes in the Regenerated Cartilage

The OPLS-DA plot revealed the differences in metabolomic activities between the NOR and REG groups (Figure 2A). A total of 96 DEMs were identified (Table 2), with 31 decreased and 65 increased metabolites induced by MF (Figure 2B). Of these, 11 DEMs were matched with the records in the Regeneration Roadmap and Age Atlas (Figure 2C, Supplementary Table S1). Moreover, the DEMs can be divided into six categories, including lipids and lipid-like molecules (47), organic oxygen compounds (16), organic acids and derivatives (12), heterocyclic compounds (15), organosulfur compounds (2), and hydrocarbons (4). Notably, the lipids and lipid-like molecules were accountable for half (48.96%) of the entire metabolic alterations in cartilage regeneration. Of the lipids and lipid-like molecules, the majority were increased in the REG cartilages (85.11%), including DPA (Figure 2D, p = 0.0087) and UDCA (Figure 2E, p = 0.005). The organic oxygen compounds, accounting for 16.67% of the DEMs, were mainly second messengers and oligosaccharides. Among the organic oxygen compounds, most of the glycolytic substances were decreased. The heterocyclic compounds, organosulfur compounds, and others accounted for the rest (21.88%) of the DEMs.
The enrichment analysis yielded 70 pathways related to cartilage regeneration (Supplementary Table S2), with the top 20 listed in the bubble diagram (Figure 2F), which revealed the key information associated with the biochemical-niche control for chondrogenesis, such as the rapamycin (mTOR) signaling pathway. Moreover, the detailed information on the pathways with hits ≥ 2 and p-value < 0.05 is presented in Table 3.

3.3. Differentially Expressed Metabolites Involved in Promoting the Vitality and Adaptation of BMSCs

The facilitating effect of both DPA (p < 0.0001, Figure 3A) and UDCA (p = 0.004, Figure 3B) on the vitality of BMSCs was revealed. Specifically, 50 and 100 μM of both DPA and UDCA significantly increased the optical densities compared to the control group (0 μM). Under oxidative challenge, adding DPA and UDCA rescued the damage effect of 250 μM H2O2 (p < 0.0001, Figure 3C; p = 0.002, Figure 3D). Similarly, the administration of DPA and UDCA rescued the injury effect of DNA damage caused by 1 μM MC (p < 0.0001, Figure 3E; p < 0.0001, Figure 3F).

3.4. Differentially Expressed Metabolites Involved in Promoting Chondrogenic Differentiation

After induced chondrogenic differentiation (Figure 4A), compared to the CON group (Figure 4B), the intensity of ACAN was increased in both the DPA (Figure 4C) and UDCA (Figure 4D) groups. The phalloidin staining was of high intensity, with the microfilaments easily distinguishable in the CON group (Figure 4E), while the staining in the DPA (Figure 4F) and UDCA (Figure 4G) groups was almost faded; in particular, the microfilaments in the UDCA group mostly disappeared (Figure 4G). Moreover, the ACAN signal was co-located with the nucleus in the CON group (Figure 4B,H,K) and exhibited cytoplasmic shuttling in the DPA (Figure 4C,I,L) and UDCA (Figure 4D,J,M) groups. Furthermore, the quantitative analysis indicated that the administration of DPA during chondrogenic differentiation significantly elevated the mRNA expression of SOX9 (Figure 4N), ACAN (Figure 4O), and COL2A1 (Figure 4P) compared to the CON group, while UDCA significantly increased the SOX9 (Figure 4N) and ACAN (Figure 4O) mRNA expression levels.

3.5. Differentially Expressed Metabolites Involved in Promoting Chondrocyte Functionality

The ACAN signal was detected in the nucleus and cytoplasm in the CON group (Figure 5B,H,K), while it was restricted in the cytoplasm and exhibited exocytosis (arrows) in both the DPA (Figure 5C,I,L) and UDCA (Figure 5D,J,M) groups. In addition, the chondrocytes in the CON group (Figure 5E) tended to have a fibroblast-like appearance, while those in the DPA (Figure 5F) and UDCA (Figure 5G) groups were more likely to exhibit a polygon shape. Furthermore, the quantitative analysis indicated that the ACAN mRNA expression in the chondrocytes was increased in both DPA and UDCA groups (Figure 5N), while the mRNA expression levels of COL2A1 (Figure 5O) were increased in the UDCA group only.

4. Discussion

Currently, the common osteoarthritis therapy with nonsteroidal anti-inflammatory drugs or chondroprotective hyaluronic acid (HA) is ineffective for cartilage regeneration [30]. The pharmaceutical industry is calling for novel biomolecules covering both safety and effectiveness as anti-aging supplements or drug candidates for joint health. The metabolomics modules in the Aging Atlas and Regeneration Roadmap offer the molecular substances potentially related to the degenerative and regenerative events in the blastema of axolotls, deer antler stem cells, etc. However, orthopedic metabolic cues are lacking. In this study, the minority of identified DEMs (11/96) were matched with the records in the Regeneration Roadmap and Aging Atlas, which stresses the uniqueness and significance of the cartilage regeneration-specific metabolites. This study firstly reveals the biomolecules for cartilage regeneration, which serve each step during MF, i.e., the vitality and adaptation of BMSCs as well as chondrogenic differentiation and chondrocyte functionality.
The vitality of the activated BMSCs may be the main restriction for cartilage regeneration, especially in old people with an inadequate BMSC pool and senescent BMSCs [5]. The vitality of BMSCs is altered by the biophysical perturbation during their migration, e.g., switched from the hypoxic bone marrow niche to the oxygen-exposed defect site in MF [31]. Oxidative metabolism, e.g., the oxidative stress and the subsequent DNA damage in the defect site, has been revealed by the increase in FAPγ-adenine in the heterocyclic compounds in the REG group, exhibiting the damage effects on the vitality of BMSCs [32]. Adding DPA or UDCA increased the vitality of the BMSCs under both the control condition and oxidative challenge. Moreover, the fluctuation in the cellular metabolism directly alters the microenvironment for cartilage regeneration in situ [33]. In this study, increases in phenylalanine, tyrosine, tryptophan, 2′-O-methyladenosine (an analog of adenosine), sphingosine, and SM(d18:1/24:1(15Z)) have been identified in the REG group. Acetyl-CoA is obtained from amino acids such as phenylalanine, tyrosine, and tryptophan [34], and oxidation of acetyl-CoA accounts for ATP production [34]. It has been reported that adenosine elevates the ATP supply in MSCs [35,36]. Moreover, the sphingolipid metabolism and sphingolipid signaling pathways are associated with stem cell migration and signaling transduction [37,38]. Hence, the DEMs may regulate the vitality of the activated BMSCs via mediating acetyl-CoA synthesis, ATP supply, and signaling transduction.
The foreign supply in the defect site is critical for the renewal and functionality of chondrocytes because cartilage is an avascular tissue [39]. The elevated second messengers in the REG group may reveal the boosting of signaling transduction in the differentiating and newborn chondrocytes. The activated mTOR signaling pathway is critical for lipid biosynthesis [40] and chondrogenic differentiation [41]. Blocking mTOR signaling inhibits chondrogenic differentiation [41]. Hence, the DEMs may participate in regulating chondrogenic differentiation and chondrocyte functionality, and they may potentially prevent cartilage loss in musculoskeletal diseases via mediating mTOR signaling transduction. In addition, both DPA and UDCA promoted chondrogenic differentiation by stimulating the mRNA expression of SOX9 and ACAN and facilitating cytoskeleton rearrangement during chondrogenic differentiation via regulating F-actin depolymerization. The administration of DPA and UDCA enhanced chondrocyte functionality by promoting the extracellular processing of ACAN. The HA-bound extracellular ACAN regulates HA endocytosis [42], which may determine the chondroprotective effect of HA. Compared to DPA, UDCA exhibited higher potential in facilitating chondrogenic differentiation and chondrocyte functionality potentially due to cholesterol’s facilitating role in chondrocyte differentiation [43]. The inconsistency between DPA and UDCA may be associated with the dosage effect or functioning pathway, and the related mechanism will be explored in further study.

5. Conclusions

Generally, the findings of this study (1) provided a list of biomolecules potentially involved in the fate control of the activated resident BMSCs in cartilage regeneration and (2) verified the functions of UDCA and DPA in promoting BMSC vitality, chondrogenic differentiation, and chondrocyte functionality. Ultimately, the small molecules may work as anti-aging supplements for joint rejuvenation. Clinical supply with the biomolecules in MF may confer a better outcome and promote the surgery to a broad base of patients, especially the elderly, by rebalancing and conquering the hostile joint environment. Additionally, combining the biomolecules with BMSC therapy may be a safe and effective strategy in stem cell-treated diseases, not limited to orthopedic disorders.

Supplementary Materials

The following supporting information can be downloaded at: https://www.mdpi.com/article/10.3390/cells11192951/s1, Figure S1: The dosages of the stimuli. Various concentrations of H2O2 (A) and MC (B) were added in the culture medium and co-incubated with the BMSCs for 24 h, and the cell viability was decided by CCK8 assay. The data of cell viability assay were presented as MEAN ± standard error (SEM). A one-way ANOVA analysis was employed to determine the damage effect of H2O2 and MC. The Dunnett test was used to partition differences of each stimulus-treated group with the control (0 μM); Table S1: The DEMs matched with the records in Regeneration Roadmap and Aging Atlas; Table S2: The list of the potential pathways induced by MF.

Author Contributions

Conceptualization, H.P., X.H. and T.Y.; methodology, H.P. and Z.R.; data curation, Z.W. and R.C.; writing—original draft preparation, H.P. and X.H.; writing—review and editing, X.H., T.Y. and Y.Z. (Yingze Zhang); supervision, T.Y. and Y.Z. (Yingze Zhang); funding acquisition, T.Y. and Y.Z. (Yi Zhang). All authors have read and agreed to the published version of the manuscript.

Funding

This research was funded by grants from the National Natural Science Foundation of China (No. 31872310 to T.Y., No. 31802022 to Y.Z.).

Institutional Review Board Statement

The animal study was approved by the Ethics Committee of Experimental Animals of the Affiliated Hospital of Qingdao University (No. AHQU-MAL20210419).

Informed Consent Statement

Not applicable.

Data Availability Statement

Data are available from the corresponding author under reasonable request.

Conflicts of Interest

The authors declare no conflict of interest.

References

  1. Roseti, L.; Desando, G.; Cavallo, C.; Petretta, M.; Grigolo, B. Articular Cartilage Regeneration in Osteoarthritis. Cells 2019, 8, 1305. [Google Scholar] [CrossRef]
  2. Ramasamy, T.S.; Yee, Y.M.; Khan, I.M. Chondrocyte Aging: The Molecular Determinants and Therapeutic Opportunities. Front. Cell Dev. Biol. 2021, 9, 625497. [Google Scholar] [CrossRef]
  3. Andia, I.; Maffulli, N. Biological Therapies in Regenerative Sports Medicine. Sports Med. 2017, 47, 807–828. [Google Scholar] [CrossRef]
  4. Pittenger, M.F.; Mackay, A.M.; Beck, S.C.; Jaiswal, R.K.; Douglas, R.; Mosca, J.D.; Moorman, M.A.; Simonetti, D.W.; Craig, S.; Marshak, D.R. Multilineage Potential of Adult Human Mesenchymal Stem Cells. Science 1999, 284, 143–147. [Google Scholar] [CrossRef]
  5. Im, G.-I. Endogenous Cartilage Repair by Recruitment of Stem Cells. Tissue Eng. Part B Rev. 2016, 22, 160–171. [Google Scholar] [CrossRef]
  6. Steadman, J.R.; Briggs, K.K.; Rodrigo, J.J.; Kocher, M.S.; Gill, T.J.; Rodkey, W.G. Outcomes of microfracture for traumatic chondral defects of the knee: Average 11-year follow-up. Arthrosc. J. Arthrosc. Relat. Surg. 2003, 19, 477–484. [Google Scholar] [CrossRef]
  7. Lee, J.M.; Kim, B.-S.; Lee, H.; Im, G.-I. In Vivo Tracking of Mesechymal Stem Cells Using Fluorescent Nanoparticles in an Osteochondral Repair Model. Mol. Ther. 2012, 20, 1434–1442. [Google Scholar] [CrossRef]
  8. Armiento, A.R.; Alini, M.; Stoddart, M.J. Articular fibrocartilage—Why does hyaline cartilage fail to repair? Adv. Drug Deliv. Rev. 2018, 146, 289–305. [Google Scholar] [CrossRef]
  9. Morrison, S.J.; Spradling, A.C. Stem Cells and Niches: Mechanisms That Promote Stem Cell Maintenance throughout Life. Cell 2008, 132, 598–611. [Google Scholar] [CrossRef]
  10. Oh, J.; Lee, Y.D.; Wagers, A.J. Stem cell aging: Mechanisms, regulators and therapeutic opportunities. Nat. Med. 2014, 20, 870–880. [Google Scholar] [CrossRef] [Green Version]
  11. Ward, O.P.; Singh, A. Omega-3/6 fatty acids: Alternative sources of production. Process Biochem. 2005, 40, 3627–3652. [Google Scholar] [CrossRef]
  12. Lee, M.Y.; Ryu, J.M.; Lee, S.H.; Park, J.H.; Han, H.J. Lipid rafts play an important role for maintenance of embryonic stem cell self-renewal. J. Lipid Res. 2010, 51, 2082–2089. [Google Scholar] [CrossRef]
  13. Wu, K.K. Control of Mesenchymal Stromal Cell Senescence by Tryptophan Metabolites. Int. J. Mol. Sci. 2021, 22, 697. [Google Scholar] [CrossRef]
  14. Denu, R.A.; Hematti, P. Effects of Oxidative Stress on Mesenchymal Stem Cell Biology. Oxid. Med. Cell. Longev. 2016, 2016, 2989076. [Google Scholar] [CrossRef]
  15. Ito, K.; Hirao, A.; Arai, F.; Matsuoka, S.; Takubo, K.; Hamaguchi, I.; Nomiyama, K.; Hosokawa, K.; Sakurada, K.; Nakagata, N.; et al. Regulation of oxidative stress by ATM is required for self-renewal of haematopoietic stem cells. Nature 2004, 431, 997–1002. [Google Scholar] [CrossRef]
  16. Yu, J.; Shi, J.; Zhang, Y.; Zhang, Y.; Huang, Y.; Chen, Z.; Yang, J. The replicative senescent mesenchymal stem/stromal cells defect in DNA damage response and anti-oxidative capacity. Int. J. Med. Sci. 2018, 15, 771–781. [Google Scholar] [CrossRef]
  17. Lepetsos, P.; Papavassiliou, A.G. ROS/oxidative stress signaling in osteoarthritis. Biochim. Biophys. Acta (BBA) Mol. Basis Dis. 2016, 1862, 576–591. [Google Scholar] [CrossRef]
  18. Zainal, Z.; Longman, A.; Hurst, S.; Duggan, K.; Caterson, B.; Hughes, C.; Harwood, J. Relative efficacies of omega-3 polyunsaturated fatty acids in reducing expression of key proteins in a model system for studying osteoarthritis. Osteoarthr. Cartil. 2009, 17, 896–905. [Google Scholar] [CrossRef]
  19. Chen, H.; Chevrier, A.; Hoemann, C.; Sun, J.; Lascau-Coman, V.; Buschmann, M. Bone marrow stimulation induces greater chondrogenesis in trochlear vs condylar cartilage defects in skeletally mature rabbits. Osteoarthr. Cartil. 2013, 21, 999–1007. [Google Scholar] [CrossRef]
  20. Zu, Y.; Mu, Y.; Li, Q.; Zhang, S.-T.; Yan, H.-J. Icariin alleviates osteoarthritis by inhibiting NLRP3-mediated pyroptosis. J. Orthop. Surg. Res. 2019, 14, 307. [Google Scholar] [CrossRef]
  21. Thorp, H.; Kim, K.; Kondo, M.; Grainger, D.W.; Okano, T. Fabrication of hyaline-like cartilage constructs using mesenchymal stem cell sheets. Sci. Rep. 2020, 10, 20869. [Google Scholar] [CrossRef]
  22. Shao, Q.; Cheng, J.; Li, Y.; Ni, G. Liquid Chromatography-Mass Spectrometry-Based Plasma Metabolomics Study of the Effects of Moxibustion with Seed-Sized Moxa Cone on Hyperlipidemia. Evid. Based Complement. Altern. Med. 2020, 2020, 1231357. [Google Scholar] [CrossRef]
  23. Ruhl, T.; Beier, J.P. Quantification of chondrogenic differentiation in monolayer cultures of mesenchymal stromal cells. Anal. Biochem. 2019, 582, 113356. [Google Scholar] [CrossRef]
  24. Cremers, N.A.J.; Lundvig, D.M.S.; Van Dalen, S.C.M.; Schelbergen, R.F.; Van Lent, P.L.E.M.; Szarek, W.A.; Regan, R.F.; Carels, C.E.; Wagener, F.A.D.T.G. Curcumin-Induced Heme Oxygenase-1 Expression Prevents H2O2-Induced Cell Death in Wild Type and Heme Oxygenase-2 Knockout Adipose-Derived Mesenchymal Stem Cells. Int. J. Mol. Sci. 2014, 15, 17974–17999. [Google Scholar] [CrossRef]
  25. Cheng, S.-Y.; Seo, J.; Huang, B.T.; Napolitano, T.; Champeil, E. Mitomycin C and decarbamoyl mitomycin C induce p53-independent p21WAF1/CIP1 activation. Int. J. Oncol. 2016, 49, 1815–1824. [Google Scholar] [CrossRef]
  26. Huang, X.; Kuang, S.; Applegate, T.J.; Lin, T.-L.; Cheng, H.-W. Prenatal Serotonin Fluctuation Affects Serotoninergic Development and Related Neural Circuits in Chicken Embryos. Neuroscience 2021, 473, 66–80. [Google Scholar] [CrossRef]
  27. Takano, I.; Takeshita, N.; Yoshida, M.; Seki, D.; Oyanagi, T.; Kimura, S.; Jiang, W.; Sasaki, K.; Sogi, C.; Kawatsu, M.; et al. Ten-m/Odz3 regulates migration and differentiation of chondrogenic ATDC5 cells via RhoA-mediated actin reorganization. J. Cell. Physiol. 2020, 236, 2906–2919. [Google Scholar] [CrossRef]
  28. Kou, I.; Ikegawa, S. SOX9-dependent and -independent Transcriptional Regulation of Human Cartilage Link Protein. J. Biol. Chem. 2004, 279, 50942–50948. [Google Scholar] [CrossRef]
  29. Livak, K.J.; Schmittgen, T.D. Analysis of relative gene expression data using real-time quantitative PCR and the 2−ΔΔCT Method. Methods 2001, 25, 402–408. [Google Scholar] [CrossRef]
  30. Jerosch, J. Effects of Glucosamine and Chondroitin Sulfate on Cartilage Metabolism in OA: Outlook on Other Nutrient Partners Especially Omega-3 Fatty Acids. Int. J. Rheumatol. 2011, 2011, 969012. [Google Scholar] [CrossRef] [Green Version]
  31. Parate, D.; Kadir, N.D.; Celik, C.; Lee, E.H.; Hui, J.H.P.; Franco-Obregón, A.; Yang, Z. Pulsed electromagnetic fields potentiate the paracrine function of mesenchymal stem cells for cartilage regeneration. Stem Cell Res. Ther. 2020, 11, 46. [Google Scholar] [CrossRef]
  32. Cadet, J.; Wagner, J.R. DNA Base Damage by Reactive Oxygen Species, Oxidizing Agents, and UV Radiation. Cold Spring Harb. Perspect. Biol. 2013, 5, a012559. [Google Scholar] [CrossRef]
  33. Shah, S.; Esdaille, C.J.; Bhattacharjee, M.; Kan, H.-M.; Laurencin, C.T. The synthetic artificial stem cell (SASC): Shifting the paradigm of cell therapy in regenerative engineering. Proc. Natl. Acad. Sci. USA 2022, 119, e2116865118. [Google Scholar] [CrossRef]
  34. Akram, M. Citric acid cycle and role of its intermediates in metabolism. Cell Biochem. Biophys. 2014, 68, 475–478. [Google Scholar] [CrossRef]
  35. Jeske, S.S.; Theodoraki, M.N.; Boelke, E.; Laban, S.; Brunner, C.; Rotter, N.; Jackson, E.K.; Hoffmann, T.K.; Schuler, P.J. Adenosine production in mesenchymal stromal cells in relation to their developmental status. HNO 2020, 68, 87–93. [Google Scholar] [CrossRef]
  36. Diamante, L.; Martello, G. Metabolic regulation in pluripotent stem cells. Curr. Opin. Genet. Dev. 2022, 75, 101923. [Google Scholar] [CrossRef]
  37. Spiegel, S.; Milstien, S. Functions of the Multifaceted Family of Sphingosine Kinases and Some Close Relatives. J. Biol. Chem. 2007, 282, 2125–2129. [Google Scholar] [CrossRef]
  38. Ullah, I.; Subbarao, R.B.; Rho, G.J. Human mesenchymal stem cells—Current trends and future prospective. Biosci. Rep. 2015, 35, e00191. [Google Scholar] [CrossRef]
  39. Villalvilla, A.; Gómez, R.; Largo, R.; Herrero-Beaumont, G. Lipid Transport and Metabolism in Healthy and Osteoarthritic Cartilage. Int. J. Mol. Sci. 2013, 14, 20793–20808. [Google Scholar] [CrossRef]
  40. Rivas, D.A.; Yaspelkis, B.B., III.; Hawley, J.A.; Lessard, S.J. Lipid-induced mTOR activation in rat skeletal muscle reversed by exercise and 5′-aminoimidazole-4-carboxamide-1-β-d-ribofuranoside. J. Endocrinol. 2009, 202, 441–451. [Google Scholar] [CrossRef] [Green Version]
  41. Li, H.; Jin, Y.; Zhao, Y.; Li, W.; He, Z.; Zhang, Q.; Huang, H.; Lin, J.; Chen, Y.; Xing, D.; et al. Targeted cell therapy for partial-thickness cartilage defects using membrane modified mesenchymal stem cells by transglutaminase 2. Biomaterials 2021, 275, 120994. [Google Scholar] [CrossRef]
  42. Danielson, B.T.; Knudson, C.B.; Knudson, W. Extracellular Processing of the Cartilage Proteoglycan Aggregate and Its Effect on CD44-mediated Internalization of Hyaluronan. J. Biol. Chem. 2015, 290, 9555–9570. [Google Scholar] [CrossRef]
  43. Gentili, C.; Tutolo, G.; Pianezzi, A.; Cancedda, R.; Cancedda, F.D. Cholesterol secretion and homeostasis in chondrocytes: A liver X receptor and retinoid X receptor heterodimer mediates apolipoprotein A1 expression. Matrix Biol. 2005, 24, 35–44. [Google Scholar] [CrossRef]
Figure 1. The histological profiles of normal and regenerated cartilages in rabbits. (A). The microfracture (MF) surgery is conducted on the trochlear groove of the left distal femur. An articular cartilage defect (Ø ~ 4 × 6 mm, 2 mm in depth) has been created on the trochlear groove of the left distal femur with a sterilized cranial drill bit (ØO = 2.1 mm). (B). The photographs of the trochlear grooves. Compared to the normal (NOR) cartilage, the regenerated (REG) cartilage loses its transparent color and smooth and glistening appearance, replaced with a rough surface with fissures. (C,D) Examples of the H&E staining. Compared to the NOR cartilage, the REG cartilage loses the highly organized structure composed of four zones, i.e., the superficial, middle, deep, and calcified zones. (E,F) Example of the Safranin-O/Fast Green staining. Compared to the NOR cartilage, the reddish-stained ACAN content in the REG cartilage was lower. The scale bars represent 40 μm and 10 μm.
Cells 11 02951 g001
Figure 2. The global metabolomic profiles of the normal and regenerated cartilages. (A) The supervised orthogonal partial least squares discriminant analysis (OPLS-DA) model reveals the metabolic differences between the NOR and REG groups. (B) The volcano plot indicates the upregulated differential metabolites (DEMs) in the REG group (red), the downregulated DEMs (blue), and non-significantly altered metabolites (gray). (C) Venn diagram shows the DEMs matched with the records in the Regeneration Roadmap and Aging Atlas databases. (D,E) The different expression levels of docosapentaenoic acid 22n-3 (DPA, (D)) and ursodeoxycholic acid (UDCA, (E)) between the NOR and REG groups are revealed. (F) The bubble diagram shows the top 20 differential metabolic pathways enriched by the DEMs. X-axis represents rich factors, and Y-axis represents pathway terms. The numbers of the involved metabolites and p-value are listed on the right side. The detailed information is presented in Supplementary Tables S1 and S2.
Cells 11 02951 g002
Figure 3. The effects of DAP and UDCA on the vitality and adaptation of the BMSCs. (A,B). The dosage effects of DPA and UDCA on the vitality of BMSCs. (C,D). The dosage effects of DPA and UDCA on the vitality of BMSCs in response to 250 μM hydrogen peroxide (H2O2)-caused oxidative stress damage. (E,F). The dosage effects of DPA and UDCA on the vitality of BMSCs in response to 1 μM mitomycin C (MC)-caused DNA damage. The data are presented as mean ± SEM (n = 7). * p < 0.05; ** p < 0.01; *** p < 0.0001.
Cells 11 02951 g003
Figure 4. The effects of DPA and UDCA on chondrogenic differentiation. DPA and UDCA were separately administrated during the entire process of chondrogenic differentiation as indicated in (A). The distribution of proteoglycan aggrecan (ACAN, red) is revealed with immunofluorescence; F-actin (green) and nuclei (blue) are counterstained with phalloidin and DAPI, respectively. The immuno-positive signal of ACAN (arrows) is weak and restricted within the nucleus in the control (CON) group (B,H) and is strong and located in the cytoplasm and nucleus in both the DPA group (C,I) and UDCA group (D,J). F-actin is rearranged during the chondrogenic differentiation; i.e., it displays a sharp image after phalloidin staining in the CON group (E) and fades in both the DPA (F) and UDCA (G) groups. (K,L,M) show the merge images. The scale bar represents 50 μm. The mRNA expression levels of the SRY-related high mobility group-box gene 9 (SOX9, (N)), ACAN (O), and type II collagen (COL2A1, (P)) in the CON, DPA, and UDCA groups are quantified. The data are presented as mean ± SEM (n = 3). ns indicates no significance (p > 0.05); * p < 0.05, ** p < 0.01, *** p < 0.001.
Cells 11 02951 g004
Figure 5. The effects of DPA and UDCA on chondrocyte functionality. DPA or UDCA was added to the chondrocytes for five days before sampling (A). The distribution of ACAN (red); the distribution of F-actin (green) and nuclei (blue), counterstained with phalloidin and DAPI, respectively. The immuno-positive signal of ACAN (arrows) is relatively weak and located in the nucleus and cytoplasm in the CON group (B,H,K), while it becomes strong, moves to the cytoplasm, and exhibits external secretion after DPA (C,I,L) or UDCA (D,J,M) administration. (E,F,G) indicate the shape of chondrocyte. The scale bar represents 50 μm. The mRNA expression levels of the ACAN (N) and COL2A1 (O) in the CON, DPA, and UDCA groups are quantified. The data are presented as mean ± SEM (n = 3). ns indicates no significance (p > 0.05); * p < 0.05.
Cells 11 02951 g005
Table 1. Gene-specific primers for real-time PCR.
GenePrimer
SOX9F: TAAGCTAAAGGCAACTCGTACC
R: TAGAGAATATTCCTCACAGAGGACT
ACANF: TGAGCGGCAGCACTTTGAC
R: TGAGTACAGGAGGCTTGAGG
COL2A1F: TCCAGATGACCTTCCTACGC
R: GGTATGTTTCGTGCAGCCAT
β-actinF: CCCTGGAGAAGAGCTACGAG
R: CGTACAGGTCTTTGCGGATG
Table 2. The list of DEMs identified in the NOR and REG groups.
CategoryMetabolitem/zaRT b (min)Error c (ppm)VIP dp-Value eFC fTrendFormula
Lipids and lipid-like molecules (47)(7Z,10Z,13Z,16Z)-docosatetraenoate333.278313.8609−2.09382.08250.02472.0327upC22H36O2
Arachidonic acid305.247213.0585−1.16535.49880.00641.8881upC20H32O2
Fludrocortisone acetate405.20811.58282.21021.11840.02803.0242upC23H31FO6
L-Palmitoylcarnitine400.341910.9240−0.64762.54450.00512.4512upC23H45NO4
LysoPC(18:1(11Z))522.354511.1461−1.78062.83240.00221.6622upC26H52NO7P
LysoPC(20:4(8Z,11Z,14Z,17Z))544.338610.7015−2.19334.11570.00282.7755upC28H50NO7P
LysoPC(22:5(7Z,10Z,13Z,16Z,19Z))570.354310.8646−1.88961.13380.00395.7136upC30H52NO7P
Prostaglandin E2351.21738.2029−1.50901.60110.04416.5508upC20H32O5
SM(d18:1/24:1(15Z))813.682913.1903−1.81799.45520.04859.0986upC47H93N2O6P
Sphingosine282.278410.4050−2.42571.47410.00281.8594upC18H37NO2
DPA331.263013.2346−0.44861.25450.03495.5002upC22H34O2
Oleamide304.260713.1326−1.44132.32220.02571.6991upC18H35NO
Ursodeoxycholic acid391.285710.70320.84841.01120.047212.4921upC24H40O4
PI(O-18:0/0:0)604.383314.9395−1.79303.24410.00000.6783downC34H50O8
LysoPE(0:0/20:4(8Z,11Z,14Z,17Z))502.291810.6718−2.07587.39320.00041.7392upC25H44NO7P
6-[3]-ladderane-1-hexanol280.263512.3763−1.93486.32520.02511.7063upC18H30O
PS(14:0/24:1(15Z))840.572811.47330.38631.63860.019614.4043upC44H84NO10P
LysoPE(22:4(7Z,10Z,13Z,16Z)/0:0)530.322911.2206−2.34364.24320.00101.7410upC27H48NO7P
PS(14:1(9Z)/24:0)840.573412.82251.06203.38340.011453.3843upC44H84NO10P
Linoelaidic Acid263.236513.2051−1.65933.38250.03541.6614upC18H32O2
Pelargonidin 3-(6″-p-coumarylglucoside)-5-(6‴-acetylglucoside)763.18870.93170.96571.78220.04170.4288downC38H38O18
PC(O-16:0/0:0)482.359111.3248−2.85912.16090.00082.6328upC24H52NO6P
LysoPC(18:2(9Z,12Z))520.339510.6718−0.43492.15580.00492.6192upC26H50NO7P
LysoPE(0:0/18:2(9Z,12Z))476.277810.6394−1.00771.34990.00313.4070upC23H44NO7P
LysoPE(22:5(7Z,10Z,13Z,16Z,19Z)/0:0)528.307310.8350−2.18962.52620.00154.1787upC27H46NO7P
1-O-(2R-hydroxy-hexadecyl)-sn-glycerol355.281512.7332−2.73142.41890.01700.8881downC19H40O4
2,3,4,5,2′,3′,4′,6′-Octamethoxychalcone895.34200.71662.90421.63320.01890.7754downC23H28O9
15-hydroxy-tetracosa-6,9,12,16,18-pentaenoic acid357.278610.7015−0.43611.54970.01684.0203upC24H38O3
Xestoaminol C230.24739.4959−2.50761.95900.00781.4550upC14H31NO
LysoPE(18:2(9Z,12Z)/0:0)478.291910.6421−1.86741.85500.00052.6353upC23H44NO7P
1,2-(8R,9R-epoxy-17E-octadecen-4,6-diynoyl)-3-(hexadecanoyl)sn-glycerol839.582011.9032−0.08441.44860.01013.2667upC54H80O8
1-(11Z,14Z-eicosadienoyl)-glycero-3-phosphate507.273011.59260.27041.26190.00144.1891upC23H43O7P
Stearoylcarnitine428.372411.4139−2.45691.55370.00454.1705upC25H49NO4
1-O-(2R-hydroxy-tetradecyl)-sn-glycerol327.249911.9180−3.88321.14130.00500.8497downC17H36O4
LysoPE(0:0/22:5(7Z,10Z,13Z,16Z,19Z))528.307311.0426−2.29491.38340.00592.6454upC27H46NO7P
1-(2-methoxy-eicosanyl)-sn-glycero-3-phosphoethanolamine508.375111.5454−2.01991.58250.00222.4697upC26H56NO7P
PC(0:0/18:1(9Z))566.347111.14111.53041.56530.02582.0328upC26H52NO7P
N-(3-oxo-butanoyl)-homoserine lactone186.07530.9084−4.02541.19410.00651.7216upC8H11NO4
PS(17:0/0:0)512.297311.6489−1.91141.03340.02360.2002downC23H46NO9P
Oleoylcarnitine426.356911.0426−2.14691.19550.04171.4961upC25H47NO4
Linoleamide302.244812.3763−2.28461.01710.03681.6485upC18H33NO
1-Arachidonoylglycerophosphoinositol603.291510.9093−2.22921.11050.00373.4729upC29H49O12P
Dodecanoylcarnitine344.27909.7305−1.62661.32340.03240.2012downC19H37NO4
1-(2-methoxy-13-methyl-tetradecanyl)-sn-glycero-3-phosphoserine522.281410.79052.30161.15830.00501.7855upC22H46NO9P
Europinidin330.07424.4330−1.12941.12750.01431.8673upC16H13O5+
LysoPC(P-16:0)480.343211.3099−3.51571.51740.02341.8926upC24H50NO6P
(E)-2-Penten-1-ol104.10670.7885−3.04432.92460.00971.3086upC5H10O
Organic oxygen compounds (16)D-Myoinositol 4-phosphate259.02200.7671−1.64332.68070.01470.1456downC6H13O9P
N-Acetylgalactosamine244.07900.8485−0.54071.05940.02361.7493upC8H15NO6
D-glycero-L-galacto-Octulose279.04700.7739−2.72751.21660.03850.6264downC8H16O8
Pelargonidin272.06734.4259−2.24202.81950.00580.4624downC15H11O5+
Malvidin332.08884.45431.61293.53050.00992.1895upC17H15O7+
Cellotetraose684.25450.9383−1.70433.28220.03750.4180downC24H42O21
N-Acetylgalactosaminyl lactose546.20170.9232−2.08682.21530.00580.4044downC20H35NO16
Isopropyl β-D-ThiogalactoPyranoside221.08372.0908−1.92124.94970.00330.8273downC9H18O5S
3,5-dihydroxy-4-(sulfooxy)benzoic acid250.98480.8485−3.16601.60670.00081.7730upC7H6O8S
1,2,3,4-Tetramethoxy-5-(2-propenyl)benzene261.10958.1917−0.76362.32290.01750.8684downC13H18O4
Vicianose295.10242.03650.16201.61660.02890.8576downC11H20O10
2-Deoxy-D-ribose 1,5-bisphosphate292.98368.19021.05831.35990.00820.7965downC5H12O10P2
Lacto-N-triaose590.19270.9317−2.59471.06860.03090.3734downC20H35NO16
2-(5,8-Tetradecadienyl)cyclobutanone245.225813.2051−2.35191.14870.03681.7212upC18H30O
4-Acetylzearalenone361.165813.05853.54091.11570.01641.8800upC20H24O6
Myrigalone H304.154411.48830.25251.09700.04361.7111upC17H18O4
Organic acids and derivatives (12)L-Arginine175.11810.7447−4.95091.10770.02321.4089upC6H14N4O2
L-Phenylalanine166.08563.5249−4.17852.19990.01401.7636upC9H11NO2
L-Tryptophan203.08244.3576−1.13001.16250.00661.8097upC11H12N2O2
L-Tyrosine180.06652.2998−0.84081.99410.00651.7151upC9H11NO3
7,8-diaminononanoic acid171.14846.5341−4.36331.82740.01980.7210downC9H20N2O2
Dopaxanthin779.20820.93173.67791.02940.04640.4276downC18H18N2O8
6-(5-carboxy-2-hydroxy-3-methoxyphenoxy)-3,4,5-trihydroxyoxane-2-carboxylic acid361.07790.93833.89611.33730.03740.5079downC14H16O11
S-Glutathionyl-L-cysteine427.09420.9232−2.28581.78510.03904.6303upC13H22N4O8S2
Cysteineglutathione disulfide425.07980.9189−2.00961.75240.03694.9326upC13H22N4O8S2
Propanoyl phosphate306.99789.7584−3.77131.30130.01540.7428downC3H7O5P
2-Hydroxycinnamic acid182.08042.3357−4.73352.61290.01841.9098upC9H8O3
Hydroxymethylphosphonate110.98480.8047−3.75691.11120.03111.5147upCH5O4P
Heterocyclic Compounds (15)Uracil113.03421.2618−3.27711.42530.02801.7119upC4H4N2O2
Deethylatrazine188.07014.3813−0.59802.67720.00622.5574upC6H10ClN5
dirithromycin563.550313.1326−4.29183.06700.04972.1749upC39H72
2′-O-Methyladenosine282.11853.3656−4.29751.15410.02330.3554downC11H15N5O4
FAPy-adenine171.098514.2547−2.718110.00910.00450.7720downC5H7N5O
Pectachol460.268710.2578−1.38923.06080.02370.8238downC26H34O6
1-(1,2,3,4,5-Pentahydroxypent-1-yl)-1,2,3,4-tetrahydro-beta-carboline-3-carboxylate367.14913.3656−2.42331.68820.03140.4717downC17H22N2O7
Nocodazole300.04490.80470.19091.73450.01000.4874downC14H11N3O3S
Dipyridamole527.304312.06521.57291.22100.03880.8693downC20H39N5O10
6-Methyltetrahydropterin204.08610.90842.76811.24880.00791.8114upC7H11N5O
Gravacridonetriol396.08550.04253.14191.50970.02480.8872downC19H19NO6
Nicorandil256.05780.90621.33081.09360.00682.2259upC8H9N3O4
Ethosuximide M5200.05622.2873−1.84221.14030.01681.9016upC7H9NO3
Dihydrofolic acid424.13552.2873−4.49411.26210.00163.0187upC19H21N7O6
AFN911550.23220.9232−1.03331.00430.03100.5018downC29H33N7O2
Organosulfur compounds (2)Ethyl isopropyl disulfide137.04561.42931.98795.59470.00271.5142upC5H12S2
Ethyl propyl disulfide135.03121.43923.38062.21320.00181.3007upC5H12S2
Hydrocarbons and derivatives (4)2-(Fluoromethoxy)-1,1,3,3,3-pentafluoro-1-propene (Compound A)358.99438.0025−1.10902.54420.01770.7840downC4H2F6O
(+/−)-N,N-Dimethyl menthyl succinamide186.220914.2250−4.38692.23730.03270.8893downC12H24
2-Hexylidenecyclopentanone331.264213.8606−0.05441.26980.03312.6671upC11H18O
Aluminium dodecanoate663.454414.98400.42741.16380.00421.1576upC36H69AlO6
a mass to charge ratio of the features; b retention time of the features; c mass error is obtained by using the experimental mass minus the theoretical mass; d variable importance in projection; e p-value is obtained from the two-tailed Student’s t-test; and f fold change.
Table 3. The list of the potential pathways involved in cartilage regeneration.
NO.Annotationp-Value aMatch Status bRich Factor cMatching IDsDEMs
1Amoebiasis0.00004/130.3077C00062 C00219 C00584 C01074L-Arginine, Arachidonic acid, Prostaglandin E2, N-Acetylgalactosamine
2Necroptosis0.00003/90.3333C00219 C00319 C00550Arachidonic acid, Sphingosine, SM(d18:1/24:1(15Z))
3Aminoacyl-tRNA biosynthesis0.00014/520.0769C00062 C00078 C00079 C00082L-Arginine, L-Tryptophan, L-Phenylalanine, L-Tyrosine
4Leishmaniasis0.00042/60.3333C00219 C00584Arachidonic acid, Prostaglandin E2
5Phenylalanine, tyrosine, and tryptophan biosynthesis0.00063/340.0882C00078 C00079 C00082L-Tryptophan, L-Phenylalanine, L-Tyrosine
6African trypanosomiasis0.00072/80.2500C00078 C00584L-Tryptophan, Prostaglandin E2
7Oxytocin signaling pathway0.00172/120.1667C00219 C00584Arachidonic acid, Prostaglandin E2
8Regulation of lipolysis in adipocytes0.00232/140.1429C00219 C00584Arachidonic acid, Prostaglandin E2
9Sphingolipid signaling pathway0.00262/150.1333C00319 C00550Sphingosine, SM(d18:1/24:1(15Z))
10Serotonergic synapse0.00342/170.1176C00078 C00219L-Tryptophan, Arachidonic acid
11Phenylalanine metabolism0.00343/600.0500C00079 C00082 C01772L-Phenylalanine, L-Tyrosine, 2-Hydroxycinnamic acid
12Sphingolipid metabolism0.00722/250.0800C00319 C00550Sphingosine, SM(d18:1/24:1(15Z))
13Inflammatory mediator regulation of TRP channels0.00902/280.0714C00219 C00584Arachidonic acid, Prostaglandin E2
14Protein digestion and absorption0.00972/290.0690C00062 C00079L-Arginine, L-Phenylalanine
15Biosynthesis of unsaturated fatty acids0.04942/690.0290C00219 C16527Arachidonic acid
The pathways listed in Table 3 have hits ≥ 2 and p-value < 0.05. a p-value is obtained by 1 i = 0 m 1 M i N M n i N n , where N represents the number of the total metabolites, n represents the number of the DEMs, M represents the number of the total metabolites in a certain pathway, and m represents the number of DEMs in a certain pathway; b match status is indicated as m M ; c rich factor is identified as m M .
Publisher’s Note: MDPI stays neutral with regard to jurisdictional claims in published maps and institutional affiliations.

