
Single-Cell Gene Expression Analysis Revealed Immune Cell Signatures of Delta COVID-19
 , , , ,
  , , , and
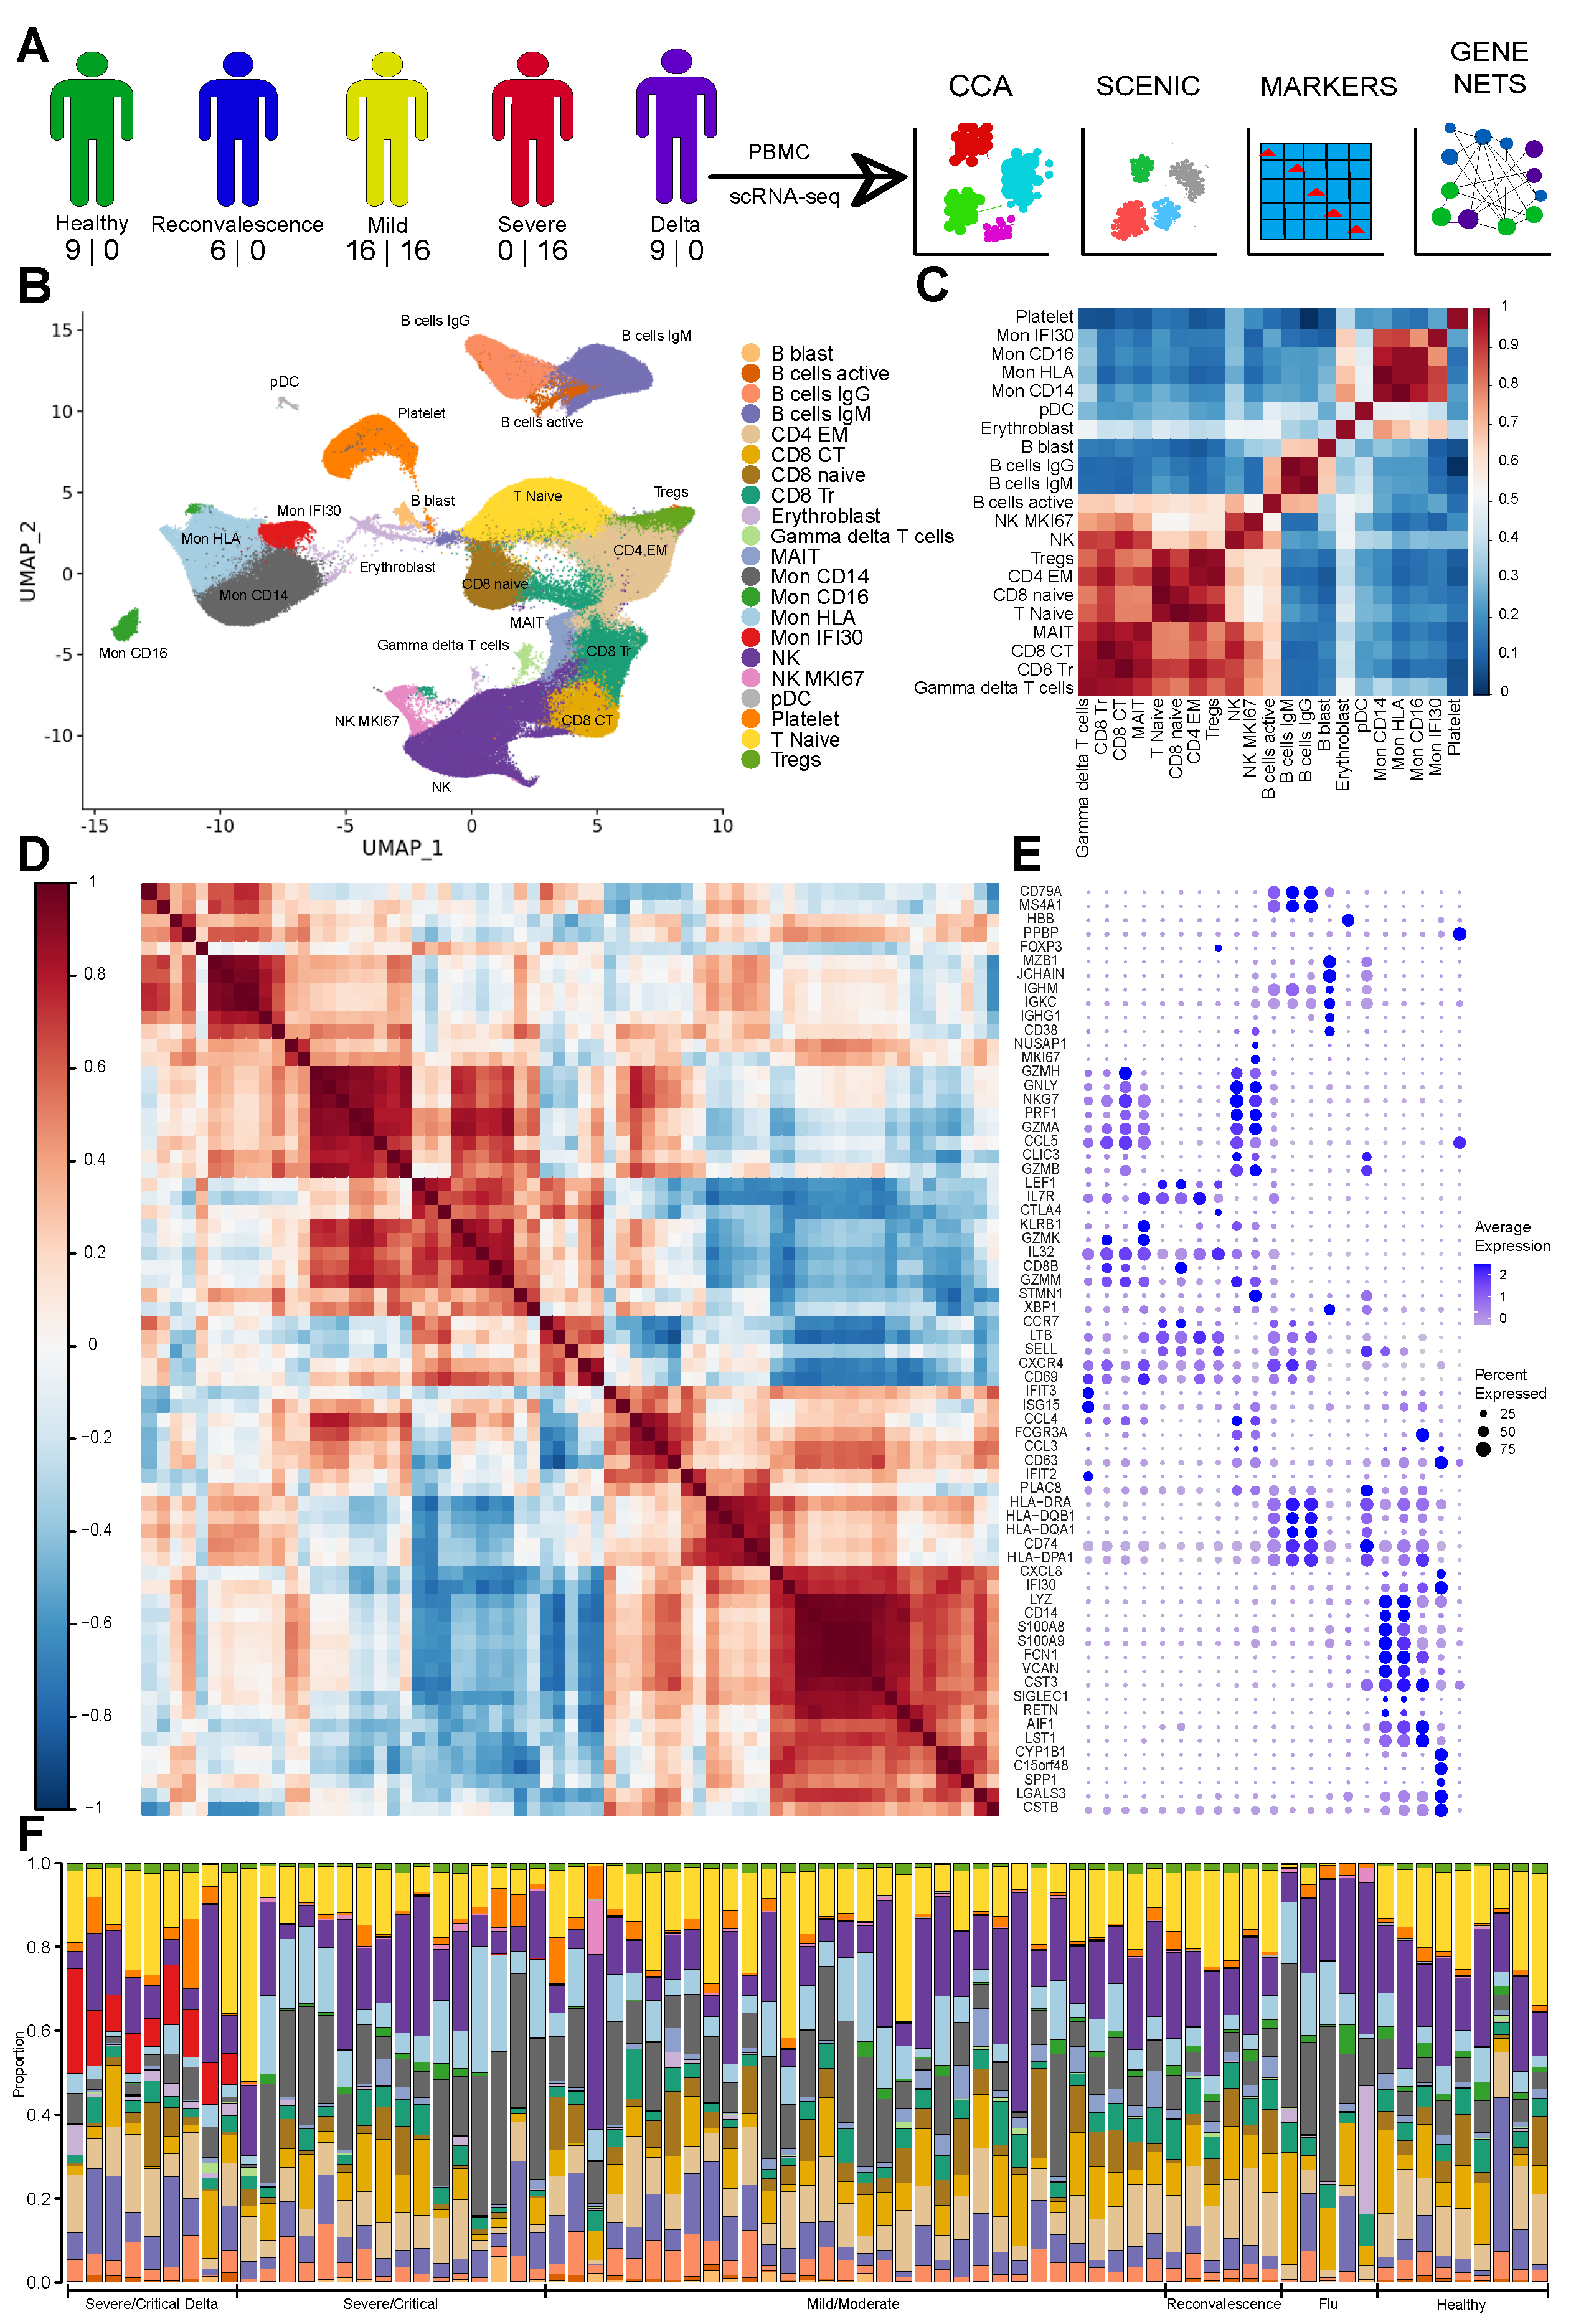
Abstract
1. Introduction
2. Materials and Methods
2.1. Sample Collection
2.2. Single-Cell Genes (RNA-Seq)
2.3. Generating Single-Nucleus Gene Expression Matrices, QC, and Filtering
2.4. Dataset Integration
2.5. Cell-Type Identification
2.6. Module Scores for Gene Signatures
2.7. Differential Gene Expression
2.8. GO and KEGG Pathways Enrichment (GSEA)
2.9. Transcription Factor Regulatory Network Analysis
2.10. Cell–Cell Communication Analysis
2.11. Machine Learning Classifier
2.12. SARS-CoV-2 Genotyping
3. Results
3.1. The Immune Landscape of Delta Variant SARS-CoV-2 Infection
3.2. Severe COVID-19 Caused by Delta Variant Associated with Shifts in Immune Cell Composition
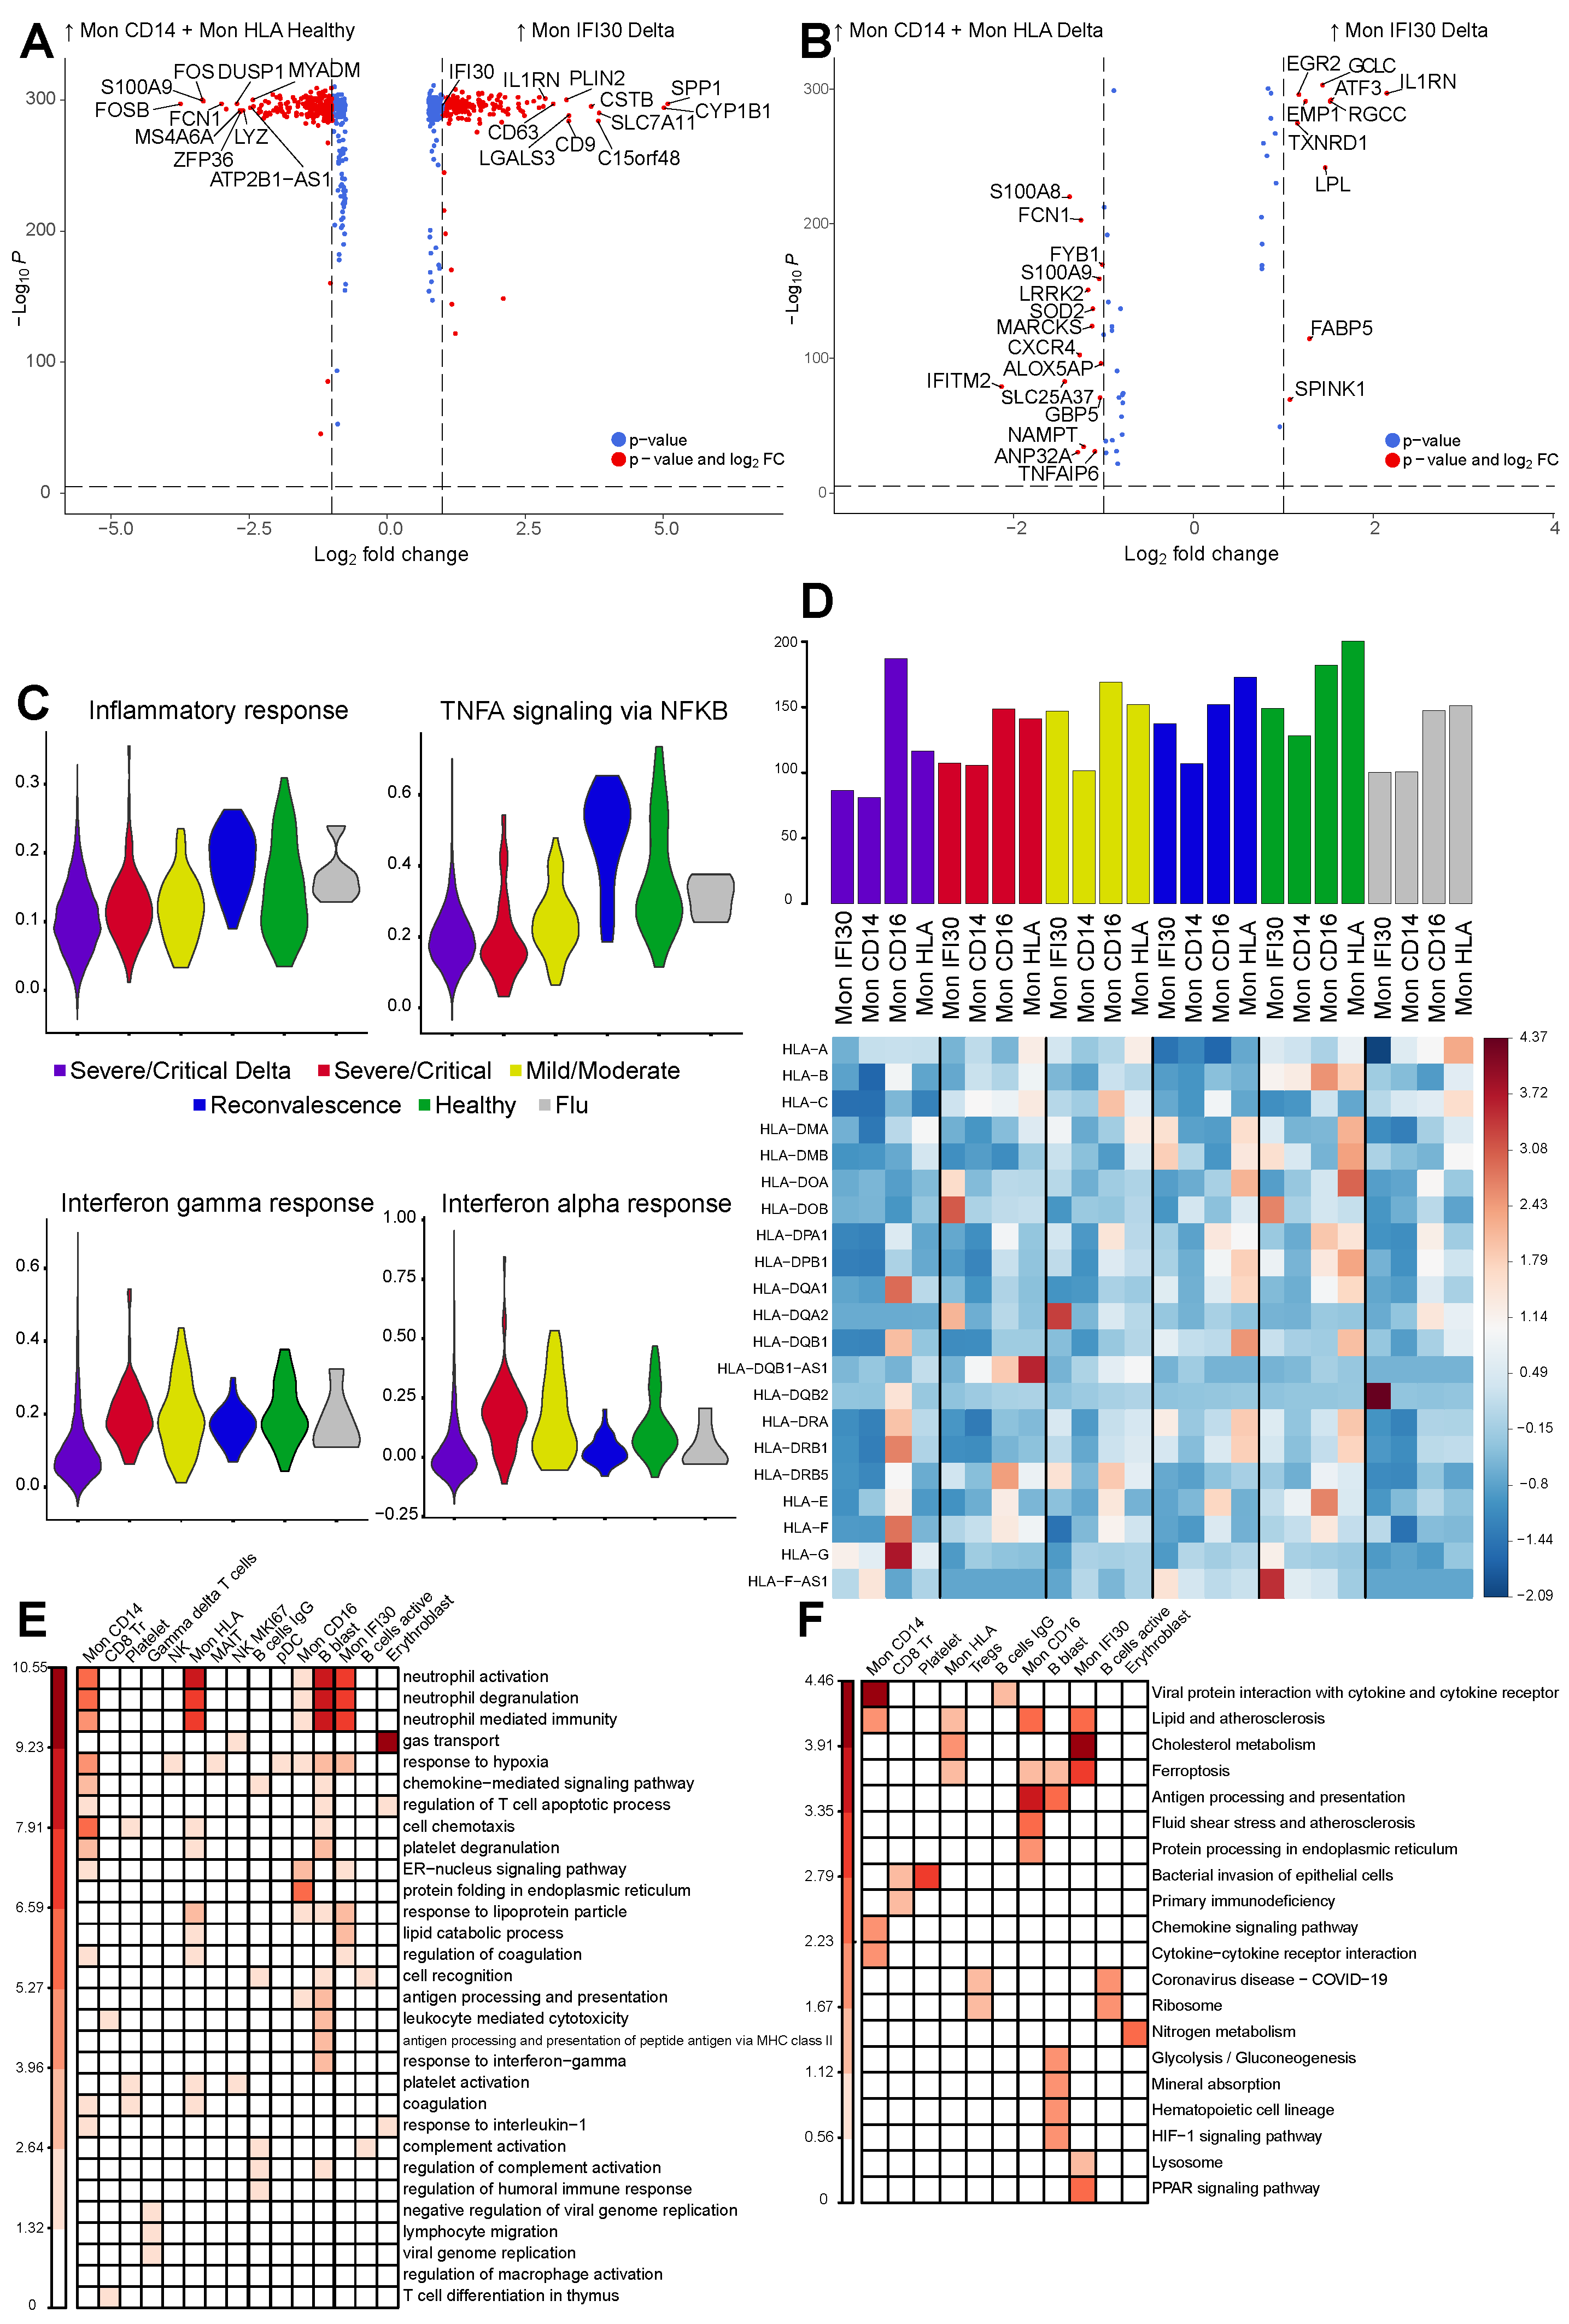
3.3. Gene Expression Changes in the Severe COVID-19 Caused by Delta Variant
3.4. Gene Regulatory Network Governs Specific Monocyte States in Delta COVID-19
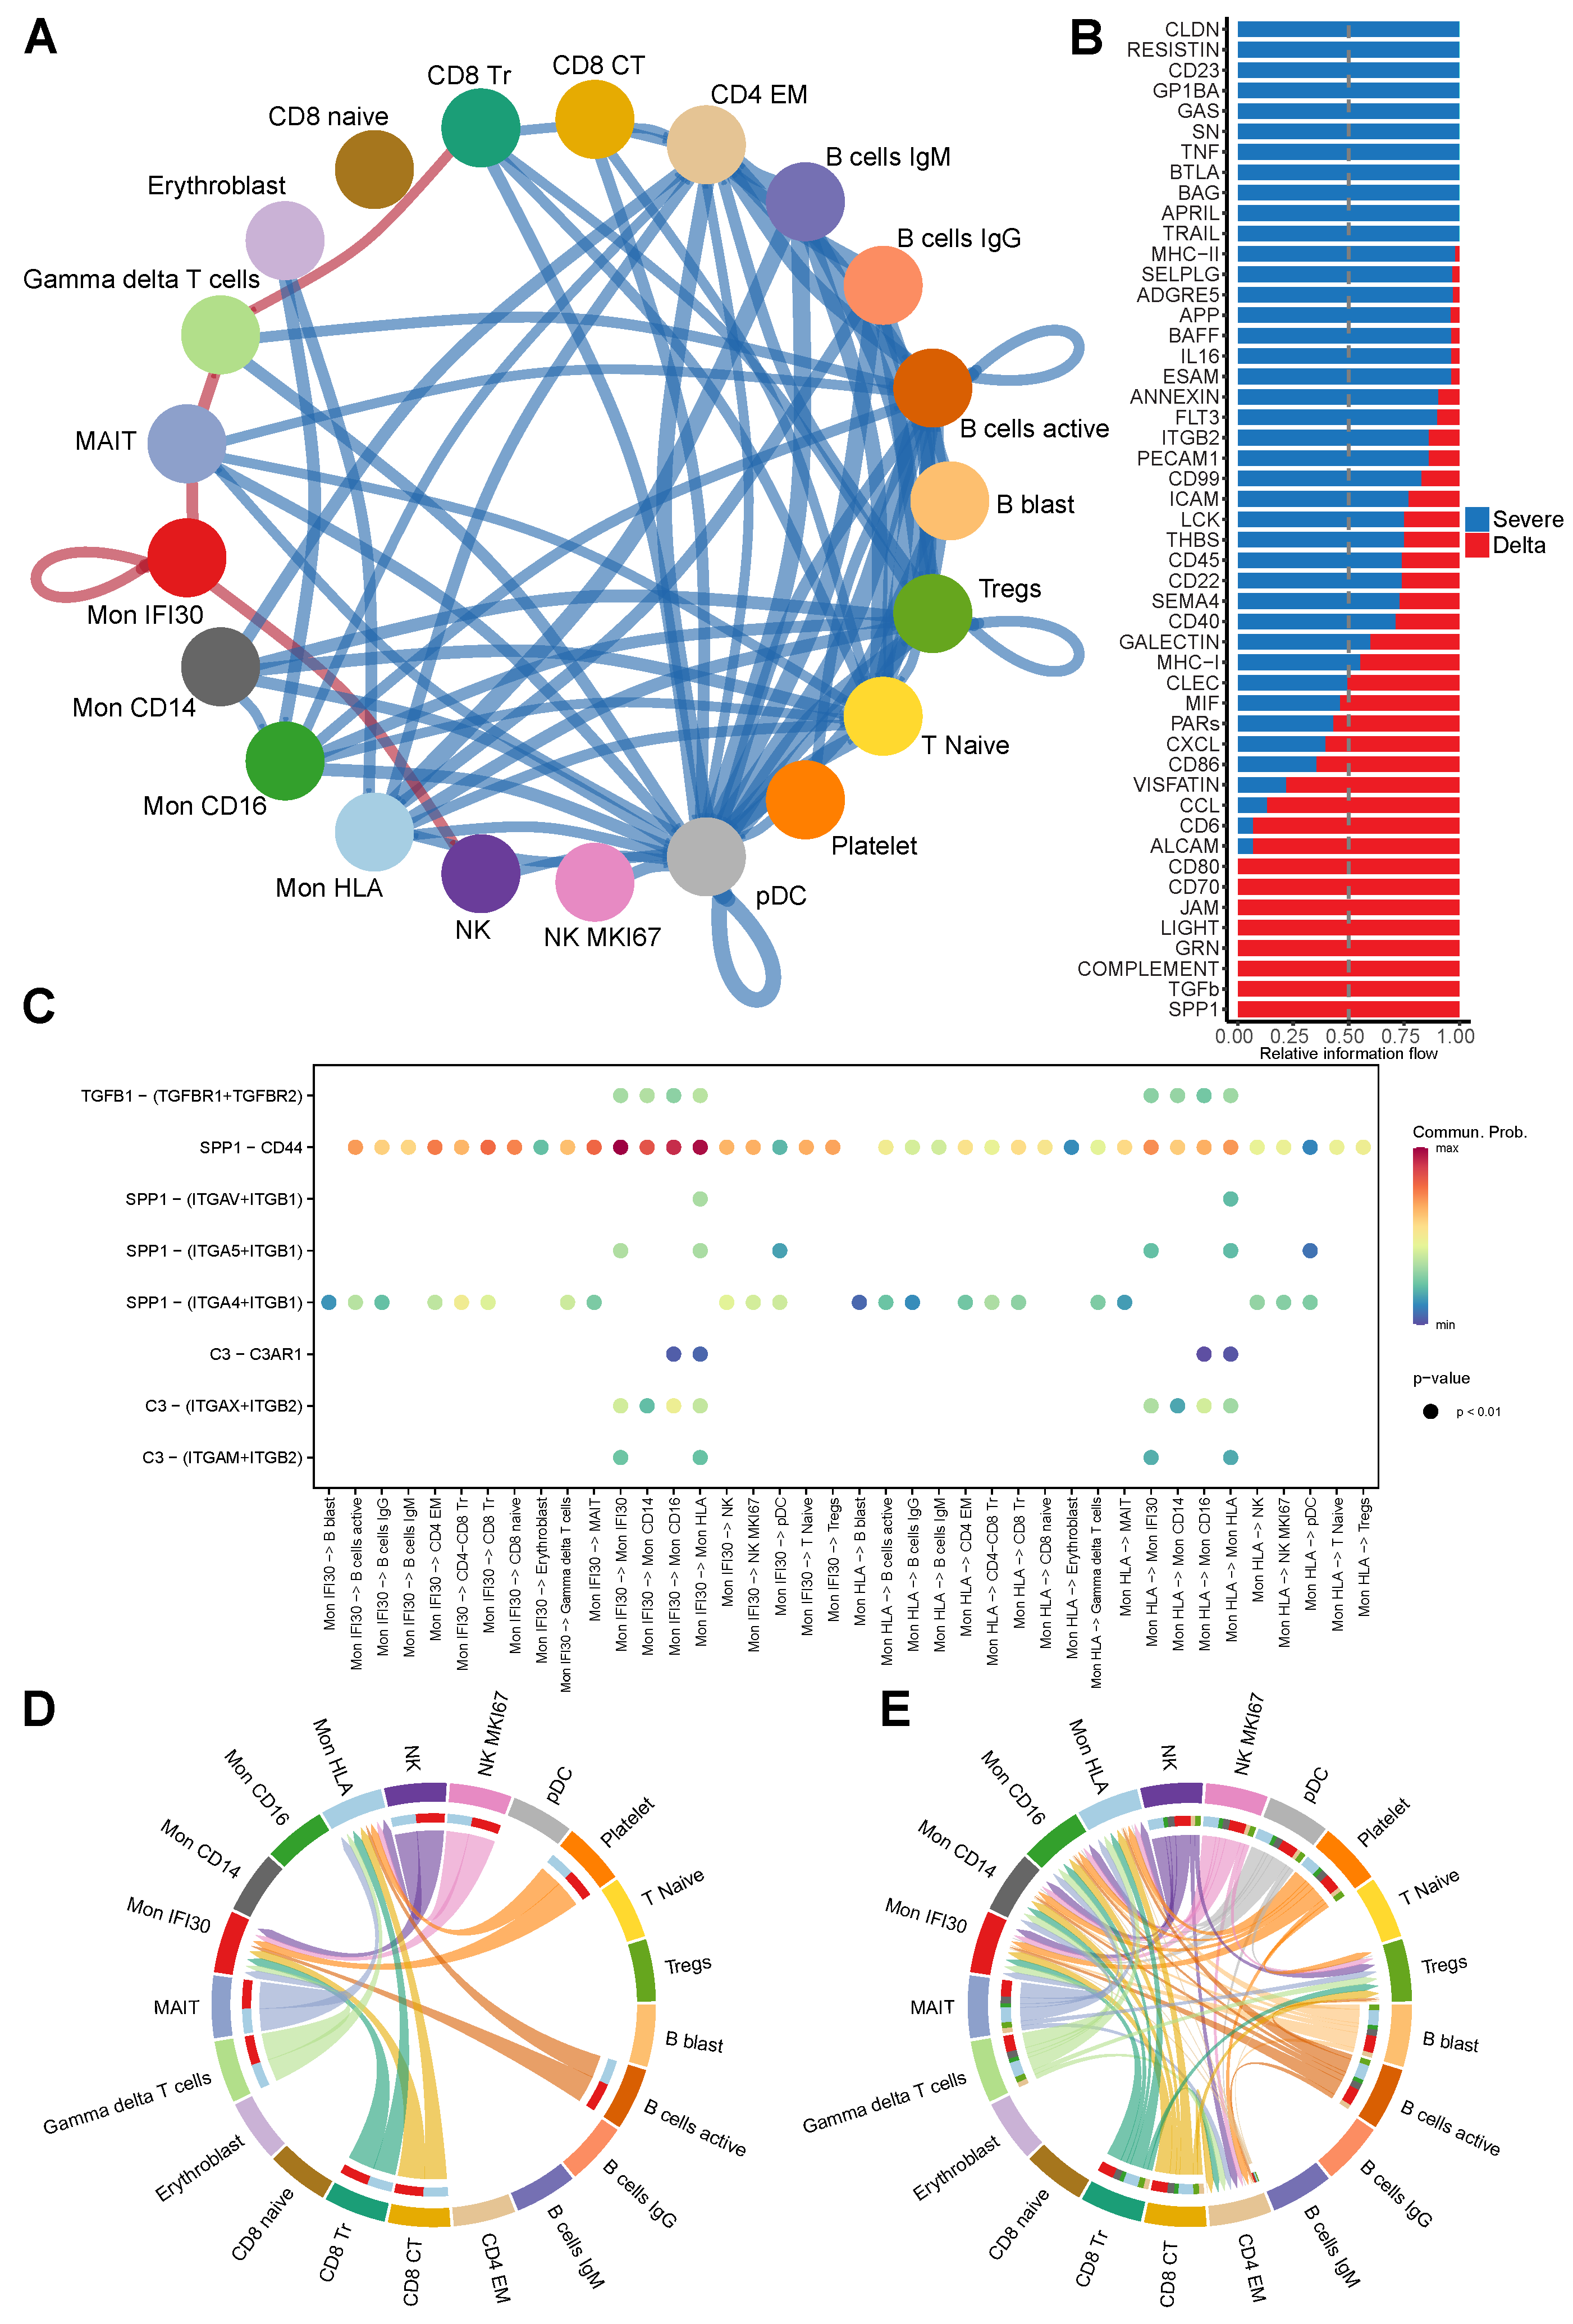
3.5. Ligand-Receptor Cell–Cell Communications in Severe Delta COVID-19
4. Discussion
Supplementary Materials
Author Contributions
Funding
Institutional Review Board Statement
Informed Consent Statement
Data Availability Statement
Conflicts of Interest
References
- Bernardes, J.P.; Mishra, N.; Tran, F.; Bahmer, T.; Best, L.; Blase, J.I.; Bordoni, D.; Franzenburg, J.; Geisen, U.; Josephs-Spaulding, J.; et al. Longitudinal Multi-omics Analyses Identify Responses of Megakaryocytes, Erythroid Cells, and Plasmablasts as Hallmarks of Severe COVID-19. Immunity 2020, 53, 1296–1314.e9. [Google Scholar] [CrossRef] [PubMed]
- Huang, Z.; Chen, B.; Liu, X.; Li, H.; Xie, L.; Gao, Y.; Duan, R.; Li, Z.; Zhang, J.; Zheng, Y.; et al. Effects of sex and aging on the immune cell landscape as assessed by single-cell transcriptomic analysis. Proc. Natl. Acad. Sci. USA 2021, 118, e2023216118. [Google Scholar] [CrossRef] [PubMed]
- Mulder, K.; Patel, A.A.; Kong, W.T.; Piot, C.; Halitzki, E.; Dunsmore, G.; Khalilnezhad, S.; Irac, S.E.; Dubuisson, A.; Chevrier, M.; et al. Cross-tissue single-cell landscape of human monocytes and macrophages in health and disease. Immunity 2021, 54, 1883–1900.e5. [Google Scholar] [CrossRef] [PubMed]
- Stephenson, E.; Reynolds, G.; Botting, R.A.; Calero-Nieto, F.J.; Morgan, M.D.; Tuong, Z.K.; Bach, K.; Sungnak, W.; Worlock, K.B.; Yoshida, M.; et al. Single-cell multi-omics analysis of the immune response in COVID-19. Nat. Med. 2021, 27, 904–916. [Google Scholar] [CrossRef]
- Szabo, P.A.; Dogra, P.; Gray, J.I.; Wells, S.B.; Connors, T.J.; Weisberg, S.P.; Krupska, I.; Matsumoto, R.; Poon, M.M.L.; Idzikowski, E.; et al. Longitudinal profiling of respiratory and systemic immune responses reveals myeloid cell-driven lung inflammation in severe COVID-19. Immunity 2021, 54, 797–814.e6. [Google Scholar] [CrossRef]
- Li, S.; Wu, B.; Ling, Y.; Guo, M.; Qin, B.; Ren, X.; Wang, C.; Yang, H.; Chen, L.; Liao, Y.; et al. Epigenetic Landscapes of Single-Cell Chromatin Accessibility and Transcriptomic Immune Profiles of T Cells in COVID-19 Patients. Front. Immunol. 2021, 12, 625881. [Google Scholar] [CrossRef]
- Ren, X.; Wen, W.; Fan, X.; Hou, W.; Su, B.; Cai, P.; Li, J.; Liu, Y.; Tang, F.; Zhang, F.; et al. COVID-19 immune features revealed by a large-scale single-cell transcriptome atlas. Cell 2021, 184, 1895–1913.e19. [Google Scholar] [CrossRef]
- Zhou, R.; To, K.K.W.; Wong, Y.C.; Liu, L.; Zhou, B.; Li, X.; Huang, H.; Mo, Y.; Luk, T.Y.; Lau, T.T.K.; et al. Acute SARS-CoV-2 Infection Impairs Dendritic Cell and T Cell Responses. Immunity 2020, 53, 864–877.e5. [Google Scholar] [CrossRef]
- Van der Sluis, R.M.; Holm, C.K.; Jakobsen, M.R. Plasmacytoid dendritic cells during COVID-19: Ally or adversary? Cell Rep. 2022, 40, 111148. [Google Scholar] [CrossRef]
- Hadjadj, J.; Yatim, N.; Barnabei, L.; Corneau, A.; Boussier, J.; Smith, N.; Péré, H.; Charbit, B.; Bondet, V.; Chenevier-Gobeaux, C.; et al. Impaired type I interferon activity and inflammatory responses in severe COVID-19 patients. Science 2020, 369, 718–724. [Google Scholar] [CrossRef]
- Schulte-Schrepping, J.; Reusch, N.; Paclik, D.; Baßler, K.; Schlickeiser, S.; Zhang, B.; Krämer, B.; Krammer, T.; Brumhard, S.; Bonaguro, L.; et al. Severe COVID-19 Is Marked by a Dysregulated Myeloid Cell Compartment. Cell 2020, 182, 1419–1440.e23. [Google Scholar] [CrossRef] [PubMed]
- Dan, J.M.; Mateus, J.; Kato, Y.; Hastie, K.M.; Yu, E.D.; Faliti, C.E.; Grifoni, A.; Ramirez, S.I.; Haupt, S.; Frazier, A.; et al. Immunological memory to SARS-CoV-2 assessed for up to 8 months after infection. Science 2021, 371, eabf4063. [Google Scholar] [CrossRef] [PubMed]
- Hoehn, K.B.; Ramanathan, P.; Unterman, A.; Sumida, T.S.; Asashima, H.; Hafler, D.A.; Kaminski, N.; Dela Cruz, C.S.; Sealfon, S.C.; Bukreyev, A.; et al. Cutting Edge: Distinct B Cell Repertoires Characterize Patients with Mild and Severe COVID-19. J. Immunol. 2021, 206, 2785–2790. [Google Scholar] [CrossRef]
- Sosa-Hernández, V.A.; Torres-Ruíz, J.; Cervantes-Díaz, R.; Romero-Ramírez, S.; Páez-Franco, J.C.; Meza-Sánchez, D.E.; Juárez-Vega, G.; Pérez-Fragoso, A.; Ortiz-Navarrete, V.; Ponce-de León, A.; et al. B Cell Subsets as Severity-Associated Signatures in COVID-19 Patients. Front. Immunol. 2020, 11, 611004. [Google Scholar] [CrossRef] [PubMed]
- Vanderbeke, L.; Van Mol, P.; Van Herck, Y.; De Smet, F.; Humblet-Baron, S.; Martinod, K.; Antoranz, A.; Arijs, I.; Boeckx, B.; Bosisio, F.M.; et al. Monocyte-driven atypical cytokine storm and aberrant neutrophil activation as key mediators of COVID-19 disease severity. Nat. Commun. 2021, 12, 4117. [Google Scholar] [CrossRef] [PubMed]
- Yu, C.; Littleton, S.; Giroux, N.S.; Mathew, R.; Ding, S.; Kalnitsky, J.; Yang, Y.; Petzold, E.; Chung, H.A.; Rivera, G.O.; et al. Mucosal-associated invariant T cell responses differ by sex in COVID-19. Med 2021, 2, 755–772.e5. [Google Scholar] [CrossRef] [PubMed]
- Santoso, C.S.; Li, Z.; Rottenberg, J.T.; Liu, X.; Shen, V.X.; Fuxman Bass, J.I. Therapeutic Targeting of Transcription Factors to Control the Cytokine Release Syndrome in COVID-19. Front. Pharmacol. 2021, 12, 673485. [Google Scholar] [CrossRef]
- Vega, M.A.; Simón-Fuentes, M.; González de la Aleja, A.; Nieto, C.; Colmenares, M.; Herrero, C.; Domínguez-Soto, Á.; Corbí, Á.L. MAFB and MAF Transcription Factors as Macrophage Checkpoints for COVID-19 Severity. Front. Immunol. 2020, 11, 603507. [Google Scholar] [CrossRef]
- Harvey, W.T.; Carabelli, A.M.; Jackson, B.; Gupta, R.K.; Thomson, E.C.; Harrison, E.M.; Ludden, C.; Reeve, R.; Rambaut, A.; COVID-19 Genomics UK (COG-UK) Consortium; et al. SARS-CoV-2 variants, spike mutations and immune escape. Nat. Rev. Microbiol. 2021, 19, 409–424. [Google Scholar] [CrossRef]
- Korber, B.; Fischer, W.M.; Gnanakaran, S.; Yoon, H.; Theiler, J.; Abfalterer, W.; Hengartner, N.; Giorgi, E.E.; Bhattacharya, T.; Foley, B.; et al. Tracking Changes in SARS-CoV-2 Spike: Evidence that D614G Increases Infectivity of the COVID-19 Virus. Cell 2020, 182, 812–827.e19. [Google Scholar] [CrossRef]
- Meredith, L.W.; Hamilton, W.L.; Warne, B.; Houldcroft, C.J.; Hosmillo, M.; Jahun, A.S.; Curran, M.D.; Parmar, S.; Caller, L.G.; Caddy, S.L.; et al. Rapid implementation of SARS-CoV-2 sequencing to investigate cases of health-care associated COVID-19: A prospective genomic surveillance study. Lancet Infect. Dis. 2020, 20, 1263–1272. [Google Scholar] [CrossRef]
- Hao, Y.; Hao, S.; Andersen-Nissen, E.; Mauck, W.M., 3rd; Zheng, S.; Butler, A.; Lee, M.J.; Wilk, A.J.; Darby, C.; Zager, M.; et al. Integrated analysis of multimodal single-cell data. Cell 2021, 184, 3573–3587.e29. [Google Scholar] [CrossRef] [PubMed]
- Korsunsky, I.; Millard, N.; Fan, J.; Slowikowski, K.; Zhang, F.; Wei, K.; Baglaenko, Y.; Brenner, M.; Loh, P.R.; Raychaudhuri, S. Fast, sensitive and accurate integration of single-cell data with Harmony. Nat. Methods 2019, 16, 1289–1296. [Google Scholar] [CrossRef] [PubMed]
- Yu, G.; Wang, L.G.; Han, Y.; He, Q.Y. clusterProfiler: An R package for comparing biological themes among gene clusters. OMICS 2012, 16, 284–287. [Google Scholar] [CrossRef] [PubMed]
- Aibar, S.; González-Blas, C.B.; Moerman, T.; Huynh-Thu, V.A.; Imrichova, H.; Hulselmans, G.; Rambow, F.; Marine, J.C.; Geurts, P.; Aerts, J.; et al. SCENIC: Single-cell regulatory network inference and clustering. Nat. Methods 2017, 14, 1083–1086. [Google Scholar] [CrossRef] [PubMed]
- Jin, S.; Guerrero-Juarez, C.F.; Zhang, L.; Chang, I.; Ramos, R.; Kuan, C.H.; Myung, P.; Plikus, M.V.; Nie, Q. Inference and analysis of cell-cell communication using CellChat. Nat. Commun. 2021, 12, 1088. [Google Scholar] [CrossRef] [PubMed]
- Chen, T.; Guestrin, C. XGBoost: A Scalable Tree Boosting System. In Proceedings of the 22nd ACM SIGKDD International Conference on Knowledge Discovery and Data Mining (KDD ’16), San Francisco, CA, USA, 13–17 August 2016; Association for Computing Machinery: New York, NY, USA, 2016; pp. 785–794. [Google Scholar]
- Liu, Y.; Just, A. SHAPforxgboost: SHAP Plots for ‘XGBoost’, R Package Version 0.1.0. 2020. Available online: https://cran.r-project.org/web/packages/SHAPforxgboost/readme/README.html (accessed on 4 September 2022).
- Truong Nguyen, P.T.; Plyusnin, I.; Sironen, T.; Vapalahti, O.; Kant, R.; Smura, T. HAVoC, a bioinformatic pipeline for reference-based consensus assembly and lineage assignment for SARS-CoV-2 sequences. BMC Bioinform. 2021, 22, 373. [Google Scholar] [CrossRef]
- Kang, J.B.; Nathan, A.; Weinand, K.; Zhang, F.; Millard, N.; Rumker, L.; Moody, D.B.; Korsunsky, I.; Raychaudhuri, S. Efficient and precise single-cell reference atlas mapping with Symphony. Nat. Commun. 2021, 12, 5890. [Google Scholar] [CrossRef]
- Wang, X.; Shen, X.; Chen, S.; Liu, H.; Hong, N.; Zhong, H.; Chen, X.; Jin, W. Reinvestigation of Classic T Cell Subsets and Identification of Novel Cell Subpopulations by Single-Cell RNA Sequencing. J. Immunol. 2022, 208, 396–406. [Google Scholar] [CrossRef]
- Li, H.; van der Leun, A.M.; Yofe, I.; Lubling, Y.; Gelbard-Solodkin, D.; van Akkooi, A.C.J.; van den Braber, M.; Rozeman, E.A.; Haanen, J.B.A.G.; Blank, C.U.; et al. Dysfunctional CD8 T Cells Form a Proliferative, Dynamically Regulated Compartment within Human Melanoma. Cell 2019, 176, 775–789.e18. [Google Scholar] [CrossRef]
- Krämer, B.; Knoll, R.; Bonaguro, L.; ToVinh, M.; Raabe, J.; Astaburuaga-García, R.; Schulte-Schrepping, J.; Kaiser, K.M.; Rieke, G.J.; Bischoff, J.; et al. Early IFN-α signatures and persistent dysfunction are distinguishing features of NK cells in severe COVID-19. Immunity 2021, 54, 2650–2669.e14. [Google Scholar] [CrossRef] [PubMed]
- Witkowski, M.; Tizian, C.; Ferreira-Gomes, M.; Niemeyer, D.; Jones, T.C.; Heinrich, F.; Frischbutter, S.; Angermair, S.; Hohnstein, T.; Mattiola, I.; et al. Untimely TGFβ responses in COVID-19 limit antiviral functions of NK cells. Nature 2021, 600, 295–301. [Google Scholar] [CrossRef] [PubMed]
- Ramesh, A.; Schubert, R.D.; Greenfield, A.L.; Dandekar, R.; Loudermilk, R.; Sabatino, J.J., Jr.; Koelzer, M.T.; Tran, E.B.; Koshal, K.; Kim, K.; et al. A pathogenic and clonally expanded B cell transcriptome in active multiple sclerosis. Proc. Natl. Acad. Sci. USA 2020, 117, 22932–22943. [Google Scholar] [CrossRef] [PubMed]
- Russo, R.C.; Garcia, C.C.; Teixeira, M.M.; Amaral, F.A. The CXCL8/IL-8 chemokine family and its receptors in inflammatory diseases. Expert Rev. Clin. Immunol. 2014, 10, 593–619. [Google Scholar] [CrossRef]
- de Oliveira, S.; Reyes-Aldasoro, C.C.; Candel, S.; Renshaw, S.A.; Mulero, V.; Calado, A. Cxcl8 (IL-8) mediates neutrophil recruitment and behavior in the zebrafish inflammatory response. J. Immunol. 2013, 190, 4349–4359. [Google Scholar] [CrossRef]
- Yang, Q.; Wen, Y.; Qi, F.; Gao, X.; Chen, W.; Xu, G.; Wei, C.; Wang, H.; Tang, X.; Lin, J.; et al. Suppressive Monocytes Impair MAIT Cells Response via IL-10 in Patients with Severe COVID-19. J. Immunol. 2021, 207, 1848–1856. [Google Scholar] [CrossRef]
- Smit, J.J.; Rudd, B.D.; Lukacs, N.W. Plasmacytoid dendritic cells inhibit pulmonary immunopathology and promote clearance of respiratory syncytial virus. J. Exp. Med. 2006, 203, 1153–1159. [Google Scholar] [CrossRef]
- Gurunathan, S.; Kang, M.H.; Kim, J.H. Diverse Effects of Exosomes on COVID-19: A Perspective of Progress From Transmission to Therapeutic Developments. Front. Immunol. 2021, 12, 716407. [Google Scholar] [CrossRef]
- Hassanpour, M.; Rezaie, J.; Nouri, M.; Panahi, Y. The role of extracellular vesicles in COVID-19 virus infection. Infect. Genet. Evol. 2020, 85, 104422. [Google Scholar] [CrossRef]
- Paim, A.A.O.; Lopes-Ribeiro, Á.; Daian E Silva, D.S.O.; Andrade, L.A.F.; Moraes, T.F.S.; Barbosa-Stancioli, E.F.; da Fonseca, F.G.; Coelho-Dos-Reis, J.G. Will a little change do you good? A putative role of polymorphisms in COVID-19. Immunol. Lett. 2021, 235, 9–14. [Google Scholar] [CrossRef]
- Rokni, M.; Sarhadi, M.; Heidari Nia, M.; Mohamed Khosroshahi, L.; Asghari, S.; Sargazi, S.; Mirinejad, S.; Saravani, R. Single nucleotide polymorphisms located in TNFA, IL1RN, IL6R, and IL6 genes are associated with COVID-19 risk and severity in an Iranian population. Cell Biol. Int. 2022, 46, 1109–1127. [Google Scholar] [CrossRef] [PubMed]
- Saichi, M.; Ladjemi, M.Z.; Korniotis, S.; Rousseau, C.; Ait Hamou, Z.; Massenet-Regad, L.; Amblard, E.; Noel, F.; Marie, Y.; Bouteiller, D.; et al. Single-cell RNA sequencing of blood antigen-presenting cells in severe COVID-19 reveals multi-process defects in antiviral immunity. Nat. Cell Biol. 2021, 23, 538–551. [Google Scholar] [CrossRef] [PubMed]
- Wang, S.; Yao, X.; Ma, S.; Ping, Y.; Fan, Y.; Sun, S.; He, Z.; Shi, Y.; Sun, L.; Xiao, S.; et al. A single-cell transcriptomic landscape of the lungs of patients with COVID-19. Nat. Cell Biol. 2021, 23, 1314–1328. [Google Scholar] [CrossRef] [PubMed]
- Wilk, A.J.; Rustagi, A.; Zhao, N.Q.; Roque, J.; Martínez-Colón, G.J.; McKechnie, J.L.; Ivison, G.T.; Ranganath, T.; Vergara, R.; Hollis, T.; et al. A single-cell atlas of the peripheral immune response in patients with severe COVID-19. Nat. Med. 2020, 26, 1070–1076. [Google Scholar] [CrossRef]
- Mudd, P.A.; Crawford, J.C.; Turner, J.S.; Souquette, A.; Reynolds, D.; Bender, D.; Bosanquet, J.P.; Anand, N.J.; Striker, D.A.; Martin, R.S.; et al. Distinct inflammatory profiles distinguish COVID-19 from influenza with limited contributions from cytokine storm. Sci. Adv. 2020, 6, eabe3024. [Google Scholar] [CrossRef]
- Qin, S.; Jiang, Y.; Wei, X.; Liu, X.; Guan, J.; Chen, Y.; Lu, H.; Qian, J.; Wang, Z.; Lin, X. Dynamic changes in monocytes subsets in COVID-19 patients. Hum. Immunol. 2021, 82, 170–176. [Google Scholar] [CrossRef]
- Povero, D.; Panera, N.; Eguchi, A.; Johnson, C.D.; Papouchado, B.G.; de Araujo Horcel, L.; Pinatel, E.M.; Alisi, A.; Nobili, V.; Feldstein, A.E. Lipid-induced hepatocyte-derived extracellular vesicles regulate hepatic stellate cell via microRNAs targeting PPAR-γ. Cell. Mol. Gastroenterol. Hepatol. 2015, 1, 646–663.e4. [Google Scholar] [CrossRef]
- Saini, A.; Ghoneim, H.E.; Lio, C.W.J.; Collins, P.L.; Oltz, E.M. Gene Regulatory Circuits in Innate and Adaptive Immune Cells. Annu. Rev. Immunol. 2022, 40, 387–411. [Google Scholar] [CrossRef]
- Hardison, R.C.; Taylor, J. Genomic approaches towards finding cis-regulatory modules in animals. Nat. Rev. Genet. 2012, 13, 469–483. [Google Scholar] [CrossRef]
- Wittkopp, P.J.; Kalay, G. Cis-regulatory elements: Molecular mechanisms and evolutionary processes underlying divergence. Nat. Rev. Genet. 2011, 13, 59–69. [Google Scholar] [CrossRef]
- Renoux, F.; Stellato, M.; Haftmann, C.; Vogetseder, A.; Huang, R.; Subramaniam, A.; Becker, M.O.; Blyszczuk, P.; Becher, B.; Distler, J.H.W.; et al. The AP1 Transcription Factor Fosl2 Promotes Systemic Autoimmunity and Inflammation by Repressing Treg Development. Cell Rep. 2020, 31, 107826. [Google Scholar] [CrossRef] [PubMed]
- Swindell, W.R.; Johnston, A.; Xing, X.; Little, A.; Robichaud, P.; Voorhees, J.J.; Fisher, G.; Gudjonsson, J.E. Robust shifts in S100a9 expression with aging: A novel mechanism for chronic inflammation. Sci. Rep. 2013, 3, 1215. [Google Scholar] [CrossRef] [PubMed]
- Wang, J.; Sun, D.; Wang, Y.; Ren, F.; Pang, S.; Wang, D.; Xu, S. FOSL2 positively regulates TGF-β1 signalling in non-small cell lung cancer. PLoS ONE 2014, 9, e112150. [Google Scholar] [CrossRef] [PubMed]
- Zhu, Q.C.; Li, S.; Yuan, L.X.; Chen, R.A.; Liu, D.X.; Fung, T.S. Induction of the Proinflammatory Chemokine Interleukin-8 Is Regulated by Integrated Stress Response and AP-1 Family Proteins Activated during Coronavirus Infection. Int. J. Mol. Sci. 2021, 22, 5646. [Google Scholar] [CrossRef] [PubMed]
- Jeong, H.H.; Jia, J.; Dai, Y.; Simon, L.M.; Zhao, Z. Investigating Cellular Trajectories in the Severity of COVID-19 and Their Transcriptional Programs Using Machine Learning Approaches. Genes 2021, 12, 635. [Google Scholar] [CrossRef]
- Rincon-Arevalo, H.; Aue, A.; Ritter, J.; Szelinski, F.; Khadzhynov, D.; Zickler, D.; Stefanski, L.; Lino, A.C.; Körper, S.; Eckardt, K.U.; et al. Altered increase in STAT1 expression and phosphorylation in severe COVID-19. Eur. J. Immunol. 2022, 52, 138–148. [Google Scholar] [CrossRef]
- Perreau, M.; Suffiotti, M.; Marques-Vidal, P.; Wiedemann, A.; Levy, Y.; Laouénan, C.; Ghosn, J.; Fenwick, C.; Comte, D.; Roger, T.; et al. The cytokines HGF and CXCL13 predict the severity and the mortality in COVID-19 patients. Nat. Commun. 2021, 12, 4888. [Google Scholar] [CrossRef]
- Rovai, E.S.; Alves, T.; Holzhausen, M. Protease-activated receptor 1 as a potential therapeutic target for COVID-19. Exp. Biol. Med. 2021, 246, 688–694. [Google Scholar] [CrossRef]
- Neidleman, J.; Luo, X.; George, A.F.; McGregor, M.; Yang, J.; Yun, C.; Murray, V.; Gill, G.; Greene, W.C.; Vasquez, J.; et al. Distinctive features of SARS-CoV-2-specific T cells predict recovery from severe COVID-19. Cell Rep. 2021, 36, 109414. [Google Scholar] [CrossRef]
- Lundberg, S.; Lee, S.I. A Unified Approach to Interpreting Model Predictions. arXiv 2017, arXiv:1705.07874. [Google Scholar]
- Cao, X. COVID-19: Immunopathology and its implications for therapy. Nat. Rev. Immunol. 2020, 20, 269–270. [Google Scholar] [CrossRef] [PubMed]
- Bain, C.C.; Rossi, A.G.; Lucas, C.D. Chapter One—Pulmonary macrophages and SARS-CoV-2 infection. In International Review of Cell and Molecular Biology; Mariani, S.A., Cassetta, L., Galluzzi, L., Eds.; Academic Press: Cambridge, MA, USA, 2022; Volume 367, pp. 1–28. [Google Scholar]
- Matic, S.; Popovic, S.; Djurdjevic, P.; Todorovic, D.; Djordjevic, N.; Mijailovic, Z.; Sazdanovic, P.; Milovanovic, D.; Ruzic Zecevic, D.; Petrovic, M.; et al. SARS-CoV-2 infection induces mixed M1/M2 phenotype in circulating monocytes and alterations in both dendritic cell and monocyte subsets. PLoS ONE 2020, 15, e0241097. [Google Scholar] [CrossRef] [PubMed]
- Liu, N.; Jiang, C.; Cai, P.; Shen, Z.; Sun, W.; Xu, H.; Fang, M.; Yao, X.; Zhu, L.; Gao, X.; et al. Single-cell analysis of COVID-19, sepsis, and HIV infection reveals hyperinflammatory and immunosuppressive signatures in monocytes. Cell Rep. 2021, 37, 109793. [Google Scholar] [CrossRef] [PubMed]
- Dong, X.; Wang, C.; Liu, X.; Gao, W.; Bai, X.; Li, Z. Lessons Learned Comparing Immune System Alterations of Bacterial Sepsis and SARS-CoV-2 Sepsis. Front. Immunol. 2020, 11, 598404. [Google Scholar] [CrossRef] [PubMed]


Publisher’s Note: MDPI stays neutral with regard to jurisdictional claims in published maps and institutional affiliations. |
© 2022 by the authors. Licensee MDPI, Basel, Switzerland. This article is an open access article distributed under the terms and conditions of the Creative Commons Attribution (CC BY) license (https://creativecommons.org/licenses/by/4.0/).
Share and Cite
Shaymardanov, A.M.; Antonova, O.A.; Sokol, A.D.; Deinichenko, K.A.; Kazakova, P.G.; Milovanov, M.M.; Zakubansky, A.V.; Akinshina, A.I.; Tsypkina, A.V.; Romanova, S.V.; et al. Single-Cell Gene Expression Analysis Revealed Immune Cell Signatures of Delta COVID-19. Cells 2022, 11, 2950. https://doi.org/10.3390/cells11192950
Shaymardanov AM, Antonova OA, Sokol AD, Deinichenko KA, Kazakova PG, Milovanov MM, Zakubansky AV, Akinshina AI, Tsypkina AV, Romanova SV, et al. Single-Cell Gene Expression Analysis Revealed Immune Cell Signatures of Delta COVID-19. Cells. 2022; 11(19):2950. https://doi.org/10.3390/cells11192950
Chicago/Turabian StyleShaymardanov, Abusaid M., Olga A. Antonova, Anastasia D. Sokol, Kseniia A. Deinichenko, Polina G. Kazakova, Mikhail M. Milovanov, Alexander V. Zakubansky, Alexandra I. Akinshina, Anastasia V. Tsypkina, Svetlana V. Romanova, and et al. 2022. "Single-Cell Gene Expression Analysis Revealed Immune Cell Signatures of Delta COVID-19" Cells 11, no. 19: 2950. https://doi.org/10.3390/cells11192950
APA StyleShaymardanov, A. M., Antonova, O. A., Sokol, A. D., Deinichenko, K. A., Kazakova, P. G., Milovanov, M. M., Zakubansky, A. V., Akinshina, A. I., Tsypkina, A. V., Romanova, S. V., Muhin, V. E., Mitrofanov, S. I., Yudin, V. S., Yudin, S. M., Makhotenko, A. V., Keskinov, A. A., Kraevoy, S. A., Snigir, E. A., Svetlichnyy, D. V., & Skvortsova, V. I. (2022). Single-Cell Gene Expression Analysis Revealed Immune Cell Signatures of Delta COVID-19. Cells, 11(19), 2950. https://doi.org/10.3390/cells11192950