
p73α1, an Isoform of the p73 Tumor Suppressor, Modulates Lipid Metabolism and Cancer Cell Growth via Stearoyl-CoA Desaturase-1

 , , ,
, , ,  and
and
Abstract
:
1. Introduction
2. Materials and Methods
2.1. Cell Culture and Cell Line Generation
2.2. Plasmid Generation
2.3. RNA Isolation and qPCR
2.4. Western Blot Analysis
2.5. ChIP Assay
2.6. siRNA Knockdown
2.7. Cell Viability Assay
2.8. Metabolomics and Lipidomics
2.9. Statistical Analysis
3. Results
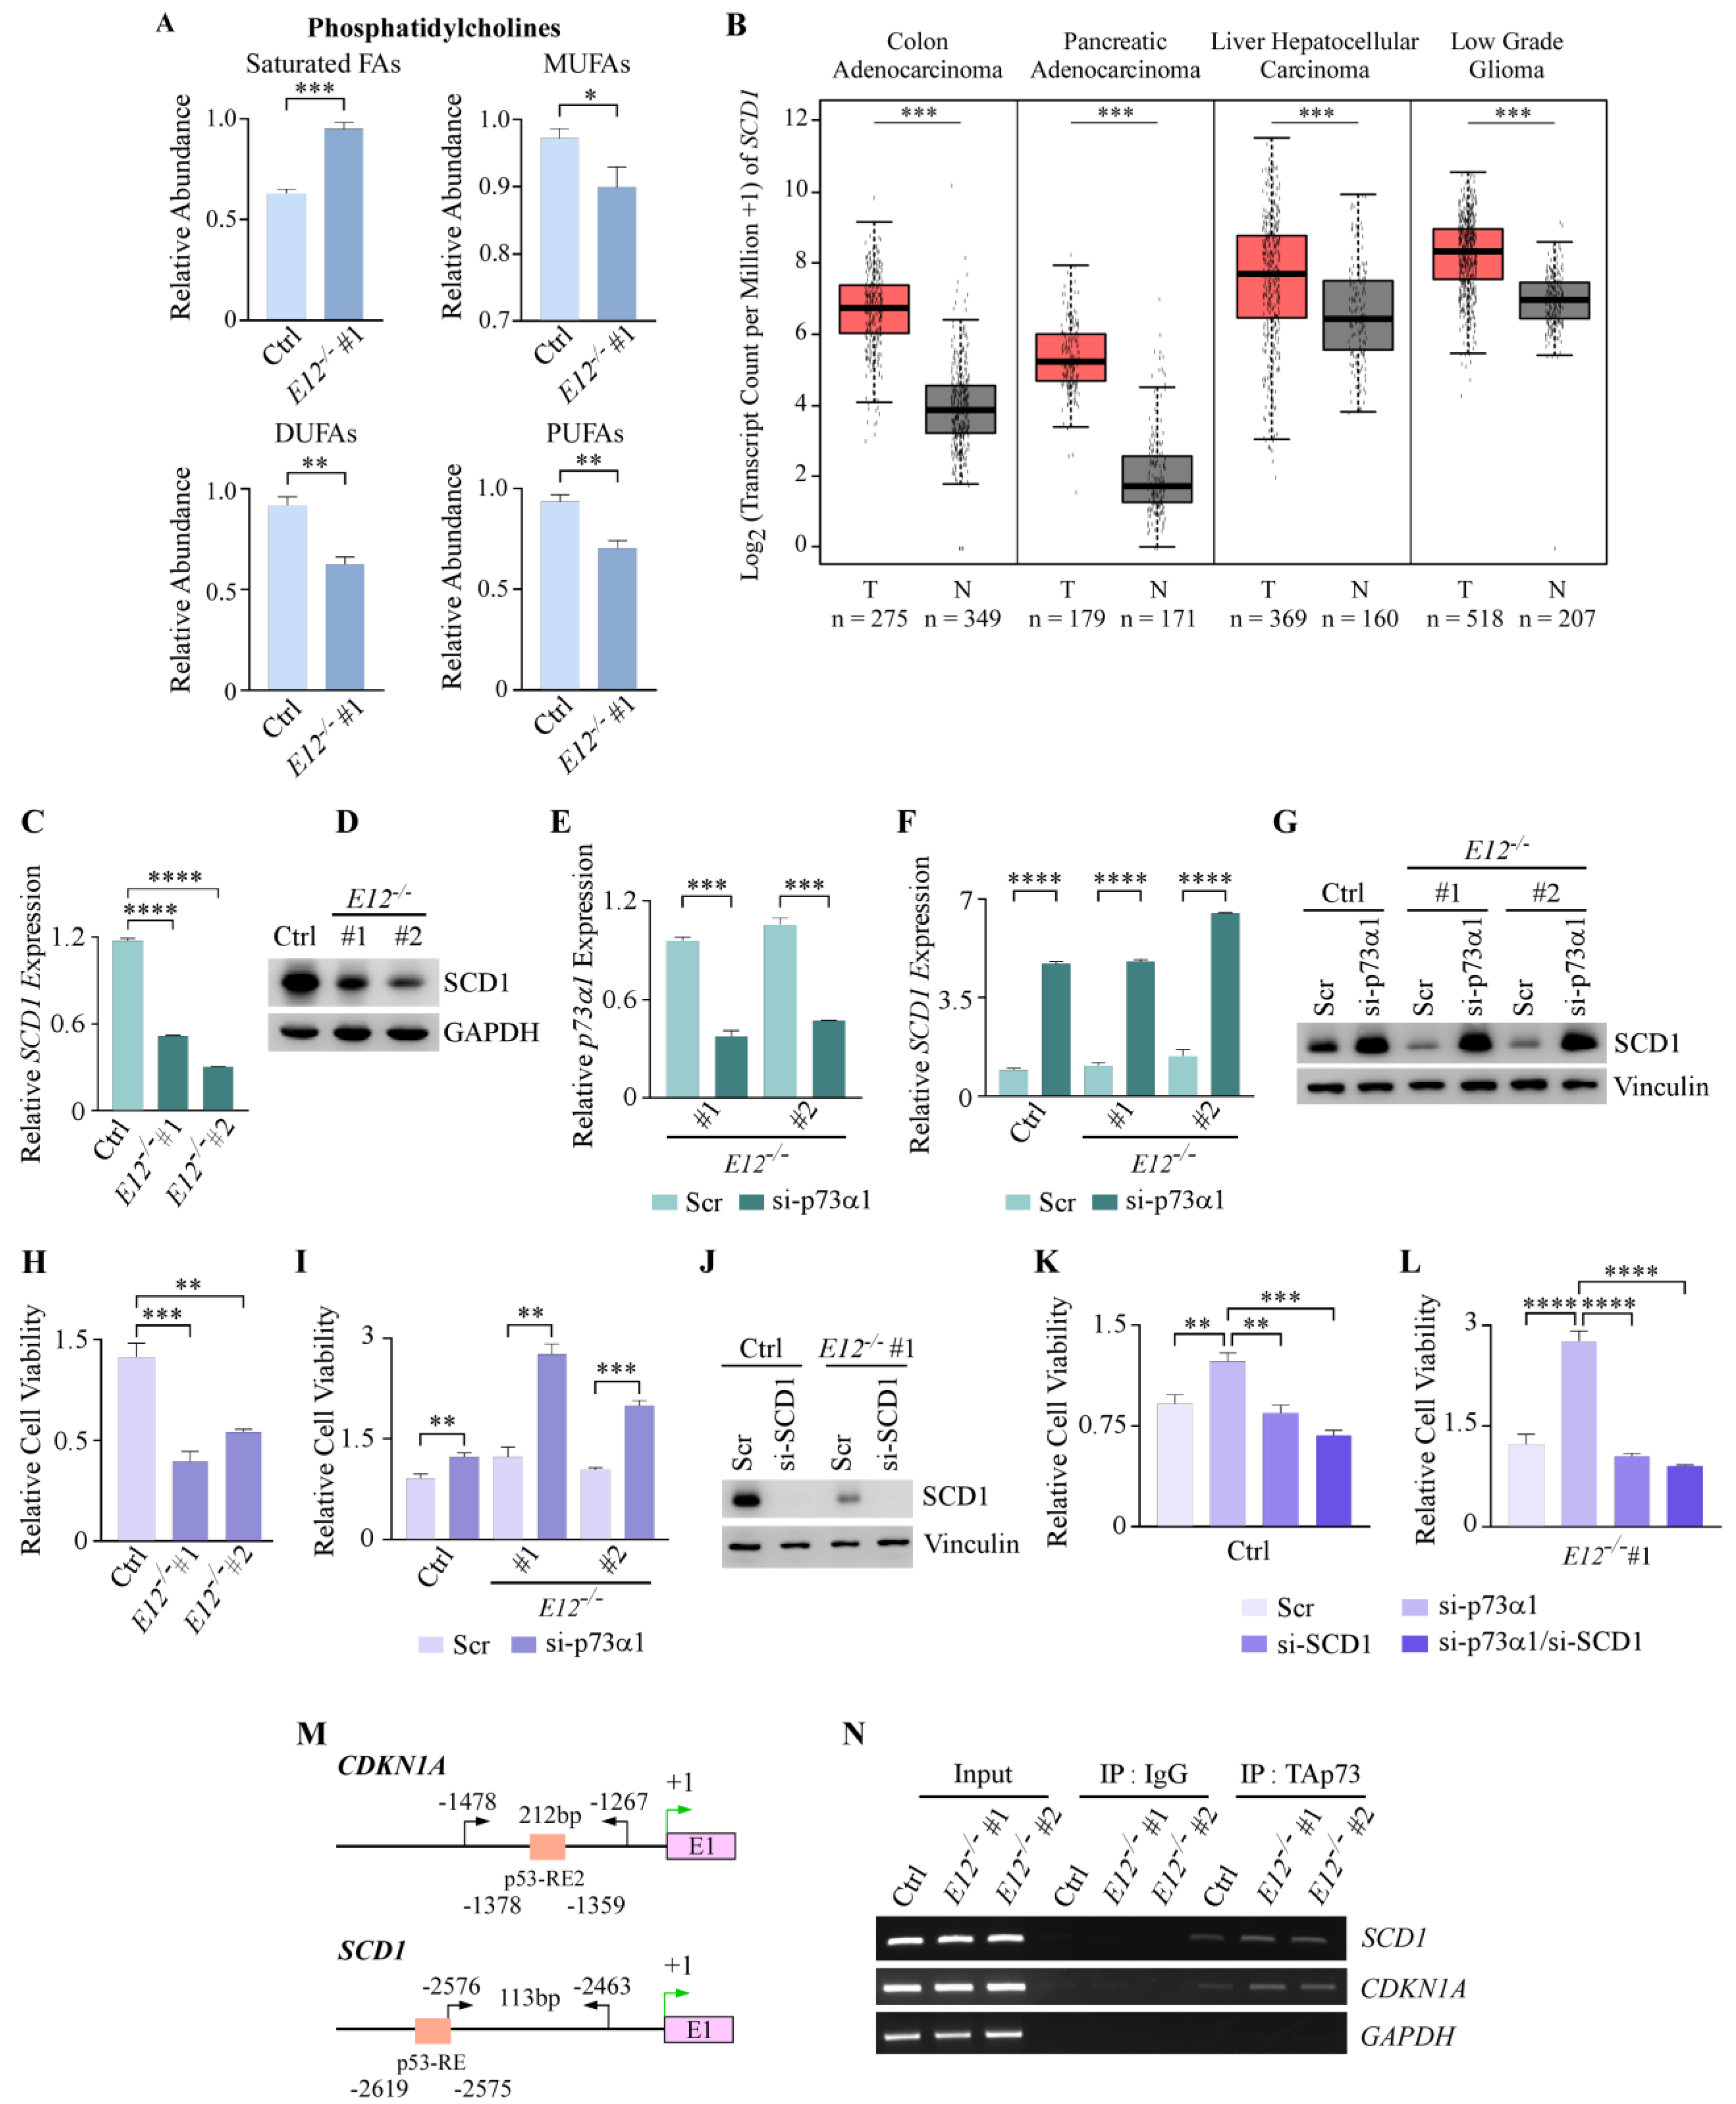
3.1. Isoform Switch from p73α to p73α1 Alters the Metabolome in H1299 Cells
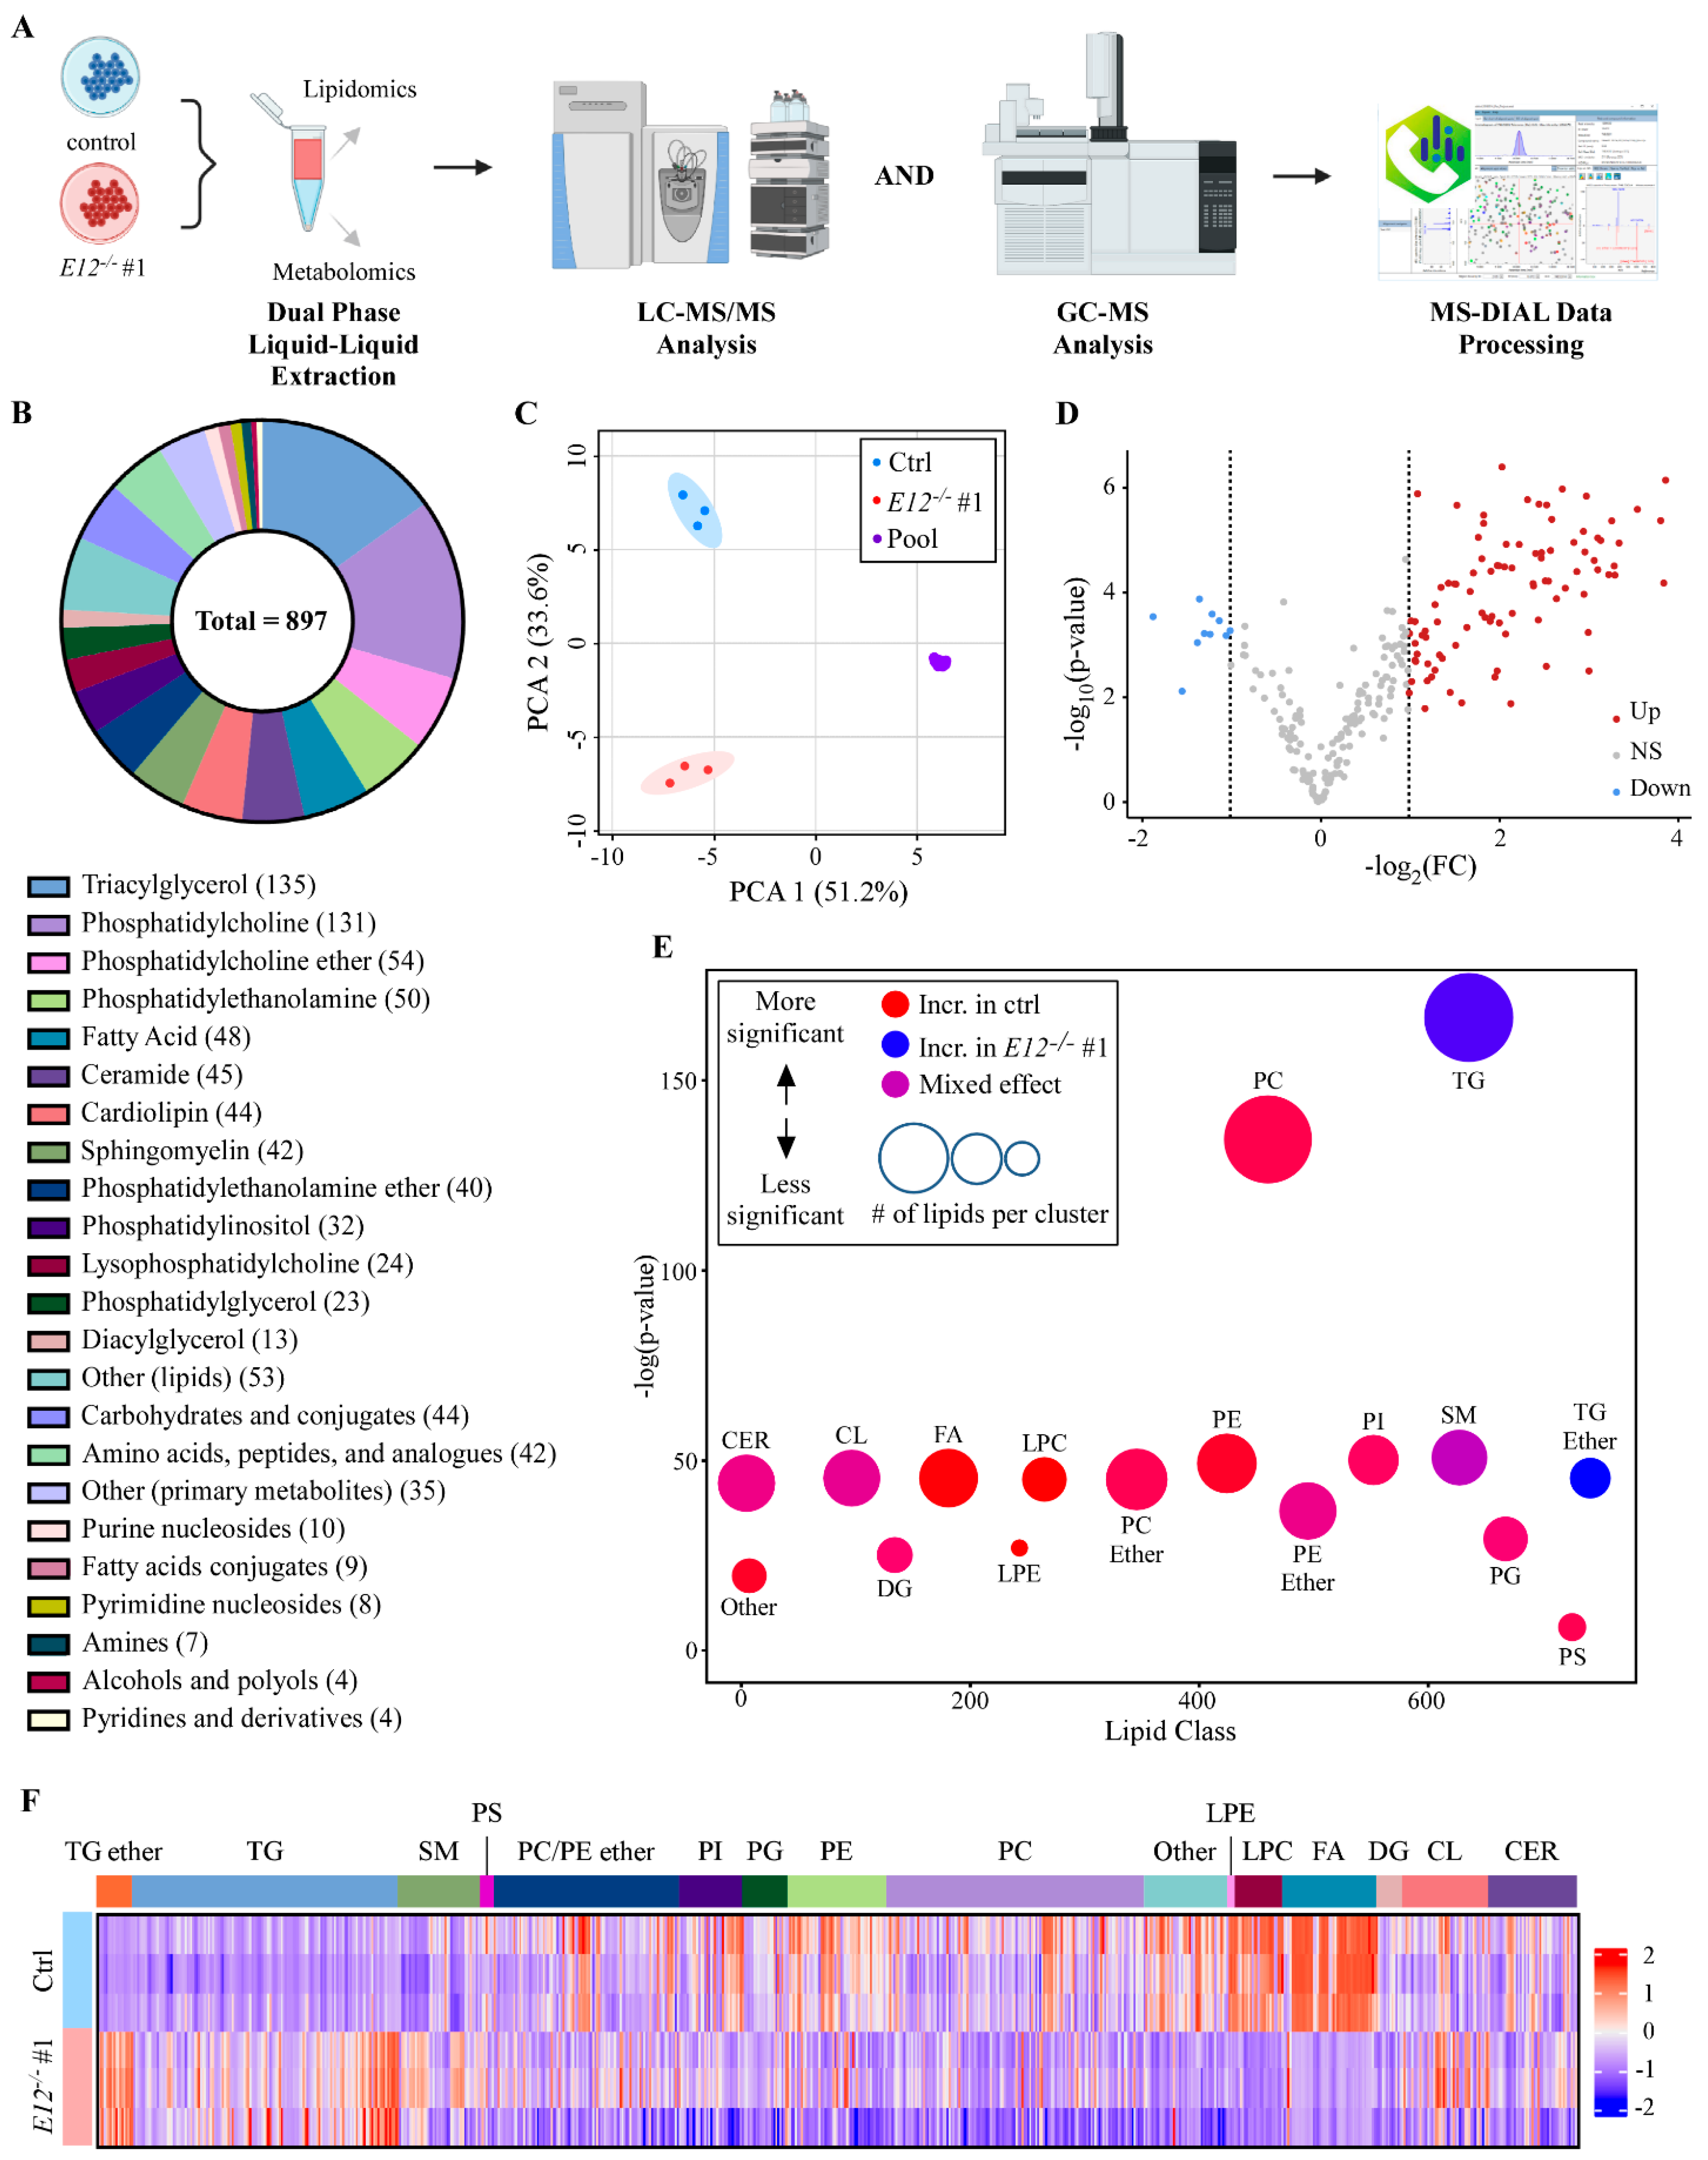
3.2. Loss of E12 Leads to Specific Lipidome Changes in H1299 Cells
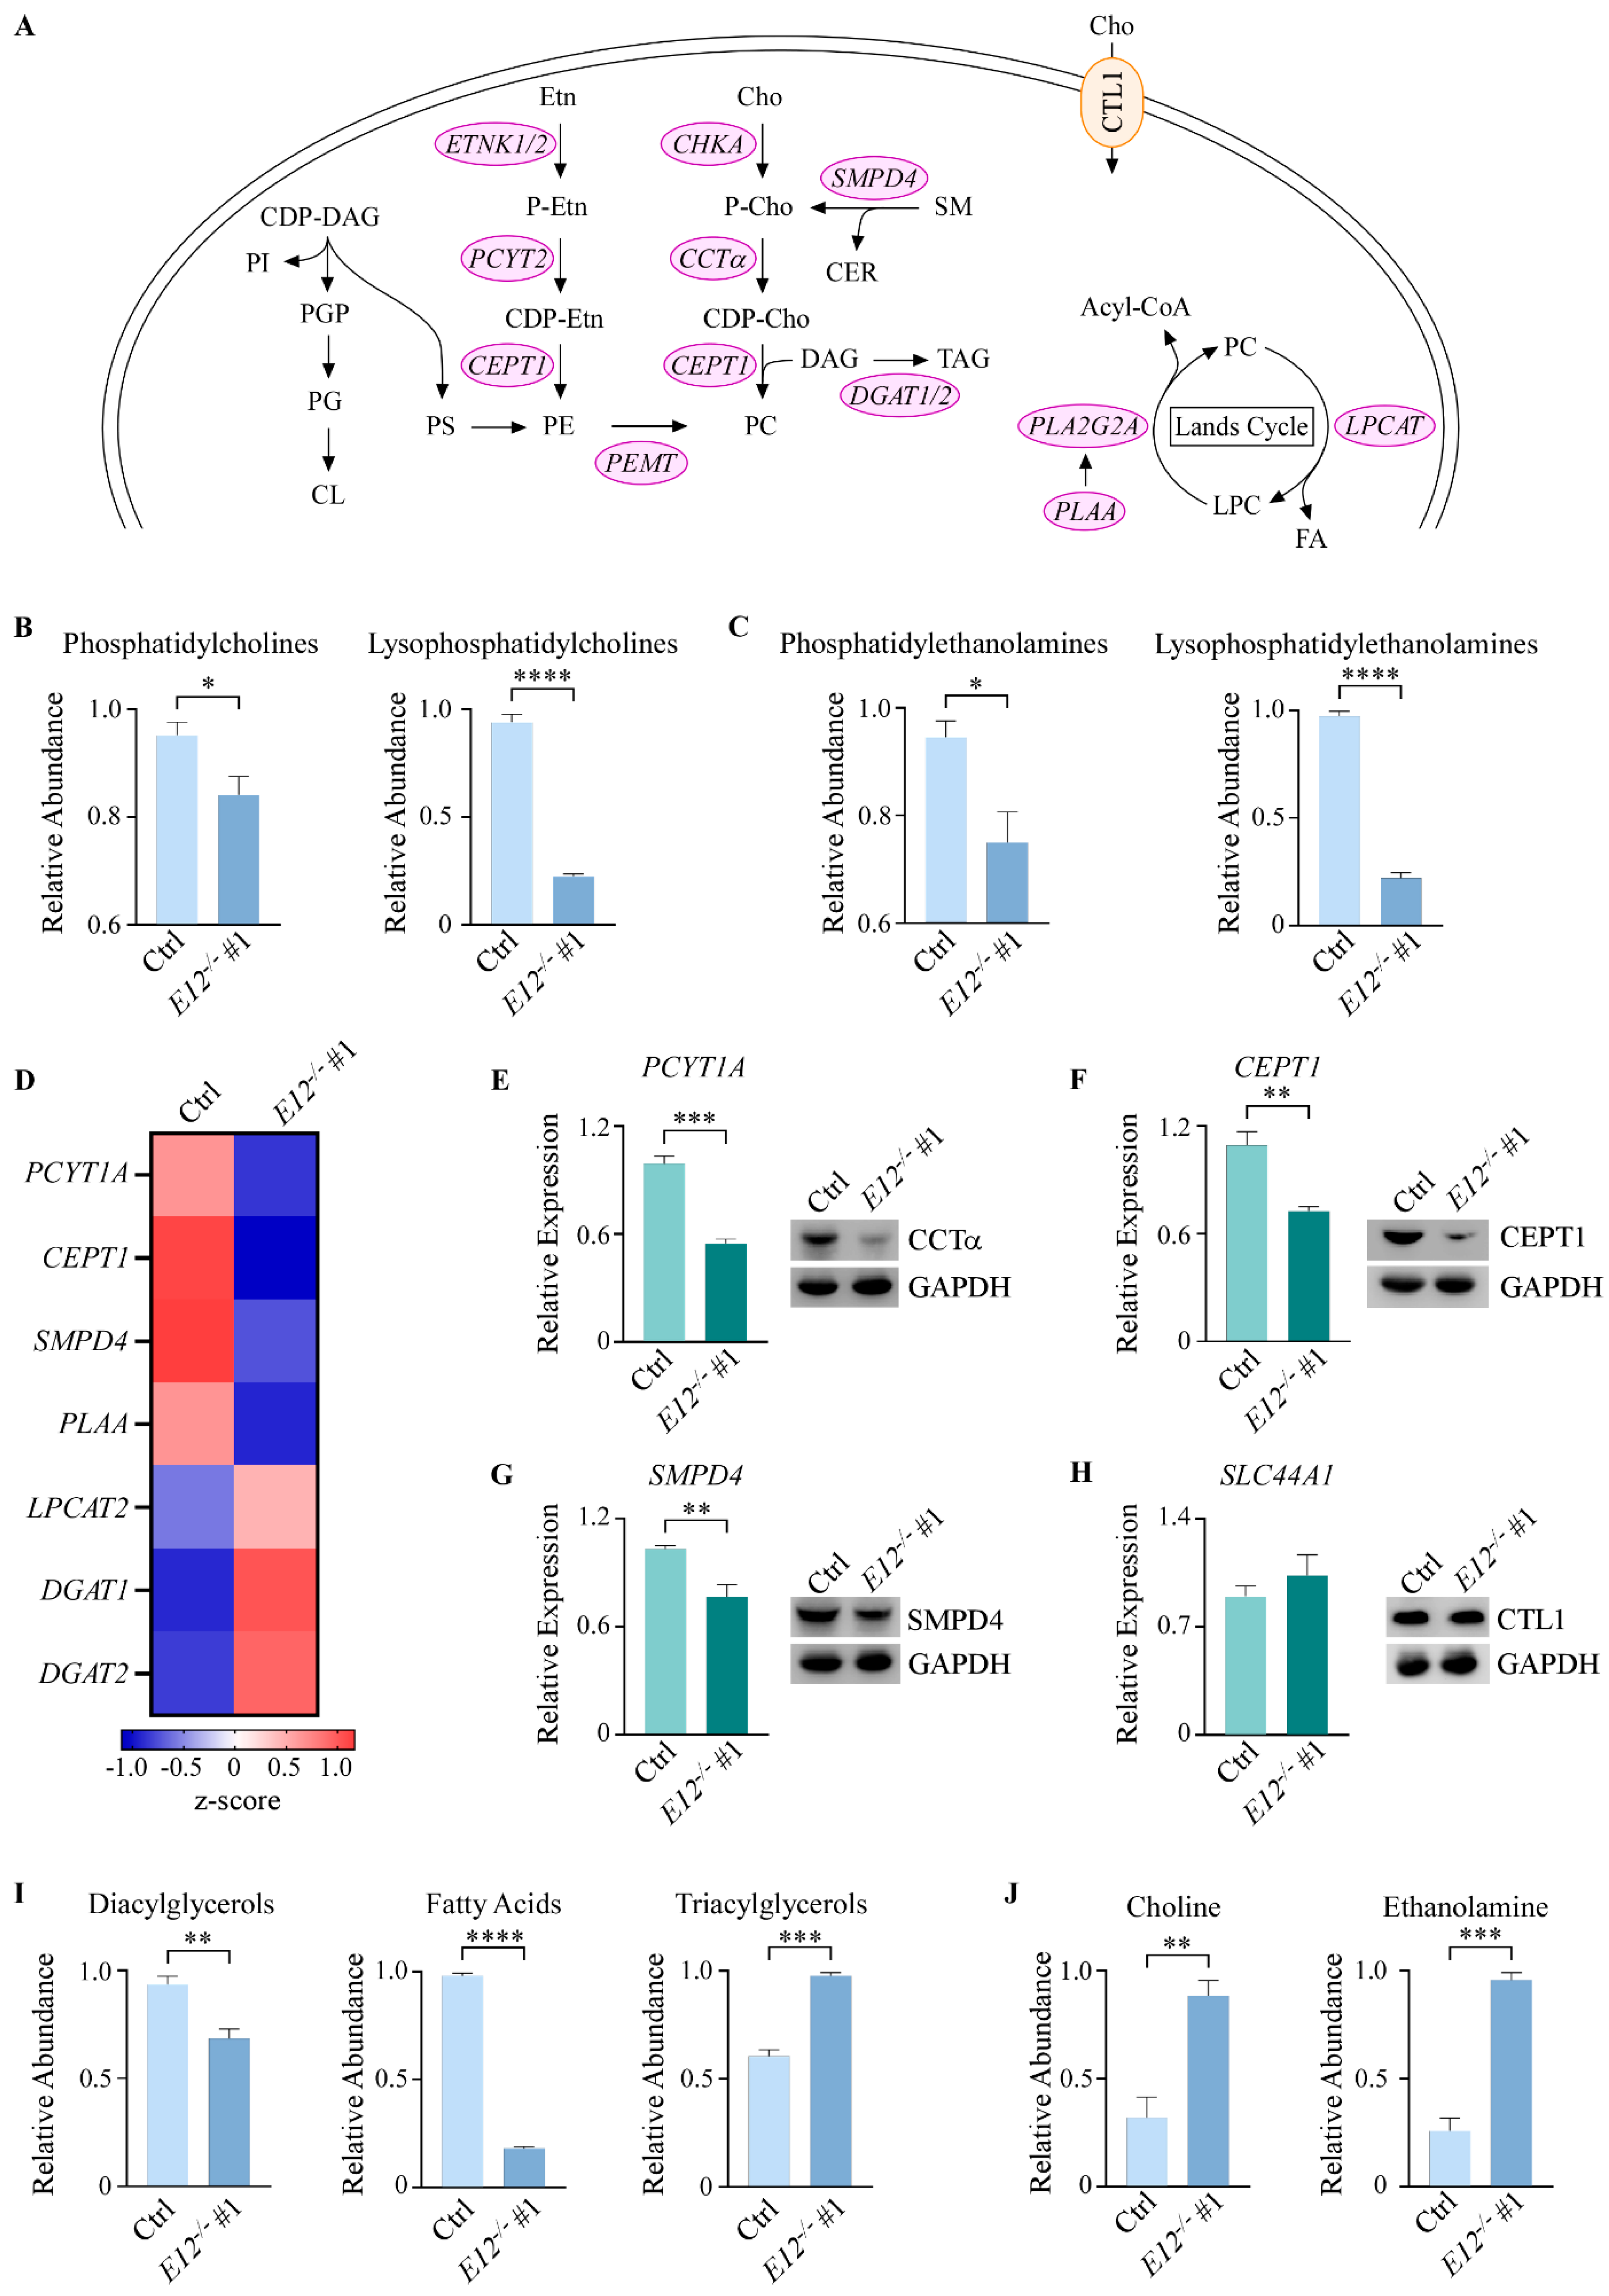
3.3. Kennedy Pathway Metabolites Are Altered upon Loss of E12 in H1299 Cells
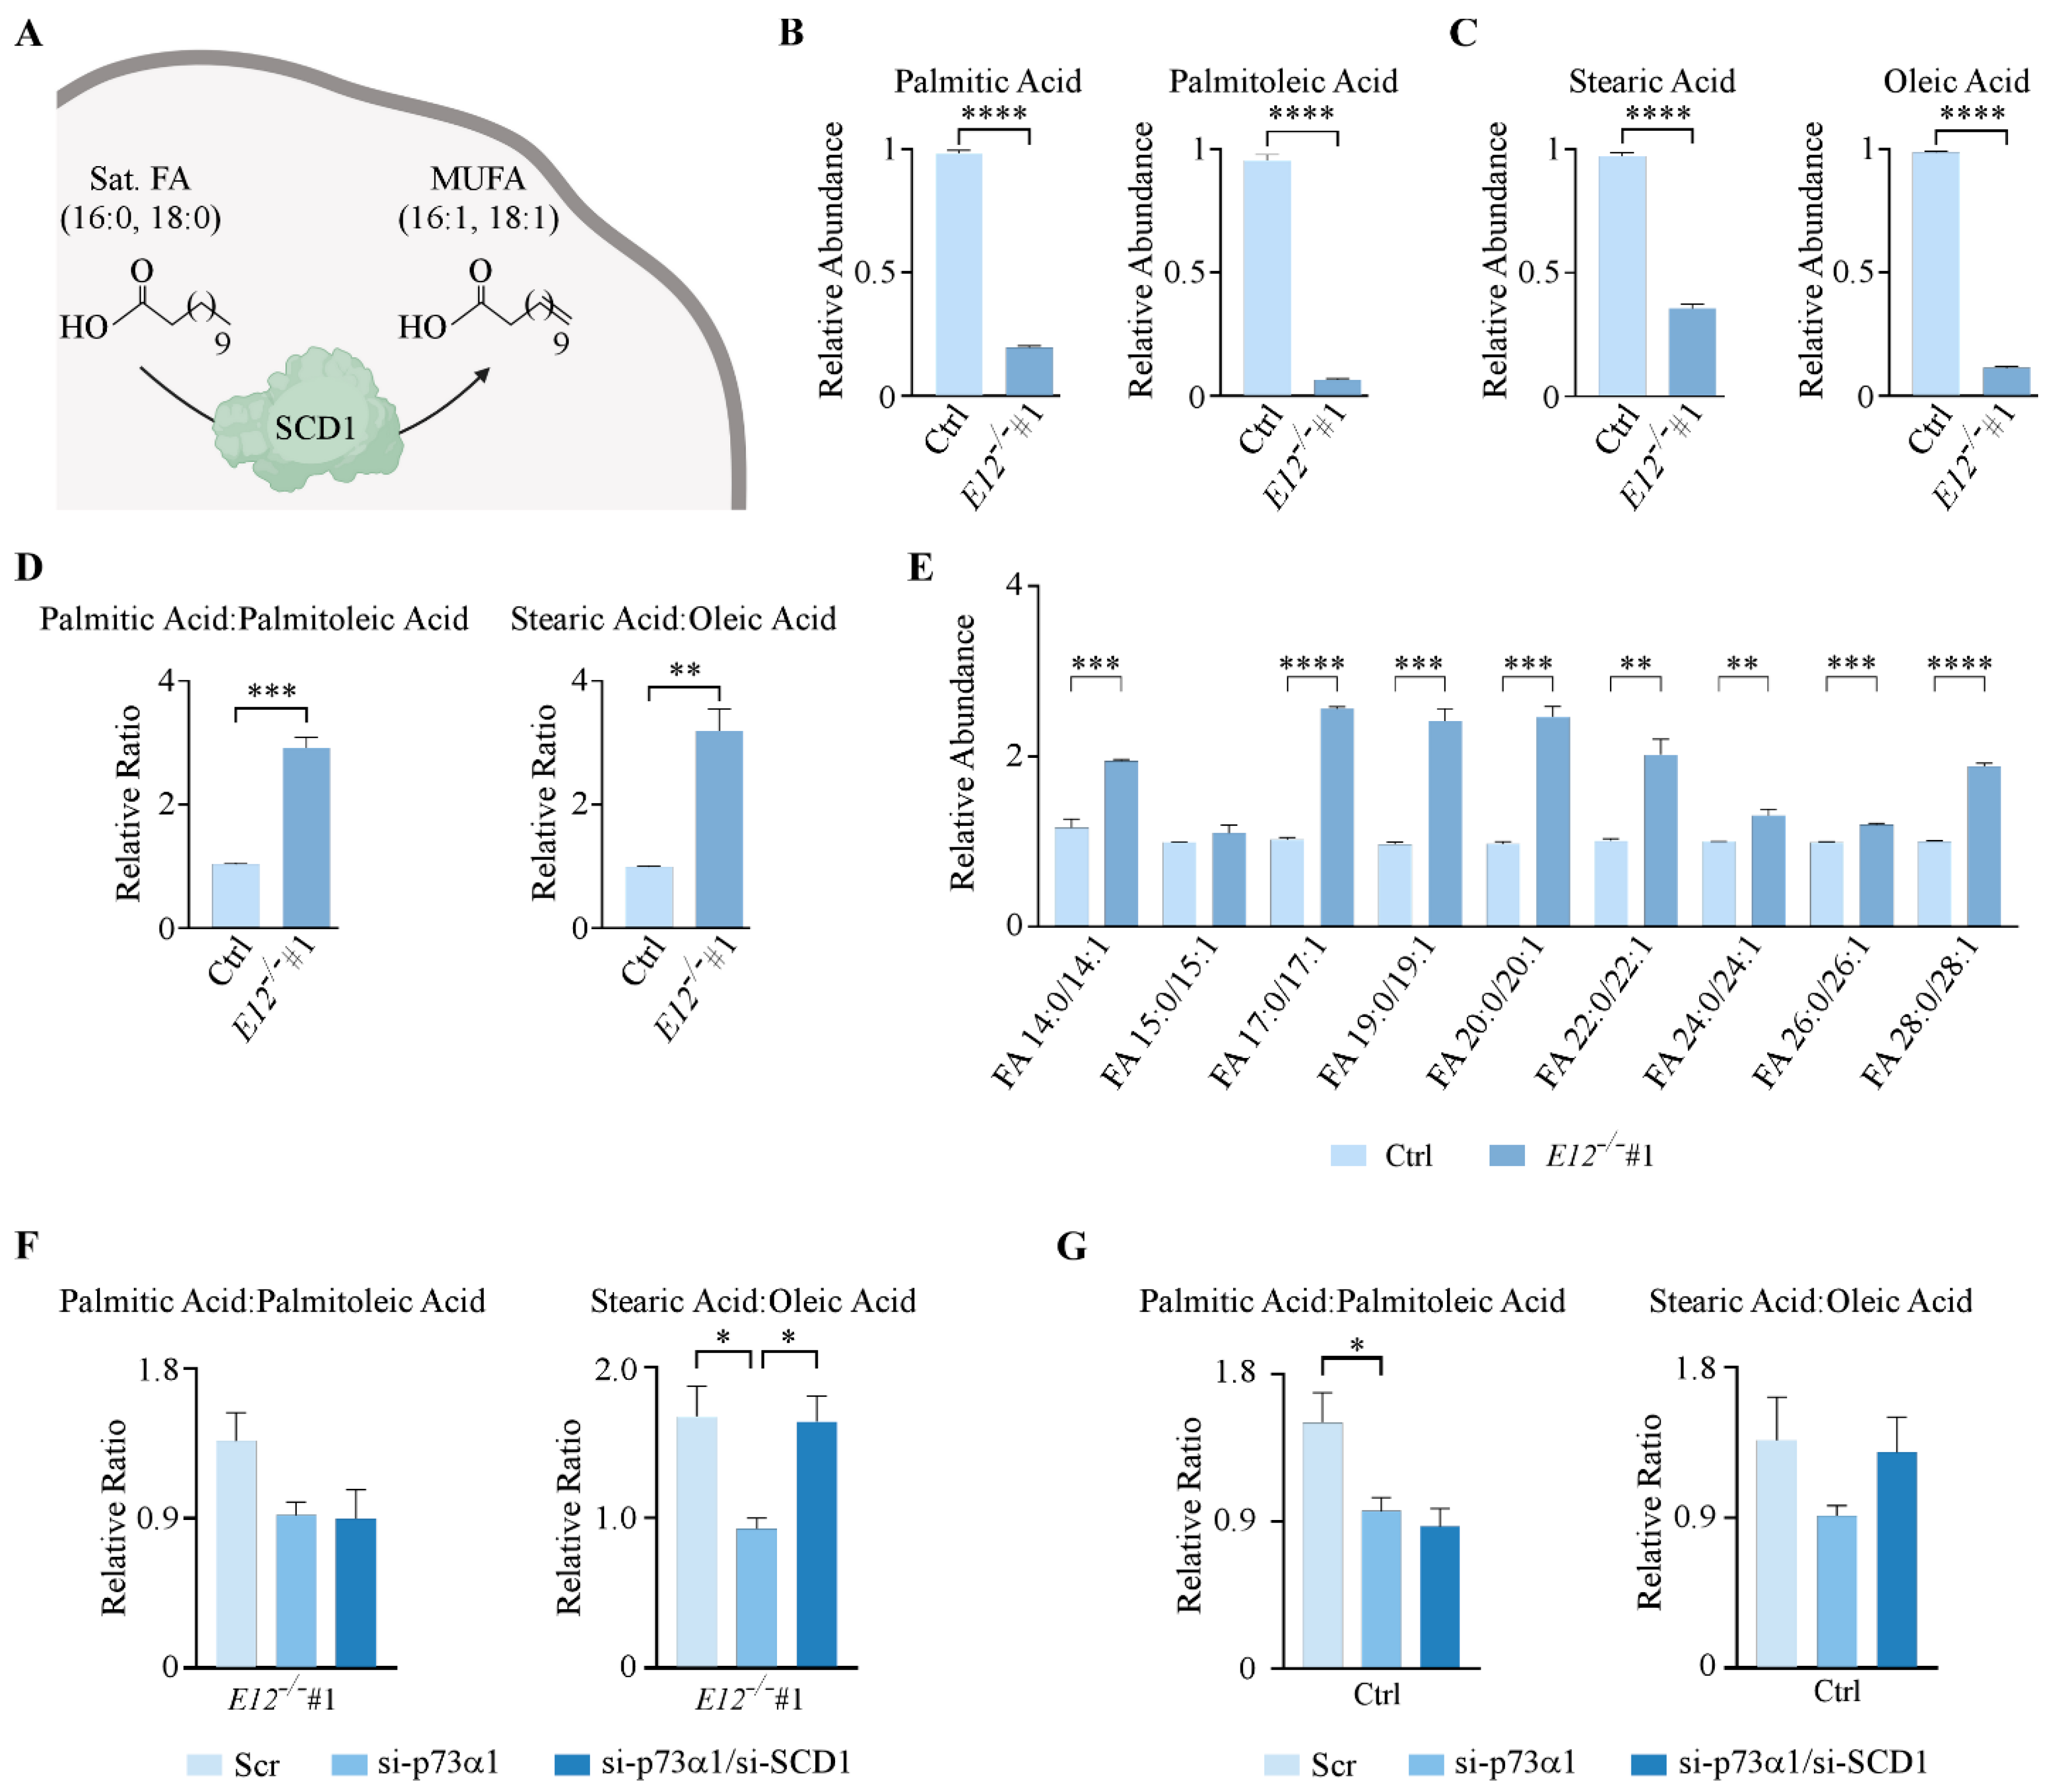
3.4. Loss of E12 Alters PC Chain Length and Saturation in H1299 Cells
3.5. p73α1 Suppresses Cancer Cell Viability by Directly Inhibiting SCD1 Expression in H1299 Cells
3.6. p73α1-Mediated Suppression of SCD1 Leads to an Increased Ratio of Stearic Acid to Oleic Acid in H1299 Cells
4. Discussion
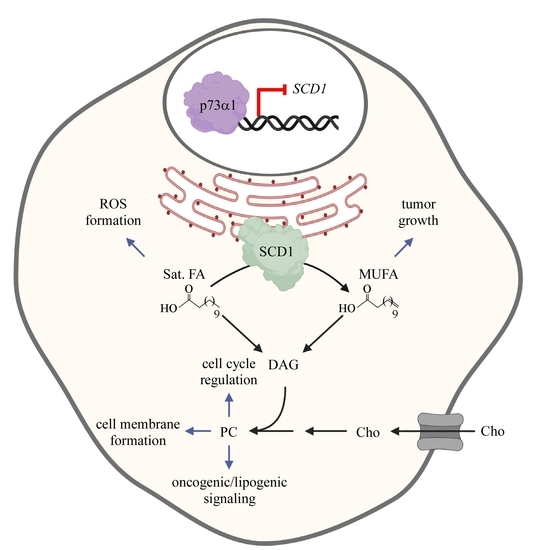
5. Conclusions
Supplementary Materials
Author Contributions
Funding
Institutional Review Board Statement
Informed Consent Statement
Data Availability Statement
Acknowledgments
Conflicts of Interest
References
- Tocher, D.R. Chapter 6 Glycerophospholipid metabolism. In Biochemistry and Molecular Biology of Fishes; ScienceDirect: Amsterdam, The Netherlands, 1995; pp. 119–157. [Google Scholar] [CrossRef]
- Kanno, K.; Wu, M.K.; Scapa, E.F.; Roderick, S.L.; Cohen, D.E. Structure and function of phosphatidylcholine transfer protein (PC-TP)/StarD2. Biochim. Biophys. Acta-Mol. Cell Biol. Lipids 2007, 1771, 654–662. [Google Scholar] [CrossRef]
- Gibellini, F.; Smith, T.K. The Kennedy pathway-de novo synthesis of phosphatidylethanolamine and phosphatidylcholine. IUBMB Life 2010, 62, 414–428. [Google Scholar] [CrossRef] [PubMed]
- Moessinger, C.; Klizaite, K.; Steinhagen, A.; Philippou-Massier, J.; Shevchenko, A.; Hoch, M.; Ejsing, C.S.; Thiele, C. Two different pathways of phosphatidylcholine synthesis, the Kennedy Pathway and the Lands Cycle, differentially regulate cellular triacylglycerol storage. BMC Cell Biol. 2014, 15, 43. [Google Scholar] [CrossRef] [PubMed]
- Watkins, S.M.; Zhu, X.; Zeisel, S.H. Phosphatidylethanolamine-N-methyltransferase Activity and Dietary Choline Regulate Liver-Plasma Lipid Flux and Essential Fatty Acid Metabolism in Mice. J. Nutr. 2003, 133, 3386–3391. [Google Scholar] [CrossRef] [PubMed]
- Michel, V.; Yuan, Z.; Ramsubir, S.; Bakovic, M. Choline transport for phospholipid synthesis. Exp. Biol. Med. 2006, 231, 490–504. [Google Scholar] [CrossRef]
- Robichaud, P.P.; Surette, M.E. Polyunsaturated fatty acid-phospholipid remodeling and inflammation. Curr. Opin. Endocrinol. Diabetes Obes. 2015, 22, 112–118. [Google Scholar] [CrossRef]
- Vance, D.E. Phospholipid methylation in mammals: From biochemistry to physiological function. Biochim. Biophys. Acta-Biomembr. 2014, 1838, 1477–1487. [Google Scholar] [CrossRef]
- Harayama, T.; Eto, M.; Shindou, H.; Kita, Y.; Otsubo, E.; Hishikawa, D.; Ishii, S.; Sakimura, K.; Mishina, M.; Shimizu, T. Lysophospholipid acyltransferases mediate phosphatidylcholine diversification to achieve the physical properties required in vivo. Cell Metab. 2014, 20, 295–305. [Google Scholar] [CrossRef]
- Cole, L.K.; Vance, J.E.; Vance, D.E. Phosphatidylcholine biosynthesis and lipoprotein metabolism. Biochim. Biophys. Acta-Mol. Cell Biol. Lipids 2012, 1821, 754–761. [Google Scholar] [CrossRef]
- Hanahan, D.; Weinberg, R.A. Hallmarks of cancer: The next generation. Cell 2011, 144, 646–674. [Google Scholar] [CrossRef]
- Snaebjornsson, M.T.; Janaki-Raman, S.; Schulze, A. Greasing the Wheels of the Cancer Machine: The Role of Lipid Metabolism in Cancer. Cell Metab. 2020, 31, 62–76. [Google Scholar] [CrossRef]
- Saito, T.; Kuma, A.; Sugiura, Y.; Ichimura, Y.; Obata, M.; Kitamura, H.; Okuda, S.; Lee, H.C.; Ikeda, K.; Kanegae, Y.; et al. Autophagy regulates lipid metabolism through selective turnover of NCoR1. Nat. Commun. 2019, 10, 1567. [Google Scholar] [CrossRef] [PubMed]
- Jain, M.; Nilsson, R.; Sharma, S.; Madhusudhan, N.; Kitami, T.; Souza, A.L.; Kafri, R.; Kirschner, M.W.; Clish, C.B.; Mootha, V.K. Metabolite profiling identifies a key role for glycine in rapid cancer cell proliferation. Science 2012, 336, 1040–1044. [Google Scholar] [CrossRef] [PubMed]
- Daly, P.F.; Lyon, R.C.; Faustino, P.J.; Cohen, J.S. Phospholipid metabolism in cancer cells monitored by 31P NMR spectroscopy. J. Biol. Chem. 1987, 262, 14875–14878. [Google Scholar] [CrossRef]
- Glunde, K.; Bhujwalla, Z.M.; Ronen, S.M. Choline metabolism in malignant transformation. Nat. Rev. Cancer 2011, 11, 835–848. [Google Scholar] [CrossRef]
- Zheng, Y.; Rodrik, V.; Toschi, A.; Shi, M.; Hui, L.; Shen, Y.; Foster, D.A. Phospholipase D Couples Survival and Migration Signals in Stress Response of Human Cancer Cells. J. Biol. Chem. 2006, 281, 15862–15868. [Google Scholar] [CrossRef] [PubMed]
- Gomez-Cambronero, J. Phosphatidic acid, phospholipase D and tumorigenesis. Adv. Biol. Regul. 2014, 54, 197–206. [Google Scholar] [CrossRef]
- Han, H.; Qi, R.; Zhou, J.J.; Ta, A.P.; Yang, B.; Nakaoka, H.J.; Seo, G.; Guan, K.L.; Luo, R.; Wang, W. Regulation of the Hippo Pathway by Phosphatidic Acid-Mediated Lipid-Protein Interaction. Mol. Cell 2018, 72, 328–340. [Google Scholar] [CrossRef] [PubMed]
- Foster, D.A. Phosphatidic acid signaling to mTOR: Signals for the survival of human cancer cells. Biochim. Biophys. Acta-Mol. Cell Biol. Lipids 2009, 1791, 949–955. [Google Scholar] [CrossRef]
- Wang, B.; Wu, L.; Chen, J.; Dong, L.; Chen, C.; Wen, Z.; Hu, J.; Fleming, I.; Wang, D.W. Metabolism pathways of arachidonic acids: Mechanisms and potential therapeutic targets. Signal Transduct. Target. Ther. 2021, 6, 94. [Google Scholar] [CrossRef]
- Kaghad, M.; Bonnet, H.; Yang, A.; Creancier, L.; Biscan, J.C.; Valent, A.; Minty, A.; Chalon, P.; Lelias, J.M.; Dumont, X.; et al. Monoallelically expressed gene related to p53 at 1p36, a region frequently deleted in neuroblastoma and other human cancers. Cell 1997, 90, 809–819. [Google Scholar] [CrossRef]
- Jost, C.A.; Marin, M.C.; Kaelin, W.G., Jr. P73 is a human p53-related protein that can induce apoptosis. Nature 1997, 389, 191–194. [Google Scholar] [CrossRef] [PubMed]
- Arrowsmith, C.H. Structure and function in the p53 family. Cell Death Differ. 1999, 6, 1169–1173. [Google Scholar] [CrossRef]
- Tomasini, R.; Tsuchihara, K.; Wilhelm, M.; Fujitani, M.; Rufini, A.; Cheung, C.C.; Khan, F.; Itie-Youten, A.; Wakeham, A.; Tsao, M.S.; et al. TAp73 knockout shows genomic instability with infertility and tumor suppressor functions. Genes Dev. 2008, 22, 2677–2691. [Google Scholar] [CrossRef] [PubMed]
- Zhu, J.; Jiang, J.; Zhou, W.; Chen, X. The Potential Tumor Suppressor p73 Differentially Regulates Cellular p53 Target Genes. Cancer Res. 1998, 58, 5061–5065. [Google Scholar]
- Melino, G.; Bernassola, F.; Ranalli, M.; Yee, K.; Zong, W.X.; Corazzari, M.; Knight, R.A.; Green, D.R.; Thompson, C.; Vousden, K.H. P73 Induces Apoptosis via PUMA Transactivation and Bax Mitochondrial Translocation. J. Biol. Chem. 2004, 279, 8076–8083. [Google Scholar] [CrossRef]
- Vernole, P.; Neale, M.H.; Barcaroli, D.; Munarriz, E.; Knight, R.A.; Tomasini, R.; Mak, T.W.; Melino, G.; de Laurenzi, V. TAp73α binds the kinetochore proteins Bub1 and Bub3 resulting in polyploidy. Cell Cycle 2009, 8, 421–429. [Google Scholar] [CrossRef]
- Yang, A.; Walker, N.; Bronson, R.; Kaghad, M.; Oosterwegel, M.; Bonnin, J.; Vagner, C.; Bonnet, H.; Dikkes, P.; Sharpe, A.; et al. P73-deficient mice have neurological, pheromonal and inflammatory defects but lack spontaneous tumours. Nature 2000, 404, 99–103. [Google Scholar] [CrossRef]
- Wilhelm, M.T.; Rufini, A.; Wetzel, M.K.; Tsuchihara, K.; Inoue, S.; Tomasini, R.; Itie-Youten, A.; Wakeham, A.; Arsenian-Henriksson, M.; Melino, G.; et al. Isoform-specific p73 knockout mice reveal a novel role for ΔNp73 in the DNA damage response pathway. Genes Dev. 2010, 24, 549–560. [Google Scholar] [CrossRef]
- Zaika, A.I.; Slade, N.; Erster, S.H.; Sansome, C.; Joseph, T.W.; Pearl, M.; Chalas, E.; Moll, U.M. δNp73, a dominant-negative inhibitor of wild-type p53 and TAp73, is up-regulated in human tumors. J. Exp. Med. 2002, 196, 765–780. [Google Scholar] [CrossRef]
- Steder, M.; Alla, V.; Meier, C.; Spitschak, A.; Pahnke, J.; Fürst, K.; Kowtharapu, B.S.; Engelmann, D.; Petigk, J.; Egberts, F.; et al. DNp73 Exerts Function in Metastasis Initiation by Disconnecting the Inhibitory Role of EPLIN on IGF1R-AKT/STAT3 Signaling. Cancer Cell 2013, 24, 512–527. [Google Scholar] [CrossRef] [PubMed]
- De Laurenzi, V.; Costanzo, A.; Barcaroli, D.; Terrinoni, A.; Falco, M.; Annicchiarico-petruzzelli, M.; Levrero, M.; Melino, G. Two New p73 Splice Variants with Different Transcriptional Activity. J. Exp. Med. 1998, 188, 1763–1768. [Google Scholar] [CrossRef] [PubMed]
- de Laurenzi, V.; Catani, M.V.; Terrinoni, A.; Corazzari, M.; Melino, G.; Constanzo, A.; Levrero, M.; Knight, R.A. Additional complexity in p73: Induction by mitogens in lymphoid cells and identification of two new splicing variants ε and ζ. Cell Death Differ. 1999, 6, 389–390. [Google Scholar] [CrossRef] [PubMed]
- Rufini, A.; Agostini, M.; Grespi, F.; Tomasini, R.; Sayan, B.S.; Niklison-Chirou, M.V.; Conforti, F.; Velletri, T.; Mastino, A.; Mak, T.W.; et al. P73 in cancer. Genes Cancer 2011, 2, 491–502. [Google Scholar] [CrossRef] [PubMed]
- Grespi, F.; Amelio, I.; Tucci, P.; Annicchiarico-Petruzzelli, M.; Melino, G. Tissue-specific expression of p73 C-terminal isoforms in mice. Cell Cycle 2012, 11, 4474–4483. [Google Scholar] [CrossRef]
- Laubach, K.N.; Yan, W.; Kong, X.; Sun, W.; Chen, M.; Zhang, J.; Chen, X. p73α1, a p73 C-terminal isoform, regulates tumor suppression and the inflammatory response via Notch1. Proc. Natl. Acad. Sci. USA 2022, 119, e2123202119. [Google Scholar] [CrossRef]
- Ran, F.A.; Hsu, P.D.; Wright, J.; Agarwala, V.; Scott, D.A.; Zhang, F. Genome engineering using the CRISPR-Cas9 system. Nat. Protoc. 2013, 8, 2281–2308. [Google Scholar] [CrossRef]
- Chen, X.; Bargonetti, J.; Prives, C. p53, through p21 (WAF1/CIP1), Induces Cyclin D1 Synthesis. Cancer Res. 1995, 55, 4257–4263. [Google Scholar]
- Liu, G.; Xia, T.; Chen, X. The Activation Domains, the Proline-rich Domain, and the C-terminal Basic Domain in p53 Are Necessary for Acetylation of Histones on the Proximal p21 Promoter and Interaction with p300/CREB-binding Protein. J. Biol. Chem. 2003, 278, 17557–17565. [Google Scholar] [CrossRef]
- Matyash, V.; Liebisch, G.; Kurzchalia, T.V.; Shevchenko, A.; Schwudke, D. Lipid extraction by methyl-tert-butyl ether for high-throughput lipidomics. J. Lipid Res. 2008, 49, 1137–1146. [Google Scholar] [CrossRef]
- Folz, J.; Oh, Y.T.; Blaženović, I.; Richey, J.; Fiehn, O.; Youn, J.H. Interaction of Gut Microbiota and High-Sodium, Low-Potassium Diet in Altering Plasma Triglyceride Profiles Revealed by Lipidomics Analysis. Mol. Nutr. Food Res. 2019, 63, 1900752. [Google Scholar] [CrossRef] [PubMed]
- Showalter, M.R.; Nonnecke, E.B.; Linderholm, A.L.; Cajka, T.; Sa, M.R.; Lönnerdal, B.; Kenyon, N.J.; Fiehn, O. Obesogenic diets alter metabolism in mice. PLoS ONE 2018, 13, e0190632. [Google Scholar] [CrossRef] [PubMed]
- Rabow, Z.; Morningstar, T.; Showalter, M.; Heil, H.; Thongphanh, K.; Fan, S.; Chan, J.; Martínez-Cerdeño, V.; Berman, R.; Zagzag, D.; et al. Exposure to DMSO during infancy alters neurochemistry, social interactions, and brain morphology in long-evans rats. Brain Behav. 2021, 11, e02146. [Google Scholar] [CrossRef] [PubMed]
- Barupal, D.K.; Fiehn, O. Chemical Similarity Enrichment Analysis (ChemRICH) as alternative to biochemical pathway mapping for metabolomic datasets. Sci. Rep. 2017, 7, 14567. [Google Scholar] [CrossRef] [PubMed]
- Eichmann, T.O.; Lass, A. DAG tales: The multiple faces of diacylglycerol—Stereochemistry, metabolism, and signaling. Cell Mol. Life Sci. 2015, 72, 3931–3952. [Google Scholar] [CrossRef]
- Koundouros, N.; Poulogiannis, G. Reprogramming of fatty acid metabolism in cancer. Br. J. Cancer 2019, 122, 4–22. [Google Scholar] [CrossRef]
- Chen, M.; Huang, J. The expanded role of fatty acid metabolism in cancer: New aspects and targets. Precis. Clin. Med. 2019, 2, 183–191. [Google Scholar] [CrossRef]
- Nagarajan, S.R.; Butler, L.M.; Hoy, A.J. The diversity and breadth of cancer cell fatty acid metabolism. Cancer Metab. 2021, 9, 2. [Google Scholar] [CrossRef]
- Paton, C.M.; Ntambi, J.M. Biochemical and physiological function of stearoyl-CoA desaturase. Am. J. Physiol.-Endocrinol. Metab. 2009, 297, 28–37. [Google Scholar] [CrossRef]
- Nakamura, M.T.; Nara, T.Y. Structure, Function, and Dietary Regulation of Δ6, Δ5, and Δ9 Desaturases. Annu. Rev. Nutr. 2004, 24, 345–376. [Google Scholar] [CrossRef]
- Ntambi, J.M. The regulation of stearoyl-CoA desaturase (SCD). Prog. Lipid Res. 1995, 34, 139–150. [Google Scholar] [CrossRef]
- Enoch, H.G.; Catala, A.; Strittmatter, P. Mechanism of rat liver microsomal stearyl-CoA desaturase. Studies of the substrate specificity, enzyme-substrate interactions, and the function of lipid. J. Biol. Chem. 1976, 251, 5095–5103. [Google Scholar] [CrossRef]
- Burlingame, B.; Nishida, C.; Uauy, R.; Weisell, R. Fats and Fatty Acids in Human Nutrition: Introduction. Ann. Nutr. Metab. 2009, 55, 5–7. [Google Scholar] [CrossRef] [PubMed]
- Roongta, U.V.; Pabalan, J.G.; Wang, X.; Ryseck, R.P.; Fargnoli, J.; Henley, B.J.; Yang, W.P.; Zhu, J.; Madireddi, M.T.; Lawrence, R.M.; et al. Cancer cell dependence on unsaturated fatty acids implicates stearoyl-CoA desaturase as a target for cancer therapy. Mol. Cancer Res. 2011, 9, 1551–1561. [Google Scholar] [CrossRef]
- Igal, R.A. Stearoyl-coa desaturase-1: A novel key player in the mechanisms of cell proliferation, programmed cell death and transformation to cancer. Carcinogenesis 2010, 31, 1509–1515. [Google Scholar] [CrossRef] [PubMed]
- von Roemeling, C.A.; Marlow, L.A.; Radisky, D.C.; Rohl, A.; Larsen, H.E.; Wei, J.; Sasinowska, H.; Zhu, H.; Drake, R.; Sasinowski, M.; et al. Functional genomics identifies novel genes essential for clear cell renal cell carcinoma tumor cell proliferation and migration. Oncotarget 2014, 5, 5320–5334. [Google Scholar] [CrossRef]
- Kirschner, K.; Samarajiwa, S.A.; Cairns, J.M.; Menon, S.; Pérez-Mancera, P.A.; Tomimatsu, K.; Bermejo-Rodriguez, C.; Ito, Y.; Chandra, T.; Narita, M.; et al. Phenotype Specific Analyses Reveal Distinct Regulatory Mechanism for Chronically Activated p53. PLoS Genet. 2015, 11, e1005053. [Google Scholar] [CrossRef]
- Harms, K.; Nozell, S.; Chen, X. The common and distinct target genes of the p53 family transcription factors. C. Cell. Mol. Life Sci. 2004, 61, 822–842. [Google Scholar] [CrossRef]
- Luis, G.; Godfroid, A.; Nishiumi, S.; Cimino, J.; Blacher, S.; Maquoi, E.; Wery, C.; Collignon, A.; Longuespée, R.; Montero-Ruiz, L.; et al. Tumor resistance to ferroptosis driven by Stearoyl-CoA Desaturase-1 (SCD1) in cancer cells and Fatty Acid Biding Protein-4 (FABP4) in tumor microenvironment promote tumor recurrence. Redox Biol. 2021, 43, 102006. [Google Scholar] [CrossRef]
- Scott, J.S.; Nassar, Z.D.; Swinnen, J.V.; Butler, L.M. Monounsaturated Fatty Acids: Key Regulators of Cell Viability and Intracellular Signaling in Cancer. Mol. Cancer Res. 2022, 1–11. [Google Scholar] [CrossRef]
- Guo, S.; Wang, Y.; Zhou, D.; Li, Z. Significantly increased monounsaturated lipids relative to polyunsaturated lipids in six types of cancer microenvironment are observed by mass spectrometry imaging. Sci. Rep. 2014, 4, 5959. [Google Scholar] [CrossRef] [PubMed]
- Ackerman, D.; Simon, M.C. Hypoxia, lipids, and cancer: Surviving the harsh tumor microenvironment. Trends Cell Biol. 2014, 24, 472–478. [Google Scholar] [CrossRef] [PubMed]
- Vriens, K.; Christen, S.; Parik, S.; Broekaert, D.; Yoshinaga, K.; Talebi, A.; Dehairs, J.; Escalona-Noguero, C.; Schmieder, R.; Cornfield, T.; et al. Evidence for an alternative fatty acid desaturation pathway increasing cancer plasticity. Nature 2019, 566, 403–406. [Google Scholar] [CrossRef] [PubMed]
- Williams, P.E.; Klein, D.R.; Greer, S.M.; Brodbelt, J.S. Pinpointing Double Bond and sn-Positions in Glycerophospholipids via Hybrid 193 nm Ultraviolet Photodissociation (UVPD) Mass Spectrometry. J. Am. Chem. Soc. 2017, 139, 15681–15690. [Google Scholar] [CrossRef]
- Harris, R.A.; May, J.C.; Stinson, C.A.; Xia, Y.; McLean, J.A. Determining Double Bond Position in Lipids Using Online Ozonolysis Coupled to Liquid Chromatography and Ion Mobility-Mass Spectrometry. Anal. Chem. 2018, 90, 1915–1924. [Google Scholar] [CrossRef]
- Baba, T.; Ryumin, P.; Duchoslav, E.; Chen, K.; Chelur, A.; Loyd, B.; Chernushevich, I. Dissociation of Biomolecules by an Intense Low-Energy Electron Beam in a High Sensitivity Time-of-Flight Mass Spectrometer. J. Am. Soc. Mass Spectrom. 2021, 32, 1964–1975. [Google Scholar] [CrossRef]
- Carracedo, A.; Cantley, L.C.; Pandolfi, P.P. Cancer metabolism: Fatty acid oxidation in the limelight. Nat. Rev. Cancer 2013, 13, 227–232. [Google Scholar] [CrossRef]
- Manzo, T.; Prentice, B.M.; Anderson, K.G.; Raman, A.; Schalck, A.; Codreanu, G.S.; Lauson, C.B.N.; Tiberti, S.; Raimondi, A.; Jones, M.A.; et al. Accumulation of long-chain fatty acids in the tumor microenvironment drives dysfunction in intrapancreatic cd8+ t cells. J. Exp. Med. 2020, 217, e20191920. [Google Scholar] [CrossRef]
- Kim, J.A. Peroxisome Metabolism in Cancer. Cells 2020, 9, 1692. [Google Scholar] [CrossRef]
- Smith, R.E.; Lespi, P.; di Luca, M.; Bustos, C.; Marra, F.A.; de Alaniz, M.J.T.; Marra, C.A. A reliable biomarker derived from plasmalogens to evaluate malignancy and metastatic capacity of human cancers. Lipids 2008, 43, 79–89. [Google Scholar] [CrossRef]

Publisher’s Note: MDPI stays neutral with regard to jurisdictional claims in published maps and institutional affiliations. |
© 2022 by the authors. Licensee MDPI, Basel, Switzerland. This article is an open access article distributed under the terms and conditions of the Creative Commons Attribution (CC BY) license (https://creativecommons.org/licenses/by/4.0/).
Share and Cite
Rabow, Z.; Laubach, K.; Kong, X.; Shen, T.; Mohibi, S.; Zhang, J.; Fiehn, O.; Chen, X. p73α1, an Isoform of the p73 Tumor Suppressor, Modulates Lipid Metabolism and Cancer Cell Growth via Stearoyl-CoA Desaturase-1. Cells 2022, 11, 2516. https://doi.org/10.3390/cells11162516
Rabow Z, Laubach K, Kong X, Shen T, Mohibi S, Zhang J, Fiehn O, Chen X. p73α1, an Isoform of the p73 Tumor Suppressor, Modulates Lipid Metabolism and Cancer Cell Growth via Stearoyl-CoA Desaturase-1. Cells. 2022; 11(16):2516. https://doi.org/10.3390/cells11162516
Chicago/Turabian StyleRabow, Zachary, Kyra Laubach, Xiangmudong Kong, Tong Shen, Shakur Mohibi, Jin Zhang, Oliver Fiehn, and Xinbin Chen. 2022. "p73α1, an Isoform of the p73 Tumor Suppressor, Modulates Lipid Metabolism and Cancer Cell Growth via Stearoyl-CoA Desaturase-1" Cells 11, no. 16: 2516. https://doi.org/10.3390/cells11162516
APA StyleRabow, Z., Laubach, K., Kong, X., Shen, T., Mohibi, S., Zhang, J., Fiehn, O., & Chen, X. (2022). p73α1, an Isoform of the p73 Tumor Suppressor, Modulates Lipid Metabolism and Cancer Cell Growth via Stearoyl-CoA Desaturase-1. Cells, 11(16), 2516. https://doi.org/10.3390/cells11162516