
Co-Expression Analysis of microRNAs and Proteins in Brain of Alzheimer’s Disease Patients

 , , ,
, , ,  ,
,  , and
, and 
Abstract
:1. Introduction
2. Materials and Methods
2.1. Sample Population
2.2. MicroRNA Analysis
2.2.1. RNA Extraction and Analysis
2.2.2. Statistical Analysis
2.2.3. MiRNA Targets and Pathways Analysis
2.3. Protein Analysis
2.3.1. Protein Extraction and Analysis
2.3.2. Data Acquisition and Statistical Analysis
2.3.3. Pathway Analysis
2.4. Pathway Studio
3. Results
3.1. Demographic Characteristics
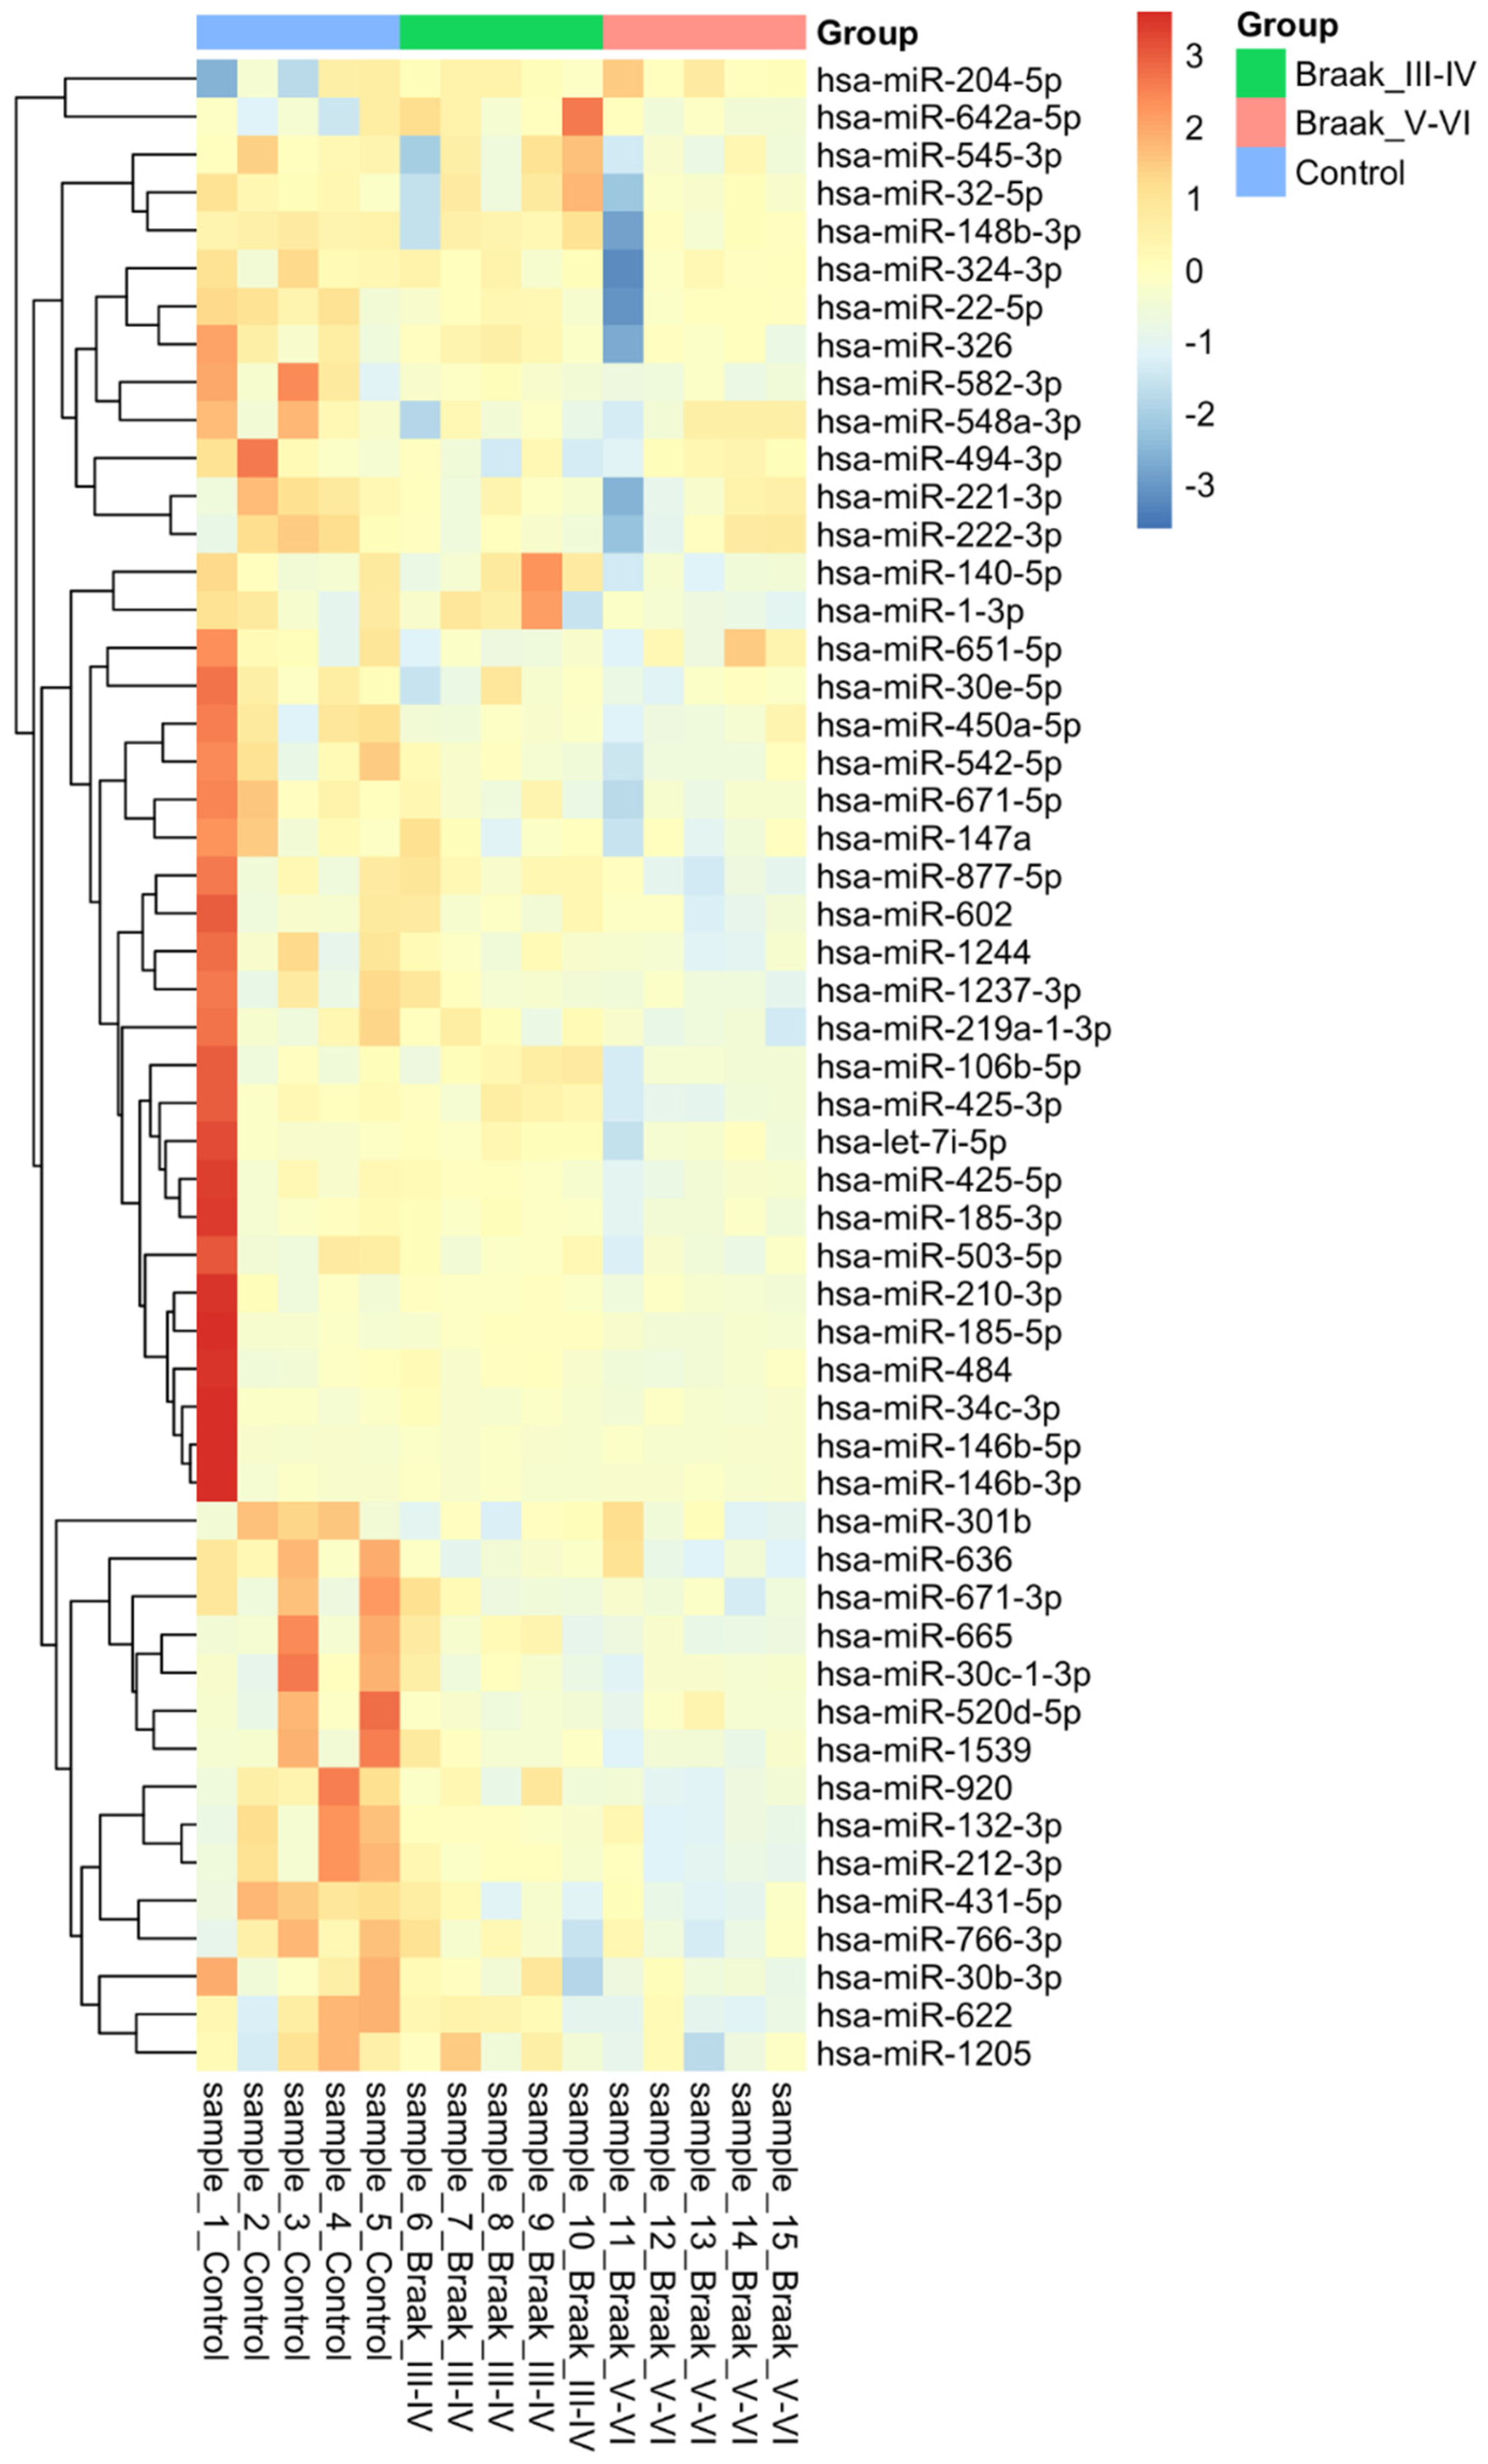
3.2. MicroRNA Analysis
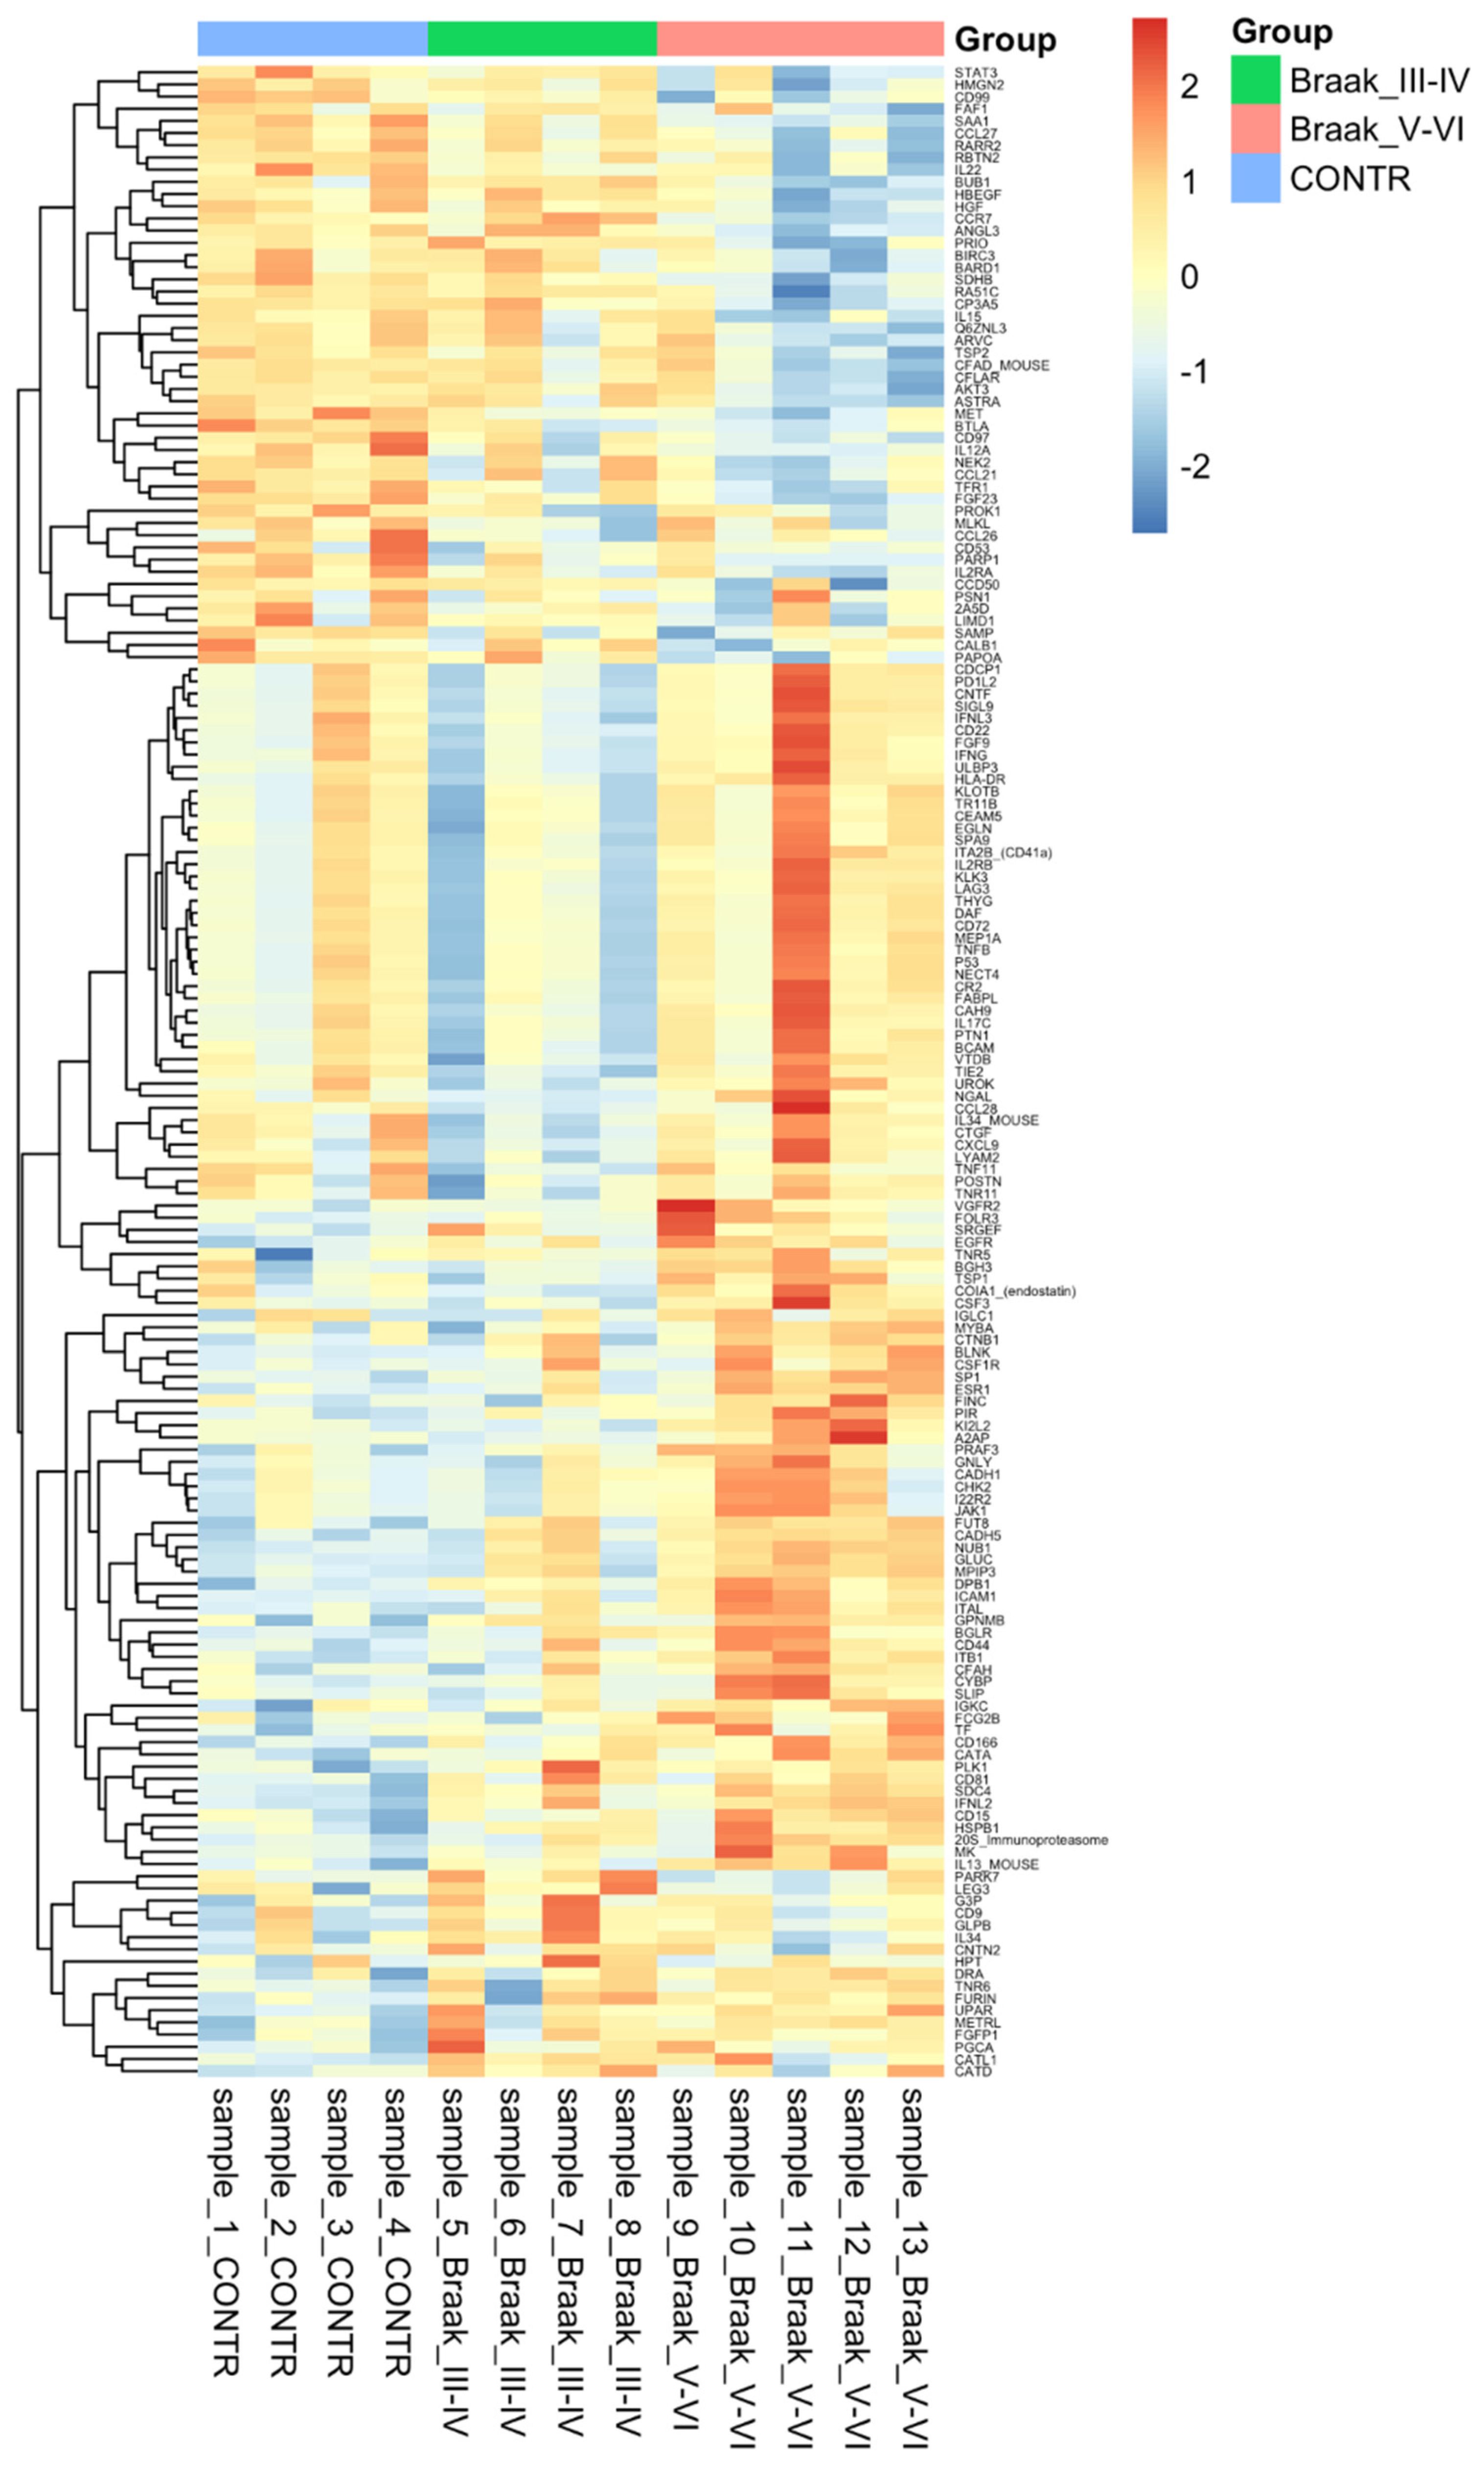
3.3. Protein Analysis
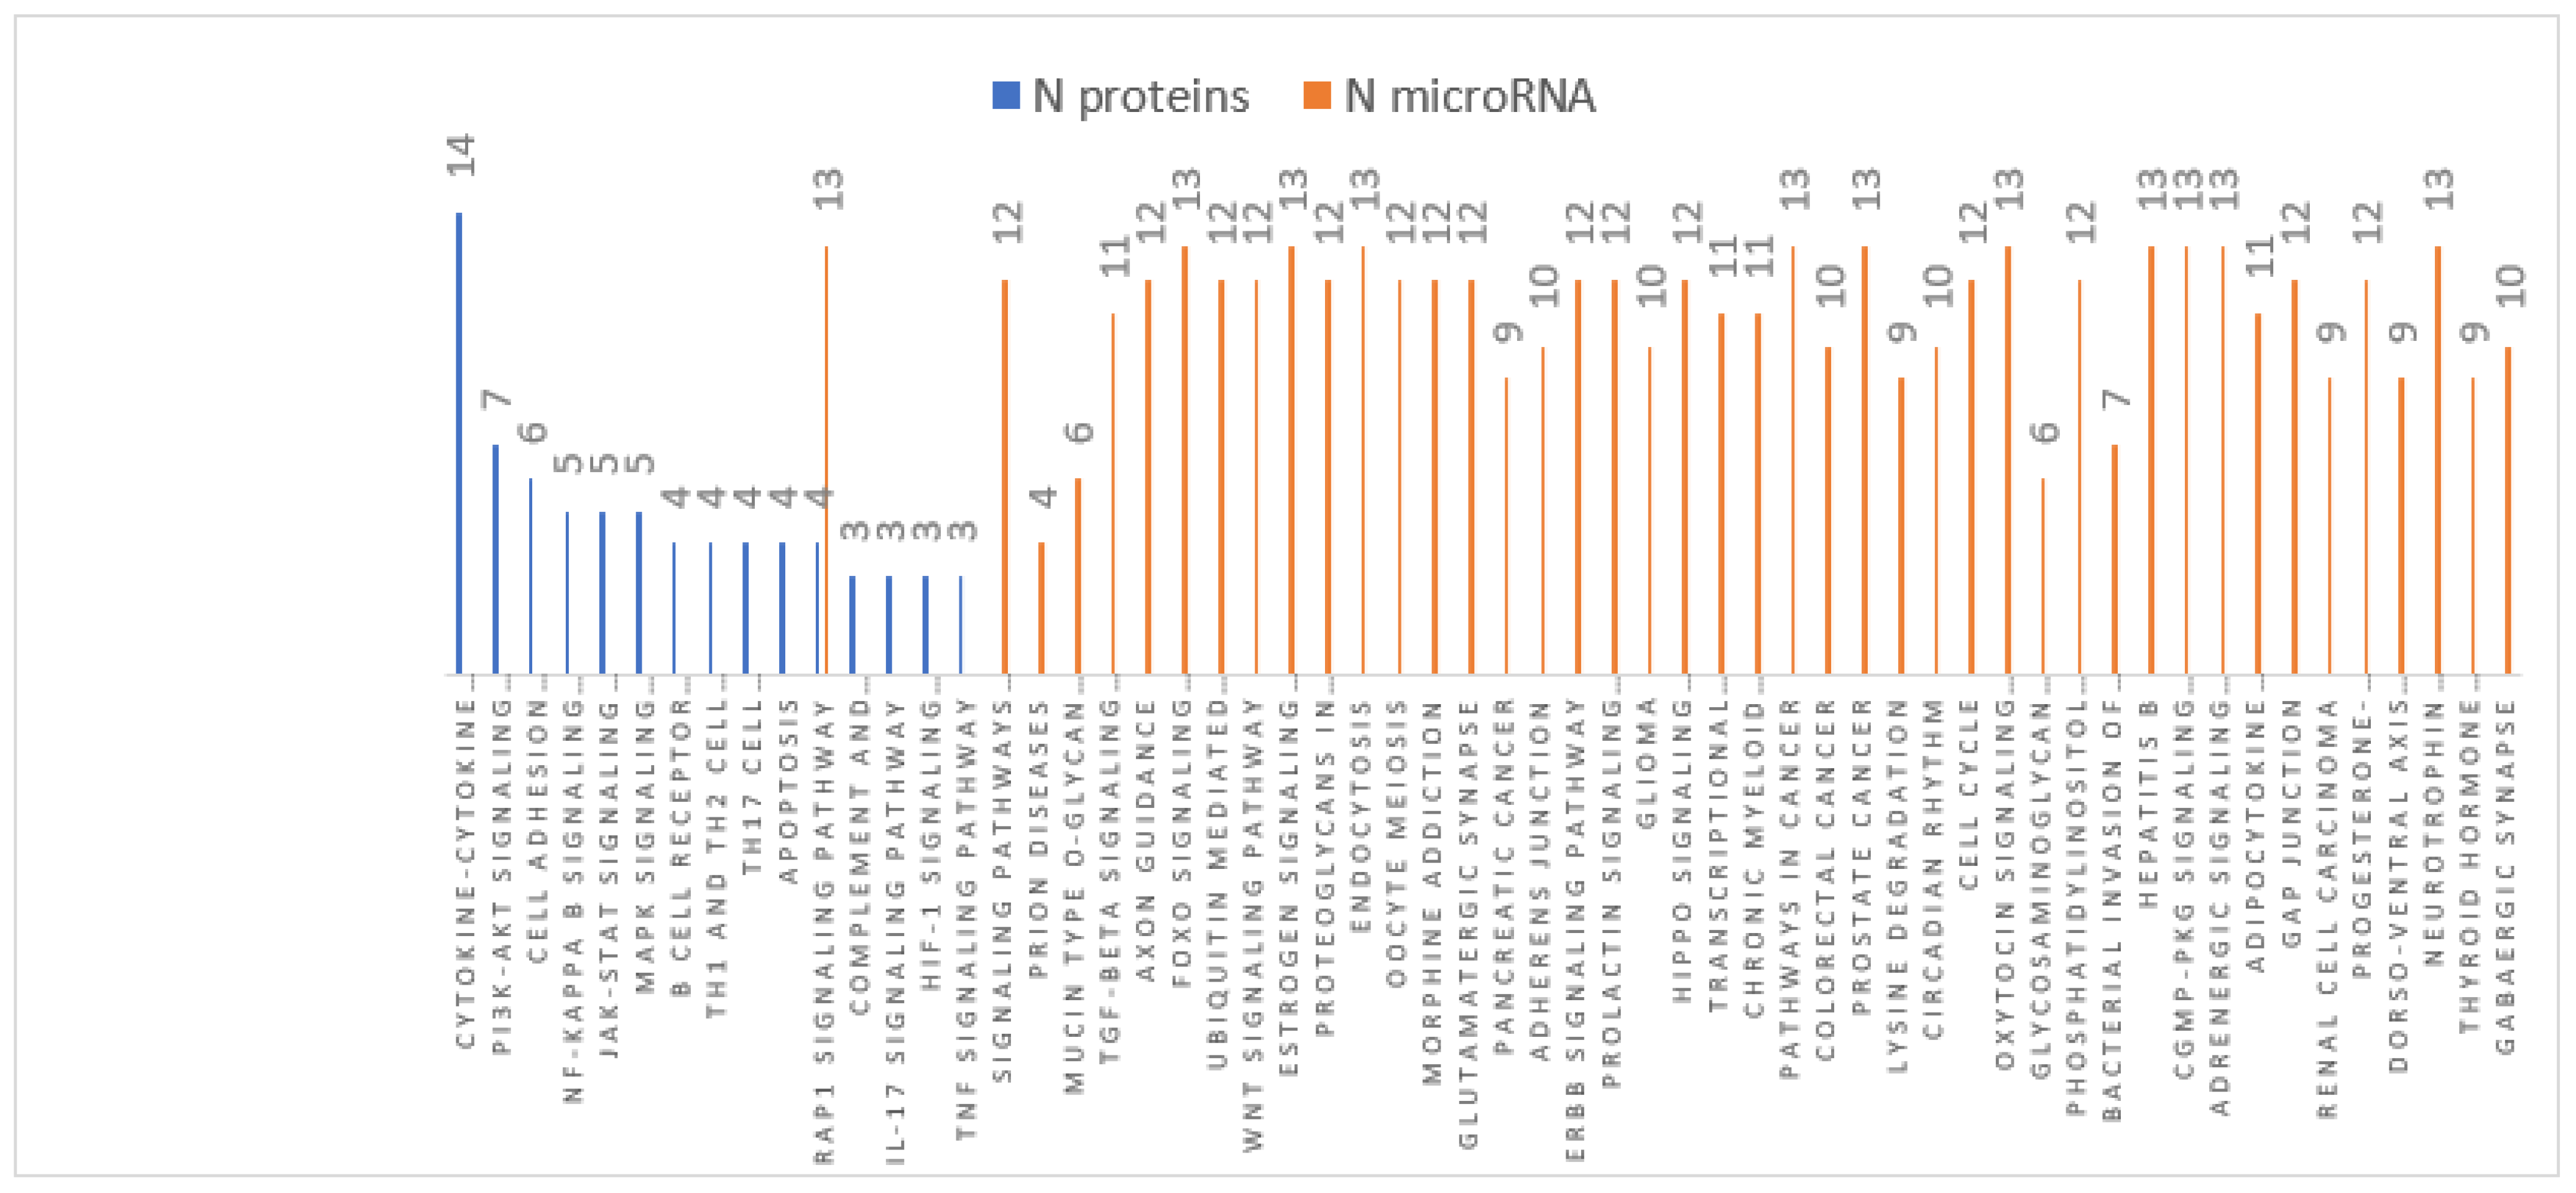
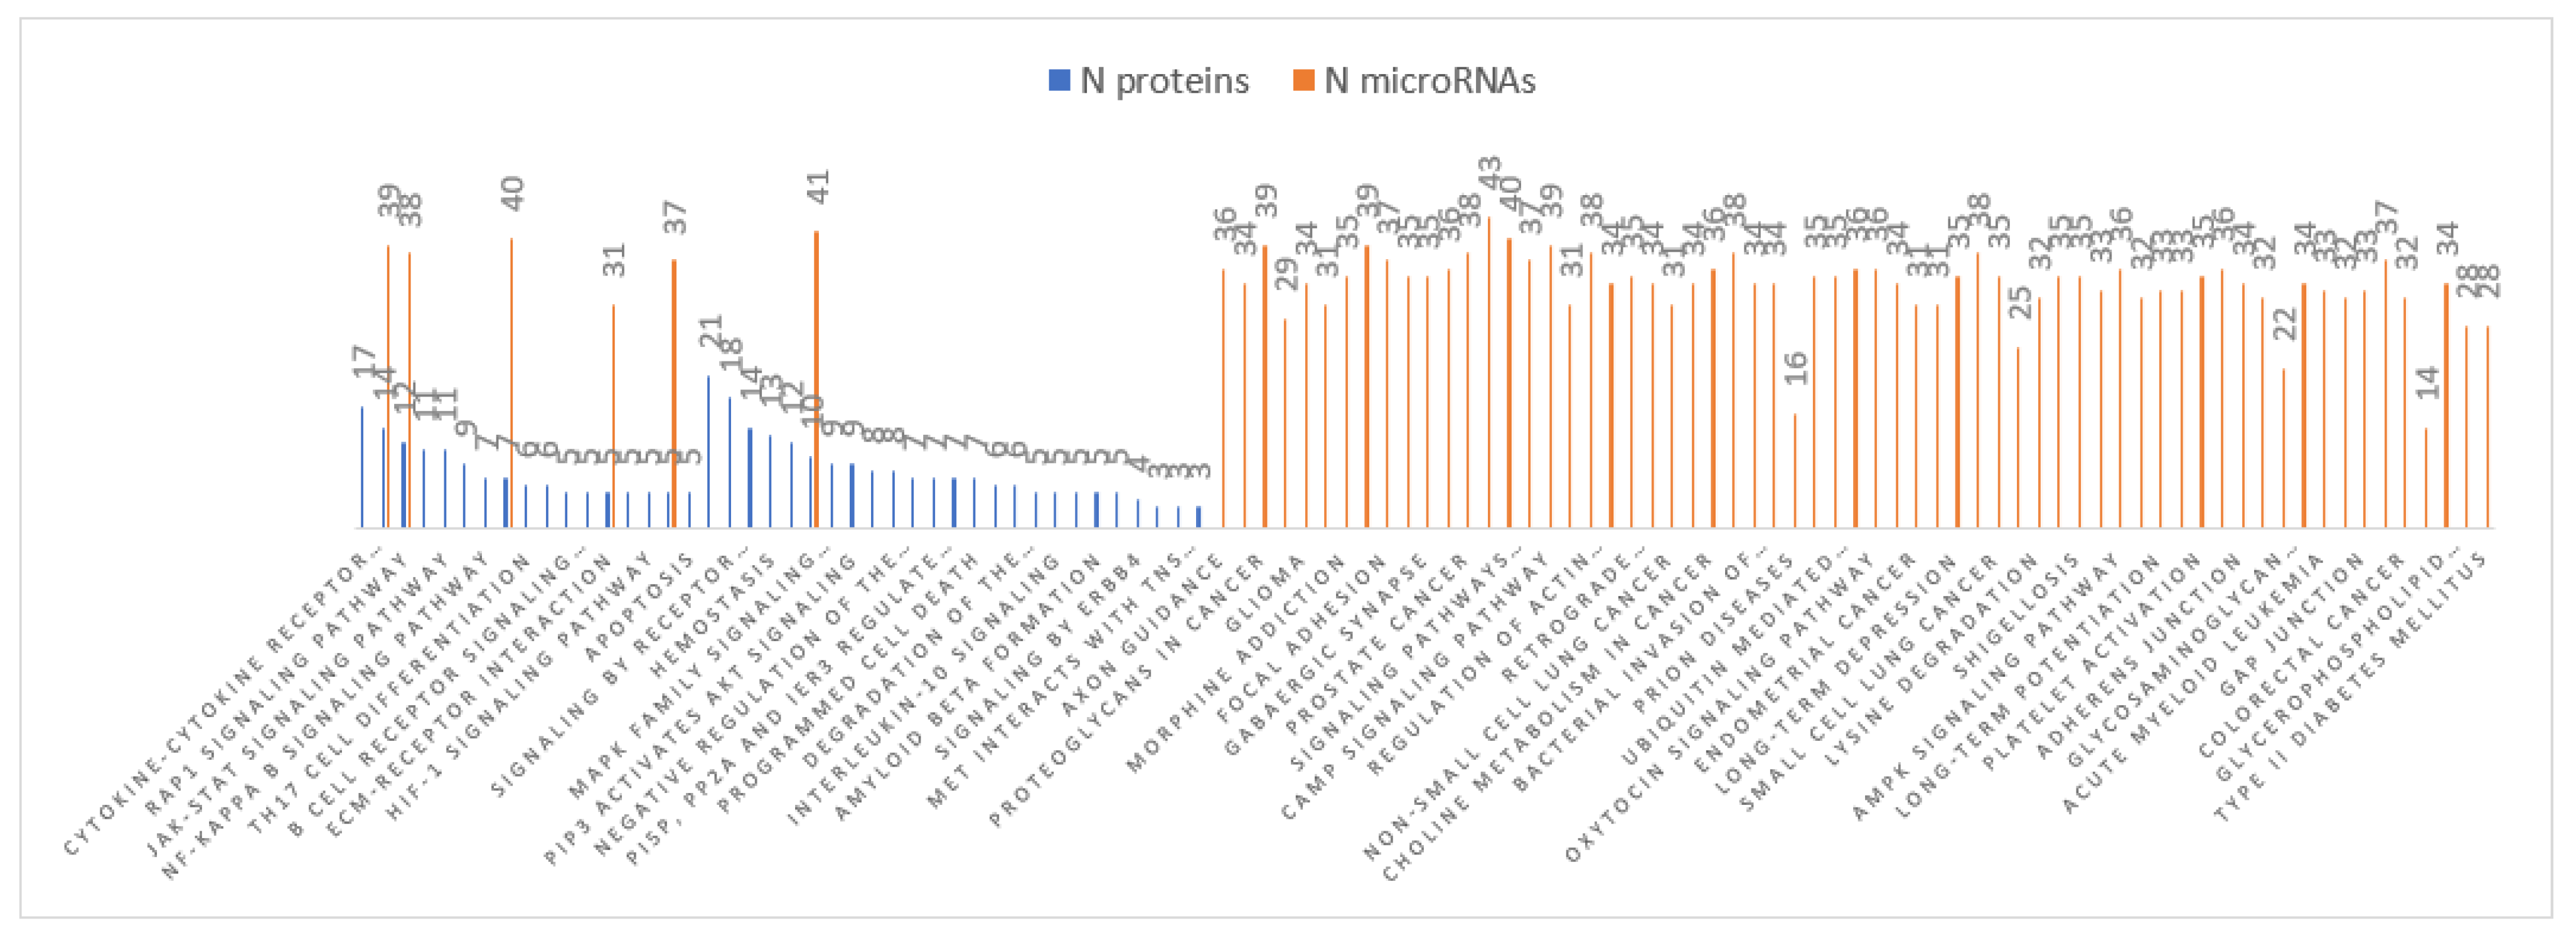
3.4. MiRNA Target and Pathways Analysis
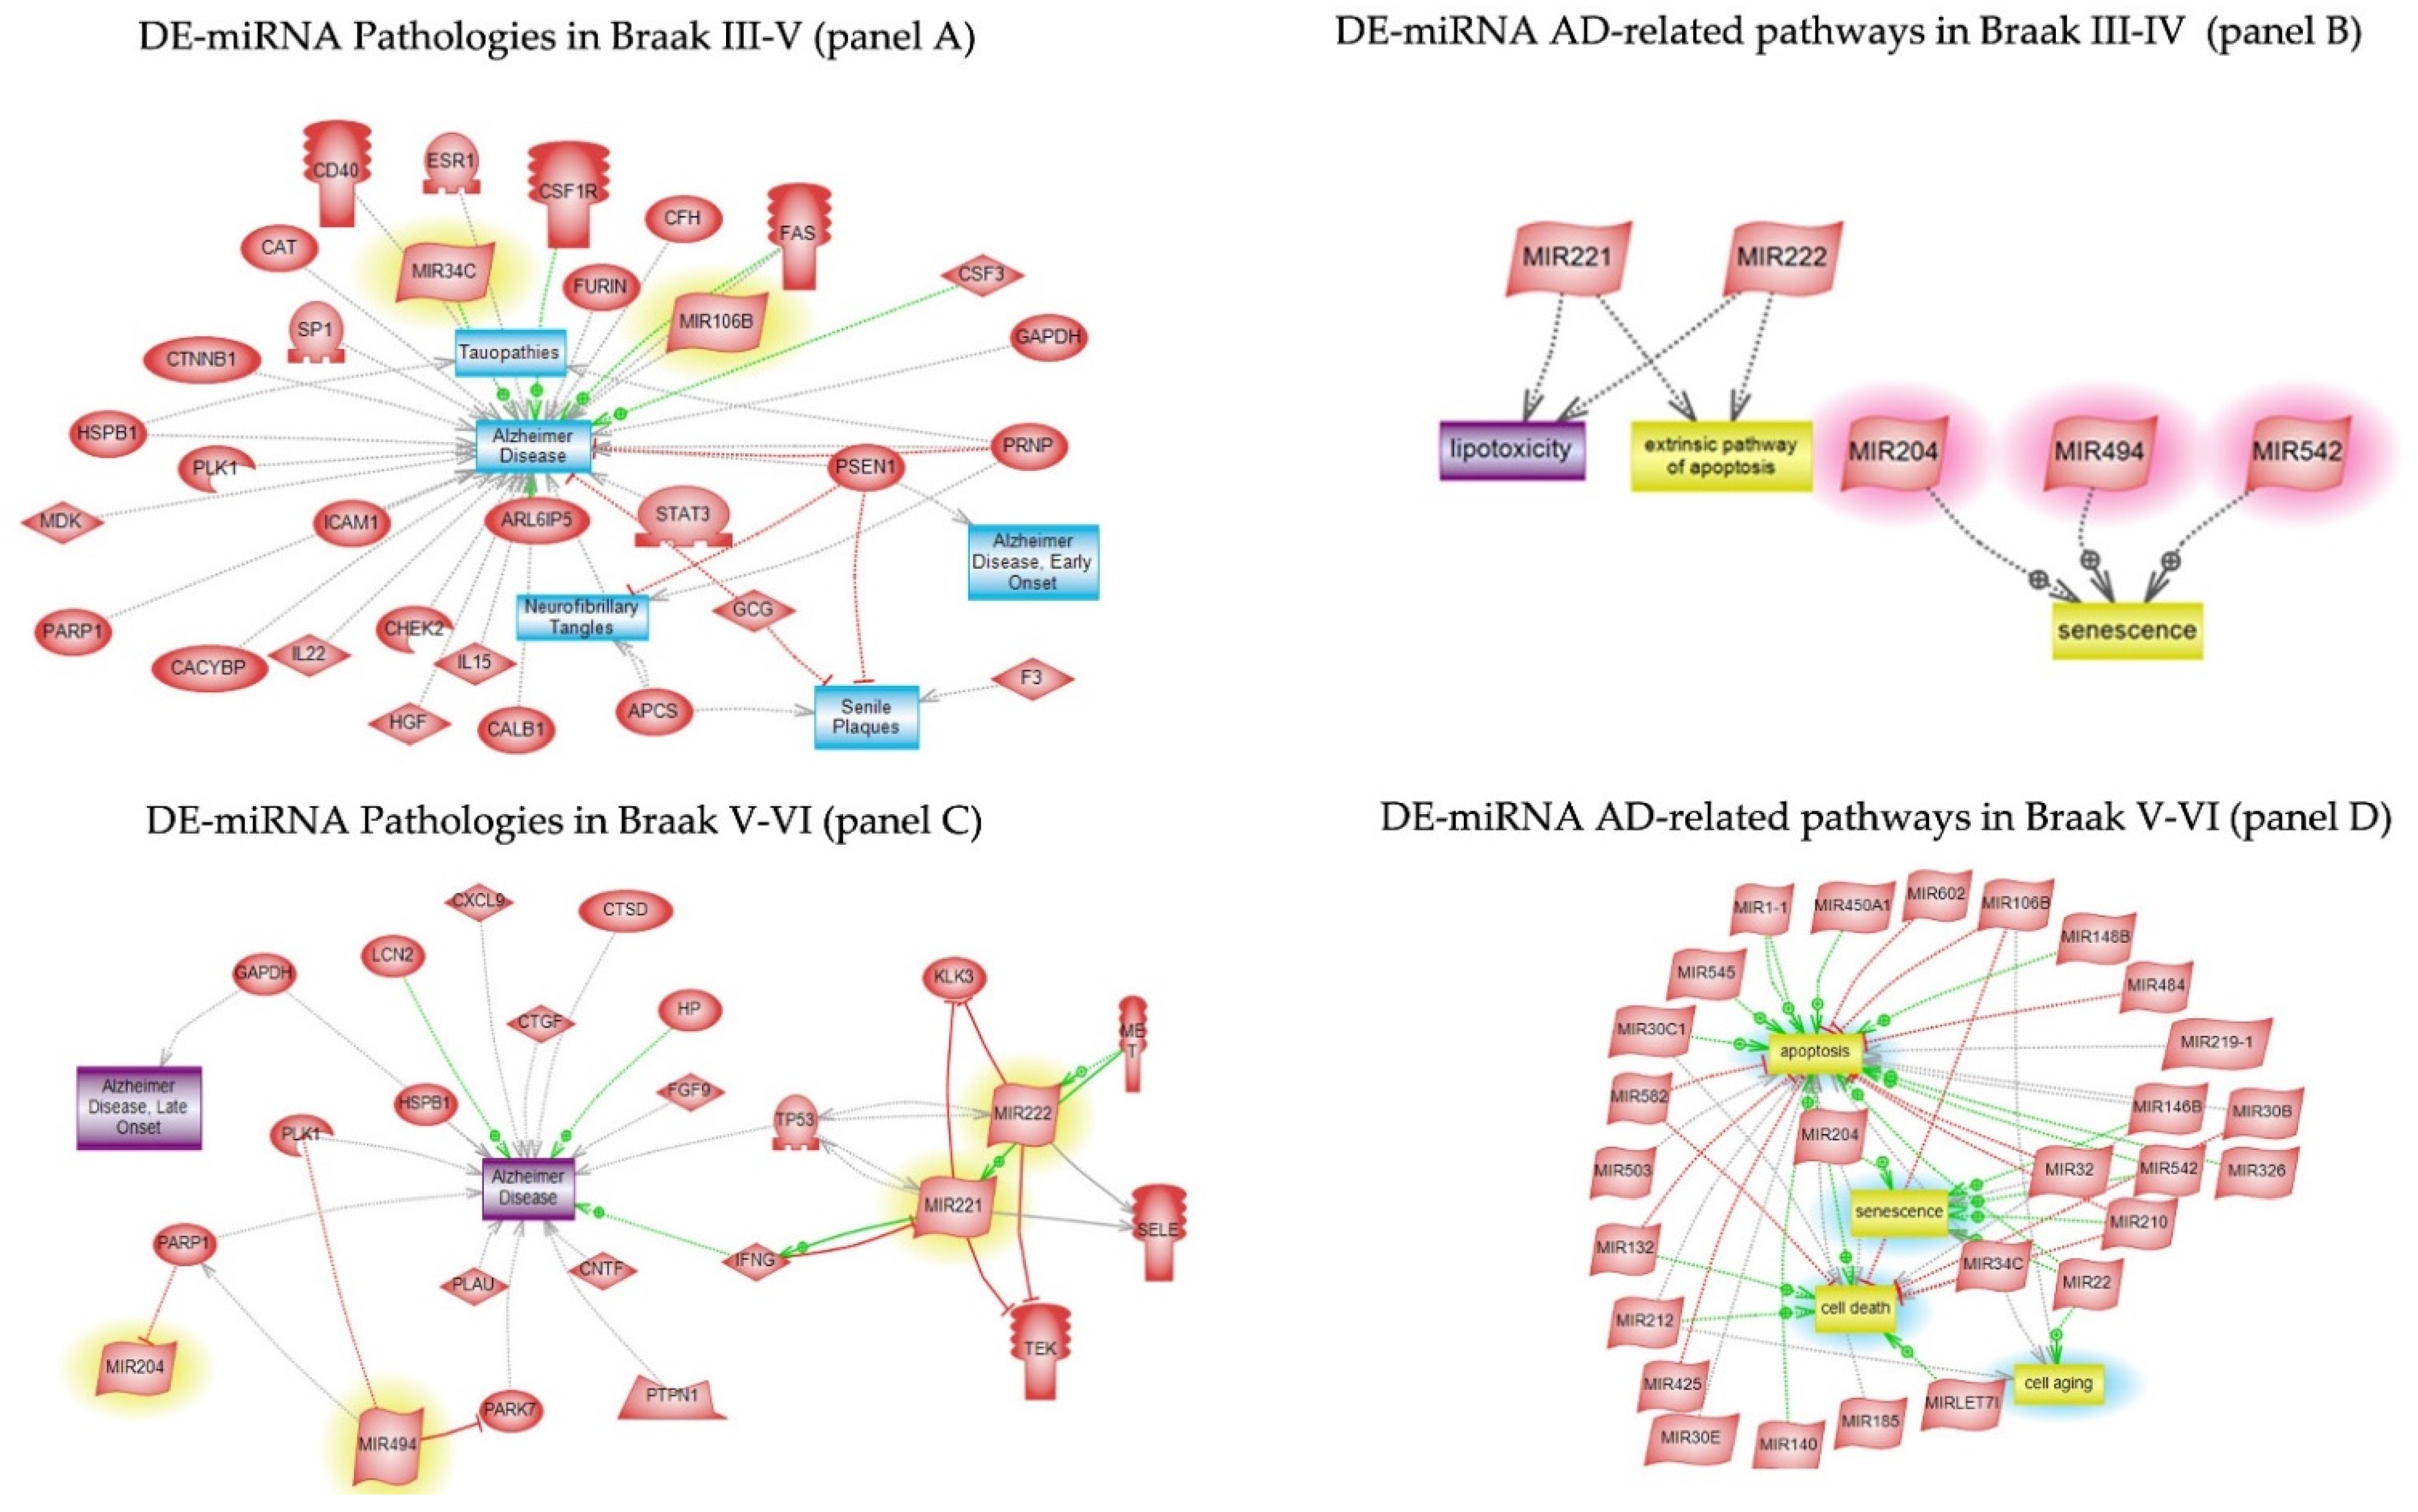
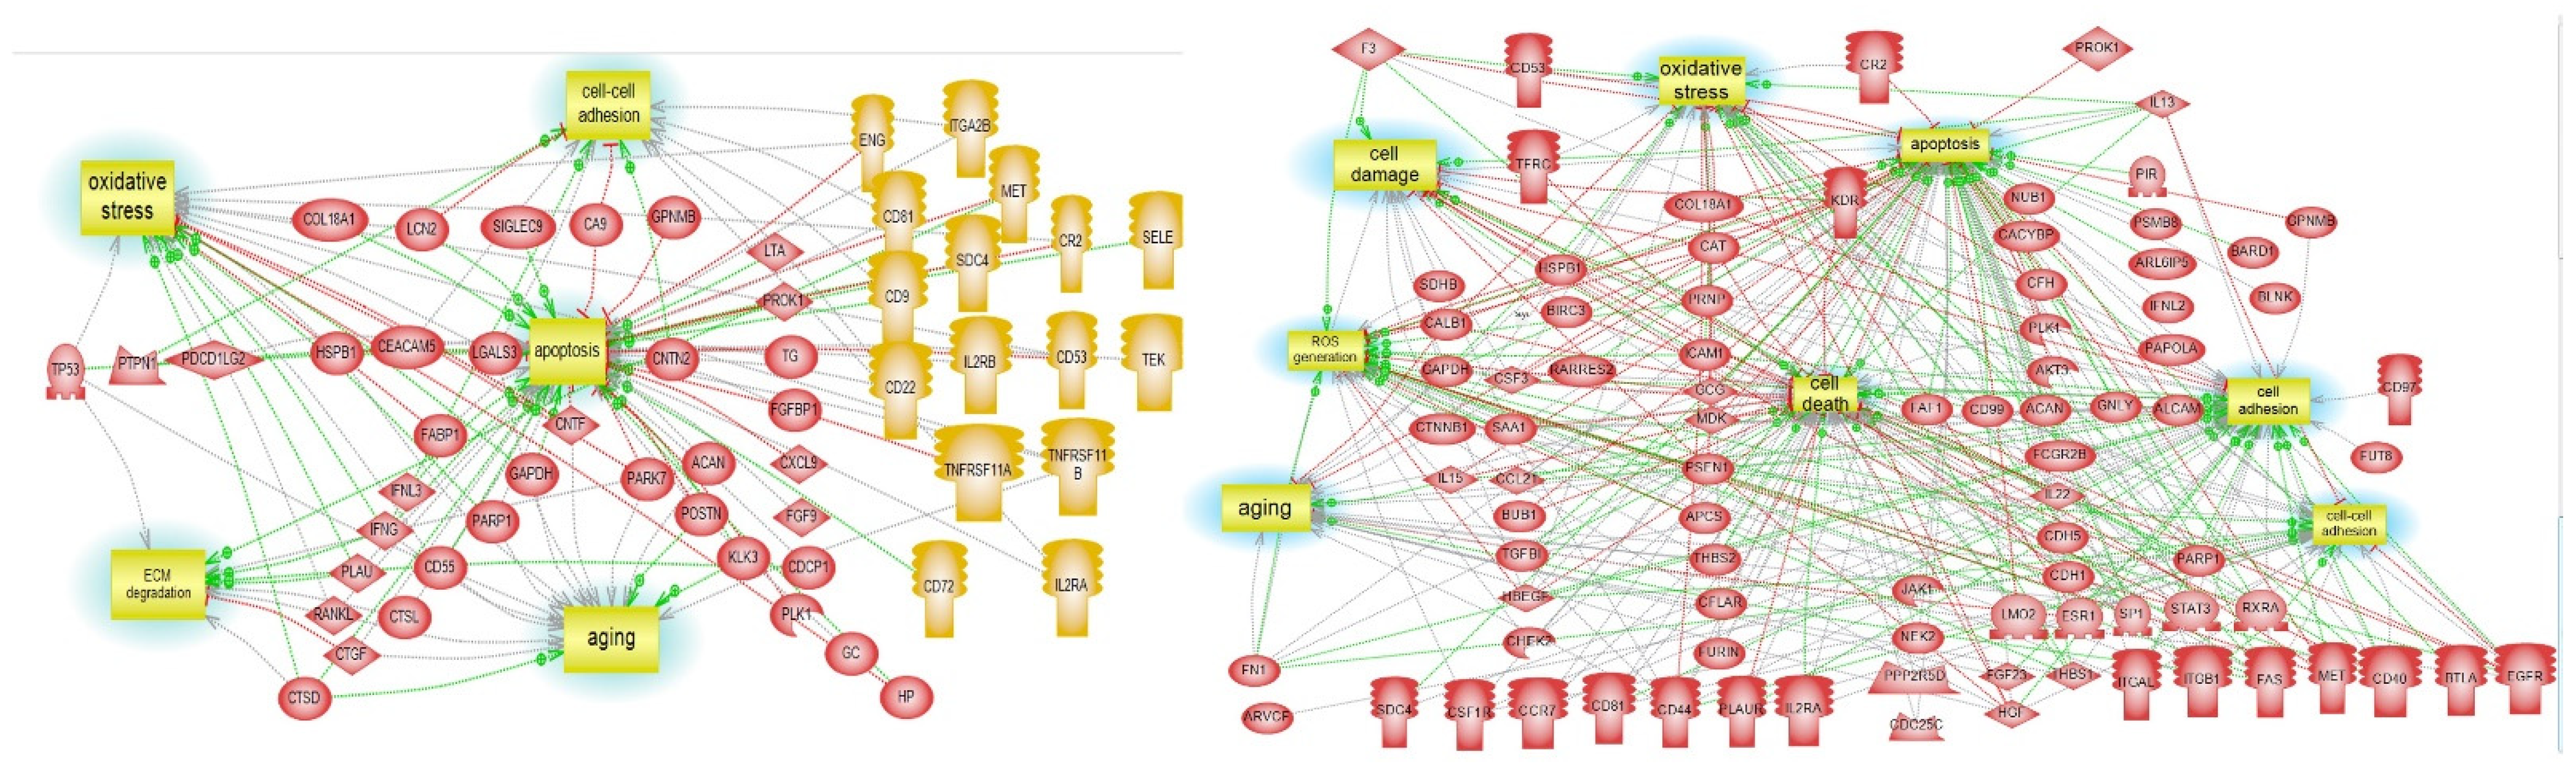
3.5. Pathway Studio
4. Discussion
Limitations
5. Conclusions
Supplementary Materials
Author Contributions
Funding
Institutional Review Board Statement
Data Availability Statement
Acknowledgments
Conflicts of Interest
References
- Dementia. Available online: https://www.who.int/news-room/fact-sheets/detail/dementia (accessed on 18 April 2021).
- Nichols, E.; Szoeke, C.E.I.; Vollset, S.E.; Abbasi, N.; Abd-Allah, F.; Abdela, J.; Aichour, M.T.E.; Akinyemi, R.O.; Alahdab, F.; Asgedom, S.W.; et al. Global, Regional, and National Burden of Alzheimer’s Disease and Other Dementias, 1990–2016: A Systematic Analysis for the Global Burden of Disease Study 2016. Lancet Neurol. 2019, 18, 88–106. [Google Scholar] [CrossRef] [Green Version]
- Worldwide Dementia Cases to Triple by 2050. Available online: https://www.alzheimersresearchuk.org/worldwide-dementia-cases-to-triple-by-2050 (accessed on 18 April 2021).
- Kim, J.; Basak, J.M.; Holtzman, D.M. The Role of Apolipoprotein E in Alzheimer’s disease. Neuron 2009, 63, 287–303. [Google Scholar] [CrossRef] [PubMed] [Green Version]
- Bekris, L.M.; Yu, C.-E.; Bird, T.D.; Tsuang, D.W. Review Article: Genetics of Alzheimer Disease. J. Geriatr. Psychiatry Neurol. 2010, 23, 213–227. [Google Scholar] [CrossRef] [PubMed] [Green Version]
- Lane, C.A.; Hardy, J.; Schott, J.M. Alzheimer’s Disease. Eur. J. Neurol. 2017, 25, 59–70. [Google Scholar] [CrossRef] [PubMed]
- McKhann, G.M.; Knopman, D.S.; Chertkow, H.; Hyman, B.T.; Jack, C.R.; Kawas, C.H.; Klunk, W.E.; Koroshetz, W.J.; Manly, J.J.; Mayeux, R.; et al. The Diagnosis of Dementia due to Alzheimer’s Disease: Recommendations from the National Institute on Aging-Alzheimer’s Association Workgroups on Diagnostic Guidelines for Alzheimer’s Disease. Alzheimer’s Dement. 2011, 7, 263–269. [Google Scholar] [CrossRef] [PubMed] [Green Version]
- Braak, H.; Braak, E. Neuropathological Stageing of Alzheimer-Related Changes. Acta Neuropathol. 1991, 82, 239–259. [Google Scholar] [CrossRef] [PubMed]
- Rubin, R. Recently Approved Alzheimer Drug Raises Questions That Might Never Be Answered. JAMA 2021, 326, 469–472. [Google Scholar] [CrossRef]
- Zhang, Y.; Wang, Z.; Gemeinhart, R.A. Progress in MicroRNA Delivery. J. Control. Release 2013, 172, 962–974. [Google Scholar] [CrossRef] [PubMed] [Green Version]
- Ohno, S.; Takanashi, M.; Sudo, K.; Ueda, S.; Ishikawa, A.; Matsuyama, N.; Fujita, K.; Mizutani, T.; Ohgi, T.; Ochiya, T.; et al. Systemically Injected Exosomes Targeted to EGFR Deliver Antitumor MicroRNA to Breast Cancer Cells. Mol. Ther. 2013, 21, 185–191. [Google Scholar] [CrossRef] [Green Version]
- Wang, X.; Yu, B.; Ren, W.; Mo, X.; Zhou, C.; He, H.; Jia, H.; Wang, L.; Jacob, S.T.; Lee, R.J.; et al. Enhanced Hepatic Delivery of SiRNA and MicroRNA Using Oleic Acid Based Lipid Nanoparticle Formulations. J. Control. Release 2013, 172, 690–698. [Google Scholar] [CrossRef]
- Davis, S. Improved Targeting of MiRNA with Antisense Oligonucleotides. Nucleic Acids Res. 2006, 34, 2294–2304. [Google Scholar] [CrossRef] [PubMed]
- Herrera-Carrillo, E.; Liu, Y.P.; Berkhout, B. Improving MiRNA Delivery by Optimizing MiRNA Expression Cassettes in Diverse Virus Vectors. Hum. Gene Ther. Methods 2017, 28, 177–190. [Google Scholar] [CrossRef] [PubMed]
- Vaughan, H.J.; Green, J.J.; Tzeng, S.Y. Cancer-Targeting Nanoparticles for Combinatorial Nucleic Acid Delivery. Adv. Mater. 2019, 32, 1901081. [Google Scholar] [CrossRef] [PubMed]
- Torchilin, V.P. Recent Advances with Liposomes as Pharmaceutical Carriers. Nat. Rev. Drug Discov. 2005, 4, 145–160. [Google Scholar] [CrossRef]
- Fernandez, C.A.; Rice, K.G. Engineered Nanoscaled Polyplex Gene Delivery Systems. Mol. Pharm. 2009, 6, 1277–1289. [Google Scholar] [CrossRef]
- Calin, G.A.; Dumitru, C.D.; Shimizu, M.; Bichi, R.; Zupo, S.; Noch, E.; Aldler, H.; Rattan, S.; Keating, M.; Rai, K.; et al. Nonlinear Partial Differential Equations and Applications: Frequent Deletions and Down-Regulation of Micro- RNA Genes MiR15 and MiR16 at 13q14 in Chronic Lymphocytic Leukemia. Proc. Natl. Acad. Sci. USA 2002, 99, 15524–15529. [Google Scholar] [CrossRef] [Green Version]
- Liu, W.; Liu, C.; Zhu, J.; Shu, P.; Yin, B.; Gong, Y.; Qiang, B.; Yuan, J.; Peng, X. MicroRNA-16 Targets Amyloid Precursor Protein to Potentially Modulate Alzheimer’s-Associated Pathogenesis in SAMP8 Mice. Neurobiol. Aging. 2012, 33, 522–534. [Google Scholar] [CrossRef]
- Barbato, C.; Pezzola, S.; Caggiano, C.; Antonelli, M.; Frisone, P.; Ciotti, M.T.; Ruberti, F. A Lentiviral Sponge for MiR-101 Regulates RanBP9 Expression and Amyloid Precursor Protein Metabolism in Hippocampal Neurons. Front. Cell. Neurosci. 2014, 8, 37. [Google Scholar] [CrossRef] [Green Version]
- Makeyev, E.V.; Zhang, J.; Carrasco, M.A.; Maniatis, T. The MicroRNA MiR-124 Promotes Neuronal Differentiation by Triggering Brain-Specific Alternative Pre-MRNA Splicing. Mol. Cell 2007, 27, 435–448. [Google Scholar] [CrossRef] [Green Version]
- Hebert, S.S.; Horre, K.; Nicolai, L.; Papadopoulou, A.S.; Mandemakers, W.; Silahtaroglu, A.N.; Kauppinen, S.; Delacourte, A.; De Strooper, B. Loss of MicroRNA Cluster MiR-29a/B-1 in Sporadic Alzheimer’s Disease Correlates with Increased BACE1/ -Secretase Expression. Proc. Natl. Acad. Sci. USA 2008, 105, 6415–6420. [Google Scholar] [CrossRef] [Green Version]
- Yang, G.; Song, Y.; Zhou, X.; Deng, Y.; Liu, T.; Weng, G.; Yu, D.; Pan, S. MicroRNA-29c Targets β-Site Amyloid Precursor Protein-Cleaving Enzyme 1 and Has a Neuroprotective Role in Vitro and in Vivo. Mol. Med. Rep. 2015, 12, 3081–3088. [Google Scholar] [CrossRef] [Green Version]
- Zhang, J.; Hu, M.; Teng, Z.; Tang, Y.-P.; Chen, C. Synaptic and Cognitive Improvements by Inhibition of 2-AG Metabolism Are through Upregulation of MicroRNA-188-3p in a Mouse Model of Alzheimer’s Disease. J. Neurosci. 2014, 34, 14919–14933. [Google Scholar] [CrossRef] [Green Version]
- Long, J.M.; Ray, B.; Lahiri, D.K. MicroRNA-339-5p Down-Regulates Protein Expression of β-Site Amyloid Precursor Protein-Cleaving Enzyme 1 (BACE1) in Human Primary Brain Cultures and Is Reduced in Brain Tissue Specimens of Alzheimer Disease Subjects. J. Biol. Chem. 2013, 289, 5184–5198. [Google Scholar] [CrossRef] [Green Version]
- Ai, J.; Sun, L.-H.; Che, H.; Zhang, R.; Zhang, T.-Z.; Wu, W.-C.; Su, X.-L.; Chen, X.; Yang, G.; Li, K.; et al. MicroRNA-195 Protects against Dementia Induced by Chronic Brain Hypoperfusion via Its Anti-Amyloidogenic Effect in Rats. J. Neurosci. 2013, 33, 3989–4001. [Google Scholar] [CrossRef] [PubMed]
- Kim, J.; Yoon, H.; Chung, D.; Brown, J.L.; Belmonte, K.C.; Kim, J. MiR-186 Is Decreased in Aged Brain and Suppresses BACE1 Expression. J. Neurochem. 2016, 137, 436–445. [Google Scholar] [CrossRef] [PubMed] [Green Version]
- Fang, M.; Wang, J.; Zhang, X.; Geng, Y.; Hu, Z.; Rudd, J.A.; Ling, S.; Chen, W.; Han, S. The MiR-124 Regulates the Expression of BACE1/β-Secretase Correlated with Cell Death in Alzheimer’s Disease. Toxicol. Lett. 2012, 209, 94–105. [Google Scholar] [CrossRef]
- Smith, P.Y.; Hernandez-Rapp, J.; Jolivette, F.; Lecours, C.; Bisht, K.; Goupil, C.; Dorval, V.; Parsi, S.; Morin, F.; Planel, E.; et al. MiR-132/212 Deficiency Impairs Tau Metabolism and Promotes Pathological Aggregationin Vivo. Hum. Mol. Genet. 2015, 24, 6721–6735. [Google Scholar] [CrossRef] [Green Version]
- Bhaskaran, M.; Mohan, M. MicroRNAs. Vet. Pathol. 2013, 51, 759–774. [Google Scholar] [CrossRef] [PubMed] [Green Version]
- Wei, W.; Wang, Z.Y.; Ma, L.N.; Zhang, T.T.; Cao, Y.; Li, H. MicroRNAs in Alzheimer’s Disease: Function and potential application as diagnostics biomarkers. Font. Mol. Neuorsci. 2020, 13, 160. [Google Scholar] [CrossRef] [PubMed]
- Yuen, S.C.; Liang, X.; Zhu, H.; Jia, Y.; Leung, S.W. Prediction of differentially expressed microRNAs in blood as potential biomarkers for Alzheimer’s disease by meta-analysis and adaptive boosting ensemble learning. Alzheimers Res. Ther. 2021, 13, 126. [Google Scholar] [CrossRef]
- Wang, W.X.; Fardo, D.W.; Jicha, G.A.; Nelson, P.T. A Customized Quantitative PCR MicroRNA Panel Provides a Technically Robust Context for Studying Neurodegenerative Disease Biomarkers and Indicates a High Correlation between Cerebrospinal Fluid and Choroid Plexus MicroRNA Expression. Mol. Neurobiol. 2016, 54, 8191–8202. [Google Scholar] [CrossRef] [PubMed]
- Chiu, C.-C.; Yeh, T.-H.; Chen, R.-S.; Chen, H.-C.; Huang, Y.-Z.; Weng, Y.-H.; Cheng, Y.-C.; Liu, Y.-C.; Cheng, A.-J.; Lu, Y.-C.; et al. Upregulated Expression of MicroRNA-204-5p Leads to the Death of Dopaminergic Cells by Targeting DYRK1A-Mediated Apoptotic Signaling Cascade. Front. Cell. Neurosci. 2019, 13, 399. [Google Scholar] [CrossRef] [Green Version]
- Bos, J.L. Linking Rap to Cell Adhesion. Curr. Opin. Cell Biol. 2005, 17, 123–128. [Google Scholar] [CrossRef] [PubMed]
- Kim, C.; Ye, F.; Ginsberg, M.H. Regulation of Integrin Activation. Annu. Rev. Cell Dev. Biol. 2011, 27, 321–345. [Google Scholar] [CrossRef] [PubMed]
- Dumbacher, M.; Van Dooren, T.; Princen, K.; De Witte, K.; Farinelli, M.; Lievens, S.; Tavernier, J.; Dehaen, W.; Wera, S.; Winderickx, J.; et al. Modifying Rap1-Signalling by Targeting Pde6δ Is Neuroprotective in Models of Alzheimer’s Disease. Mol. Neurodegener. 2018, 13, 50. [Google Scholar] [CrossRef]
- Frantz, C.; Stewart, K.M.; Weaver, V.M. The Extracellular Matrix at a Glance. J. Cell Sci. 2010, 123, 4195–4200. [Google Scholar] [CrossRef] [PubMed] [Green Version]
- Hubert, T.; Grimal, S.; Carroll, P.; Fichard-Carroll, A. Collagens in the Developing and Diseased Nervous System. Cell. Mol. Life Sci. 2008, 66, 1223–1238. [Google Scholar] [CrossRef]
- Barros, C.S.; Franco, S.J.; Muller, U. Extracellular Matrix: Functions in the Nervous System. Cold Spring Harb. Perspect. Biol. 2010, 3, a005108. [Google Scholar] [CrossRef] [PubMed] [Green Version]
- Vieira, M.S.; Santos, A.K.; Vasconcellos, R.; Goulart, V.A.M.; Parreira, R.C.; Kihara, A.H.; Ulrich, H.; Resende, R.R. Neural Stem Cell Differentiation into Mature Neurons: Mechanisms of Regulation and Biotechnological Applications. Biotechnol. Adv. 2018, 36, 1946–1970. [Google Scholar] [CrossRef]
- Song, I.; Dityatev, A. Crosstalk between Glia, Extracellular Matrix and Neurons. Brain Res. Bull. 2018, 136, 101–108. [Google Scholar] [CrossRef]
- Fawcett, J.W.; Oohashi, T.; Pizzorusso, T. The Roles of Perineuronal Nets and the Perinodal Extracellular Matrix in Neuronal Function. Nat. Rev. Neurosci. 2019, 20, 451–465. [Google Scholar] [CrossRef]
- Hillen, A.E.J.; Burbach, J.P.H.; Hol, E.M. Cell Adhesion and Matricellular Support by Astrocytes of the Tripartite Synapse. Prog. Neurobiol. 2018, 165-167, 66–86. [Google Scholar] [CrossRef]
- Perlmutter, L.S.; Barrón, E.; Saperia, D.; Chui, H.C. Association between Vascular Basement Membrane Components and the Lesions of Alzheimer’s Disease. J. Neurosci. Res. 1991, 30, 673–681. [Google Scholar] [CrossRef] [PubMed]
- Moreno-Rodriguez, M.; Perez, S.E.; Nadeem, M.; Malek-Ahmadi, M.; Mufson, E.J. Frontal Cortex Chitinase and Pentraxin Neuroinflammatory Alterations during the Progression of Alzheimer’s Disease. J. Neuroinflam. 2020, 17, 58. [Google Scholar] [CrossRef] [Green Version]
- Wu, X.; Reddy, D.S. Integrins as Receptor Targets for Neurological Disorders. Pharmacol. Ther. 2012, 134, 68–81. [Google Scholar] [CrossRef] [PubMed] [Green Version]
- Dityatev, A.; Schachner, M. Extracellular Matrix Molecules and Synaptic Plasticity. Nat. Rev. Neurosci. 2003, 4, 456–468. [Google Scholar] [CrossRef] [PubMed]
- Dityatev, A.; Schachner, M.; Sonderegger, P. The Dual Role of the Extracellular Matrix in Synaptic Plasticity and Homeostasis. Nat. Rev. Neurosci. 2010, 11, 735–746. [Google Scholar] [CrossRef]
- Gall, C.M.; Lynch, G. Integrins, Synaptic Plasticity and Epileptogenesis. Adv. Exp. Med. Biol. 2004, 12–33. [Google Scholar] [CrossRef]
- Gall, C.M.; Pinkstaff, J.K.; Lauterborn, J.C.; Xie, Y.; Lynch, G. Integrins Regulate Neuronal Neurotrophin Gene Expression through Effects on Voltage-Sensitive Calcium Channels. Neuroscience 2003, 118, 925–940. [Google Scholar] [CrossRef]
- Benito-Jardón, M.; Klapproth, S.; Gimeno-LLuch, I.; Petzold, T.; Bharadwaj, M.; Müller, D.J.; Zuchtriegel, G.; Reichel, C.A.; Costell, M. The Fibronectin Synergy Site Re-Enforces Cell Adhesion and Mediates a Crosstalk between Integrin Classes. eLife 2017, 6, e22264. [Google Scholar] [CrossRef]
- Singh, P.; Carraher, C.; Schwarzbauer, J.E. Assembly of Fibronectin Extracellular Matrix. Annu. Rev. Cell Dev. Biol. 2010, 26, 397–419. [Google Scholar] [CrossRef] [PubMed] [Green Version]
- Mönning, U.; Banati, R.B.; Masters, C.L.; Sandbrink, R.; Weidemann, A.; Beyreuther, K. Extracellular Matrix Influences the Biogenesis of Amyloid Precursor Protein in Microglial Cells. J. Biol. Chem. 1995, 270, 7104–7110. [Google Scholar] [CrossRef] [PubMed] [Green Version]
- Hawkes, C.A.; Härtig, W.; Kacza, J.; Schliebs, R.; Weller, R.O.; Nicoll, J.A.; Carare, R.O. Perivascular Drainage of Solutes Is Impaired in the Ageing Mouse Brain and in the Presence of Cerebral Amyloid Angiopathy. Acta Neuropathol. 2011, 121, 431–443. [Google Scholar] [CrossRef] [PubMed]
- Berman, D.E.; Dudai, Y. MAPK Cascades in the Brain: Lessons from Learning. In MAP Kinase Signaling Protocols; Humana Press: Totowa, NJ, USA, 2004; Volume 205, pp. 315–322. [Google Scholar] [CrossRef]
- Lee, J.K.; Kim, N.-J. Recent Advances in the Inhibition of P38 MAPK as a Potential Strategy for the Treatment of Alzheimer’s Disease. Mol. A J. Synth. Chem. Nat. Prod. Chem. 2017, 22, 1287. [Google Scholar] [CrossRef] [Green Version]
- Perea, J.R.; Ávila, J.; Bolós, M. Dephosphorylated rather than Hyperphosphorylated Tau Triggers a Pro-Inflammatory Profile in Microglia through the P38 MAPK Pathway. Exp. Neurol. 2018, 310, 14–21. [Google Scholar] [CrossRef]
- Giraldo, E.; Lloret, A.; Fuchsberger, T.; Viña, J. Aβ and Tau Toxicities in Alzheimer’s are Linked via Oxidative Stress-Induced P38 Activation: Protective Role of Vitamin E. Redox Biol. 2014, 2, 873–877. [Google Scholar] [CrossRef] [Green Version]
- Gee, M.S.; Son, S.H.; Jeon, S.H.; Do, J.; Kim, N.; Ju, Y.-J.; Lee, S.J.; Chung, E.K.; Inn, K.-S.; Kim, N.-J.; et al. A Selective P38α/β MAPK Inhibitor Alleviates Neuropathology and Cognitive Impairment, and Modulates Microglia Function in 5XFAD Mouse. Alzheimer’s Res. Ther. 2020, 12, 45. [Google Scholar] [CrossRef] [Green Version]
- Maiese, K. Forkhead Transcription Factors: New Considerations for Alzheimer’s Disease and Dementia. J. Transl. Sci. 2016, 2, 241–247. [Google Scholar] [CrossRef] [Green Version]
- Shang, Y.; Chong, Z.; Hou, J.; Maiese, K. FoxO3a Governs Early Microglial Proliferation and Employs Mitochondrial Depolarization with Caspase 3, 8, and 9 Cleavage during Oxidant Induced Apoptosis. Curr. Neurovasc. Res. 2009, 6, 223–238. [Google Scholar] [CrossRef] [Green Version]
- Wang, X.; Wang, Z.; Chen, Y.; Huang, X.; Hu, Y.; Zhang, R.; Ho, M.S.; Xue, L. FoxO Mediates APP-Induced AICD-Dependent Cell Death. Cell Death Dis. 2014, 5, e1233. [Google Scholar] [CrossRef] [Green Version]
- Shi, C.; Viccaro, K.; Lee, H.; Shah, K. Cdk5-FOXO3a Axis: Initially Neuroprotective, Eventually Neurodegenerative in Alzheimer’s Disease Models. J. Cell Sci. 2016, 129, 1815–1830. [Google Scholar] [CrossRef] [PubMed] [Green Version]
- Brunet, A.; Datta, S.R.; Greenberg, M.E. Transcription-Dependent and -Independent Control of Neuronal Survival by the PI3K–Akt Signaling Pathway. Curr. Opin. Neurobiol. 2001, 11, 297–305. [Google Scholar] [CrossRef]
- Horwood, J.M.; Dufour, F.; Laroche, S.; Davis, S. Signalling Mechanisms Mediated by the Phosphoinositide 3-Kinase/Akt Cascade in Synaptic Plasticity and Memory in the Rat. Eur. J. Neurosci. 2006, 23, 3375–3384. [Google Scholar] [CrossRef]
- Chiang, H.-C.; Wang, L.; Xie, Z.; Yau, A.; Zhong, Y. PI3 Kinase Signaling Is Involved in a -Induced Memory Loss in Drosophila. Proc. Natl. Acad. Sci. USA 2010, 107, 7060–7065. [Google Scholar] [CrossRef] [Green Version]
- Schäbitz, W.-R.; Krüger, C.; Pitzer, C.; Weber, D.; Laage, R.; Gassler, N.; Aronowski, J.; Mier, W.; Kirsch, F.; Dittgen, T.; et al. A Neuroprotective Function for the Hematopoietic Protein Granulocyte-Macrophage Colony Stimulating Factor (GM-CSF). J. Cereb. Blood Flow Metab. 2007, 28, 29–43. [Google Scholar] [CrossRef] [Green Version]
- Lee, H.-K.; Kumar, P.; Fu, Q.; Rosen, K.M.; Querfurth, H.W. The Insulin/Akt Signaling Pathway Is Targeted by Intracellular β-Amyloid. Mol. Biol. Cell. 2009, 20, 1533–1544. [Google Scholar] [CrossRef] [Green Version]
- Wang, L.; Chiang, H.-C.; Wu, W.; Liang, B.; Xie, Z.; Yao, X.; Ma, W.; Du, S.; Zhong, Y. Epidermal Growth Factor Receptor Is a Preferred Target for Treating Amyloid-β-Induced Memory Loss. Proc. Natl. Acad. Sci. USA 2012, 109, 16743–16748. [Google Scholar] [CrossRef] [PubMed] [Green Version]
- Wang, B.-J.; Her, G.M.; Hu, M.-K.; Chen, Y.-W.; Tung, Y.-T.; Wu, P.-Y.; Hsu, W.-M.; Lee, H.; Jin, L.-W.; Hwang, S.-P.; et al. ErbB2 Regulates Autophagic Flux to Modulate the Proteostasis of APP-CTFs in Alzheimer’s Disease. Proc. Natl. Acad. Sci. USA 2017, 114, E3129–E3138. [Google Scholar] [CrossRef] [Green Version]
- Birecree, E.; Whetsell, W.O.; Stoscheck, C.; King, L.E.; Nanney, L.B. Immunoreactive Epidermal Growth Factor Receptors in Neuritic Plaques from Patients with Alzheimer’s Disease. J. Neuropathol. Exp. Neurol. 1988, 47, 549–560. [Google Scholar] [CrossRef] [PubMed]
- Carpenter, G.; Cohen, S. Epidermal Growth Factor. J. Biol. Chem. 1990, 265, 7709–7712. [Google Scholar] [CrossRef]
- Chang, Y.-S.; Chen, W.-Y.; Yin, J.J.; Sheppard-Tillman, H.; Huang, J.; Liu, Y.-N. EGF Receptor Promotes Prostate Cancer Bone Metastasis by Downregulating MiR-1 and Activating TWIST1. Cancer Res. 2015, 75, 3077–3086. [Google Scholar] [CrossRef] [PubMed] [Green Version]
- Kirouac, L.; Rajic, A.J.; Cribbs, D.H.; Padmanabhan, J. Activation of Ras-ERK Signaling and GSK-3 by Amyloid Precursor Protein and Amyloid Beta Facilitates Neurodegeneration in Alzheimer’s Disease. eNeuro 2017, 4, ENEURO.0149-16.2017. [Google Scholar] [CrossRef] [PubMed] [Green Version]


| Groups | Age | Sex | Post-Mortem Delay | Hist Diagnosis | Braak Tangle Stage | CERAD Diag. Group |
|---|---|---|---|---|---|---|
| Controls | 77 | M | 42 | No AD, mild to moderate CAA | 1 | No AD |
| 74 | F | 39.5 | Control, no significant abnormalities | 1 | No AD | |
| 92 | M | 56.5 | Control, moderate CAA | 1 | No AD | |
| 90 | F | 67.25 | Single microinfarct in occipital cortex fine to use as control | 1 | No AD | |
| 94 | F | 43.25 | Normal-looking brain | 1 | No AD | |
| Early stage | 79 | F | 70 | AD | 3 | |
| 90 | F | 21 | AD | 4 | ||
| 80 | M | 24 | AD probable, moderate CAA | 4 | Probable AD | |
| 80 | F | 26 | AD probable, moderate CAA | 4 | Probable AD | |
| 81 | M | 38 | AD definite | 4 | Definite AD | |
| Late stage | 88 | F | 68 | AD definite, moderately severe CAA | 5 | Definite AD |
| 93 | F | 31.75 | AD definite | 5 | Definite AD | |
| 78 | M | 49.5 | AD mod severe | 6 | Definite AD | |
| 86 | F | 45.25 | AD definite (severe) | 6 | Definite AD | |
| 77 | M | 21.75 | AD definite, moderate CAA | 6 | Definite AD |
| MiRNAs | CONTR FC ± SD | Braak III-IV FC ± SD | CONTR vs. Braak III-IV p-Value | Braak V-VI FC ± SD | CONTR vs. Braak V-VI p-Value |
|---|---|---|---|---|---|
| hsa-miR-221-3p | 1.01 ± 0.15 | 0.76 ± 0.11 | 0.03 | ||
| hsa-miR-431-5p | 1.01 ± 0.17 | 0.63 ± 0.23 | 0.03 | 0.55 ± 0.14 | 0.01 |
| hsa-miR-494-3p | 1.01 ± 0.20 | 0.65 ± 0.20 | 0.03 | ||
| hsa-miR-671-5p | 1.02 ± 0.21 | 0.66 ± 0.17 | 0.03 | 0.52 ± 0.15 | 0.01 |
| hsa-miR-222-3p | 1.01 ± 0.15 | 0.76 ± 0.08 | 0.03 | ||
| hsa-miR-542-5p | 1.06 ± 0.37 | 0.56 ± 0.13 | 0.03 | 0.39 ± 0.18 | 0.01 |
| hsa-miR-642a-5p | 1.10 ± 0.50 | 3.79 ± 2.87 | 0.03 | ||
| hsa-miR-548a-5p | 1.03 ± 0.24 | 0.40 ± 0.27 | 0.01 | ||
| hsa-miR-204-5p | 1.04 ± 0.30 | 1.50 ± 0.12 | 0.01 | 1.66 ± 0.37 | 0.01 |
| hsa-miR-520d-5p | 1.22 ± 0.83 | 0.45 ± 0.15 | 0.03 | ||
| has-miR-651-5p | 1.05 ± 0.37 | 0.53 ± 0.17 | 0.03 | ||
| has-miR-301b-3p | 1.02 ± 0.22 | 0.63 ± 0.20 | 0.03 | ||
| hsa-miR-636 | 1.04 ± 0.31 | 0.37 ± 0.13 | 0.01 | ||
| hsa-miR-548a-3p | 1.05 ± 0.36 | 0.47 ± 0.32 | 0.03 | ||
| hsa-miR-140-5p | 1.00 ± 0.07 | 0.81 ± 0.09 | 0.01 | ||
| hsa-miR-210-3p | 1.19 ± 0.93 | 0.54 ± 0.16 | 0.03 | ||
| hsa-miR-185-5p | 1.09 ± 0.59 | 0.64 ± 0.05 | 0.01 | ||
| hsa-miR-425-5p | 1.03 ± 0.33 | 0.61 ± 0.10 | 0.01 | ||
| hsa-miR-503-5p | 1.13 ± 0.64 | 0.37 ± 0.19 | 0.01 | ||
| hsa-miR-30b-3p | 1.02 ± 0.22 | 0.60 ± 0.12 | 0.01 | ||
| hsa-miR-545-3p | 1.00 ± 0.11 | 0.68 ± 0.19 | 0.03 | ||
| hsa-miR-665 | 1.09 ± 0.53 | 0.40 ± 0.12 | 0.01 | ||
| hsa-miR-132-3p | 1.05 ± 0.33 | 0.47 ± 0.23 | 0.03 | ||
| hsa-miR-22-5p | 1.01 ± 0.13 | 0.64 ± 0.30 | 0.01 | ||
| hsa-miR-30e-5p | 1.00 ± 0.12 | 0.76 ± 0.09 | 0.01 | ||
| hsa-miR-32-5p | 1.00 ± 0.10 | 0.67 ± 0.29 | 0.01 | ||
| hsa-miR-324-3p | 1.00 ± 0.07 | 0.81 ± 0.23 | 0.03 | ||
| hsa-miR-877-5p | 1.01 ± 0.20 | 0.67 ± 0.13 | 0.03 | ||
| hsa-let-7i-5p | 1.04 ± 0.35 | 0.64 ± 0.20 | 0.01 | ||
| hsa-miR-602 | 1.06 ± 0.43 | 0.57 ± 0.20 | 0.03 | ||
| hsa-miR-148b-3p | 1.00 ± 0.02 | 0.77 ± 0.22 | 0.01 | ||
| hsa-miR-34c-3p | 1.48 ± 1.76 | 0.39 ± 0.18 | 0.01 | ||
| hsa-miR-622 | 1.12 ± 0.48 | 0.38 ± 0.27 | 0.01 | ||
| hsa-miR-185-3p | 1.10 ± 0.62 | 0.43 ± 0.15 | 0.01 | ||
| hsa-miR-766-3p | 1.00 ± 0.12 | 0.78 ± 0.12 | 0.03 | ||
| hsa-miR-326 | 1.02 ± 0.21 | 0.63 ± 0.29 | 0.03 | ||
| hsa-miR-147a | 1.05 ± 0.37 | 0.45 ± 0.27 | 0.03 | ||
| hsa-miR-146b-5p | 1.84 ± 2.72 | 0.41 ± 0.09 | 0.01 | ||
| hsa-miR-1-3p | 1.01 ± 0.18 | 0.69 ± 0.11 | 0.03 | ||
| hsa-miR-425-3p | 1.01 ± 0.18 | 0.66 ± 0.07 | 0.01 | ||
| hsa-miR-450a-5p | 1.07 ± 0.38 | 0.48 ± 0.25 | 0.03 | ||
| hsa-miR-106b-5p | 1.02 ± 0.26 | 0.72 ± 0.11 | 0.01 | ||
| hsa-miR-212-3p | 1.06 ± 0.38 | 0.36 ± 0.18 | 0.01 | ||
| hsa-miR-484 | 1.06 ± 0.47 | 0.66 ± 0.09 | 0.01 | ||
| hsa-miR-219a-1-3p | 1.04 ± 0.35 | 0.48 ± 0.15 | 0.01 | ||
| hsa-miR-1244 | 1.05 ± 0.36 | 0.48 ± 0.14 | 0.01 | ||
| hsa-miR-1205 | 1.04 ± 0.31 | 0.60 ± 0.29 | 0.03 | ||
| hsa-miR-146b-3p | 1.78 ± 2.56 | 0.42 ± 0.08 | 0.01 | ||
| hsa-miR-920 | 1.09 ± 0.48 | 0.20 ± 0.11 | 0.01 | ||
| hsa-miR-1237-3p | 1.10 ± 0.52 | 0.47 ± 0.13 | 0.03 | ||
| hsa-miR-671-3p | 1.016 ± 0.20 | 0.67 ± 0.11 | 0.01 | ||
| hsa-miR-582-3p | 1.03 ± 0.29 | 0.61 ± 0.07 | 0.01 | ||
| hsa-miR-1539 | 1.12 ± 0.61 | 0.36 ± 0.17 | 0.01 | ||
| hsa-miR-30c-1-3p | 1.02 ± 0.21 | 0.74 ± 0.09 | 0.01 |
| Protein | HGNC Number | Braak Stage III-IV vs. CONTR logFC | adj. p-Value | Braak Stage V-VI vs. CONTR logFC | adj. p-Value |
|---|---|---|---|---|---|
| G3P | GAPDH | 1.4 | 0.0074 | 0.97 | 0.044 |
| DPB1 | HLA-DPB1 | 1.23 | 0.0061 | 2.05 | 1.9 × 10⁻⁶ |
| METRL | METRNL | 1.2 | 0.012 | 1.31 | 0.0038 |
| CD9 | CD9 | 1.15 | 0.0057 | ||
| IL34 | IL34 | 1.07 | 0.02 | ||
| GLPB | GYPB | 1.03 | 0.0061 | ||
| FGFP1 | FGFBP1 | 0.92 | 0.043 | ||
| HPT | HP | 0.8 | 0.048 | ||
| GPNMB | GPNMB | 0.79 | 0.019 | 0.95 | 0.0025 |
| CD81 | CD81 | 0.74 | 0.0029 | 0.71 | 0.0017 |
| PLK1 | PLK1 | 0.65 | 0.033 | 0.61 | 0.042 |
| CNTN2 | CNTN2 | 0.62 | 0.022 | ||
| SDC4 | SDC4 | 0.62 | 0.0044 | 0.85 | 0.000014 |
| CATL1 | CTSL | 0.61 | 0.00025 | ||
| PARK7 | PARK7 | 0.6 | 0.0017 | ||
| CATD | CTSD | 0.55 | 0.00026 | ||
| PGCA | ACAN | 0.55 | 0.021 | 0.55 | 0.016 |
| LEG3 | LGALS3 | 0.54 | 0.018 | ||
| HSPB1 | HSPB1 | 0.51 | 0.033 | 0.77 | 0.00051 |
| UROK | PLAU | −0.54 | 0.032 | ||
| CR2 | CR2 | −0.56 | 0.033 | 1.07 | 0.041 |
| TR11B | TNFRSF11B | −0.59 | 0.032 | ||
| TNFB | LTA | −0.59 | 0.017 | ||
| FGF9 | FGF9 | −0.6 | 0.018 | ||
| MEP1A | MEP1A | −0.6 | 0.011 | ||
| CAH9 | CA9 | −0.61 | 0.0061 | ||
| EGLN | ENG | −0.61 | 0.02 | ||
| FABPL | FABP1 | −0.61 | 0.011 | ||
| KLOTB | KLB | −0.61 | 0.019 | ||
| IL17C | IL17C | −0.62 | 0.021 | ||
| MLKL | MLKL | −0.63 | 0.0052 | ||
| CEAM5 | CEACAM5 | −0.63 | 0.018 | ||
| ITA2B (CD41a) | ITGA2B | −0.64 | 0.02 | ||
| IFNL3 | IFNL3 | −0.64 | 0.0079 | ||
| P53 | TP53 | −0.65 | 0.015 | ||
| PTN1 | PTPN1 | −0.66 | 0.0074 | ||
| SPA9 | SERPINA9 | −0.67 | 0.011 | ||
| NECT4 | NECTIN4 | −0.68 | 0.011 | ||
| IL2RB | IL2RB | −0.68 | 0.036 | ||
| CD22 | CD22 | −0.68 | 0.019 | ||
| DAF | CD55 | −0.69 | 0.0061 | ||
| ULBP3 | ULBP3 | −0.69 | 0.0061 | ||
| NGAL | LCN2 | −0.69 | 0.0059 | ||
| THYG | TG | −0.69 | 0.0095 | ||
| CD72 | CD72 | −0.7 | 0.0085 | ||
| VTDB | GC | −0.72 | 0.0044 | ||
| HLA-DR | −0.72 | 0.0059 | 1.53 | 0.0058 | |
| IFNG | IFNG | −0.72 | 0.036 | ||
| KLK3 | KLK3 | −0.73 | 0.0061 | ||
| EGLN | ENG | −0.74 | 0.0029 | ||
| TIE2 | TEK | −0.74 | 0.013 | ||
| CDCP1 | CDCP1 | −0.75 | 0.005 | ||
| LAG3 | LAG3 | −0.76 | 0.0066 | ||
| BCAM | BCAM | −0.79 | 0.00035 | ||
| MET | MET | −0.82 | 0.019 | −1.07 | 0.001 |
| CNTF | CNTF | −0.83 | 0.0014 | ||
| PD1L2 | PDCD1LG2 | −0.84 | 0.0032 | ||
| IFNG | IFNG | −0.87 | 0.0061 | ||
| SIGL9 | SIGLEC9 | −0.91 | 0.011 | ||
| COIA1 (endostatin) | COL18A1 | −0.94 | 0.0061 | 0.69 | 0.041 |
| CXCL9 | CXCL9 | −0.98 | 0.048 | ||
| PROK1 | PROK1 | −1.01 | 0.0074 | −0.76 | 0.042 |
| PARP1 | PARP1 | −1.01 | 0.025 | −1.19 | 0.0052 |
| LYAM2 | SELE | −1.05 | 0.012 | ||
| IL2RA | IL2RA | −1.11 | 0.011 | −1.2 | 0.0037 |
| CCL26 | CCL26 | −1.12 | 0.044 | ||
| CD53 | CD53 | −1.29 | 0.0081 | −0.98 | 0.043 |
| POSTN | POSTN | −1.33 | 0.011 | ||
| TNF11 | TNFSF11 | −1.4 | 0.0047 | ||
| IL34_MOUSE | Il34 | −1.53 | 0.00014 | ||
| CCL28 | CCL28 | −1.57 | 0.000032 | ||
| CTGF | CTGF | −1.83 | 0.000055 | ||
| TNR11 | TNFRSF11A | −1.9 | 0.00063 | ||
| CADH5 | CDH5 | 3.25 | 0.00051 | ||
| GLUC | GCG | 2.36 | 4.8 × 10⁻⁶ | ||
| NUB1 | NUB1 | 1.98 | 0.00083 | ||
| SP1 | SP1 | 1.89 | 0.000024 | ||
| CD44 | CD44 | 1.62 | 0.000037 | ||
| ICAM1 | ICAM1 | 1.58 | 0.000013 | ||
| I22R2 | IL22RA2 | 1.56 | 0.011 | ||
| ICAM1 | ICAM1 | 1.49 | 0.000081 | ||
| BLNK | BLNK | 1.45 | 2.7 × 10⁻⁶ | ||
| FUT8 | FUT8 | 1.43 | 0.042 | ||
| MK | MDK | 1.43 | 0.00065 | ||
| JAK1 | JAK1 | 1.37 | 0.0055 | ||
| ESR1 | ESR1 | 1.37 | 1.9 × 10⁻⁶ | ||
| IL13_MOUSE | Il13 | 1.32 | 0.0005 | ||
| MPIP3 | CDC25C | 1.28 | 0.022 | ||
| IGKC | IGKC | 1.28 | 0.000017 | ||
| CHK2 | CHEK2 | 1.2 | 0.046 | ||
| CSF1R | CSF1R | 1.17 | 0.0023 | ||
| KI2L2 | KIR2DL2 | 1.13 | 0.0038 | ||
| CYBP | CACYBP | 1.09 | 0.0017 | ||
| GNLY | GNLY | 1.07 | 0.0037 | ||
| CADH1 | CDH1 | 1.07 | 0.035 | ||
| BGH3 | TGFBI | 1.05 | 0.0032 | ||
| VGFR2 | KDR | 1.04 | 0.015 | ||
| PRAF3 | ARL6IP5 | 0.99 | 0.011 | ||
| UPAR | PLAUR | 0.92 | 0.0094 | ||
| MYBA | MYBL1 | 0.92 | 0.012 | ||
| A2AP | SERPINF2 | 0.9 | 0.036 | ||
| SRGEF | SERGEF | 0.83 | 0.021 | ||
| ITB1 | ITGB1 | 0.83 | 5.4 × 10⁻⁷ | ||
| CTNB1 | CTNNB1 | 0.82 | 0.047 | ||
| FOLR3 | FOLR3 | 0.79 | 0.022 | ||
| CSF3 | CSF3 | 0.78 | 0.036 | ||
| FCG2B | FCGR2B | 0.76 | 0.00019 | ||
| TSP1 | THBS1 | 0.75 | 0.013 | ||
| CD15 | 0.74 | 0.0012 | |||
| TNR6 | FAS | 0.73 | 0.013 | ||
| PIR | PIR | 0.71 | 0.038 | ||
| ITAL | ITGAL | 0.69 | 0.00027 | ||
| SLIP | NUGGC | 0.69 | 0.025 | ||
| TF | F3 | 0.66 | 1.1 × 10⁻⁶ | ||
| TF | F3 | 0.66 | 1.9 × 10⁻⁶ | ||
| EGFR | EGFR | 0.66 | 0.0024 | ||
| 20S Immunoproteasome | PSMB8 | 0.65 | 0.005 | ||
| CD166 | ALCAM | 0.65 | 0.0055 | ||
| FINC | FN1 | 0.64 | 0.014 | ||
| FURIN | FURIN | 0.58 | 0.045 | ||
| IFNL2 | IFNL2 | 0.57 | 0.00018 | ||
| CFAH | CFH | 0.56 | 0.0094 | ||
| BGLR | GUSB | 0.55 | 0.0022 | ||
| IGLC1 | IGLC1 | 0.54 | 0.015 | ||
| CD81 | CD81 | 0.53 | 0.0023 | ||
| CATA | CAT | 0.52 | 0.0019 | ||
| TNR5 | CD40 | 0.52 | 0.005 | ||
| TFR1 | TFRC | −0.51 | 0.002 | ||
| RBTN2 | LMO2 | −0.52 | 0.015 | ||
| TFR1 | TFRC | −0.53 | 0.00057 | ||
| IL15 | IL15 | −0.54 | 0.043 | ||
| CCL27 | CCL27 | −0.55 | 0.01 | ||
| IL15 | IL15 | −0.56 | 0.049 | ||
| CCD50 | CCDC50 | −0.56 | 0.000014 | ||
| CALB1 | CALB1 | −0.58 | 0.049 | ||
| BTLA | BTLA | −0.58 | 0.034 | ||
| BUB1 | BUB1 | −0.59 | 0.014 | ||
| HMGN2 | HMGN2 | −0.59 | 0.047 | ||
| 2A5D | PPP2R5D | −0.6 | 0.011 | ||
| IL22 | IL22 | −0.61 | 0.03 | ||
| STAT3 | STAT3 | −0.65 | 0.031 | ||
| FAF1 | FAF1 | −0.65 | 0.039 | ||
| SAMP | APCS | −0.66 | 0.03 | ||
| CCR7 | CCR7 | −0.72 | 0.022 | ||
| PRIO | PRNP | −0.74 | 0.0094 | ||
| CD97 | CD97 | −0.79 | 0.001 | ||
| HBEGF | HBEGF | −0.8 | 0.003 | ||
| NEK2 | NEK2 | −0.82 | 0.0056 | ||
| TFR1 | TFRC | −0.82 | 0.0052 | ||
| ANGL3 | ANGPTL3 | −0.83 | 0.013 | ||
| AKT3 | AKT3 | −0.85 | 0.0089 | ||
| PAPOA | PAPOLA | −0.89 | 0.046 | ||
| IL12A | IL12A | −0.91 | 0.0071 | ||
| RA51C | RAD51C | −1 | 0.0017 | ||
| ASTRA | GRAMD1A | −1 | 0.0063 | ||
| BIRC3 | BIRC3 | −1.01 | 0.02 | ||
| RARR2 | RARRES2 | −1.01 | 0.00042 | ||
| PSN1 | PSEN1 | −1.09 | 0.028 | ||
| CD99 | CD99 | −1.09 | 0.026 | ||
| BARD1 | BARD1 | −1.1 | 0.031 | ||
| LIMD1 | LIMD1 | −1.17 | 0.00019 | ||
| CP3A5 | CYP3A5 | −1.23 | 0.036 | ||
| SDHB | SDHB | −1.24 | 0.017 | ||
| CCL21 | CCL21 | −1.3 | 0.013 | ||
| HGF | HGF | −1.31 | 0.017 | ||
| PRIO | PRNP | −1.39 | 0.0018 | ||
| SAA1 | SAA1 | −1.4 | 0.000006 | ||
| TSP2 | THBS2 | −1.46 | 0.016 | ||
| Q6ZNL3 | FLJ00280 | −1.56 | 0.038 | ||
| CFAD_MOUSE | Cfd | −1.58 | 0.02 | ||
| FGF23 | FGF23 | −1.7 | 1.2 × 10⁻⁶ | ||
| ARVC | ARVCF | −1.85 | 0.012 | ||
| CCR7 | CCR7 | −1.94 | 0.032 | ||
| CFLAR | CFLAR | −2.27 | 0.001 |
| MiRNAs | Number of Targets | Matched Protein Targets with Inverse Relation in Braak III-IV | Matched Protein Targets with Inverse Relation in Braak V-VI |
|---|---|---|---|
| hsa-miR-221-3p | 302 | ||
| hsa-miR-431-5p | 341 | ||
| hsa-miR-494-3p | 1002 | ||
| hsa-miR-671-5p | 414 | THBS1, SP1 | |
| hsa-miR-222-3p | 221 | ||
| hsa-miR-542-5p | 16 | ||
| hsa-miR-642a-5p | 53 | ||
| hsa-miR-548a-3p | 26 | ||
| hsa-miR-204-5p | 228 | SELE | |
| hsa-miR-520d-5p | 1538 | ||
| hsa-miR-651-5p | 103 | ||
| hsa-miR-301b-3p | 548 | ||
| hsa-miR-636 | 148 | ||
| hsa-miR-548a-3p | 1504 | ||
| hsa-miR-140-5p | 300 | GPNMB | |
| hsa-miR-210-3p | 8 | ||
| hsa-miR-185-5p | 802 | ACAN, TGFB1 | |
| hsa-miR-425-5p | 316 | ||
| hsa-miR-503-5p | 276 | ||
| hsa-miR-30b-3p | 553 | ACAN, CDH1 | |
| hsa-miR-545-3p | 235 | ||
| hsa-miR-665 | 391 | HDR | |
| hsa-miR-132-3p | 626 | CD44 | |
| hsa-miR-22-5p | 575 | ||
| hsa-miR-30e-5p | 1207 | ITGB1, CAT | |
| hsa-miR-32-5p | 843 | ||
| hsa-miR-324-3p | 91 | ||
| hsa-miR-877-5p | 151 | ||
| hsa-let-7i-5p | 646 | IL13, FAS | |
| hsa-miR-602 | 23 | METRNL | |
| hsa-miR-148b-3p | 554 | ALCAM | |
| hsa-miR-34c-3p | 276 | SERPINF2, FURIN | |
| hsa-miR-622 | 263 | HLA-DPB1 | |
| hsa-miR-185-3p | 263 | HLA-DPB1 | |
| hsa-miR-766-3p | 607 | CHEK2 | |
| hsa-miR-326 | 349 | ACAN | |
| hsa-miR-147a | 404 | NUGGC | |
| hsa-miR-146b-5p | 682 | MYBL1 | |
| hsa-miR-1-3p | 634 | EGFR, FN1 | |
| hsa-miR-425-3p | 11 | FN1 | |
| hsa-miR-450a-5p | 24 | ||
| hsa-miR-106b-5p | 1254 | ESR1, FURIN, JAK1 | |
| hsa-miR-212-3p | 597 | CD44 | |
| hsa-miR-484 | 516 | ||
| hsa-miR-219a-1-3p | 142 | ||
| hsa-miR-1244 | 233 | ||
| hsa-miR-1205 | 1011 | CSF3 | |
| hsa-miR-146b-3p | 270H | ||
| hsa-miR-920 | 823 | BLNK | |
| hsa-miR-1237-3p | 170 | FNI | |
| hsa-miR-671-3p | 29 | ||
| hsa-miR-582-3p | 340 | ||
| hsa-miR-1539 | 6 | ||
| hsa-miR-30c-1-3p | 431 | ACAN |
| Common KEGG Pathways in Braak V-VI | MicroRNAs | Targets in the Pathways and Inverse Relation |
|---|---|---|
| ECM-receptor interaction | hsa-miR-30b-3p | COL27A1, DAG1, COL11A2, VWF |
| hsa-miR-671-5p | THBS1, CD47 | |
| hsa-let-7i-5p | COL27A1, COL3A1, COL1A1, COL1A2, COL1A2, ITGA7, COL4A6, COL5A2, COL4A1 | |
| hsa-miR-140-5p | DAG1, TNN | |
| hsa-miR-766-3p | LAMB4, COL24A1, DAG1 | |
| hsa-miR-484 | LAMB3, DAG1 | |
| hsa-miR-920 | ITGA3, DAG1 | |
| hsa-miR-665 | COL24A1, COL6A6, COL3A1, TNR | |
| hsa-miR-326 | COL24A1, ITGA5, CD47 | |
| hsa-miR-132-3p | ITGA9, COL4A4, COL11A1, COL5A2, CD44 | |
| hsa-miR-30e-5p | ITGB1, ITGA9, ITGA8, ITGA4, ITGA6, ITGB3 | |
| hsa-miR-148b-3p | LAMB2, ITGB8, ITGA9, ITGA5, ITGA11, COL2A1, COL4A1, LAMA4 | |
| hsa-miR-212-3p | ITGA9, COL4A4, COL11A1, COL5A2, CD44 | |
| hsa-miR-431-5p | ITGA1, LAMC2 | |
| hsa-miR-1-3p | ITGB6, COL4A3, FN1, LAMC2 | |
| hsa-miR-185-5p | SV2B, ITGA1 | |
| hsa-miR-1237-3p | SV2B, ITGB6, COL6A6, THBS3, COL6A3, VWF, FN1, TNR | |
| hsa-miR-324-3p | ITGB5, COL2A1 | |
| hsa-miR-622 | ITGB5, COL2A1 | |
| hsa-miR-106b-5p | ITGB8 | |
| hsa-miR-1244 | ITGB8, ITGAV | |
| hsa-miR-324-3p | ITGB5, COL2A1 | |
| hsa-miR-622 | ITGB5, COL2A1 | |
| hsa-miR-106b-5p | ITGB8 | |
| hsa-miR-1244 | ITGB8, ITGAV | |
| hsa-miR-32-5p | ITGA8, COL27A1, ITGB6, ITGA5, ITGAV, COL5A1, COL1A2, COL11A1, ITGA6 | |
| hsa-miR-204-5p | COL6A6, COL5A3 | |
| hsa-miR-425-5p | TNR | |
| hsa-miR-147a | SV2A, ITGA11, TNR | |
| hsa-miR-582-3p | CD47 | |
| hsa-miR-22-5p | ITGA5 | |
| hsa-miR-425-3p | FN1 | |
| hsa-miR-503-5p | COL4A1 | |
| MAPK signalling pathway | hsa-miR-503-5p | CACNA1I, RAPGEF2, FGF2, AKT3, FGF7 |
| hsa-miR-665 | TGFBR1, MAPK8IP2, CACNG7, NLK, FGF2, MAX, AKT3, CACNA1D | |
| hsa-miR-132-3p | MAP3K3, CRK, KRAS, NLK, RASA1, ZAK, SOS1, TGFB2, AKT3, MECOM, DUSP9, MAPK1 | |
| hsa-miR-212-3p | MAP3K3, CRK, KRAS, NLK, RASA1, ZAK, SOS1, TGFB2, AKT3, MECOM, DUSP9, MAPK1 | |
| hsa-let-7i-5p | TGFBR1, MAP4K2, NRAS, ELK4, MAP4K3, MAP4K4, MAP3K1, TP53, FGF11, CASP3, RASGRP1, MAPK8, FLNA, NGF, FAS, MEF2C, DUSP1 | |
| hsa-miR-34c-3p | MRAS, PAK2, BDNF, MAP2K6, PPP3CB, RASGRP1, PPM1A, SOS1, MAP3K2, MEF2C, GRB2 | |
| hsa-miR-22-5p | PRKCA, ELK4, RAP1A, RAF1, MAP4K3, RASA1, SOS1, CACNA2D4, NF1, MAP2K1, MAP3K2 | |
| hsa-miR-147a | CACNA1A, FLNC, FGF14, CRKL, MAP4K3, TAOK1, CACNA1I, FGF11, NLK, PDGFB, CACNA2D2, HSPA8, CACNG2, PRKCB, MAP3K2, DUSP9, FGFR2, MAPK10 | |
| hsa-miR-1-3p | ATF2, RAP1A, MAP4K3, EGFR, MAP3K1, BDNF, IKBKB, RASA1, RAPGEF2, SOS1, MAX, NFATC3, RAP1B, PRKACB, PDGFA | |
| hsa-miR-1205 | NTRK2, CACNA1A, MAP4K2, DUSP6, PLA2G4F, RASGRP2, IKBKB, JMJD7-PLA2G4B, CACNA1E, MAPT, NF1, MKNK1, RASGRP3, MEF2C, MAPK1, PDGFRB | |
| hsa-miR-30e-5p | RASA2, PPP3R1, MAP4K4, FGF20, MAP3K13, KRAS, TAOK1, PPP3CA, RASA1, CASP3, PPP3CB, RAPGEF2, MAPK8, SOS1, MAP3K2, RASGRP3, CACNB2, NFATC3, MAP3K7, RAP1B, MAP3K5, PDGFA, RPS6KA2 | |
| hsa-miR-30b-3p | TAB1, MAPK8IP2, MAP3K13, PAK1, FGF11, DUSP10, PPP5D1, ZAK, ARRB2, CACNB2, MAPK1, ELK1 | |
| hsa-miR-326 | CACNG8, ELK4, RAF1, RPS6KA1, MRAS, PAK1, IKBKB, FGF9, FGF18, PTPN5, FGFR2, FGF1, ELK1 | |
| hsa-miR-920 | LAMTOR3, MAP3K2 | |
| hsa-miR-431-5p | NTRK2, MAP3K13, TAOK1, RAPGEF2, CACNA1E | |
| hsa-miR-671-5p | NTRK2, NFKB1, STK4, MAP3K4, MAPKAPK3, MAPK1 | |
| hsa-miR-106b-5p | TAOK3, BRAF, NTRK2, PDGFRA, DUSP2, RASA2, ELK4, CRK, MAPK7, RASGRF2, PPP3R1, MAP3K1, RRAS2, TAOK1, DUSP10, RASA1, MAPK8, ZAK, SOS1, STK3, HSPA8, NF1, MAP3K2, MKNK2, MAPK1, TGFBR2, MAP3K5, RPS6KA2 | |
| hsa-miR-30c-1-3p | NTRK2, STK4, MAP3K13, PAK1, MAP2K6, FGF11, SOS1, ARRB1 | |
| hsa-miR-545-3p | CRK, MAP3K1, TAOK1, PPP3CA, CACNA1B, PDGFB, FLNA, MAXPTPN5, MEF2C | |
| hsa-miR-148b-3p | SOS2, NRAS, GADD45A, MRAS, MAP3K4, MAP3K12, SOS1, MAX, TGFB2, DUSP1 | |
| hsa-miR-146b-5p | BRAF, PDGFRA, HSPA1A, NRAS, TRAF6 | |
| hsa-miR-766-3p | CACNA1G, RASGRP2, MAP3K4, BDNF, IKBKB, NLK, PRKCG, DUSP7, TNFRSF1A, RPS6KA4 | |
| hsa-miR-425-5p | MAPK8, ZAK, SOS1, FGF9, PRKCB, STMN1, MEF2C, MAP3K5 | |
| hsa-miR-219a-1-3p | FASLG | |
| hsa-miR-1244 | CACNB4, RAPGEF2, MAPK8, MAP3K2, RAP1B | |
| hsa-miR-582-3p | CACNB4, MAP3K4, TAOK1, RAPGEF2 | |
| hsa-miR-622 | ATF2, RASA1, MAP3K12, MAPKAPK3, NF1, MECOM, STMN1 | |
| hsa-miR-185-3p | PRKCA, CACNA1G, FLNC, MAP3K3, FGF17, MAPK13, RPS6KA5, PAK1, CACNA1I, FLNB, FLNA, MAPK1, CACNB3 | |
| hsa-miR-484 | RPS6KA1, RASGRP2, MAP3K11, FLNB, FLNA, FGF8, FGF1, MAPKAPK2, PDGFA | |
| hsa-miR-671-3p | MAP4K1, RASGRF1 | |
| hsa-miR-185-5p | PAK2, CACNG7, MAPK14, MAP2K6, CACNG4, CDC42, PRKCB, RELA, NFATC3 | |
| hsa-miR-146b-3p | RAF1, PRKCB, RPS6KA3, IL1A, PLA2G4C | |
| hsa-miR-204-5p | FGF20, TAOK1, SOS1, DUSP3 | |
| hsa-miR-1237-3p | TAOK3, CACNG8, TGFBR1, PTPRR, TAB2, MAPK11, CACNA1E, STK3, FGF1, CACNB3 | |
| hsa-miR-324-3p | TAB1, ARRB1 | |
| hsa-miR-542-5p | IKBKB | |
| hsa-miR-140-5p | PDGFRA, GNG12, NLK, CACNB1, FGF9 | |
| hsa-miR-32-5p | BRAF, RAP1A, CACNA1I, NLK, DUSP10, ZAK, MAP3K2, CACNA2D1, DUSP5, MAP2K4, RAP1B, DUSP1 | |
| hsa-miR-877-5p | TAB2, MAP2K4 | |
| hsa-miR-602 | TAOK3, RASGRP2 | |
| hsa-miR-450a-5p | CACNA1F, DUSP10 | |
| Ras signalling pathway | hsa-miR-1-3p | MET, RAP1A, ETS1, EGFR, GNB1, CALM2, IKBKB, RAB5A, RASA1, SOS1, IGF1, RAP1B, PRKACB, PDGFA |
| hsa-miR-204-5 | KSR2, SHC1, FGF20, SOS1 | |
| hsa-miR-425-5p | MAPK8, SOS1, FGF9, PRKCB, GF1, ABL2, GRIN2B | |
| hsa-miR-132-3p | GNB1, KRAS, RASA1, SOS1, EXOC2, AKT3, PIK3CA, MAPK1, GRIN2B | |
| hsa-miR-22-5p | PRKCA, GNG11, PIK3CB, RAP1A, RAF1, RASA1, SOS1, NF1, MAP2K1, GRIN2B | |
| hsa-miR-30e-5p | RASA2, EFNA3, IGF1R, FGF20, KRAS, GNG10, RASA1, PIK3CD, PLA2G12A, MAPK8, BRAP, FLT1, SOS1, PDGFC, RASAL2, RASGRP3, RGL1, ABL2, GRIN2A, RAP1B, ABL1, PLA2G2C, PDGFA | |
| hsa-miR-148b-3p | RASAL1, SOS2, NRAS, ETS1, MRAS, PIK3R3, FLT1, SOS1, KITLG, IGF1, CSF1, TEK, GRIN2B | |
| hsa-miR-34c-3p | PAK2, MRAS, RASGRP1, REL, SOS1, GAB1, GRB2 | |
| hsa-miR-106b-5p | PDGFRA, RASA2, RASGRF2, PAK7, TIAM1, PAK3, RRAS2, RASA1, MAPK8, REL, FLT1, SOS1, NF1, GAB1, SHC4, PDGFD, RGL1, MAPK1, ABL2, RAB5B, RAPGEF5, GNB5, GRIN2B | |
| hsa-miR-212-3p | GNB1, KRAS, RASA1, SOS1, EXOC2, AKT3, PIK3CA, MAPK1, GRIN2B | |
| hsa-miR-30c-1-3p | KSR2, STK4, PAK1, FGF11, SOS1, GRIN2A, RAB5B, GRIN2B | |
| hsa-miR-665 | KSR2, RALA, FGF2, AKT3, KDR, GRIN2B | |
| hsa-miR-185-5p | KSR2, KSR1, PAK2, PAK7, GNB3, CDC42, PAK6, PRKCB, PAK6, RELA, VEGFA, ABL2, GRIN2B | |
| hsa-miR-1205 | KSR2, MET, PIK3R2, PIK3R5, PLA2G4F, RASGRP2, IKBKB, JMJD7-PLA2G4B, PTPN11, NF1, PAK6, RASGRP3, RASSF1, MAPK1, PLA2G2C, PDGFRB, GRIN2B | |
| hsa-miR-484 | KSR2, LAT, CALM1, RASGRP2, PAK3, PIK3CD, PDGFD, FGF8, GRIN1, FGF1, CSF1, PDGFA | |
| hsa-miR-185-3p | PRKCA, GNG13, FGF17, PLA2G6, PAK1, PAK6, SYNGAP1, MAPK1 | |
| hsa-miR-30b-3p | KSR2, EFNA5, PAK1, PLA2G2D, FGF11, PAK4, PLD2, SYNGAP1, GAB2, RALB, MAPK1, RAB5B, ELK1, GRIN2B | |
| hsa-miR-766-3p | PIK3R5, ETS1, RASGRP2, IKBKB, PRKCG, PLD2, GRIN2B | |
| hsa-miR-326 | GNGT1, RAF1, MRAS, PAK1, IKBKB, FGF9, PAK4, FGF18, RASAL2, FGFR2, FGF1, CSF1, ELK1, GRIN2B | |
| hsa-miR-147a | FGF14, CALM1, TIAM1, FGF11, PLCG1, PDGFB, PRKCB, PDGFC, FGFR2, MAPK10, GRIN2B | |
| hsa-miR-146b-5p | PDGFRA, NRAS, REL, ABL2, GRIN2B | |
| hsa-miR-1237-3p | KSR2, PAK7, GNG10, PLA2G12A, PIK3CA, RASAL2, HTR7, FGF1, GRIN2B | |
| hsa-miR-503-5p | IGF1R, PIK3R1, INSR, FGF2, AKT3, VEGFA, FGF7 | |
| hsa-miR-324-3p | KSR2 | |
| hsa-miR-146b-3p | KSR2, PAK7, RAF1, PAK3, MLLT4, PRKCB, PLA2G4C | |
| hsa-miR-920 | KSR2, GAB1, SYNGAP1, CSF1 | |
| hsa-miR-1244 | RHOA, MAPK8, GAB1, HGF, RAP1B | |
| hsa-let-7i-5p | NRAS, IGF1R, FGF11, PLA2G3, RASGRP1, MAPK8, INSR, NGF, IGF1, PAK6, ABL2 | |
| hsa-miR-542-5p | IKBKB | |
| hsa-miR-32-5p | GNG11, PIK3CB, RAP1A, PIK3R3, PIK3CA, RGL1, RAP1B | |
| hsa-miR-219a-1-3p | FASLG, IGF1 | |
| hsa-miR-671-5p | NFKB1, STK4, SHC3, KIT, SYNGAP1, RAB5B, MAPK10 | |
| hsa-miR-671-3p | RASGRF1 | |
| hsa-miR-582-3p | PLD1, RHOA, PTPN11, ANGPT1 | |
| hsa-miR-545-3p | PLA2G12A, PDGFB, PDGFD | |
| hsa-miR-622 | RASA1, NF1 | |
| hsa-miR-431-5p | RAB5B, RAPGEF5 | |
| hsa-miR-140-5p | PDGFRA, GNG12, RALA, EFNA4, FGF9, BCL2L1 | |
| hsa-miR-877-5p | PLD2 | |
| hsa-miR-602 | RASGRP2 | |
| PI3K-Akt signalling pathway | hsa-miR-30e-5p | ITGB1, ITGA9, ITGA8, EFNA3, PPP2R2B, IGF1R, FGF20, KRAS, IFNAR2, GNG10, DDIT4, PIK3CD, EIF4E, CCNE2, FLT1, SOS1, IL2RA, YWHAZ, IRS1, PDGFC, FOXO3, ITGA4, ITGA6, PPP2R1B, BCL2L11, PDGFA, ITGB3 |
| hsa-miR-1-3p | PRLR, MET, ATF2, PPP2R3A, CREB5, ITGB6, EGFR, GNB1, CDK6, YWHAQ, PPP2R5A, IKBKB, EIF4E, COL4A3, SOS1, YWHAZ, IGF1, FN1, LAMC2, PDGFA | |
| hsa-miR-582-3p | GSK3B, PPP2CA, CREB5, CDKN1B, YWHAQ, PTK2, YWHAZ, ANGPT1, FOXO3, PTEN | |
| hsa-miR-34c-3p | GSK3B, YWHAG, EIF4E, SOS1, GRB2 | |
| hsa-miR-22-5p | PRKCA, MYB, GNG11, PIK3CB, ITGA5, RAF1, IL7R, PTK2, THEM4, SOS1, HSP90B1, PPP2R3C, PKN2, MAP2K1, SGK3 | |
| hsa-miR-665 | COL24A1, COL6A6, CDK6, COL3A1, FGF2, CASP9, AKT3, CDKN1A, TNR, PPP2R1B, KDR | |
| hsa-miR-766-3p | YWHAH, LAMB4, CDC37, COL24A1, PIK3R5, PPP2R5D, IKBKB | |
| hsa-miR-326 | GNGT1, SYK, COL24A1, ITGA5, RAF1, PPP2R5D, IFNAR2, IKBKB, BRCA1, PPP2R5B, FGF9, FGF18, SGK2, GYS1, FGFR2, FGF1, CSF1 | |
| hsa-miR-1244 | ITGB8, LPAR3, ITGAV, HGF | |
| hsa-miR-146b-3p | RAF1, RHEB, RPS6KB2, LPAR5, CCNE1 | |
| hsa-miR-32-5p | PHLPP2, TSC1, GNG11, PRKAA2, ITGA8, PIK3CB, COL27A1, ITGB6, ITGA5, PIK3AP1, GHR, ITGAV, DDIT4, PIK3R3, COL5A1, COL1A2, COL11A1, PIK3CA, ITGA6, PTEN, SGK3, BCL2L11 | |
| hsa-miR-148b-3p | LAMB2, SOS2, ITGB8, ITGA9, NRAS, ITGA5, CDKN1B, YWHAB, ITGA11, COL2A1, PIK3R3, FLT1, SOS1, KITLG, PRKAA1, IGF1, PTEN, CSF1, TEK, BCL2L11, COL4A1, LAMA4 | |
| hsa-let-7i-5p | PRLR, TSC1, MYB, NRAS, CCND2, COL27A1, IGF1R, COL3A1, RPS6KB2, TP53, GHR, FGF11, COL1A1, INSR, NGF, COL1A2, IGF1, ITGA7, COL4A6, CDKN1A, OSMR, COL5A2, COL4A1, IL6R | |
| hsa-miR-671-3p | RPS6KB2 | |
| hsa-miR-1205 | MET, PPP2CA, SYK, PIK3R2, PIK3R5, CCND2, MTCP1, IKBKB, TSC2, EIF4E, RPTOR, MAPK1, CSF3, BCL2L11, PDGFRB | |
| hsa-miR-132-3p | MYB, ITGA9, PRKAA2, CREB5, GNB1, PPP2R5C, KRAS, GHR, EIF4E, COL4A4, SOS1, AKT3, COL11A1, PIK3CA, FOXO3, PTEN, SGK3, MAPK1, COL5A2, C8orf44-SGK3 | |
| hsa-miR-212-3p | MYB, ITGA9, PRKAA2, CREB5, GNB1, PPP2R5C, KRAS, GHR, EIF4E, COL4A4, SOS1, AKT3, COL11A1, PIK3CA, FOXO3, PTEN, SGK3, MAPK1, COL5A2, C8orf44-SGK3 | |
| hsa-miR-1237-3p | PRKAA2, CDC37, CCND2, HSP90AA1, ITGB6, PPP2R5D, COL6A6, GNG10, IL4R, EIF4E, IL2RA, CHRM2, THBS3, COL6A3, PIK3CA, VWF, FN1, TNR, FGF1 | |
| hsa-miR-484 | CREB3L3, LAMB3, PPP2R5D, IFNAR1, CRTC2, PIK3CD, PDGFD, FGF8, FGF1, CSF1, PDGFA | |
| hsa-miR-503-5p | MYB, CCND2, IGF1R, GHR, EIF4E, PIK3R1, INSR, FGF2, AKT3, CCNE1, VEGFA, FGF7, CCND3, COL4A1 | |
| hsa-miR-147a | CREB3L3, FGF14, BCL2, CDK6, FGF11, ITGA11, PDGFB, LPAR5, PDGFC, TNR, PDPK1, FGFR2, PPP2R1B | |
| hsa-miR-106b-5p | PHLPP2, RBL2, PDGFRA, ITGB8, PPP2CA, CREB5, MCL1, CCND1, EIF4E, PPP2R2A, F2R, FLT1, SOS1, CHRM2, EIF4E2, PDGFD, OSM, PKN2, CDKN1A, MAPK1, JAK1, GNB5, BCL2L11 | |
| hsa-miR-545-3p | PRLR, PDGFB, IRS1, PDGFD, RPS6KB1 | |
| hsa-miR-204-5p | CREB5, CCND2, FGF20, COL6A6, IL7R, CREB1, SOS1, COL5A3 | |
| hsa-miR-425-5p | YWHAG, CREB1, SOS1, FGF9, G6PC2, IGF1, TNR, PTEN | |
| hsa-miR-450a-5p | CREB1 | |
| hsa-miR-140-5p | PDGFRA, GNG12, EFNA4, FGF9, BCL2L1, CREB3L1, PKN2, GYS1, TNN | |
| hsa-miR-30b-3p | PHLPP2, GSK3B, COL27A1, EFNA5, FGF11, EIF4B, COL11A2, VWF, MAPK1 | |
| hsa-miR-185-3p | PRKCA, GNG13, FGF17, CRTC2, SGK2, MAPK1 | |
| hsa-miR-185-5p | PHLPP2, CDK2, CCND2, GNB3, IL7, ITGA1, CDK6, BRCA1, EIF4B, EIF4E2, RELA, VEGFA, PPP2R1B | |
| hsa-miR-431-5p | ITGA1, LAMC2 | |
| hsa-miR-30c-1-3p | PHLPP2, GSK3B, G6PC3, FGF11, SOS1 | |
| hsa-miR-920 | IL2RB, PCK2, ITGA3, CSF1 | |
| hsa-miR-671-5p | NFKB1, THBS1, PPP2R5C, BRCA1, KIT, PRKAA1, SGK2 | |
| hsa-miR-622 | ATF2, CREB5, ITGB5, COL2A1, PTEN | |
| hsa-miR-146b-5p | PDGFRA, NRAS, COL4A3 | |
| hsa-miR-542-5p | IKBKB | |
| hsa-miR-219a-1-3p | FASLG, IGF1, IL6R | |
| hsa-miR-425-3p | FN1 | |
| FoxO signalling pathway | hsa-miR-148b-3p | SOS2, NRAS, CDKN1B, GADD45A, PIK3R3, S1PR1, SOS1, PRKAA1, IGF1, TGFB2, HOMER1, USP7, PTEN, BCL2L11 |
| hsa-miR-671-5p | STK4, SMAD3, PRKAA1, SGK2, MAPK10 | |
| hsa-miR-503-5p | CCND2, IGF1R, PIK3R1, INSR, AKT3 | |
| hsa-miR-665 | STAT3, TGFBR1, SETD7, NLK, AKT3, SOD2, CDKN1A | |
| hsa-miR-132-3p | SMAD2, PRKAA2, SIRT1, KRAS, NLK, SOS1, TGFB2, EP300, AKT3, SOD2, PIK3CA, FOXO3, PTEN, SGK3, MAPK1, C8orf44-SGK3 | |
| hsa-miR-212-3p | SMAD2, PRKAA2, SIRT1, KRAS, NLK, SOS1, TGFB2, EP300, AKT3, SOD2, PIK3CA, FOXO3, PTEN, SGK3, MAPK1, C8orf44-SGK3 | |
| hsa-miR-1237-3p | TGFBR1, FBXO32, SMAD2, PRKAA2, CCND2, MAPK11, BCL6, PIK3CA, USP7 | |
| hsa-miR-106b-5p | BRAF, RBL2, STAT3, SLC2A4, HOMER2, CCND1, SMAD4, S1PR1, MAPK8, SOS1, SOD2, CDKN1A, MAPK1, CCNG2, TGFBR2, BCL2L11 | |
| hsa-miR-147a | RAG1, CDKN2B, NLK, FOXG1, EP300, PDPK1, MAPK10 | |
| hsa-miR-34c-3p | SMAD2, SOS1, HOMER1, PLK4, GRB2 | |
| hsa-miR-30c-1-3p | SMAD2, STK4, G6PC3, SOS1, SOD2, HOMER1 | |
| hsa-miR-22-5p | PIK3CB, RAF1, IL7R, SOS1, CSNK1E, MAP2K1, SGK3 | |
| hsa-miR-1244 | FBXO25, STAT3, MAPK8 | |
| hsa-miR-30e-5p | IRS2, FBXO32, SMAD2, SIRT1, SETD7, CAT, IGF1R, KRAS, PIK3CD, SKP2, MAPK8, FOXG1, SOS1, IRS1, BCL6, FOXO3, ATG12, BCL2L11 | |
| hsa-miR-622 | SIRT1, PTEN | |
| hsa-miR-32-5p | IRS2, BRAF, RAG1, FBXO32, PRKAA2, PIK3CB, SETD7, KLF2, NLK, PIK3R3, PIK3CA, PTEN, SGK3, BCL2L11 | |
| hsa-miR-1205 | SLC2A4, SMAD2, BNIP3, PIK3R2, PIK3R5, CCND2, IKBKB, SMAD4, GRM1, BCL6, SOD2, MAPK1, BCL2L11 | |
| hsa-miR-425-5p | MAPK8, GRM1, SOS1, G6PC2, IGF1, SOD, PTEN | |
| hsa-let-7i-5p | IRS2, TGFBR1, NRAS, CCND2, IGF1R, TNFSF10, HOMER2, MAPK8, INSR, IGF1, CDKN1A, IL10 | |
| hsa-miR-1-3p | EGFR, IKBKB, SOS1, IGF1 | |
| hsa-miR-219a-1-3p | SMAD2, FASLG, IGF1 | |
| hsa-miR-766-3p | FBXO32, PIK3R5, IKBKB, NLK, SKP2 | |
| hsa-miR-582-3p | CDKN1B, FOXO3, PTEN, CREBBP | |
| hsa-miR-185-3p | MAPK14, CDK2, CCND2 | |
| hsa-miR-326 | RAF1, SMAD3, IKBKB, SGK2 | |
| hsa-miR-30b-3p | SETD7, SOD2, MAPK1 | |
| hsa-miR-146b-5p | BRAF, NRAS, SMAD4, SOD2 | |
| hsa-miR-204-5p | CCND2, IL7R, SOS1 | |
| hsa-miR-484 | PIK3CD, GRM1 | |
| hsa-miR-431-5p | IRS2 | |
| hsa-miR-602 | FOXG1 | |
| hsa-miR-140-5p | NLK, GABARAPL1, CSNK1E | |
| hsa-miR-920 | PCK2 | |
| hsa-miR-542-5p | IKBKB | |
| hsa-miR-545-3p | STAT3, IRS1 | |
| hsa-miR-146b-3p | RAF1 | |
| hsa-miR-185-5p | MAPK14, CDK2, CCND2 | |
| Rap1 signalling pathway | sa-miR-106b-5p | BRAF, PDGFRA, SIPA1L3, CRK, MAGI3, TIAM1, F2RL3, RAPGEF4, PFN2, F2R, FLT1, DOCK4, PDGFD, MAPK1, RAPGEF5, GRIN2B |
| hsa-let-7i-5p | ACTB, NRAS, IGF1R, FGF11, INSR, NGF, IGF1, PARD6B | |
| hsa-miR-148b-3p | NRAS, MRAS, PIK3R3, FLT1, KITLG, IGF1, CSF1, TEK, GRIN2B | |
| hsa-miR-146b-5p | BRAF, PDGFRA, NRAS, SIPA1L1, GRIN2B | |
| hsa-miR-431-5p | PLCB1, RAPGEF2, PRKD1, RAPGEF5 | |
| hsa-miR-503-5p | CRK, IGF1R, RAPGEF2, PIK3R1, INSR, FGF2, AKT3, SIPA1L2, VEGFA, FGF7, PARD6B | |
| hsa-miR-30e-5p | MAGI2, ITGB1, EFNA3, IGF1R, FGF20, KRAS, RAPGEF4, PIK3CD, PFN2, RAPGEF2, FLT1, DOCK4, GNAQ, PDGFC, GNAI2, RASGRP3, GRIN2A, RAP1B, PDGFA, ITGB3 | |
| hsa-miR-1-3p | ACTB, MAGI2, MET, ADCY1, RAP1A, EGFR, CALM2, PFN2, RAPGEF2, FYB, IGF1, MAGI1, RAP1B, PDGFA | |
| hsa-miR-1244 | LPAR3, RHOA, RAPGEF2, HGF, RAP1B | |
| hsa-miR-582-3p | RHOA, RAPGEF2, ANGPT1 | |
| hsa-miR-324-3p | RAP1GAP | |
| hsa-miR-920 | RAP1GAP, GNAO1, CSF1 | |
| hsa-miR-32-5p | BRAF, PIK3CB, RAP1A, ADCY3, PIK3R3, GNAQ, PIK3CA, RAP1B | |
| hsa-miR-22-5p | MAGI2, PRKCA, PIK3CB, RAP1A, RAF1, BCAR1, CNR1, MAP2K1, GRIN2B | |
| hsa-miR-30b-3p | PRKCI, EFNA5, VAV2, FGF11, CDH1, RALB, MAPK1, GRIN2B | |
| hsa-miR-185-3p | PRKCA, FGF17, MAPK13, MAPK1 | |
| hsa-miR-147a | FGF14, CRKL, ADCY2, CALM1, TIAM1, FGF11, PLCG1, ITGAM, PDGFB, LPAR5, PRKCB, PDGFC, FGFR2, GRIN2B | |
| hsa-miR-545-3p | CRK, PFN2, PDGFB, GNAQ, PDGFD | |
| hsa-miR-484 | RAPGEF3, LAT, CALM1, RASGRP2, F2RL3, CDH1, PIK3CD, PDGFD, FGF8, GRIN1, FGF1, CSF1, PDGFA | |
| hsa-miR-140-5p | PDGFRA, ADCY7, RALA, EFNA4, DRD2, PFN2, RAPGEF6, FGF9, FYB, GNAQ, ADCY6 | |
| hsa-miR-326 | RAF1, MAGI3, MRAS, FGF9, FGF18, FGFR2, TLN1, FGF1, CSF1, GRIN2B | |
| hsa-miR-185-5p | ADCY2, MAPK14, MAP2K6, SIPA1L1, CDC42, PRKCB, VEGFA, ADCY4, GRIN2B | |
| hsa-miR-34c-3p | MAGI3, MRAS, MAP2K6 | |
| hsa-miR-30c-1-3p | MAP2K6, FGF11, GRIN2A, GRIN2B | |
| hsa-miR-766-3p | PIK3R5, RASGRP2, PRKCG, ADCY4, PLCB2, GRIN2B | |
| hsa-miR-1205 | MET, RAPGEF1, CTNND1, PIK3R2, PIK3R5, RASGRP2, SPECC1L-ADORA2A, RAPGEF6, RASGRP3, MAPK1, PDGFRB, GRIN2B | |
| hsa-miR-665 | RALA, FGF2, AKT3, MAGI1, KDR, GRIN2B | |
| hsa-miR-204-5p | FGF20, MAGI1, ADCY6 | |
| hsa-miR-425-5p | CTNND1, FGF9, PRKCB, IGF1, GNAQ, GRIN2B | |
| hsa-miR-132-3p | CRK, ADCY3, MAGI3, KRAS, AKT3, PIK3CA, PRKD1, MAPK1, GRIN2B | |
| hsa-miR-212-3p | CRK, ADCY3, MAGI3, KRAS, AKT3, PIK3CA, PRKD1, MAPK1, GRIN2B | |
| hsa-miR-1237-3p | ACTB, SPECC1L-ADORA2A, MAPK11, GNAI2, PIK3CA, FGF1, GNAI1, GRIN2B | |
| hsa-miR-146b-3p | RAF1, MLLT4, LPAR5, PRKCB | |
| hsa-miR-671-5p | THBS1, RAPGEF6, KIT, ADCY4 | |
| hsa-miR-622 | PLCB1 | |
| hsa-miR-219a-1-3p | IGF1, SIPA1L2 | |
| hsa-miR-602 | RASGRP2 | |
| hsa-miR-877-5p | RASGRP3 |
Publisher’s Note: MDPI stays neutral with regard to jurisdictional claims in published maps and institutional affiliations. |
© 2022 by the authors. Licensee MDPI, Basel, Switzerland. This article is an open access article distributed under the terms and conditions of the Creative Commons Attribution (CC BY) license (https://creativecommons.org/licenses/by/4.0/).
Share and Cite
Watson, C.N.; Begum, G.; Ashman, E.; Thorn, D.; Yakoub, K.M.; Hariri, M.A.; Nehme, A.; Mondello, S.; Kobeissy, F.; Belli, A.; et al. Co-Expression Analysis of microRNAs and Proteins in Brain of Alzheimer’s Disease Patients. Cells 2022, 11, 163. https://doi.org/10.3390/cells11010163
Watson CN, Begum G, Ashman E, Thorn D, Yakoub KM, Hariri MA, Nehme A, Mondello S, Kobeissy F, Belli A, et al. Co-Expression Analysis of microRNAs and Proteins in Brain of Alzheimer’s Disease Patients. Cells. 2022; 11(1):163. https://doi.org/10.3390/cells11010163
Chicago/Turabian StyleWatson, Callum N., Ghazala Begum, Emma Ashman, Daniella Thorn, Kamal M. Yakoub, Moustafa Al Hariri, Ali Nehme, Stefania Mondello, Firas Kobeissy, Antonio Belli, and et al. 2022. "Co-Expression Analysis of microRNAs and Proteins in Brain of Alzheimer’s Disease Patients" Cells 11, no. 1: 163. https://doi.org/10.3390/cells11010163
APA StyleWatson, C. N., Begum, G., Ashman, E., Thorn, D., Yakoub, K. M., Hariri, M. A., Nehme, A., Mondello, S., Kobeissy, F., Belli, A., & Di Pietro, V. (2022). Co-Expression Analysis of microRNAs and Proteins in Brain of Alzheimer’s Disease Patients. Cells, 11(1), 163. https://doi.org/10.3390/cells11010163