
Metabolomic Fingerprint of Mecp2-Deficient Mouse Cortex: Evidence for a Pronounced Multi-Facetted Metabolic Component in Rett Syndrome


Abstract
:1. Introduction
2. Materials and Methods
2.1. Mouse Model and Tissue Isolation
2.2. Metabolomic Analyses
2.3. Bioinformatic Analyses
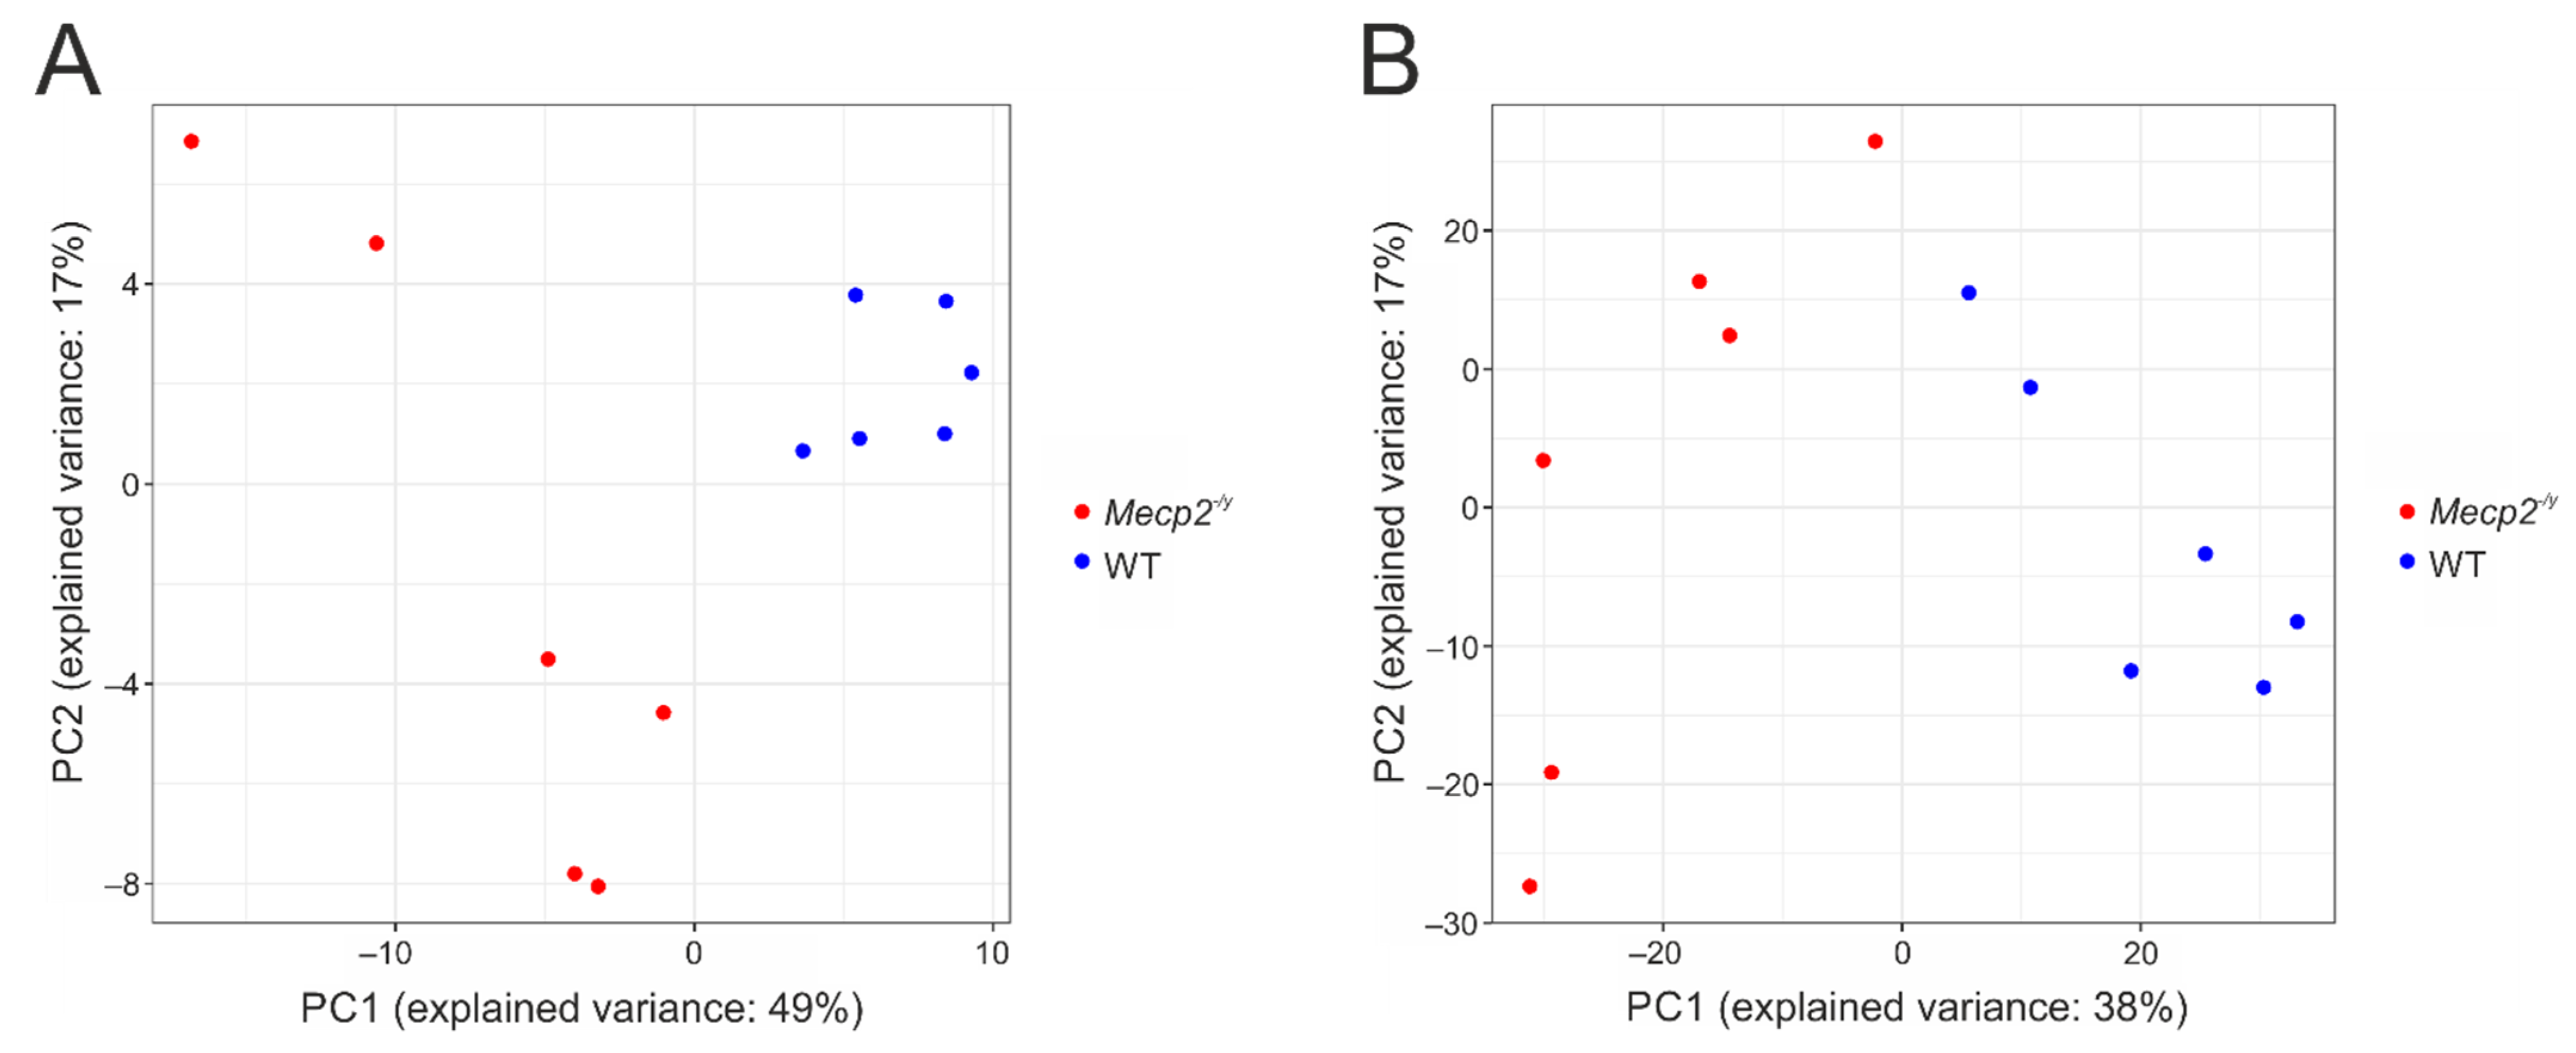
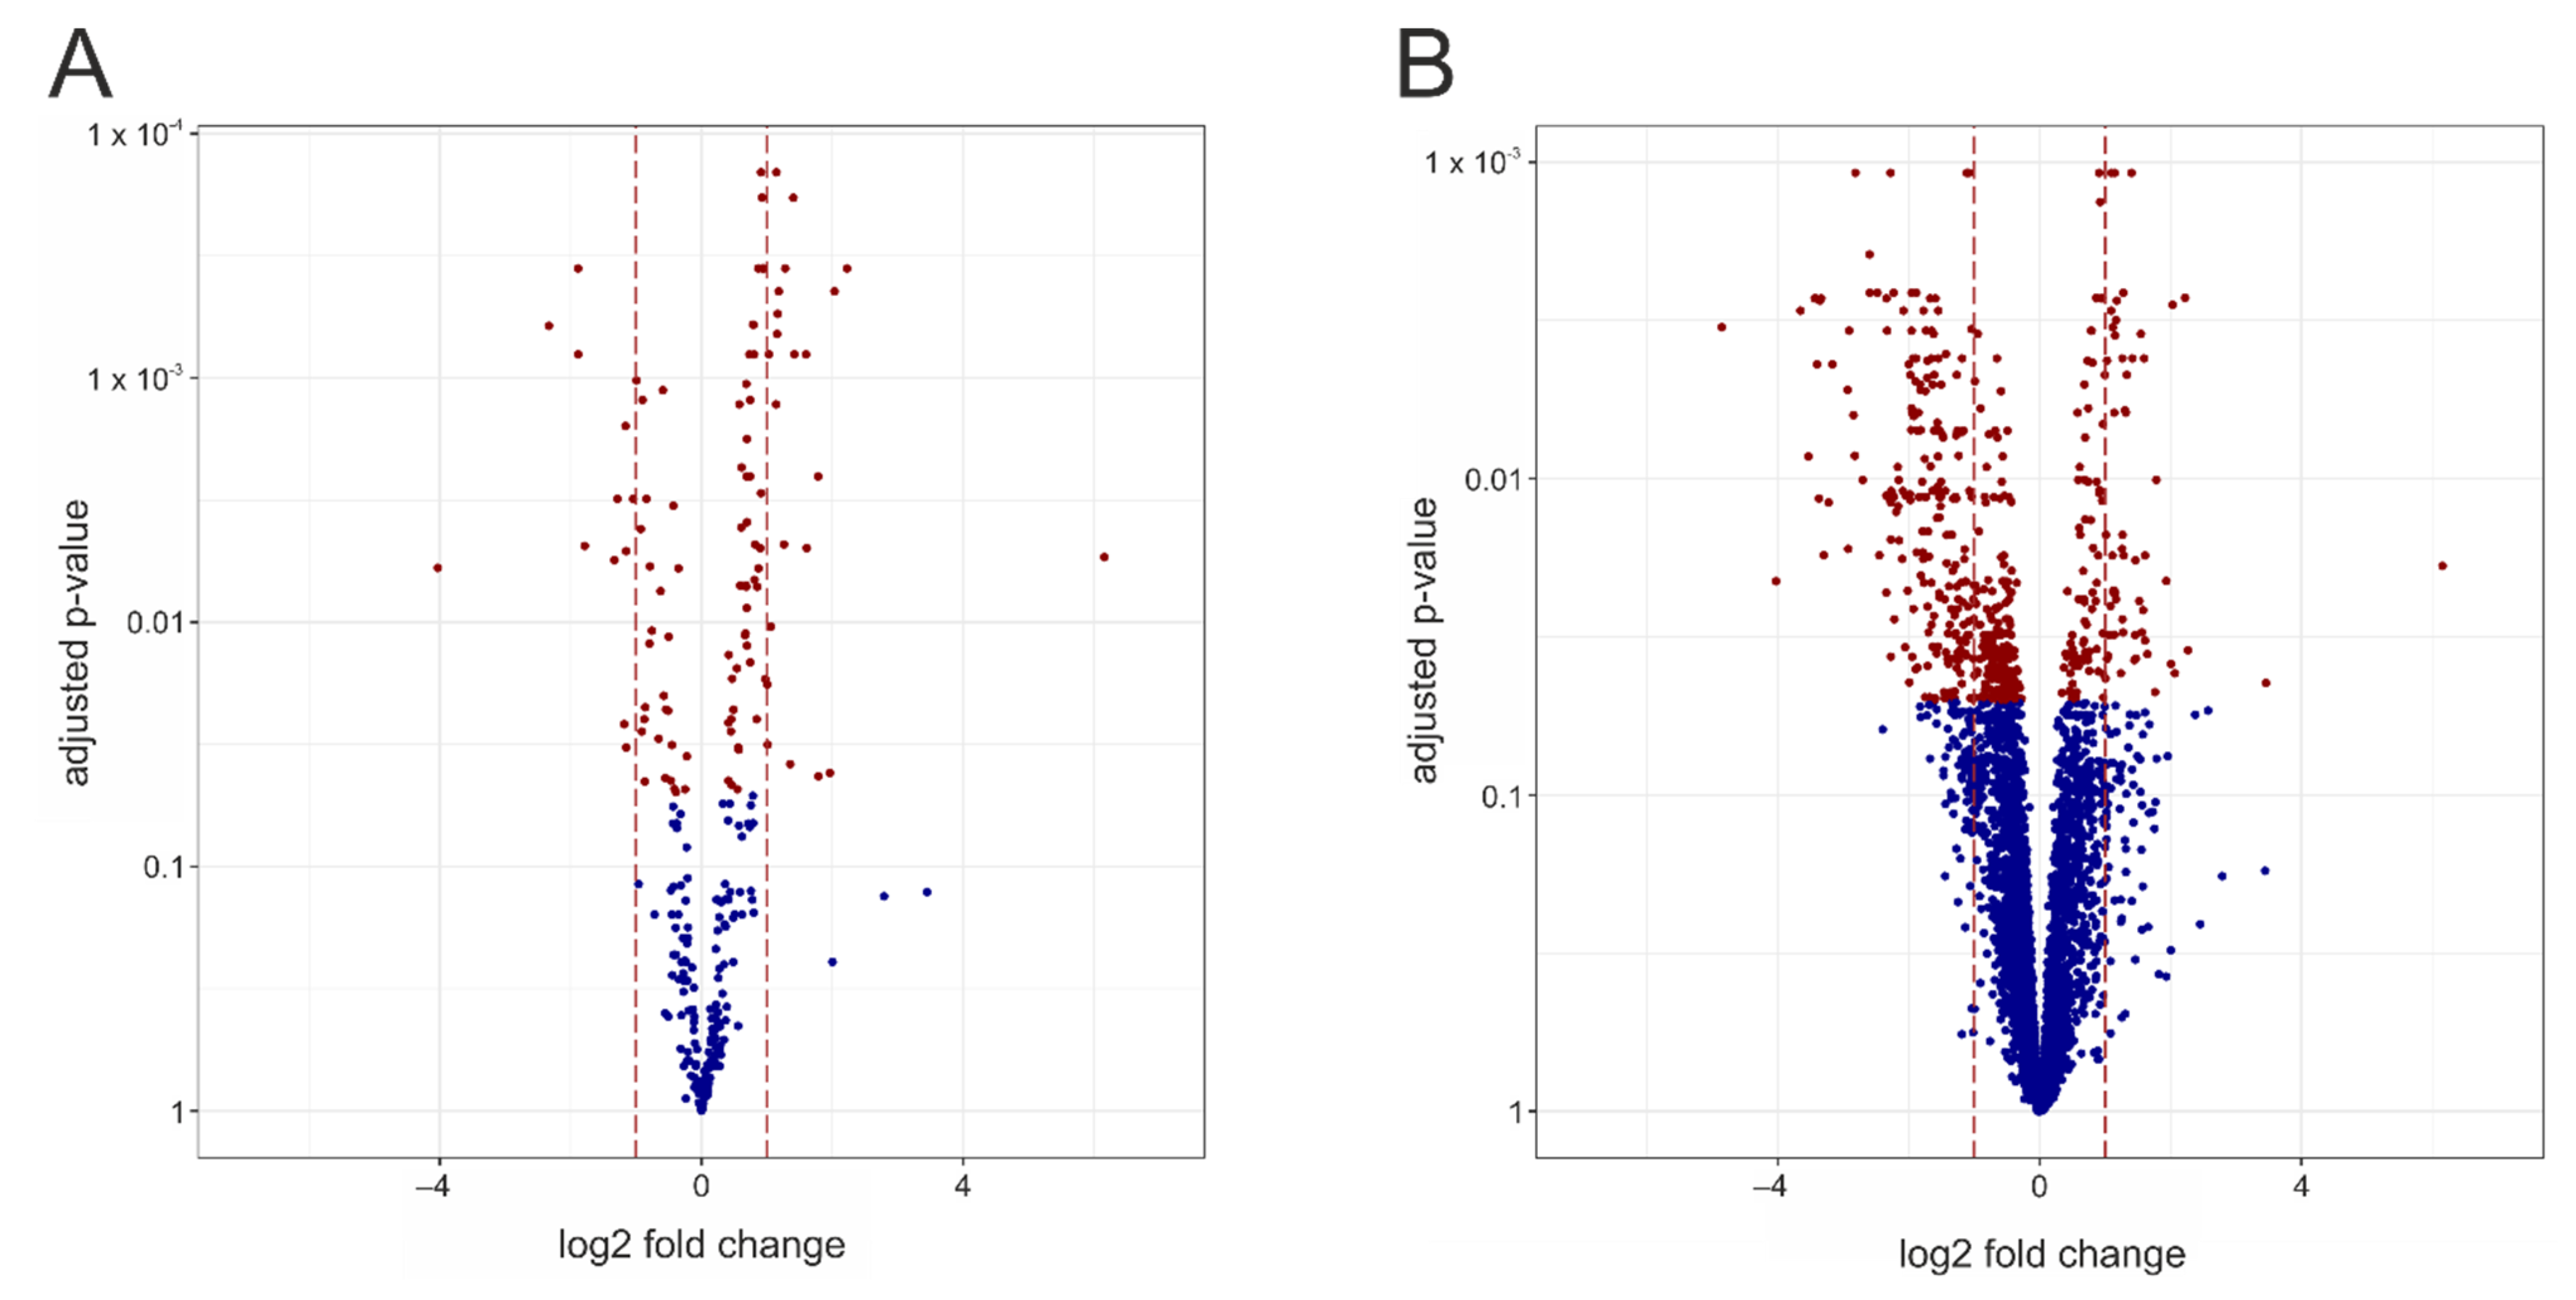
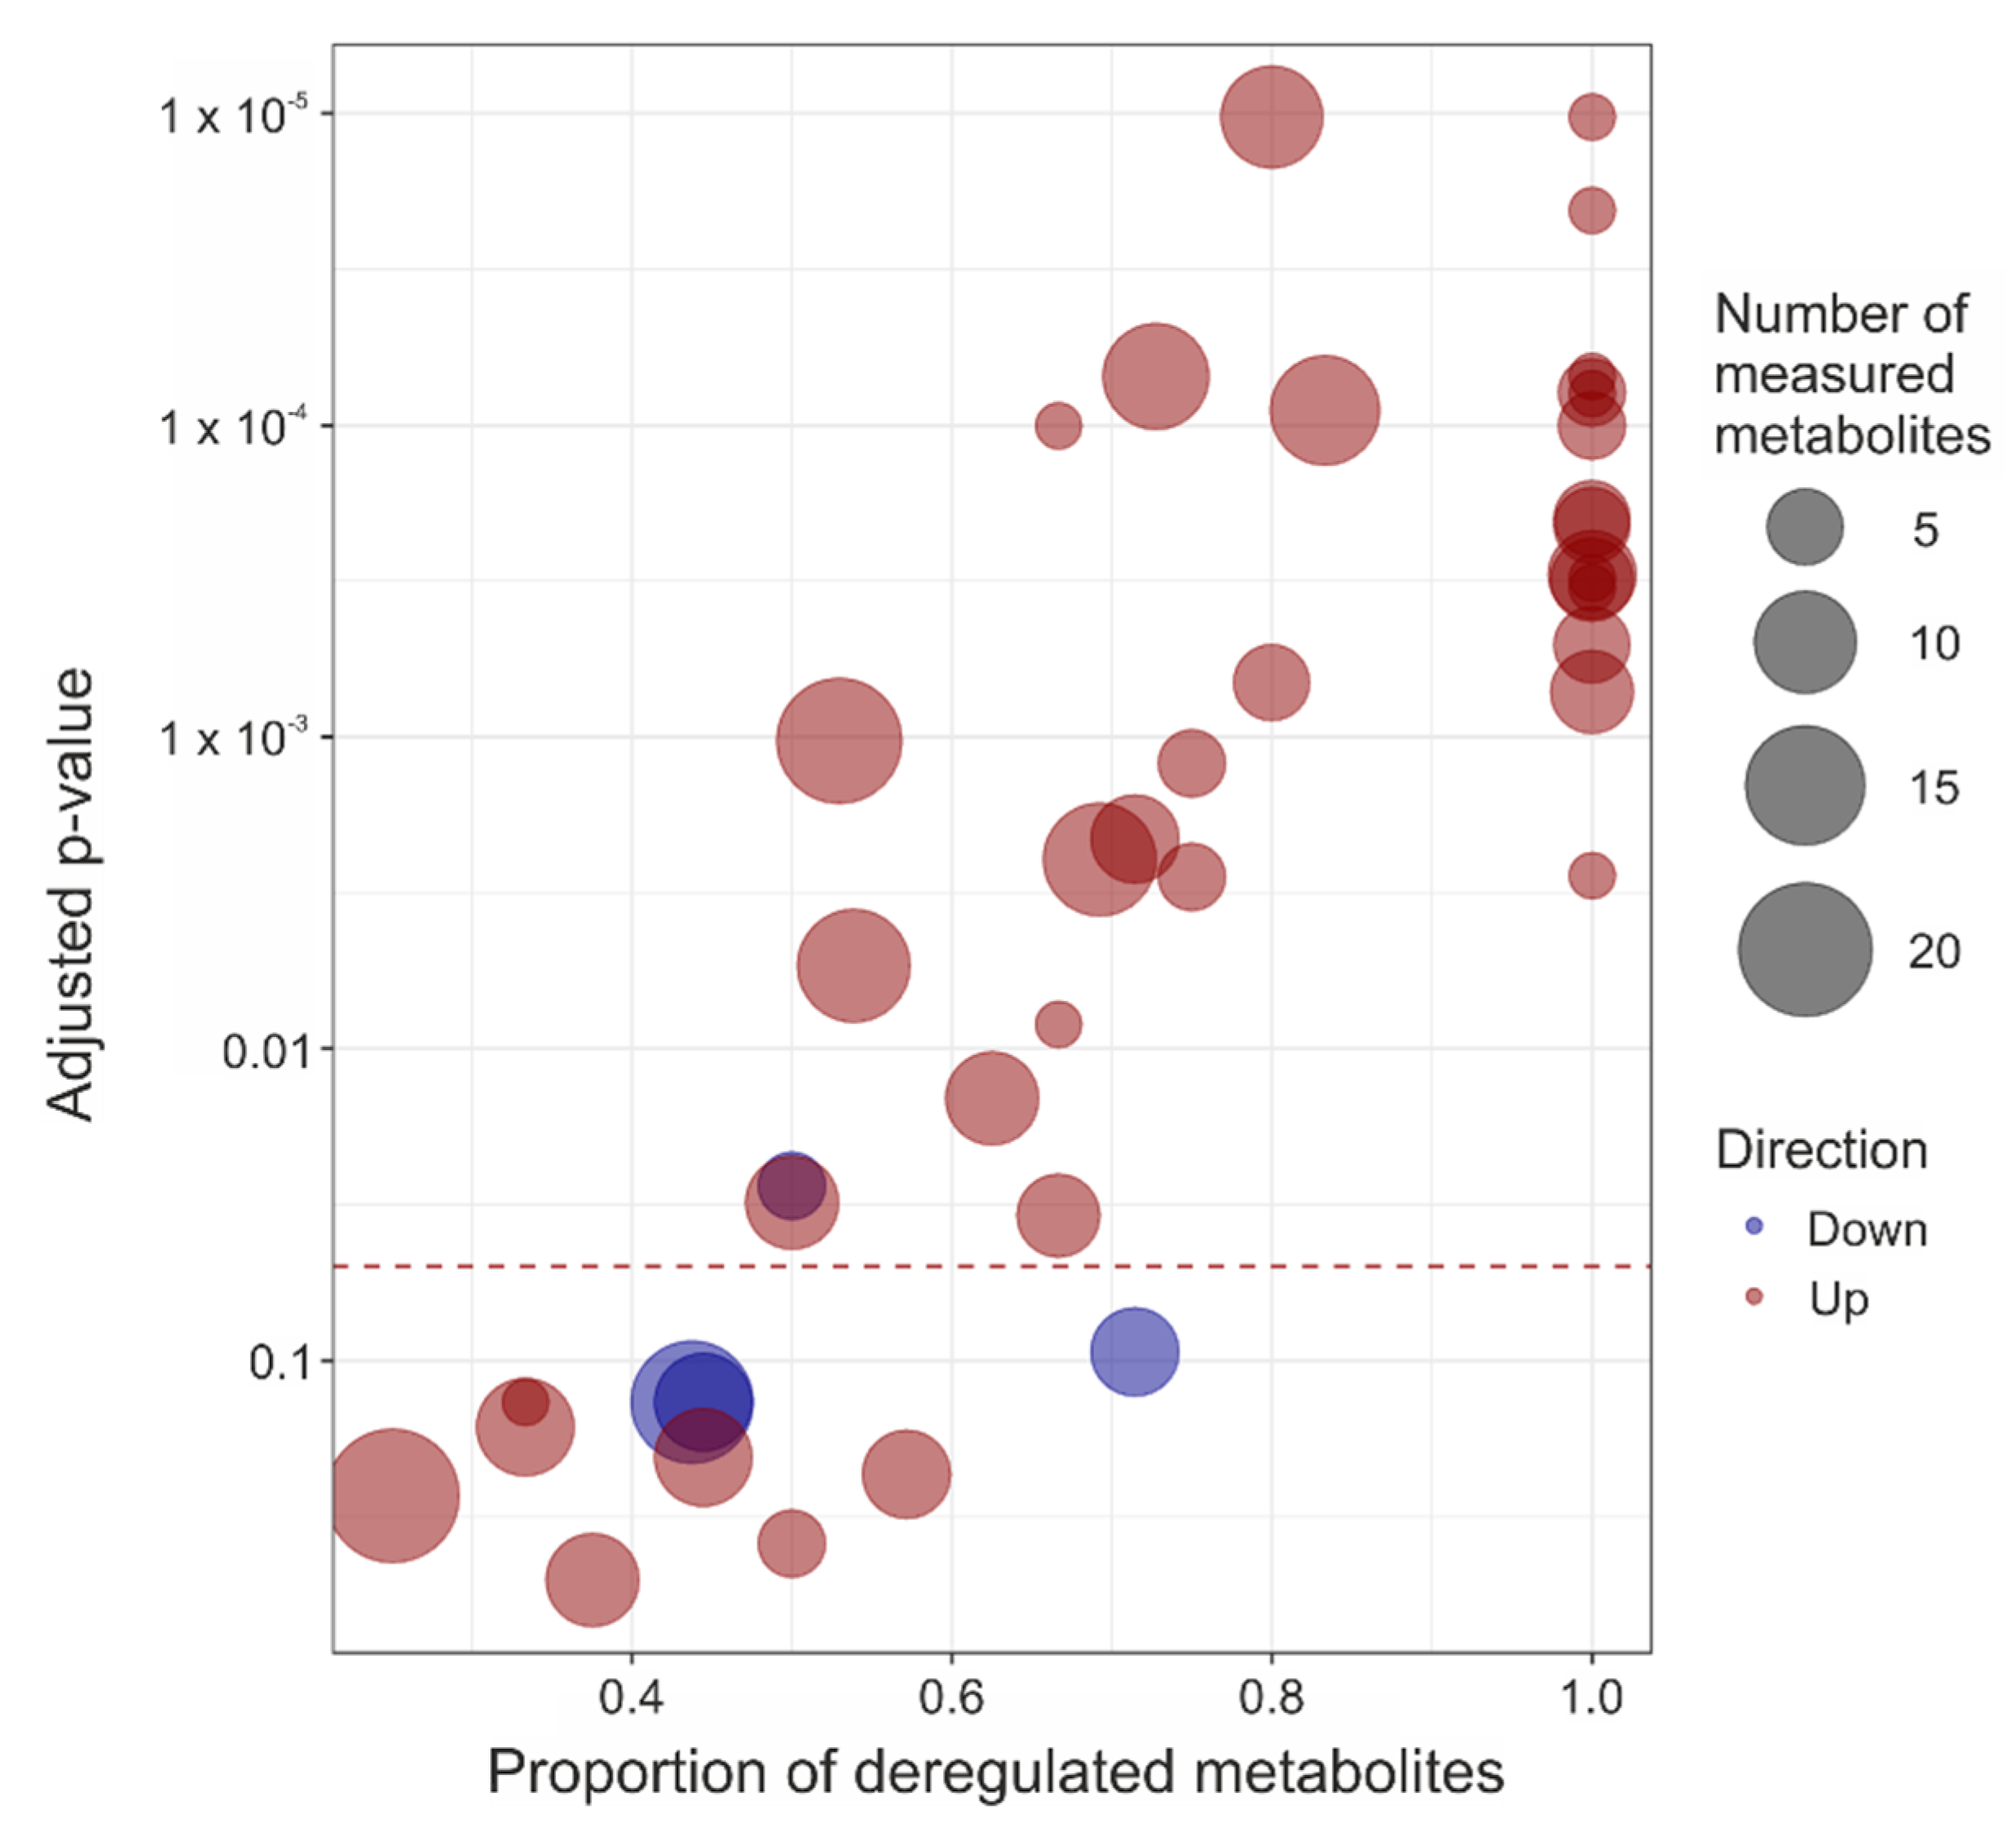
3. Results
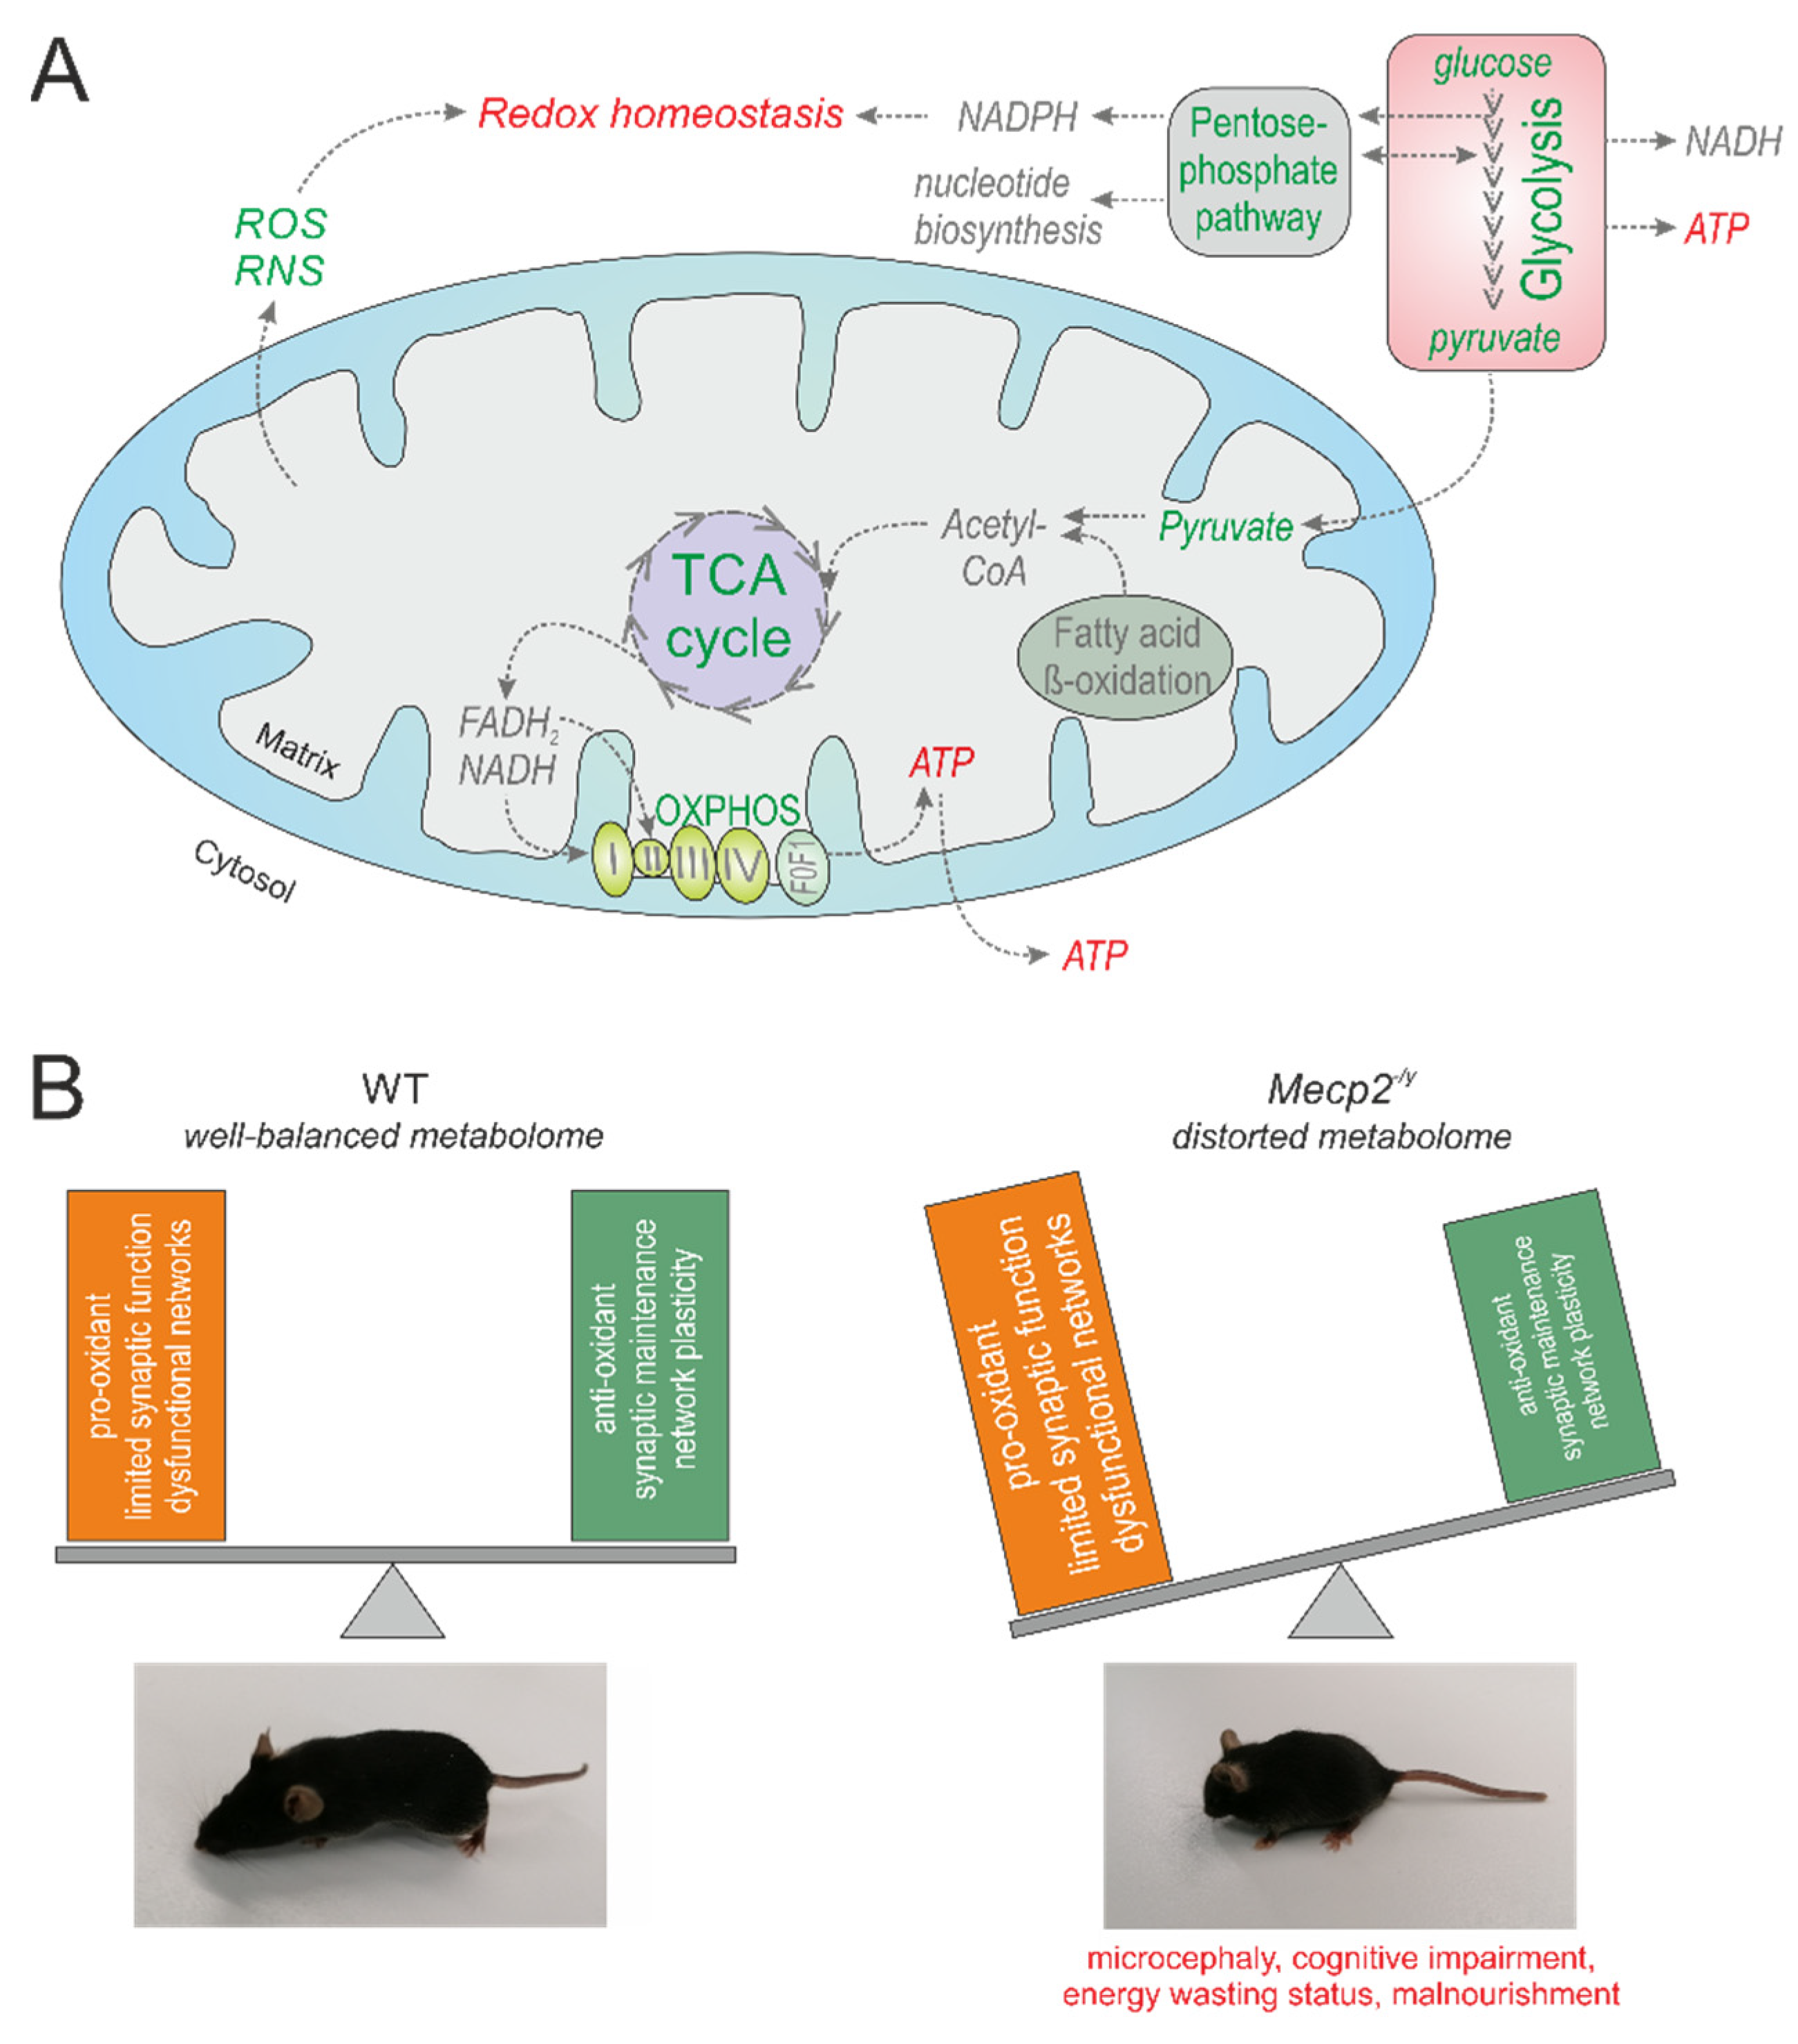
4. Discussion
4.1. Carbohydrate Metabolism
4.2. General Energy Metabolism
4.3. Amino Acid Metabolism
4.4. Dipeptides
4.5. Urea
4.6. Neurotransmitters
4.7. Lipid Metabolism
4.8. Markers of Oxidative Stress
4.9. Concluding Remarks
Supplementary Materials
Author Contributions
Funding
Institutional Review Board Statement
Informed Consent Statement
Data Availability Statement
Acknowledgments
Conflicts of Interest
References
- Rett, A. Über ein eigenartiges hirnatrophisches Syndrom bei Hyperammonämie im Kindesalter. Wien. Med. Wochenschr. 1966, 116, 723–726. [Google Scholar] [PubMed]
- Hagberg, B.; Aicardi, J.; Dias, K.; Ramos, O. A progressive syndrome of autism, dementia, ataxia, and loss of purposeful hand use in girls: Rett’s syndrome: Report of 35 cases. Ann. Neurol. Off. J. Am. Neurol. Assoc. Child Neurol. Soc. 1983, 14, 471–479. [Google Scholar] [CrossRef] [PubMed]
- Amir, R.E.; Van den Veyver, I.B.; Wan, M.; Tran, C.Q.; Francke, U.; Zoghbi, H.Y. Rett syndrome is caused by mutations in X-linked MECP2, encoding methyl-CpG-binding protein 2. Nat. Genet. 1999, 23, 185–188. [Google Scholar] [CrossRef] [PubMed]
- Amir, R.E.; Zoghbi, H.Y. Rett syndrome: Methyl-CpG-binding protein 2 mutations and phenotype-genotype correlations. Am. J. Med. Genet. 2000, 97, 147–152. [Google Scholar] [CrossRef]
- Chahrour, M.; Zoghbi, H.Y. The story of Rett syndrome: From clinic to neurobiology. Neuron 2007, 56, 422–437. [Google Scholar] [CrossRef] [Green Version]
- Neul, J.L.; Kaufmann, W.E.; Glaze, D.G.; Christodoulou, J.; Clarke, A.J.; Bahi-Buisson, N.; Leonard, H.; Bailey, M.E.; Schanen, N.C.; Zappella, M.; et al. Rett syndrome: Revised diagnostic criteria and nomenclature. Ann. Neurol. 2010, 68, 944–950. [Google Scholar] [CrossRef] [Green Version]
- Ramirez, J.M.; Ward, C.S.; Neul, J.L. Breathing challenges in Rett syndrome: Lessons learned from humans and animal models. Respir. Physiol. Neurobiol. 2013, 189, 280–287. [Google Scholar] [CrossRef] [PubMed] [Green Version]
- Eeg-Olofsson, O.; al-Zuhair, A.G.; Teebi, A.S.; al-Essa, M.M. Abnormal mitochondria in the Rett syndrome. Brain Dev. 1988, 10, 260–262. [Google Scholar] [CrossRef]
- Eeg-Olofsson, O.; al-Zuhair, A.G.; Teebi, A.S.; Daoud, A.S.; Zaki, M.; Besisso, M.S.; Al-Essa, M.M. Rett syndrome: A mitochondrial disease? J. Child Neurol. 1990, 5, 210–214. [Google Scholar] [CrossRef]
- Matsuishi, T.; Urabe, F.; Percy, A.K.; Komori, H.; Yamashita, Y.; Schultz, R.S.; Ohtani, Y.; Kuriya, N.; Kato, H. Abnormal carbohydrate metabolism in cerebrospinal fluid in Rett syndrome. J. Child Neurol. 1994, 9, 26–30. [Google Scholar] [CrossRef]
- Haas, R.H.; Light, M.; Rice, M.; Barshop, B.A. Oxidative metabolism in Rett syndrome: 1. Clinical studies. Neuropediatrics 1995, 26, 90–94. [Google Scholar] [CrossRef] [PubMed]
- Großer, E.; Hirt, U.; Janc, O.A.; Menzfeld, C.; Fischer, M.; Kempkes, B.; Vogelgesang, S.; Manzke, T.U.; Opitz, L.; Salinas-Riester, G.; et al. Oxidative burden and mitochondrial dysfunction in a mouse model of Rett syndrome. Neurobiol. Dis. 2012, 48, 102–114. [Google Scholar] [CrossRef]
- Janc, O.A.; Hüser, M.A.; Dietrich, K.; Kempkes, B.; Menzfeld, C.; Hülsmann, S.; Müller, M. Systemic radical scavenger treatment of a mouse model of Rett syndrome: Merits and limitations of the vitamin E derivative Trolox. Front. Cell. Neurosci. 2016, 10, 266. [Google Scholar] [CrossRef] [Green Version]
- Villemagne, P.M.; Naidu, S.; Villemagne, V.L.; Yaster, M.; Wagner, H.N., Jr.; Harris, J.C.; Moser, H.W.; Johnston, M.V.; Dannals, R.F.; Wong, D.F. Brain glucose metabolism in Rett Syndrome. Pediatric Neurol. 2002, 27, 117–122. [Google Scholar] [CrossRef]
- Cappuccio, G.; Donti, T.; Pinelli, M.; Bernardo, P.; Bravaccio, C.; Elsea, S.H.; Brunetti-Pierri, N. Sphingolipid metabolism perturbations in Rett syndrome. Metabolites 2019, 9, 221. [Google Scholar] [CrossRef] [Green Version]
- Justice, M.J.; Buchovecky, C.M.; Kyle, S.M.; Djukic, A. A role for metabolism in Rett syndrome pathogenesis: New clinical findings and potential treatment targets. Rare Dis. 2013, 1, e27265. [Google Scholar] [CrossRef] [PubMed] [Green Version]
- Viola, A.; Saywell, V.; Villard, L.; Cozzone, P.J.; Lutz, N.W. Metabolic fingerprints of altered brain growth, osmoregulation and neurotransmission in a rett syndrome model. PLoS ONE 2007, 2, e157. [Google Scholar] [CrossRef] [Green Version]
- Aldosary, M.; Al-Bakheet, A.; Al-Dhalaan, H.; Almass, R.; Alsagob, M.; Al-Younes, B.; AlQuait, L.; Mustafa, O.M.; Bulbul, M.; Rahbeeni, Z.; et al. Rett syndrome, a neurodevelopmental disorder, whole-transcriptome, and mitochondrial genome multiomics analyses identify novel variations and disease pathways. OMICS 2020, 24, 160–171. [Google Scholar] [CrossRef] [PubMed]
- Park, M.J.; Aja, S.; Li, Q.; Degano, A.L.; Penati, J.; Zhuo, J.; Roe, C.R.; Ronnett, G.V. Anaplerotic triheptanoin diet enhances mitochondrial substrate use to remodel the metabolome and improve lifespan, motor function, and sociability in MeCP2-null mice. PLoS ONE 2014, 9, e109527. [Google Scholar]
- Jagtap, S.; Thanos, J.M.; Fu, T.; Wang, J.; Lalonde, J.; Dial, T.O.; Feiglin, A.; Chen, J.; Kohane, I.; Lee, J.T.; et al. Aberrant mitochondrial function in patient-derived neural cells from CDKL5 deficiency disorder and Rett syndrome. Hum. Mol. Genet. 2019, 28, 3625–3636. [Google Scholar] [CrossRef]
- De Filippis, B.; Valenti, D.; de Bari, L.; De Rasmo, D.; Musto, M.; Fabbri, A.; Ricceri, L.; Fiorentini, C.; Laviola, G.; Vacca, R.A. Mitochondrial free radical overproduction due to respiratory chain impairment in the brain of a mouse model of Rett syndrome: Protective effect of CNF1. Free. Radic. Biol. Med. 2015, 83, 167–177. [Google Scholar] [CrossRef]
- Can, K.; Menzfeld, C.; Rinne, L.; Rehling, P.; Kügler, S.; Golubiani, G.; Dudek, J.; Müller, M. Neuronal redox-imbalance in Rett syndrome affects mitochondria as well as cytosol, and is accompanied by intensified mitochondrial O2 consumption and ROS release. Front. Physiol. 2019, 10, 479. [Google Scholar] [CrossRef] [PubMed]
- Kriaucionis, S.; Paterson, A.; Curtis, J.; Guy, J.; Macleod, N.; Bird, A. Gene expression analysis exposes mitochondrial abnormalities in a mouse model of Rett syndrome. Mol. Cell. Biol. 2006, 26, 5033–5042. [Google Scholar] [CrossRef] [PubMed] [Green Version]
- Adebayo, O.L.; Dewenter, I.; Rinne, L.; Golubiani, G.; Solomonia, R.; Müller, M. Intensified mitochondrial hydrogen peroxide release occurs in all brain regions, affects male as well as female Rett mice, and constitutes a life-long burden. Arch. Biochem. Biophys. 2020, 696, 108666. [Google Scholar] [CrossRef]
- Sierra, C.; Vilaseca, M.A.; Brandi, N.; Artuch, R.; Mira, A.; Nieto, M.; Pineda, M. Oxidative stress in Rett syndrome. Brain Dev. 2001, 23 (Suppl. 1), S236–S239. [Google Scholar] [CrossRef]
- De Felice, C.; Della Ragione, F.; Signorini, C.; Leoncini, S.; Pecorelli, A.; Ciccoli, L.; Scalabri, F.; Marracino, F.; Madonna, M.; Belmonte, G.; et al. Oxidative brain damage in Mecp2-mutant murine models of Rett syndrome. Neurobiol. Dis. 2014, 68, 66–77. [Google Scholar] [CrossRef]
- De Felice, C.; Signorini, C.; Durand, T.; Oger, C.; Guy, A.; Bultel-Poncé, V.; Galano, J.M.; Ciccoli, L.; Leoncini, S.; D’Esposito, M.; et al. F2-dihomo-isoprostanes as potential early biomarkers of lipid oxidative damage in Rett syndrome. J. Lipid Res. 2011, 52, 2287–2297. [Google Scholar] [CrossRef] [Green Version]
- Pecorelli, A.; Ciccoli, L.; Signorini, C.; Leoncini, S.; Giardini, A.; D’Esposito, M.; Filosa, S.; Hayek, J.; De Felice, C.; Valacchi, G. Increased levels of 4HNE-protein plasma adducts in Rett syndrome. Clin. Biochem. 2011, 44, 368–371. [Google Scholar] [CrossRef] [PubMed]
- Signorini, C.; Leoncini, S.; De Felice, C.; Pecorelli, A.; Meloni, I.; Ariani, F.; Mari, F.; Amabile, S.; Paccagnini, E.; Gentile, M.; et al. Redox imbalance and morphological changes in skin fibroblasts in typical Rett syndrome. Oxidative Med. Cell. Longev. 2014, 2014, 195935. [Google Scholar] [CrossRef] [Green Version]
- Samaco, R.C.; Mandel-Brehm, C.; Chao, H.T.; Ward, C.S.; Fyffe-Maricich, S.L.; Ren, J.; Hyland, K.; Thaller, C.; Maricich, S.M.; Humphreys, P.; et al. Loss of MeCP2 in aminergic neurons causes cell-autonomous defects in neurotransmitter synthesis and specific behavioral abnormalities. Proc. Natl. Acad. Sci USA 2009, 106, 21966–21971. [Google Scholar] [CrossRef] [PubMed] [Green Version]
- Zoghbi, H.Y.; Percy, A.K.; Glaze, D.G.; Butler, I.J.; Riccardi, V.M. Reduction of biogenic amine levels in the Rett syndrome. N. Engl. J. Med. 1985, 313, 921–924. [Google Scholar] [CrossRef] [PubMed]
- Lappalainen, R.; Lindholm, D.; Riikonen, R. Low levels of nerve growth factor in cerebrospinal fluid of children with Rett syndrome. J. Child Neurol. 1996, 11, 296–300. [Google Scholar] [CrossRef] [PubMed]
- Matsuishi, T.; Nagamitsu, S.; Yamashita, Y.; Murakami, Y.; Kimura, A.; Sakai, T.; Shoji, H.; Kato, H.; Percy, A.K. Decreased cerebrospinal fluid levels of substance P in patients with Rett syndrome. Ann. Neurol. Off. J. Am. Neurol. Assoc. Child Neurol. Soc. 1997, 42, 978–981. [Google Scholar] [CrossRef] [PubMed]
- Wenk, G.L.; Hauss-Wegrzyniak, B. Altered cholinergic function in the basal forebrain of girls with Rett syndrome. Neuropediatrics 1999, 30, 125–129. [Google Scholar] [CrossRef]
- Lappalainen, R.; Riikonen, R.S. High levels of cerebrospinal fluid glutamate in Rett syndrome. Pediatric Neurol. 1996, 15, 213–216. [Google Scholar] [CrossRef]
- Wishart, D.S. Metabolomics for investigating physiological and pathophysiological processes. Physiol. Rev. 2019, 99, 1819–1875. [Google Scholar] [CrossRef] [PubMed]
- Neul, J.L.; Skinner, S.A.; Annese, F.; Lane, J.; Heydemann, P.; Jones, M.; Kaufmann, W.E.; Glaze, D.G.; Percy, A.K. Metabolic signatures differentiate Rett syndrome from unaffected siblings. Front. Integr. Neurosci. 2020, 14, 7. [Google Scholar] [CrossRef] [PubMed]
- Thapa, S.; Venkatachalam, A.; Khan, N.; Naqvi, M.; Balderas, M.; Runge, J.K.; Haag, A.; Hoch, K.M.; Glaze, D.G.; Luna, R.A.; et al. Assessment of the gut bacterial microbiome and metabolome of girls and women with Rett Syndrome. PLoS ONE 2021, 16, e0251231. [Google Scholar]
- Pulsinelli, W.A.; Brierley, J.B.; Plum, F. Temporal profile of neuronal damage in a model of transient forebrain ischemia. Ann. Neurol. Off. J. Am. Neurol. Assoc. Child Neurol. Soc. 1982, 11, 491–498. [Google Scholar] [CrossRef]
- Schmidt-Kastner, R.; Freund, T.F. Selective vulnerability of the hippocampus in brain ischemia. Neuroscience 1991, 40, 599–636. [Google Scholar] [CrossRef]
- Guy, J.; Hendrich, B.; Holmes, M.; Martin, J.E.; Bird, A. A mouse Mecp2-null mutation causes neurological symptoms that mimic Rett syndrome. Nat. Genet. 2001, 27, 322–326. [Google Scholar] [CrossRef] [PubMed]
- Salem, M.A.; Jüppner, J.; Bajdzienko, K.; Giavalisco, P. Protocol: A fast, comprehensive and reproducible one-step extraction method for the rapid preparation of polar and semi-polar metabolites, lipids, proteins, starch and cell wall polymers from a single sample. Plant Methods 2016, 12, 45. [Google Scholar] [CrossRef] [PubMed] [Green Version]
- Smyth, G.K. Limma: Linear models for microarray data. In Bioinformatics and Computational Biology Solutions Using R and Bioconductor; Gentleman, R., Carey, V., Dudoit, S., Irizarry, R., Huber, W., Eds.; Springer: New York, NY, USA, 2005; pp. 397–420. [Google Scholar]
- Wu, D.; Lim, E.; Vaillant, F.; Asselin-Labat, M.L.; Visvader, J.E.; Smyth, G.K. ROAST: Rotation gene set tests for complex microarray experiments. Bioinformatics 2010, 26, 2176–2182. [Google Scholar] [CrossRef]
- Benjamini, Y.; Hochberg, Y. Controlling the false discovery rate: A practical and powerful approach to multiple testing. J. R. Stat. Soc. Ser. B 1995, 57, 289–300. [Google Scholar] [CrossRef]
- Taverna, F.; Goveia, J.; Karakach, T.K.; Khan, S.; Rohlenova, K.; Treps, L.; Subramanian, A.; Schoonjans, L.; Dewerchin, M.; Eelen, G.; et al. BIOMEX: An interactive workflow for (single cell) omics data interpretation and visualization. Nucleic Acids Res. 2020, 48, W385–W394. [Google Scholar] [CrossRef] [PubMed]
- Johnson, B.S.; Zhao, Y.T.; Fasolino, M.; Lamonica, J.M.; Kim, Y.J.; Georgakilas, G.; Wood, K.H.; Bu, D.; Cui, Y.; Goffin, D.; et al. Biotin tagging of MeCP2 in mice reveals contextual insights into the Rett syndrome transcriptome. Nat. Med. 2017, 23, 1203–1214. [Google Scholar] [CrossRef]
- Osenberg, S.; Karten, A.; Sun, J.; Li, J.; Charkowick, S.; Felice, C.A.; Kritzer, M.; Nguyen, M.V.C.; Yu, P.; Ballas, N. Activity-dependent aberrations in gene expression and alternative splicing in a mouse model of Rett syndrome. Proc. Natl. Acad. Sci. USA 2018, 115, E5363–E5372. [Google Scholar] [CrossRef] [PubMed] [Green Version]
- Hootman, K.C.; Trezzi, J.P.; Kraemer, L.; Burwell, L.S.; Dong, X.; Guertin, K.A.; Jaeger, C.; Stover, P.J.; Hiller, K.; Cassano, P.A. Erythritol is a pentose-phosphate pathway metabolite and associated with adiposity gain in young adults. Proc. Natl. Acad. Sci. USA 2017, 114, E4233–E4240. [Google Scholar] [CrossRef] [Green Version]
- Zhang, R.; Zhang, T.; Ali, A.M.; Al Washih, M.; Pickard, B.; Watson, D.G. Metabolomic profiling of post-mortem brain reveals changes in amino acid and glucose metabolism in mental illness compared with controls. Comput. Struct. Biotechnol. J. 2016, 14, 106–116. [Google Scholar] [CrossRef] [Green Version]
- Martínez-Reyes, I.; Chandel, N.S. Mitochondrial TCA cycle metabolites control physiology and disease. Nat. Commun. 2020, 11, 102. [Google Scholar] [CrossRef] [Green Version]
- Mills, E.; O’Neill, L.A. Succinate: A metabolic signal in inflammation. Trends Cell Biol. 2014, 24, 313–320. [Google Scholar] [CrossRef] [PubMed] [Green Version]
- Fischer, M.; Reuter, J.; Gerich, F.J.; Hildebrandt, B.; Hägele, S.; Katschinski, D.; Müller, M. Enhanced hypoxia susceptibility in hippocampal slices from a mouse model of Rett syndrome. J. Neurophysiol. 2009, 101, 1016–1032. [Google Scholar] [CrossRef] [PubMed]
- Kron, M.; Müller, M. Impaired hippocampal Ca2+ homeostasis and concomitant K+ channel dysfunction in a mouse model of Rett syndrome during anoxia. Neuroscience 2010, 171, 300–315. [Google Scholar] [CrossRef]
- Yu, Y.; Herman, P.; Rothman, D.L.; Agarwal, D.; Hyder, F. Evaluating the gray and white matter energy budgets of human brain function. J. Cereb. Blood Flow Metab. 2018, 38, 1339–1353. [Google Scholar] [CrossRef]
- Yellen, G. Fueling thought: Management of glycolysis and oxidative phosphorylation in neuronal metabolism. J. Cell Biol. 2018, 217, 2235–2246. [Google Scholar] [CrossRef] [PubMed]
- Bolanos, J.P.; Delgado-Esteban, M.; Herrero-Mendez, A.; Fernandez-Fernandez, S.; Almeida, A. Regulation of glycolysis and pentose-phosphate pathway by nitric oxide: Impact on neuronal survival. Biochim. Biophys. Acta (BBA)-Bioenerg. 2008, 1777, 789–793. [Google Scholar] [CrossRef] [PubMed] [Green Version]
- Doerrier, C.; Garcia-Souza, L.F.; Krumschnabel, G.; Wohlfarter, Y.; Mészáros, A.T.; Gnaiger, E. High-resolution fluorespirometry and OXPHOS protocols for human cells, permeabilized fibers from small biopsies of muscle, and isolated mitochondria. In Mitochondrial Bioenergetics; Humana Press: New York, NY, USA, 2018; pp. 31–70. [Google Scholar]
- Toloe, J.; Mollajew, R.; Kügler, S.; Mironov, S.L. Metabolic differences in hippocampal ‘Rett’ neurons revealed by ATP imaging. Mol. Cell. Neurosci. 2014, 59, 47–56. [Google Scholar] [CrossRef]
- Jin, L.W.; Horiuchi, M.; Wulff, H.; Liu, X.B.; Cortopassi, G.A.; Erickson, J.D.; Maezawa, I. Dysregulation of glutamine transporter SNAT1 in Rett syndrome microglia: A mechanism for mitochondrial dysfunction and neurotoxicity. J. Neurosci. 2015, 35, 2516–2529. [Google Scholar] [CrossRef] [PubMed] [Green Version]
- Saywell, V.; Viola, A.; Confort-Gouny, S.; Le Fur, Y.; Villard, L.; Cozzone, P.J. Brain magnetic resonance study of Mecp2 deletion effects on anatomy and metabolism. Biochem. Biophys. Res. Commun. 2006, 340, 776–783. [Google Scholar] [CrossRef] [PubMed]
- Riederer, P.; Brücke, T.; Sofic, E.; Kienzl, E.; Schnecker, K.; Schay, V.; Kruzik, P.; Killian, W. Neurochemical aspects of the Rett syndrome. Brain Dev. 1985, 7, 351–360. [Google Scholar] [CrossRef]
- Ricciardi, S.; Boggio, E.M.; Grosso, S.; Lonetti, G.; Forlani, G.; Stefanelli, G.; Calcagno, E.; Morello, N.; Landsberger, N.; Biffo, S.; et al. Reduced AKT/mTOR signaling and protein synthesis dysregulation in a Rett syndrome animal model. Hum. Mol. Genet. 2011, 20, 1182–1196. [Google Scholar] [CrossRef] [PubMed] [Green Version]
- Sperringer, J.E.; Addington, A.; Hutson, S.M. Branched-chain amino acids and brain metabolism. Neurochem. Res. 2017, 42, 1697–1709. [Google Scholar] [CrossRef]
- Bridi, R.; Latini, A.; Braum, C.A.; Zorzi, G.K.; Moacir, W.; Lissi, E.; Dutra-Filho, C.S. Evaluation of the mechanisms involved in leucine-induced oxidative damage in cerebral cortex of young rats. Free. Radic. Res. 2005, 39, 71–79. [Google Scholar] [CrossRef] [PubMed]
- Funchal, C.; Gottfried, C.; de Almeida, L.M.; dos Santos, A.Q.; Wajner, M.; Pessoa-Pureur, R. Morphological alterations and cell death provoked by the branched-chain alpha-amino acids accumulating in maple syrup urine disease in astrocytes from rat cerebral cortex. Cell Mol. Neurobiol. 2005, 25, 851–867. [Google Scholar] [CrossRef]
- Kaplan, P.; Tatarkova, Z.; Sivonova, M.K.; Racay, P.; Lehotsky, J. Homocysteine and mitochondria in cardiovascular and cerebrovascular systems. Int. J. Mol. Sci. 2020, 21, 7698. [Google Scholar] [CrossRef] [PubMed]
- Guy, J.; Cheval, H.; Selfridge, J.; Bird, A. The role of MeCP2 in the brain. Annu. Rev. Cell Dev. Biol. 2011, 27, 631–652. [Google Scholar] [CrossRef] [PubMed] [Green Version]
- Gabel, H.W.; Kinde, B.; Stroud, H.; Gilbert, C.S.; Harmin, D.A.; Kastan, N.R.; Hemberg, M.; Ebert, D.H.; Greenberg, M.E. Disruption of DNA-methylation-dependent long gene repression in Rett syndrome. Nature 2015, 522, 89–93. [Google Scholar] [CrossRef] [Green Version]
- Du, Y.; Wei, J.; Yang, X.; Dou, Y.; Zhao, L.; Qi, X.; Yu, X.; Guo, W.; Wang, Q.; Deng, W.; et al. Plasma metabolites were associated with spatial working memory in major depressive disorder. Medicine (Baltimore) 2021, 100, e24581. [Google Scholar] [CrossRef]
- Dringen, R.; Gutterer, J.M.; Hirrlinger, J. Glutathione metabolism in brain metabolic interaction between astrocytes and neurons in the defense against reactive oxygen species. Eur. J Biochem. 2000, 267, 4912–4916. [Google Scholar] [CrossRef]
- Martin, H.L.; Teismann, P. Glutathione—A review on its role and significance in Parkinson’s disease. FASEB J. 2009, 23, 3263–3272. [Google Scholar] [CrossRef] [PubMed] [Green Version]
- De Felice, C.; Ciccoli, L.; Leoncini, S.; Signorini, C.; Rossi, M.; Vannuccini, L.; Guazzi, G.; Latini, G.; Comporti, M.; Valacchi, G.; et al. Systemic oxidative stress in classic Rett syndrome. Free. Radic. Biol. Med. 2009, 47, 440–448. [Google Scholar] [CrossRef] [PubMed]
- Festerling, K.; Can, K.; Kügler, S.; Müller, M. Overshooting Subcellular Redox-Responses in Rett-Mouse Hippocampus during Neurotransmitter Stimulation. Cells 2020, 9, 2539. [Google Scholar] [CrossRef]
- Dringen, R.; Pfeiffer, B.; Hamprecht, B. Synthesis of the antioxidant glutathione in neurons: Supply by astrocytes of CysGly as precursor for neuronal glutathione. J. Neurosci. 1999, 19, 562–569. [Google Scholar] [CrossRef] [PubMed]
- Song, B.C.; Joo, N.S.; Aldini, G.; Yeum, K.J. Biological functions of histidine-dipeptides and metabolic syndrome. Nutr. Res. Pract. 2014, 8, 3–10. [Google Scholar] [CrossRef] [Green Version]
- Gropman, A.L.; Batshaw, M.L. Cognitive outcome in urea cycle disorders. Mol. Genet. Metab. 2004, 81 (Suppl. 1), S58–S62. [Google Scholar] [CrossRef] [PubMed]
- Sadasivudu, B.; Rao, T.I. Studies on functional and metabolic role of urea cycle intermediates in brain. J. Neurochem. 1976, 27, 785–794. [Google Scholar] [CrossRef]
- Kyle, S.M.; Saha, P.K.; Brown, H.M.; Chan, L.C.; Justice, M.J. MeCP2 co-ordinates liver lipid metabolism with the NCoR1/HDAC3 corepressor complex. Hum. Mol. Genet. 2016, 25, 3029–3041. [Google Scholar] [CrossRef] [Green Version]
- Xu, J.; Begley, P.; Church, S.J.; Patassini, S.; Hollywood, K.A.; Jullig, M.; Curtis, M.A.; Waldvogel, H.J.; Faull, R.L.; Unwin, R.D.; et al. Graded perturbations of metabolism in multiple regions of human brain in Alzheimer’s disease: Snapshot of a pervasive metabolic disorder. Biochim. Biophys. Acta (BBA)-Mol. Basis Dis. 2016, 1862, 1084–1092. [Google Scholar] [CrossRef]
- Handley, R.R.; Reid, S.J.; Brauning, R.; Maclean, P.; Mears, E.R.; Fourie, I.; Patassini, S.; Cooper, G.J.S.; Rudiger, S.R.; McLaughlan, C.J.; et al. Brain urea increase is an early Huntington’s disease pathogenic event observed in a prodromal transgenic sheep model and HD cases. Proc. Natl. Acad. Sci. USA 2017, 114, E11293–E11302. [Google Scholar] [CrossRef] [Green Version]
- Patassini, S.; Begley, P.; Reid, S.J.; Xu, J.; Church, S.J.; Curtis, M.; Dragunow, M.; Waldvogel, H.J.; Unwin, R.D.; Snell, R.G.; et al. Identification of elevated urea as a severe, ubiquitous metabolic defect in the brain of patients with Huntington’s disease. Biochem. Biophys. Res. Commun. 2015, 468, 161–166. [Google Scholar] [CrossRef]
- Zhang, Y.; Chen, K.; Sloan, S.A.; Bennett, M.L.; Scholze, A.R.; O’Keeffe, S.; Phatnani, H.P.; Guarnieri, P.; Caneda, C.; Ruderisch, N.; et al. An RNA-sequencing transcriptome and splicing database of glia, neurons, and vascular cells of the cerebral cortex. J. Neurosci. 2014, 34, 11929–11947. [Google Scholar] [CrossRef]
- Sands, J.M.; Gargus, J.J.; Fröhlich, O.; Gunn, R.B.; Kokko, J.P. Urinary concentrating ability in patients with Jk(a-b-) blood type who lack carrier-mediated urea transport. J. Am. Soc. Nephrol. 1992, 2, 1689–1696. [Google Scholar] [CrossRef] [PubMed]
- Brücke, T.; Sofic, E.; Killian, W.; Rett, A.; Riederer, P. Reduced concentrations and increased metabolism of biogenic amines in a single case of Rett-syndrome: A postmortem brain study. J. Neural Transm. 1987, 68, 315–324. [Google Scholar] [CrossRef]
- Lekman, A.; Witt-Engerström, I.; Gottfries, J.; Hagberg, B.A.; Percy, A.K.; Svennerholm, L. Rett syndrome: Biogenic amines and metabolites in postmortem brain. Pediatric Neurol. 1989, 5, 357–362. [Google Scholar] [CrossRef]
- Wenk, G.L.; Naidu, S.; Casanova, M.F.; Kitt, C.A.; Moser, H. Altered neurochemical markers in Rett’s syndrome. Neurology 1991, 41, 1753–1756. [Google Scholar] [CrossRef] [PubMed]
- Wenk, G.L. Rett syndrome: Evidence for normal dopaminergic function. Neuropediatrics 1996, 27, 256–259. [Google Scholar] [CrossRef] [PubMed]
- Wong, D.F.; Blue, M.E.; Brasic, J.R.; Nandi, A.; Valentine, H.; Stansfield, K.H.; Rousset, O.; Bibat, G.; Yablonski, M.E.; Johnston, M.V.; et al. Are dopamine receptor and transporter changes in Rett syndrome reflected in Mecp2-deficient mice? Exp. Neurol. 2018, 307, 74–81. [Google Scholar] [CrossRef]
- Villani, C.; Sacchetti, G.; Carli, M.; Invernizzi, R.W. Fluoxetine rescues rotarod motor deficits in Mecp2 heterozygous mouse model of Rett syndrome via brain serotonin. Neuropharmacology 2020, 176, 108221. [Google Scholar] [CrossRef] [PubMed]
- De Filippis, B.; Chiodi, V.; Adriani, W.; Lacivita, E.; Mallozzi, C.; Leopoldo, M.; Domenici, M.R.; Fuso, A.; Laviola, G. Long-lasting beneficial effects of central serotonin receptor 7 stimulation in female mice modeling Rett syndrome. Front. Behav. Neurosci. 2015, 9, 86. [Google Scholar] [CrossRef] [Green Version]
- Wenk, G.L.; Mobley, S.L. Choline acetyltransferase activity and vesamicol binding in Rett syndrome and in rats with nucleus basalis lesions. Neuroscience 1996, 73, 79–84. [Google Scholar] [CrossRef]
- Ricceri, L.; De Filippis, B.; Fuso, A.; Laviola, G. Cholinergic hypofunction in MeCP2–308 mice: Beneficial neurobehavioural effects of neonatal choline supplementation. Behav. Brain Res. 2011, 221, 623–629. [Google Scholar] [CrossRef]
- Ward, B.C.; Kolodny, N.H.; Nag, N.; Berger-Sweeney, J.E. Neurochemical changes in a mouse model of Rett syndrome: Changes over time and in response to perinatal choline nutritional supplementation. J. Neurochem. 2009, 108, 361–371. [Google Scholar] [CrossRef]
- Oginsky, M.F.; Cui, N.; Zhong, W.; Johnson, C.M.; Jiang, C. Alterations in the cholinergic system of brain stem neurons in a mouse model of Rett syndrome. Am. J. Physiol. Cell Physiol. 2014, 307, C508–C520. [Google Scholar] [CrossRef] [PubMed] [Green Version]
- Ballinger, E.C.; Schaaf, C.P.; Patel, A.J.; de Maio, A.; Tao, H.; Talmage, D.A.; Zoghbi, H.Y.; Role, L.W. Mecp2 deletion from cholinergic neurons selectively impairs recognition memory and disrupts cholinergic modulation of the perirhinal cortex. eNeuro 2019, 6, 31562178. [Google Scholar] [CrossRef] [PubMed] [Green Version]
- El-Khoury, R.; Panayotis, N.; Matagne, V.; Ghata, A.; Villard, L.; Roux, J.C. GABA and glutamate pathways are spatially and developmentally affected in the brain of Mecp2-deficient mice. PLoS ONE 2014, 9, e92169. [Google Scholar] [CrossRef] [PubMed]
- Dani, V.S.; Chang, Q.; Maffei, A.; Turrigiano, G.G.; Jaenisch, R.; Nelson, S.B. Reduced cortical activity due to a shift in the balance between excitation and inhibition in a mouse model of Rett syndrome. Proc. Natl. Acad. Sci. USA 2005, 102, 12560–12565. [Google Scholar] [CrossRef] [PubMed] [Green Version]
- Chao, H.T.; Zoghbi, H.Y.; Rosenmund, C. MeCP2 controls excitatory synaptic strength by regulating glutamatergic synapse number. Neuron 2007, 56, 58–65. [Google Scholar] [CrossRef] [Green Version]
- Chao, H.T.; Chen, H.; Samaco, R.C.; Xue, M.; Chahrour, M.; Yoo, J.; Neul, J.L.; Gong, S.; Lu, H.C.; Heintz, N.; et al. Dysfunction in GABA signalling mediates autism-like stereotypies and Rett syndrome phenotypes. Nature 2010, 468, 263–269. [Google Scholar] [CrossRef]
- Vaz, F.M.; Wanders, R.J. Carnitine biosynthesis in mammals. Biochem. J. 2002, 361, 417–429. [Google Scholar] [CrossRef]
- Panov, A.; Orynbayeva, Z.; Vavilin, V.; Lyakhovich, V. Fatty acids in energy metabolism of the central nervous system. BioMed Res. Int. 2014, 2014, 472459. [Google Scholar] [CrossRef] [Green Version]
- Mucerino, S.; Di Salle, A.; Alessio, N.; Margarucci, S.; Nicolai, R.; Melone, M.A.; Galderisi, U.; Peluso, G. Alterations in the carnitine cycle in a mouse model of Rett syndrome. Sci. Rep. 2017, 7, 41824. [Google Scholar] [CrossRef] [PubMed] [Green Version]
- Valacchi, G.; Virgili, F.; Cervellati, C.; Pecorelli, A. OxInflammation: From subclinical condition to pathological biomarker. Front. Physiol. 2018, 9, 858. [Google Scholar] [CrossRef] [PubMed] [Green Version]
- Buchovecky, C.M.; Turley, S.D.; Brown, H.M.; Kyle, S.M.; McDonald, J.G.; Liu, B.; Pieper, A.A.; Huang, W.; Katz, D.M.; Russell, D.W.; et al. A suppressor screen in Mecp2 mutant mice implicates cholesterol metabolism in Rett syndrome. Nat. Genet. 2013, 45, 1013–1020. [Google Scholar] [CrossRef] [Green Version]
- Jaganath, I.B.; Mullen, W.; Edwards, C.A.; Crozier, A. The relative contribution of the small and large intestine to the absorption and metabolism of rutin in man. Free. Radic. Res. 2006, 40, 1035–1046. [Google Scholar] [CrossRef] [PubMed]
- Strati, F.; Cavalieri, D.; Albanese, D.; De Felice, C.; Donati, C.; Hayek, J.; Jousson, O.; Leoncini, S.; Pindo, M.; Renzi, D.; et al. Altered gut microbiota in Rett syndrome. Microbiome 2016, 4, 41. [Google Scholar] [CrossRef] [PubMed] [Green Version]
- Sofic, E.; Riederer, P.; Killian, W.; Rett, A. Reduced concentrations of ascorbic acid and glutathione in a single case of Rett syndrome: A postmortem brain study. Brain Dev. 1987, 9, 529–531. [Google Scholar] [CrossRef]


| WT Mice (n = 6) | ||||
| Identifier | Body size [cm] | Body weight [g] | Blood glucose [mg/dL] | Hematocrit |
| 8.23 ± 0.21 | 21.60 ± 1.06 | 242.50 ± 30.57 | 43.58 ± 2.05 | |
| #5600 | 8.2 | 22.7 | 211 | 46.3 |
| #5601 | 8.6 | 22.6 | 247 | 45.0 |
| #5602 | 8.1 | 20.0 | 243 | 41.3 |
| #5603 | 8.4 | 22.5 | 235 | 45.3 |
| #5604 | 8.0 | 21.2 | 215 | 41.0 |
| #5607 | 8.1 | 20.6 | 304 | 42.6 |
| Mecp2−/y Mice (n = 6) | ||||
| 7.17 ± 0.69 (p = 0.0078) | 13.78 ± 3.70 (p = 0.0011) | 200.00 ± 50.65 (p = 0.1393) | 46.4 ± 2.46 (p = 0.0777) | |
| #5637 | 6.9 | 11.5 | 177 | 50.0 |
| #5641 | 6.5 | 11.4 | 147 | 47.0 |
| #5646 | 8.3 | 20.5 | 306 | 47.7 |
| #5647 | 7.9 | 17.0 | 208 | 46.7 |
| #5650 | 6.9 | 12.1 | 185 | 42.0 |
| #5663 | 6.5 | 10.2 | 177 | 45.0 |
| Metabolite | Log Fold Change | Average Expression | p-Value | Adjusted p-Value |
|---|---|---|---|---|
| L-Proline | 0.910 | 19.269 | 1.02 × 10⁻⁶ | 0.00014 |
| L-Glutamic acid | 1.406 | 19.899 | 2.04 × 10⁻⁶ | 0.00018 |
| N-Acetylglutamic acid | 1.146 | 13.495 | 7.33 × 10⁻⁷ | 0.00014 |
| Adenosine monophosphate | 0.925 | 20.923 | 3.23 × 10⁻⁶ | 0.00018 |
| Adenosine diphosphate | 0.925 | 20.923 | 3.23 × 10⁻⁶ | 0.00018 |
| L-Threonine | 1.281 | 18.628 | 9.24 × 10⁻⁶ | 0.00036 |
| L-Leucine | 0.870 | 17.672 | 1.18 × 10⁻⁵ | 0.00036 |
| D-Glucose 6-phosphate | 2.226 | 12.018 | 1.23 × 10⁻⁵ | 0.00036 |
| Citric acid | 0.872 | 18.512 | 1.38 × 10⁻⁵ | 0.00036 |
| Inositol 1-phosphate | 0.959 | 13.174 | 1.45 × 10⁻⁵ | 0.00036 |
| (S)-Methyl-3-hydroxybutanoate | 0.935 | 16.364 | 1.51 × 10⁻⁵ | 0.00036 |
| Putrescine | 1.179 | 14.878 | 2.05 × 10⁻⁵ | 0.00044 |
| D-Fructose 1,6-bisphosphate | 2.035 | 12.807 | 2.18 × 10⁻⁵ | 0.00044 |
| D-Fructose | 1.167 | 15.985 | 2.89 × 10⁻⁵ | 0.00055 |
| L-Valine | 0.787 | 18.180 | 3.55 × 10⁻⁵ | 0.00060 |
| L-Isoleucine | 0.794 | 16.510 | 3.63 × 10⁻⁵ | 0.00060 |
| L-Homocysteine | −2.332 | 19.231 | 3.89 × 10⁻⁵ | 0.00061 |
| Inosine 5prime-monophosphate | 1.158 | 15.513 | 4.43 × 10⁻⁵ | 0.00066 |
| D-Glucose | 1.418 | 14.891 | 5.85 × 10⁻⁵ | 0.00080 |
| Urea | 1.599 | 18.093 | 6.27 × 10⁻⁵ | 0.00080 |
| L-Glutamyl-L-glutamine | −1.885 | 27.116 | 6.07 × 10⁻⁵ | 0.00080 |
| 5prime-Deoxy-5prime-(methylthio)adenosine | 0.732 | 12.146 | 6.81 × 10⁻⁵ | 0.00080 |
| (5Z,8Z,11Z,14Z)-Icosatetra-5,8,11,14-enoic acid | 1.032 | 12.834 | 6.63 × 10⁻⁵ | 0.00080 |
| L-Rhamnose | 0.805 | 15.911 | 7.07 × 10⁻⁵ | 0.00080 |
| S-Adenosyl methionine | −0.994 | 23.740 | 9.39 × 10⁻⁵ | 0.00102 |
| L-Threonic acid | 0.685 | 16.744 | 0.00010 | 0.00106 |
| Xanthine | −0.590 | 24.310 | 0.00011 | 0.00112 |
| Glycerol | 0.743 | 19.067 | 0.00013 | 0.00123 |
| Uracil | −0.903 | 21.188 | 0.00013 | 0.00123 |
| L-Serine | 0.580 | 20.901 | 0.00014 | 0.00128 |
| L-Phenylalanine | 1.143 | 16.688 | 0.00014 | 0.00128 |
| Riboflavin | −1.161 | 20.071 | 0.00018 | 0.00157 |
| Erythritol | 0.696 | 13.022 | 0.00021 | 0.00178 |
| Orthophosphate | 0.612 | 20.971 | 0.00029 | 0.00232 |
| L-Dehydroascorbic acid | 0.691 | 21.847 | 0.00032 | 0.00252 |
| alpha-Ketoglutaric acid | 1.783 | 12.766 | 0.00033 | 0.00252 |
| Succinic acid | 0.743 | 17.429 | 0.00034 | 0.00252 |
| L-Methionine | 0.909 | 16.361 | 0.00041 | 0.00296 |
| 1-Methyl-4-Imidazoleacetic acid | −0.837 | 21.803 | 0.00044 | 0.00312 |
| Dopamine | −1.285 | 21.788 | 0.00046 | 0.00312 |
| Choline | −0.431 | 26.902 | 0.00051 | 0.00333 |
| L-Malic acid | 0.695 | 17.421 | 0.00060 | 0.00389 |
| alpha-D-Glucose 1-phosphate | 0.608 | 16.334 | 0.00065 | 0.00409 |
| Acetylcholine | −0.927 | 23.071 | 0.00067 | 0.00415 |
| Guanidineacetic acid | 0.821 | 20.099 | 0.00080 | 0.00480 |
| Cholesterol | 1.261 | 19.067 | 0.00081 | 0.00480 |
| gamma-Glutamyl-tyrosine | −1.785 | 19.524 | 0.00084 | 0.00487 |
| L-Phenylalanyl-L-glutamic acid | 0.898 | 18.323 | 0.00089 | 0.00497 |
| L-Tryptophan | 1.611 | 14.883 | 0.00090 | 0.00497 |
| Sucrose | 6.158 | 13.392 | 0.00101 | 0.00541 |
| 3-Methoxytyramine | −1.329 | 19.231 | 0.00106 | 0.00555 |
| Hydroxymethylphosphonic acid | −0.787 | 23.679 | 0.00115 | 0.00590 |
| Cysteinylglycine | −4.028 | 21.772 | 0.00118 | 0.00598 |
| L-Cystine | 0.874 | 11.928 | 0.00123 | 0.00601 |
| L-Lysine | −0.351 | 24.204 | 0.00123 | 0.00601 |
| Xylitol | 0.809 | 14.890 | 0.00140 | 0.00671 |
| L-Valylglycine | 0.679 | 18.356 | 0.00151 | 0.00707 |
| myo-Inositol 2-phosphate | 0.595 | 12.668 | 0.00152 | 0.00707 |
| Quinic acid | 0.856 | 11.418 | 0.00157 | 0.00714 |
| Pantothenic acid | 0.685 | 13.364 | 0.00159 | 0.00714 |
| gamma-Glutamyl-leucine | −0.625 | 20.675 | 0.00168 | 0.00745 |
| L-Homoserine | 0.690 | 13.175 | 0.00201 | 0.00876 |
| L-Tryptophyl-L-glutamic acid | 1.067 | 17.063 | 0.00243 | 0.01042 |
| O-Acetyl-L-homoserine | −0.758 | 25.057 | 0.00256 | 0.01082 |
| 2-Hydroxypyridine | 0.676 | 18.513 | 0.00267 | 0.01111 |
| L-Tyrosylglycine | 0.669 | 17.228 | 0.00276 | 0.01131 |
| Cytidine | −0.498 | 24.940 | 0.00283 | 0.01144 |
| 3-Ureidopropanoic acid | −0.797 | 16.984 | 0.00307 | 0.01222 |
| L-Tyrosyl-L-glutamine | 0.694 | 16.728 | 0.00317 | 0.01246 |
| Pyroglutamic acid | 0.419 | 23.178 | 0.00351 | 0.01361 |
| sn-Glycerol 3-phosphate | 0.544 | 19.750 | 0.00409 | 0.01542 |
| L-Alanine | 0.468 | 21.447 | 0.00456 | 0.01700 |
| Thiaminpyrophosphate | 0.972 | 17.802 | 0.00465 | 0.01708 |
| L-Tyrosine | 1.005 | 18.152 | 0.00495 | 0.01796 |
| Serotonin | −0.856 | 19.538 | 0.00630 | 0.02227 |
| 5-Hydroxy-D,L-lysine | −0.541 | 16.762 | 0.00655 | 0.02274 |
| L-Argininosuccinic acid | 0.489 | 20.133 | 0.00659 | 0.02274 |
| Uric acid | −0.872 | 20.411 | 0.00739 | 0.02490 |
| L-Prolyl-L-threonine | 0.456 | 17.391 | 0.00754 | 0.02491 |
| Caffeic acid | 0.846 | 11.955 | 0.00757 | 0.02491 |
| L-Glutamine | 0.415 | 23.021 | 0.00793 | 0.02579 |
| gamma-Glutamyl-tryptophan | −1.178 | 18.306 | 0.00813 | 0.02614 |
| S-(2-Carboxyethyl)cysteine | −0.912 | 19.479 | 0.00890 | 0.02799 |
| Cytidine monophosphate | 0.449 | 24.217 | 0.00890 | 0.02799 |
| Uridine | −0.650 | 23.353 | 0.00964 | 0.02996 |
| L-Valyl-L-alanine | 1.011 | 18.636 | 0.01030 | 0.03168 |
| Spermidine | −0.449 | 22.564 | 0.01043 | 0.03174 |
| Spermine | −1.144 | 20.609 | 0.01090 | 0.03252 |
| Pyruvic acid | 0.570 | 16.746 | 0.01126 | 0.03319 |
| (3-Carboxypropyl) trimethylammonium | −0.226 | 25.234 | 0.01211 | 0.03533 |
| Urocanic acid | 1.357 | 20.985 | 0.01319 | 0.03809 |
| Glyceraldehyde 3-phosphate | 1.960 | 19.691 | 0.01448 | 0.04138 |
| Rutin | 1.789 | 11.194 | 0.01504 | 0.04256 |
| Guanosine | −0.551 | 26.262 | 0.01548 | 0.04336 |
| Stearic acid (FA 18:0) | 0.412 | 17.346 | 0.01606 | 0.04447 |
| L-Lysyl-L-glutamic acid | −0.465 | 17.413 | 0.01619 | 0.04447 |
| Xanthosine | −0.864 | 18.294 | 0.01649 | 0.04486 |
| Palmitic acid (FA 16:0) | 0.457 | 17.561 | 0.01711 | 0.04611 |
| Cytidine 5prime-diphosphoethanolamine | −0.249 | 23.064 | 0.01821 | 0.04817 |
| L-Phenylalanyl-L-threonine | 0.550 | 16.795 | 0.01842 | 0.04826 |
| 1-Methylnicotinamide | −0.390 | 19.488 | 0.01907 | 0.04951 |
| Pathway | Number of Features | Number down | Number up | Direction | p-Value | Adjusted p-Value | Group |
|---|---|---|---|---|---|---|---|
| Starch and sucrose metabolism | 3 | 0 | 3 | Up | 1.00 × 10⁻⁶ | 1.02 × 10⁻⁵ | Carbohydrate metabolism |
| Glyoxylate and dicarboxylate metabolism | 11 | 0 | 8 | Up | 8.00 × 10⁻⁶ | 6.97 × 10⁻⁵ | |
| Galactose metabolism | 4 | 0 | 4 | Up | 1.20 × 10⁻⁵ | 7.86 × 10⁻⁵ | |
| Fructose and mannose metabolism | 3 | 0 | 3 | Up | 1.40 × 10⁻⁵ | 7.91 × 10⁻⁵ | |
| Glycolysis/Gluconeogenesis | 5 | 0 | 5 | Up | 5.40 × 10⁻⁵ | 0.000199 | |
| Citrate cycle (TCA cycle) | 7 | 0 | 7 | Up | 9.60 × 10⁻⁵ | 0.000301 | |
| Pentose phosphate pathway | 3 | 0 | 3 | Up | 0.000106 | 0.000309 | |
| Butanoate metabolism | 6 | 0 | 6 | Up | 0.000115 | 0.000313 | |
| Ascorbate and aldarate metabolism | 3 | 0 | 3 | Up | 0.00013 | 0.000332 | |
| Pentose and glucuronate interconversions | 5 | 0 | 5 | Up | 0.000211 | 0.000508 | |
| Pyruvate metabolism | 6 | 0 | 6 | Up | 0.000333 | 0.000717 | |
| Propanoate metabolism | 4 | 0 | 3 | Up | 0.000623 | 0.001215 | |
| Oxidative phosphorylation | 5 | 0 | 4 | Up | 0.000295 | 0.000671 | Energy metabolism |
| Sulfur metabolism | 6 | 2 | 4 | Up | 0.025918 | 0.034278 | |
| Biosynthesis of unsaturated fatty acids | 4 | 0 | 3 | Up | 0.001717 | 0.002815 | Lipid metabolism |
| Primary bile acid biosynthesis | 3 | 0 | 2 | Up | 0.00549 | 0.008336 | |
| Glycerophospholipid metabolism | 4 | 2 | 1 | Down | 0.01947 | 0.027526 | |
| Pyrimidine metabolism | 16 | 7 | 3 | Down | 0.116182 | 0.136098 | Nucleotide metabolism |
| Purine metabolism | 20 | 7 | 5 | Up | 0.257673 | 0.270886 | |
| Arginine biosynthesis | 10 | 0 | 8 | Up | 1.00 × 10⁻⁶ | 1.02 × 10⁻⁵ | Amino acid metabolism |
| Valine, leucine, and isoleucine degradation | 3 | 0 | 3 | Up | 9.00 × 10⁻⁶ | 6.97 × 10⁻⁵ | |
| Alanine, aspartate, and glutamate metabolism | 12 | 0 | 10 | Up | 1.80 × 10⁻⁵ | 8.97 × 10⁻⁵ | |
| Valine, leucine, and isoleucine biosynthesis | 4 | 0 | 4 | Up | 2.50 × 10⁻⁵ | 0.0001 | |
| Phenylalanine metabolism | 5 | 0 | 5 | Up | 6.20 × 10⁻⁵ | 0.00021 | |
| Arginine and proline metabolism | 17 | 3 | 9 | Up | 0.000503 | 0.00103 | |
| Cysteine and methionine metabolism | 13 | 4 | 9 | Up | 0.001386 | 0.00247 | |
| Phenylalanine, tyrosine, and tryptophan biosynthesis | 3 | 0 | 3 | Up | 0.00163 | 0.002784 | |
| Glycine, serine, and threonine metabolism | 13 | 4 | 7 | Up | 0.00343 | 0.005408 | |
| Lysine degradation | 7 | 5 | 1 | Down | 0.07318 | 0.093761 | |
| Histidine metabolism | 9 | 2 | 3 | Up | 0.143679 | 0.163634 | |
| Tyrosine metabolism | 7 | 2 | 4 | Up | 0.214087 | 0.230988 | |
| Tryptophan metabolism | 4 | 1 | 2 | Up | 0.377303 | 0.386735 | |
| D-Glutamine and D-glutamate metabolism | 3 | 0 | 3 | Up | 2.00 × 10⁻⁶ | 2.05 × 10⁻⁵ | Metabolism of other amino acids |
| Taurine and hypotaurine metabolism | 7 | 1 | 5 | Up | 0.001137 | 0.002118 | |
| beta-Alanine metabolism | 9 | 4 | 2 | Down | 0.113484 | 0.136098 | |
| Glutathione metabolism | 9 | 4 | 4 | Up | 0.184715 | 0.204683 | |
| Porphyrin and chlorophyll metabolism | 3 | 0 | 2 | Up | 2.30 × 10⁻⁵ | 0.0001 | Metabolism of cofactors and vitamins |
| Nicotinate and nicotinamide metabolism | 8 | 1 | 5 | Up | 0.00984 | 0.014408 | |
| Thiamine metabolism | 8 | 3 | 4 | Up | 0.022741 | 0.031079 | |
| Vitamin B6 metabolism | 3 | 0 | 1 | Up | 0.110406 | 0.136098 | |
| Pantothenate and CoA biosynthesis | 8 | 3 | 3 | Up | 0.505619 | 0.505619 |
Publisher’s Note: MDPI stays neutral with regard to jurisdictional claims in published maps and institutional affiliations. |
© 2021 by the authors. Licensee MDPI, Basel, Switzerland. This article is an open access article distributed under the terms and conditions of the Creative Commons Attribution (CC BY) license (https://creativecommons.org/licenses/by/4.0/).
Share and Cite
Golubiani, G.; Lagani, V.; Solomonia, R.; Müller, M. Metabolomic Fingerprint of Mecp2-Deficient Mouse Cortex: Evidence for a Pronounced Multi-Facetted Metabolic Component in Rett Syndrome. Cells 2021, 10, 2494. https://doi.org/10.3390/cells10092494
Golubiani G, Lagani V, Solomonia R, Müller M. Metabolomic Fingerprint of Mecp2-Deficient Mouse Cortex: Evidence for a Pronounced Multi-Facetted Metabolic Component in Rett Syndrome. Cells. 2021; 10(9):2494. https://doi.org/10.3390/cells10092494
Chicago/Turabian StyleGolubiani, Gocha, Vincenzo Lagani, Revaz Solomonia, and Michael Müller. 2021. "Metabolomic Fingerprint of Mecp2-Deficient Mouse Cortex: Evidence for a Pronounced Multi-Facetted Metabolic Component in Rett Syndrome" Cells 10, no. 9: 2494. https://doi.org/10.3390/cells10092494
APA StyleGolubiani, G., Lagani, V., Solomonia, R., & Müller, M. (2021). Metabolomic Fingerprint of Mecp2-Deficient Mouse Cortex: Evidence for a Pronounced Multi-Facetted Metabolic Component in Rett Syndrome. Cells, 10(9), 2494. https://doi.org/10.3390/cells10092494