
In Vitro Cell Toxicity and Intracellular Uptake of Doxorubicin Exposed as a Solution or Liposomes: Implications for Treatment of Hepatocellular Carcinoma

 ,
,  , ,
, , 
 ,
,  and
and
Abstract
:
1. Introduction
2. Materials and Methods
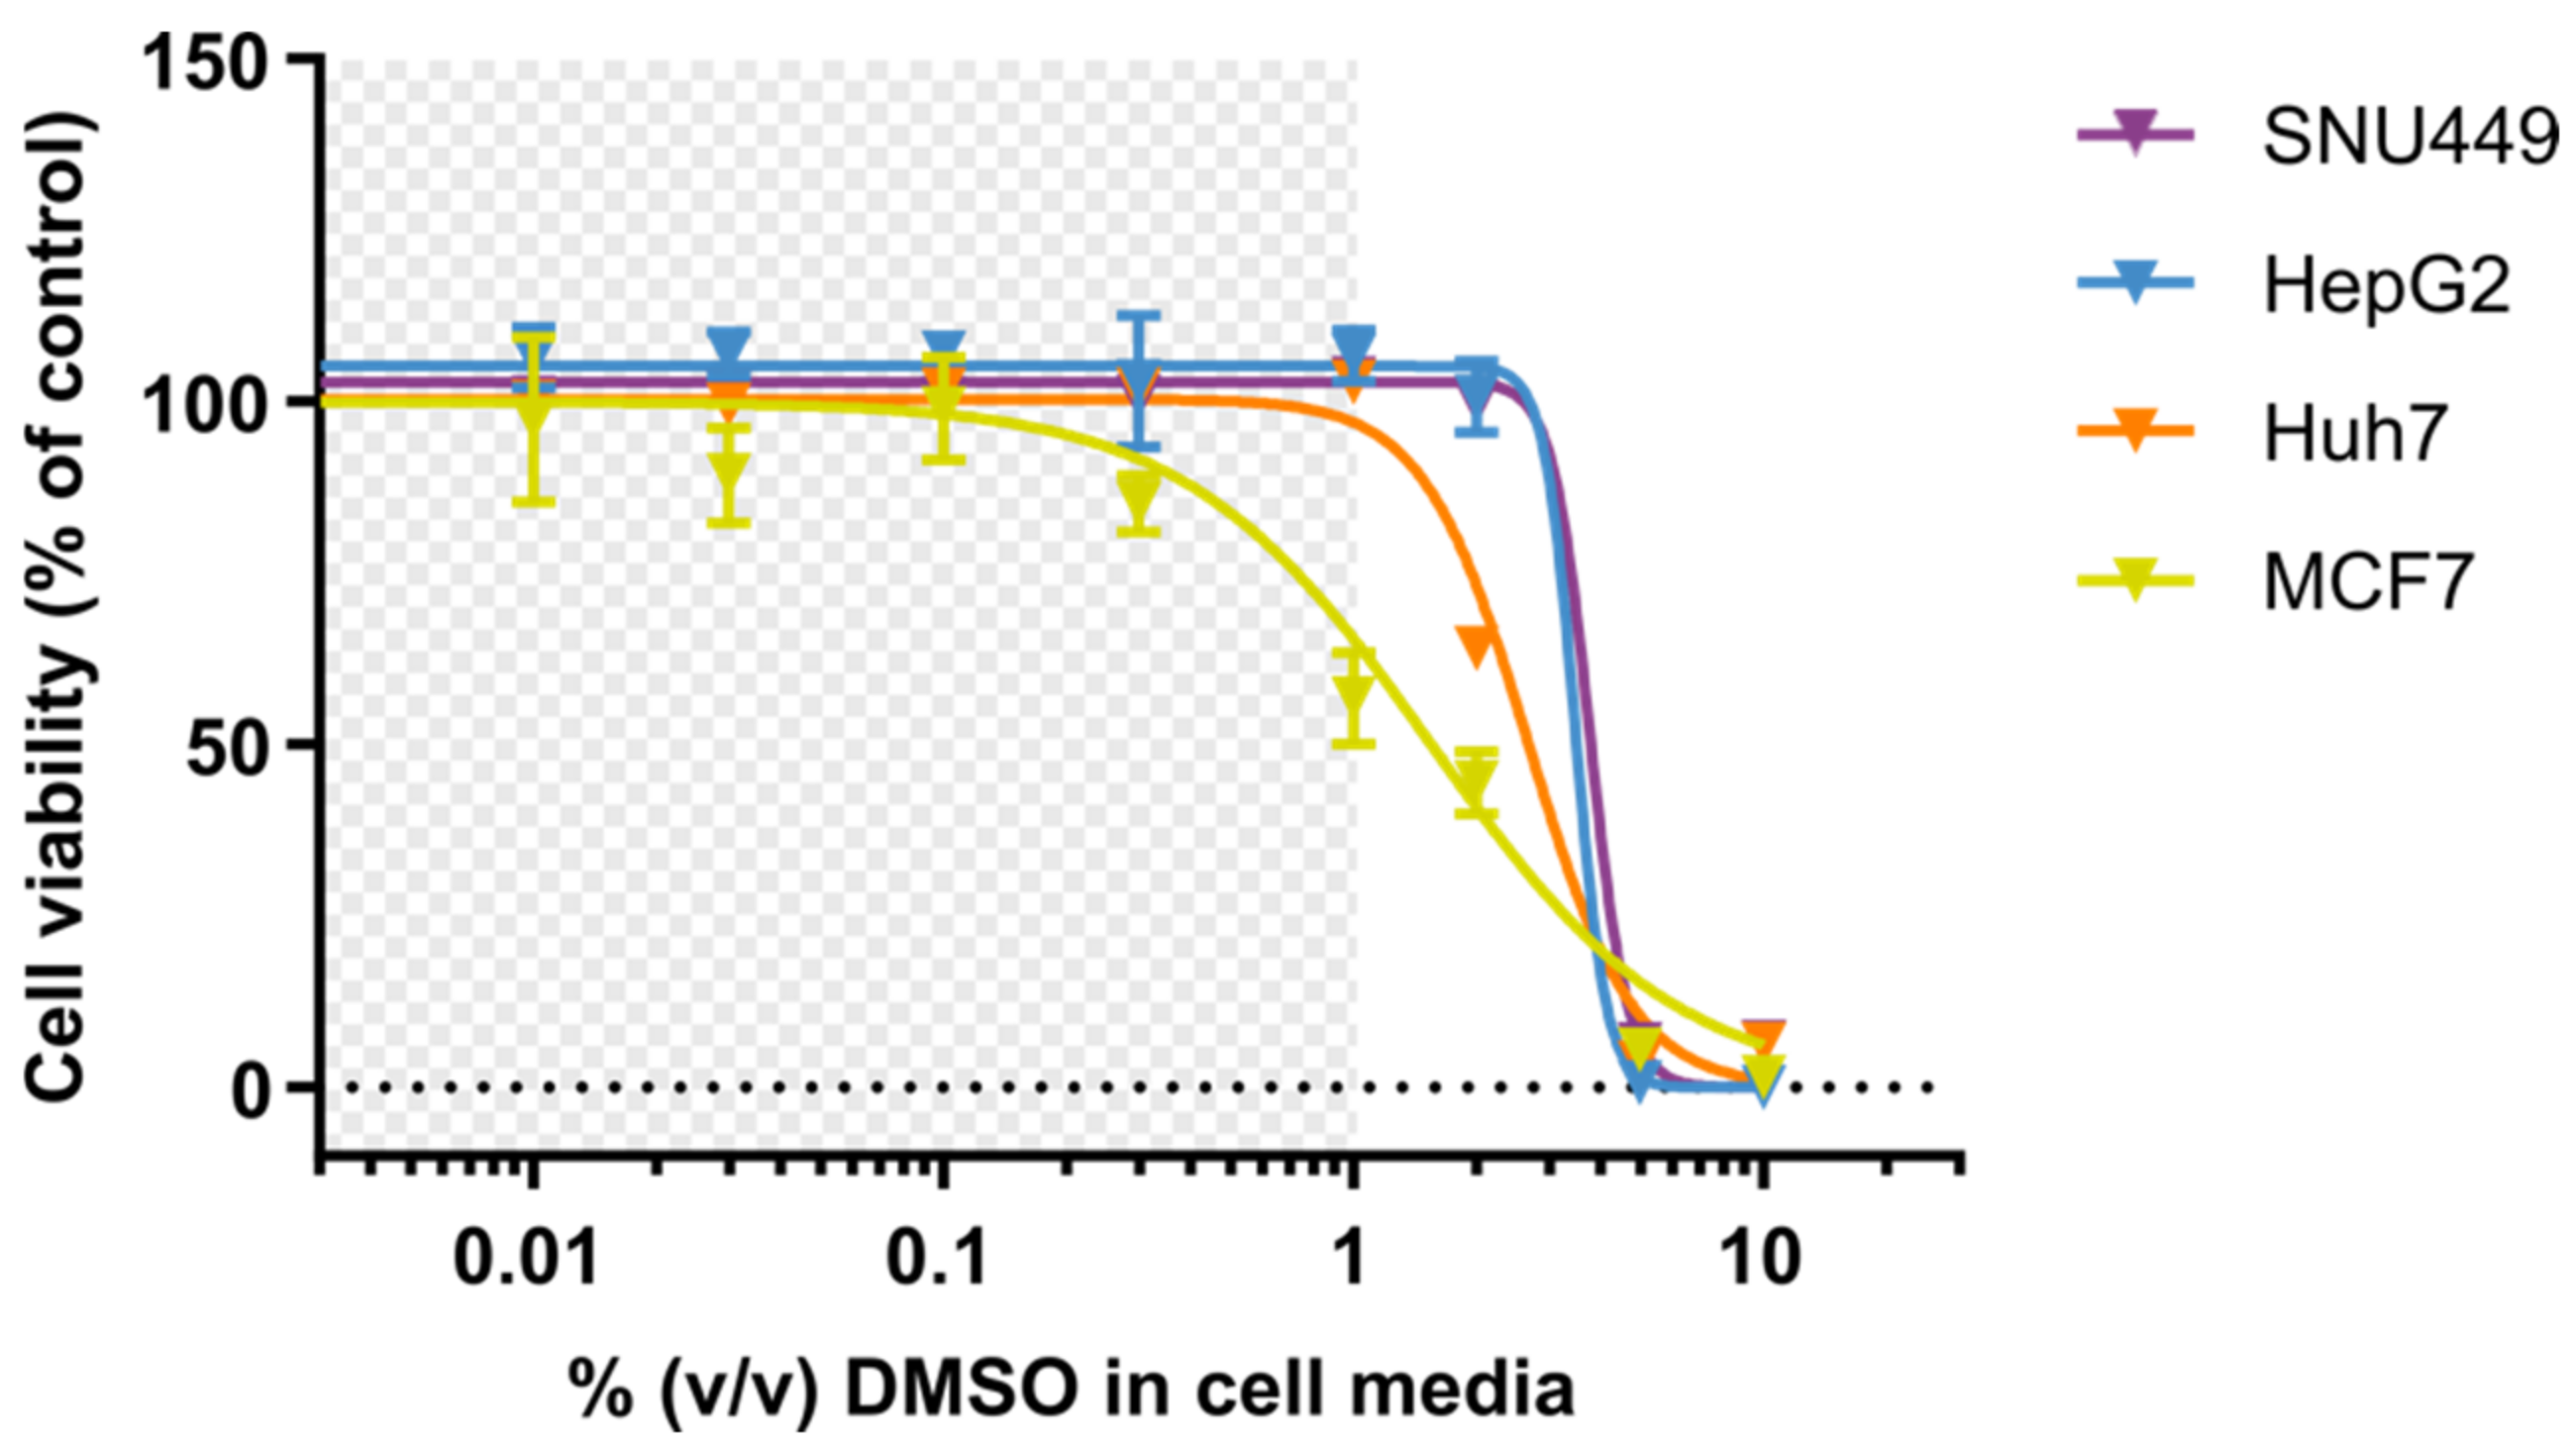
2.1. Chemicals
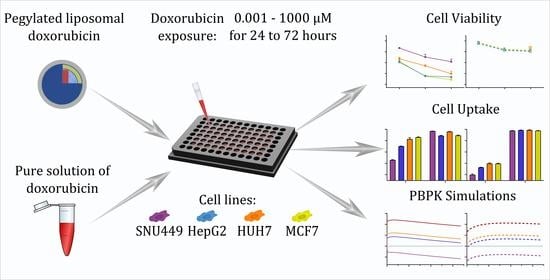
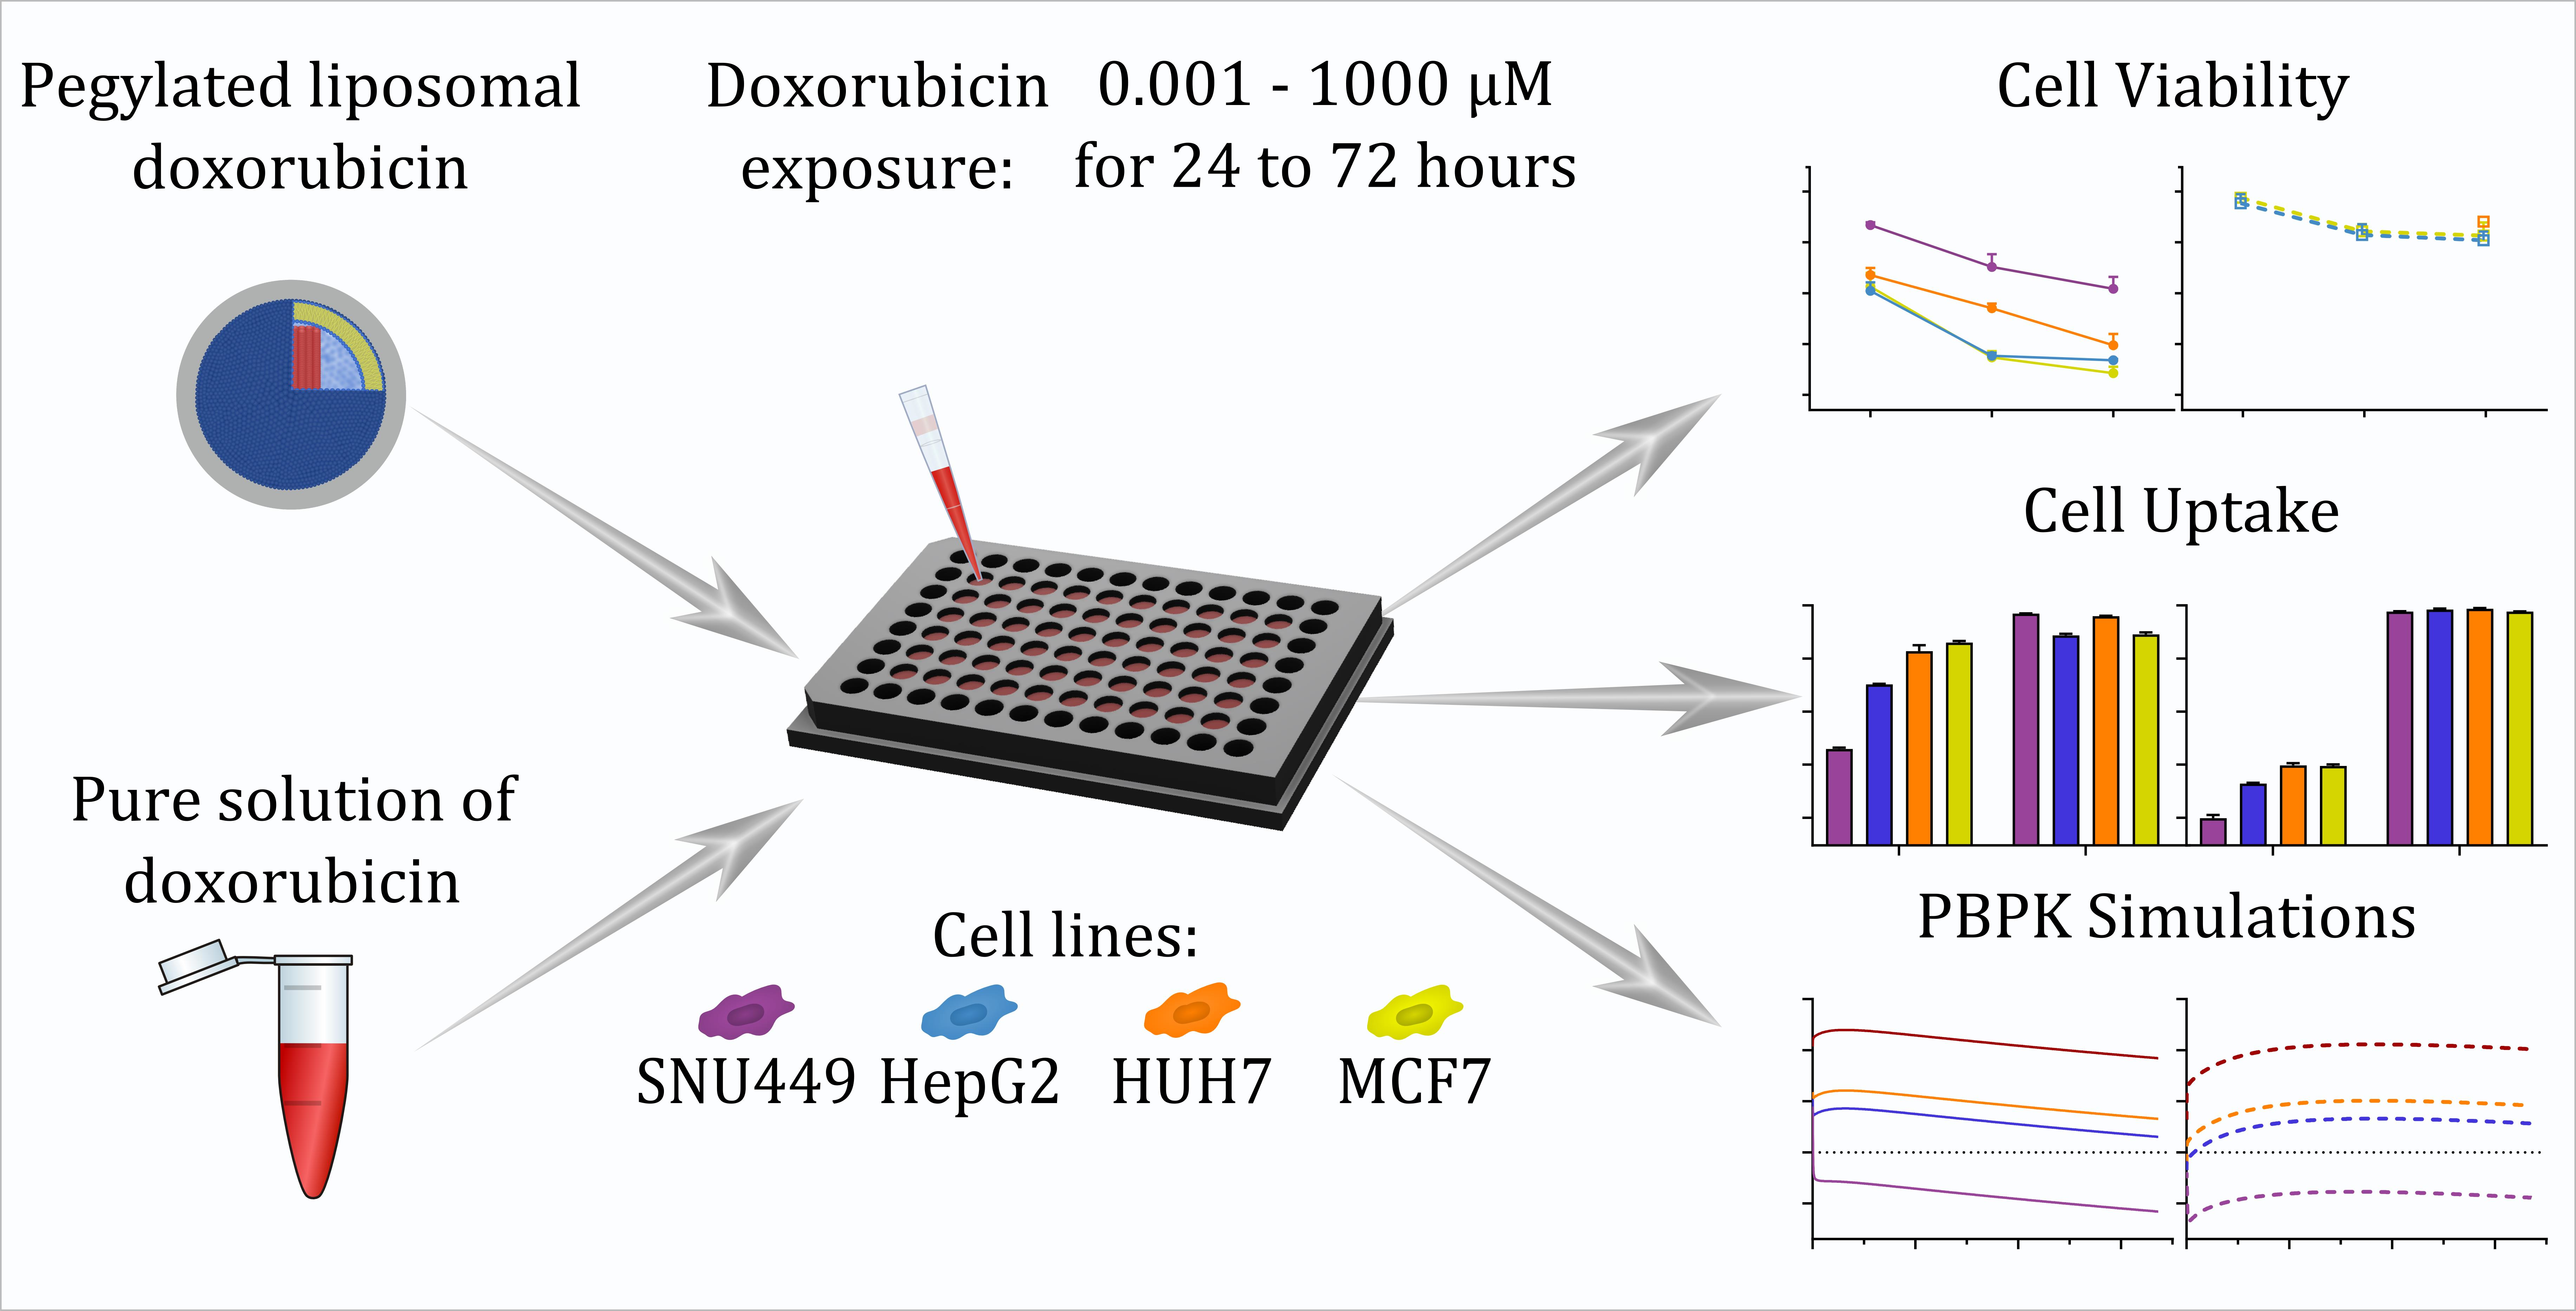
2.2. Overall Study Design and Investigational Drugs
2.3. Cell Culture and Culture Conditions
2.4. Drug Treatment Schedule
2.5. Resazurin-Based Cell Viability Assay
2.6. Cell Lysate Preparation and Intracellular Determination of DOX and Major Metabolite DOXol
2.7. Assay for Quantification of Intracellular Concentrations of DOX and Its Major and Active Metabolite Doxorubicinol (DOXol)
2.8. Data Analysis and Statistics
2.9. Physiologically Based Modeling
3. Results
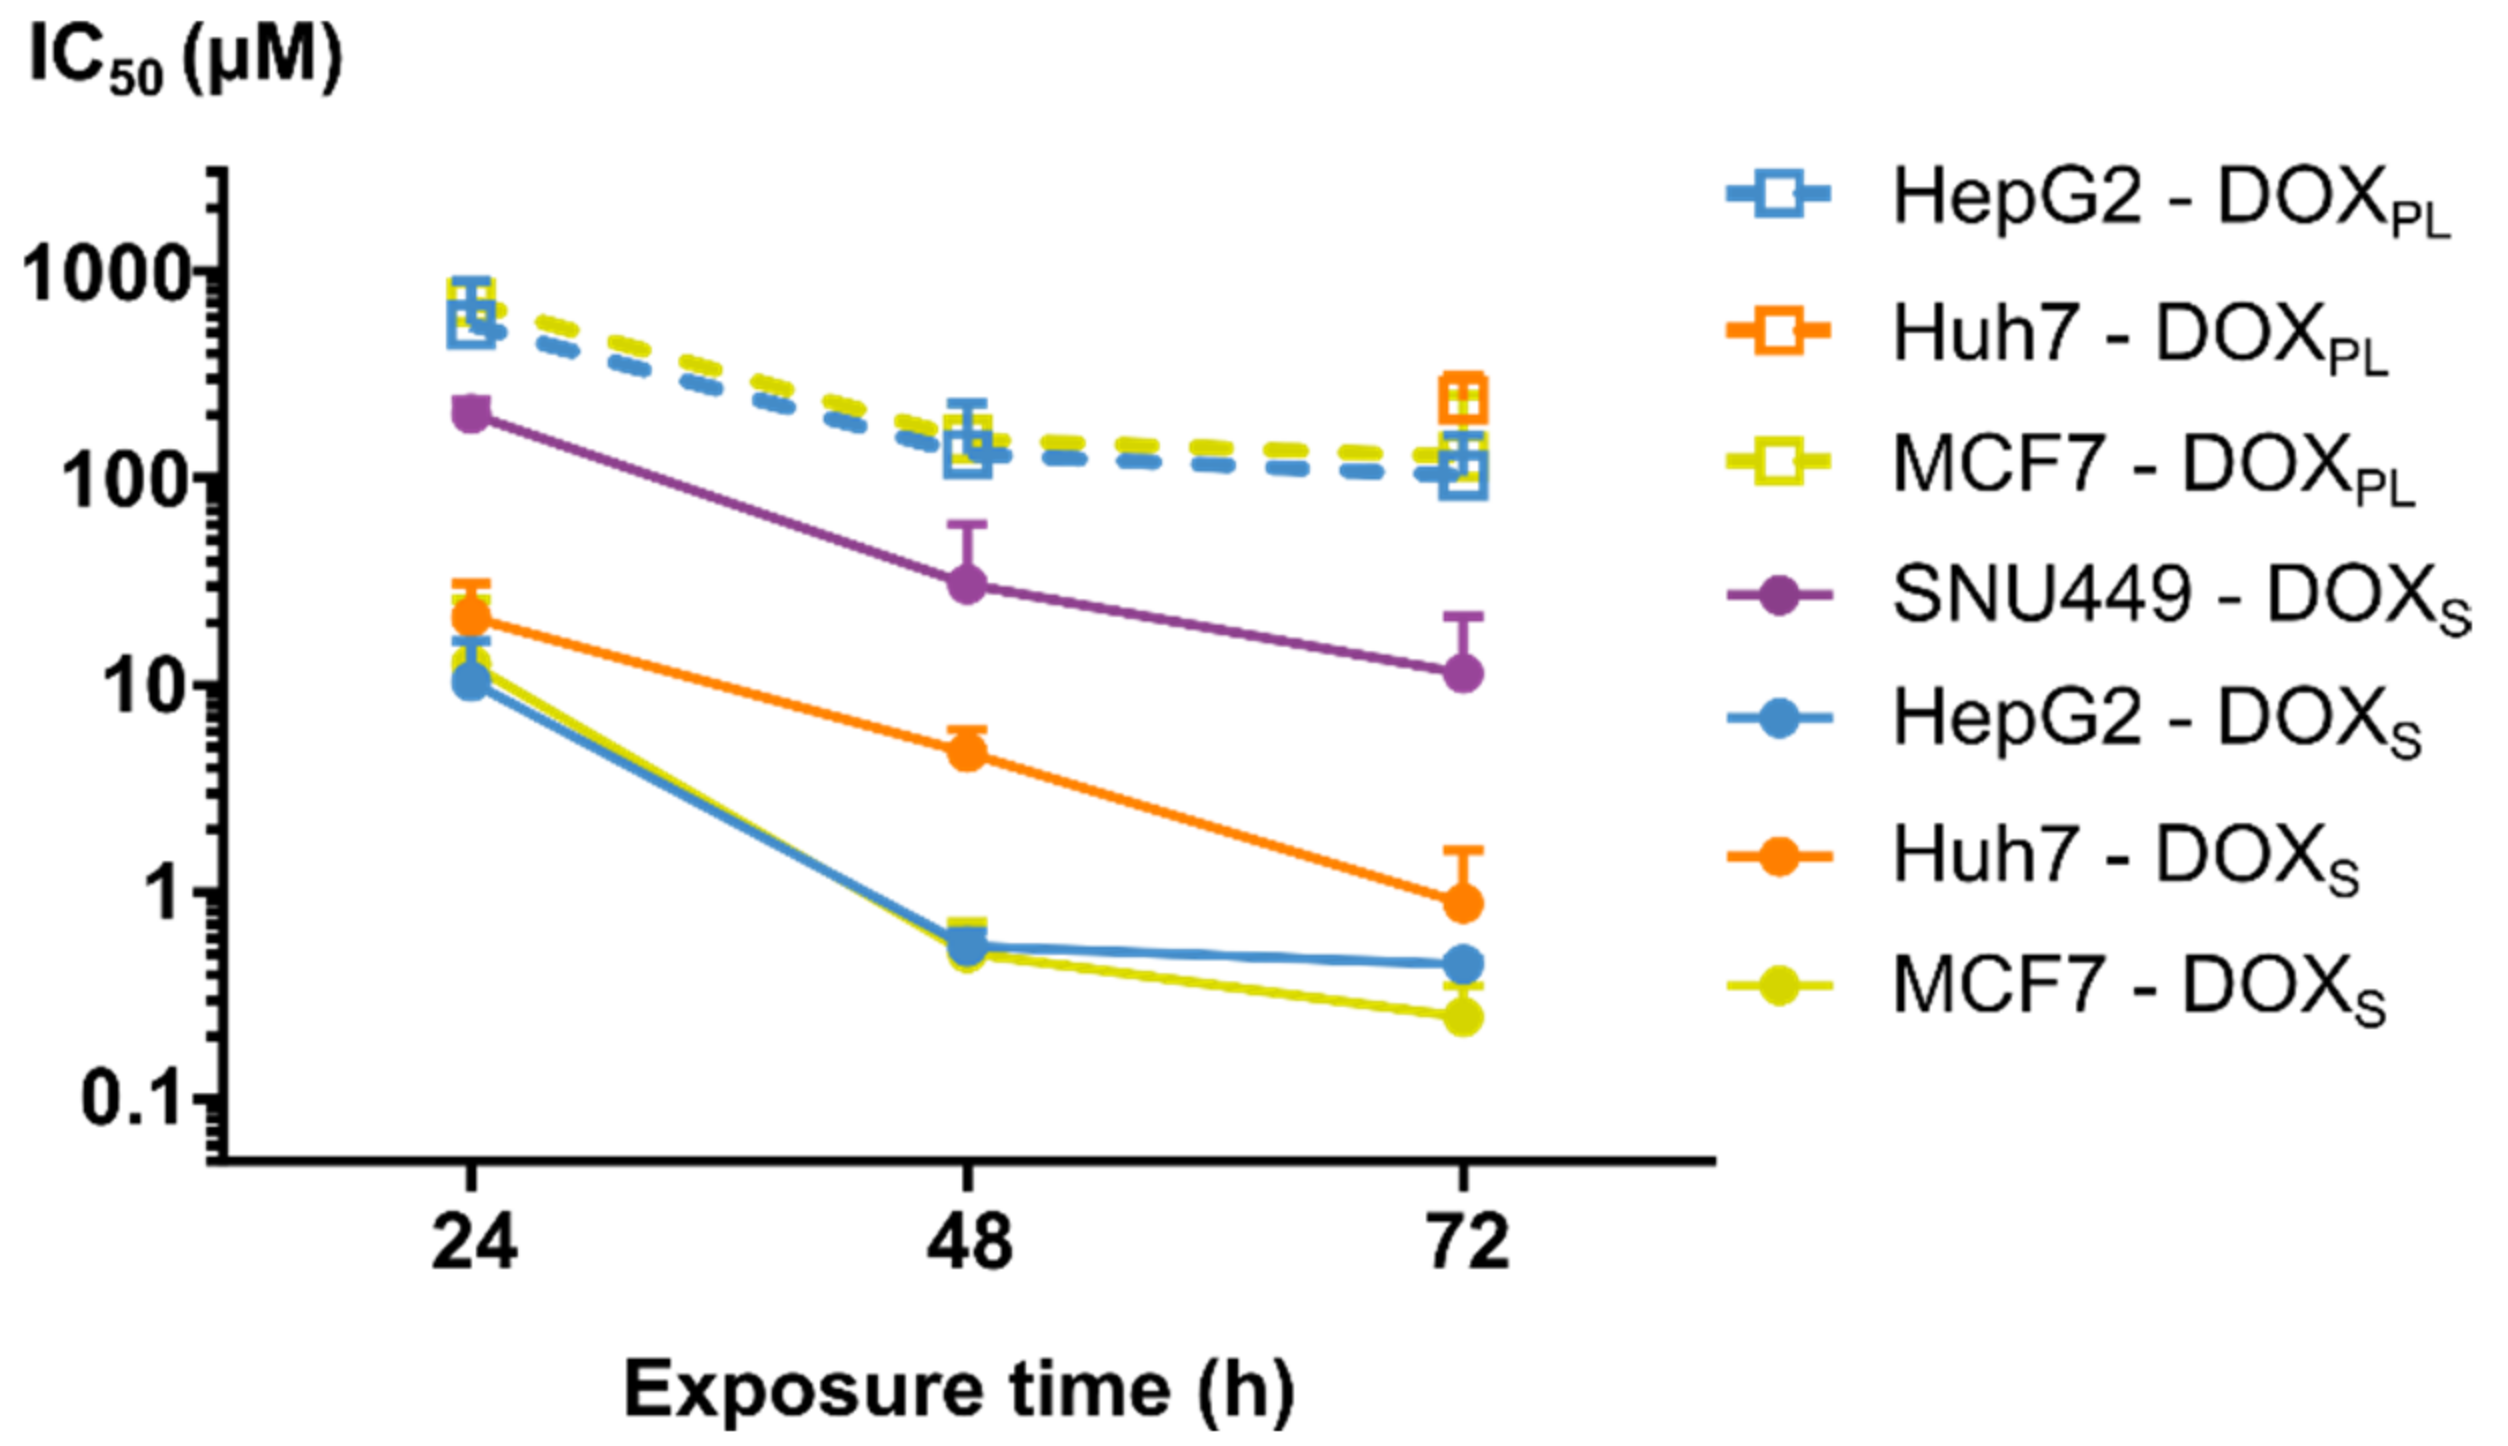
3.1. Cell Viability
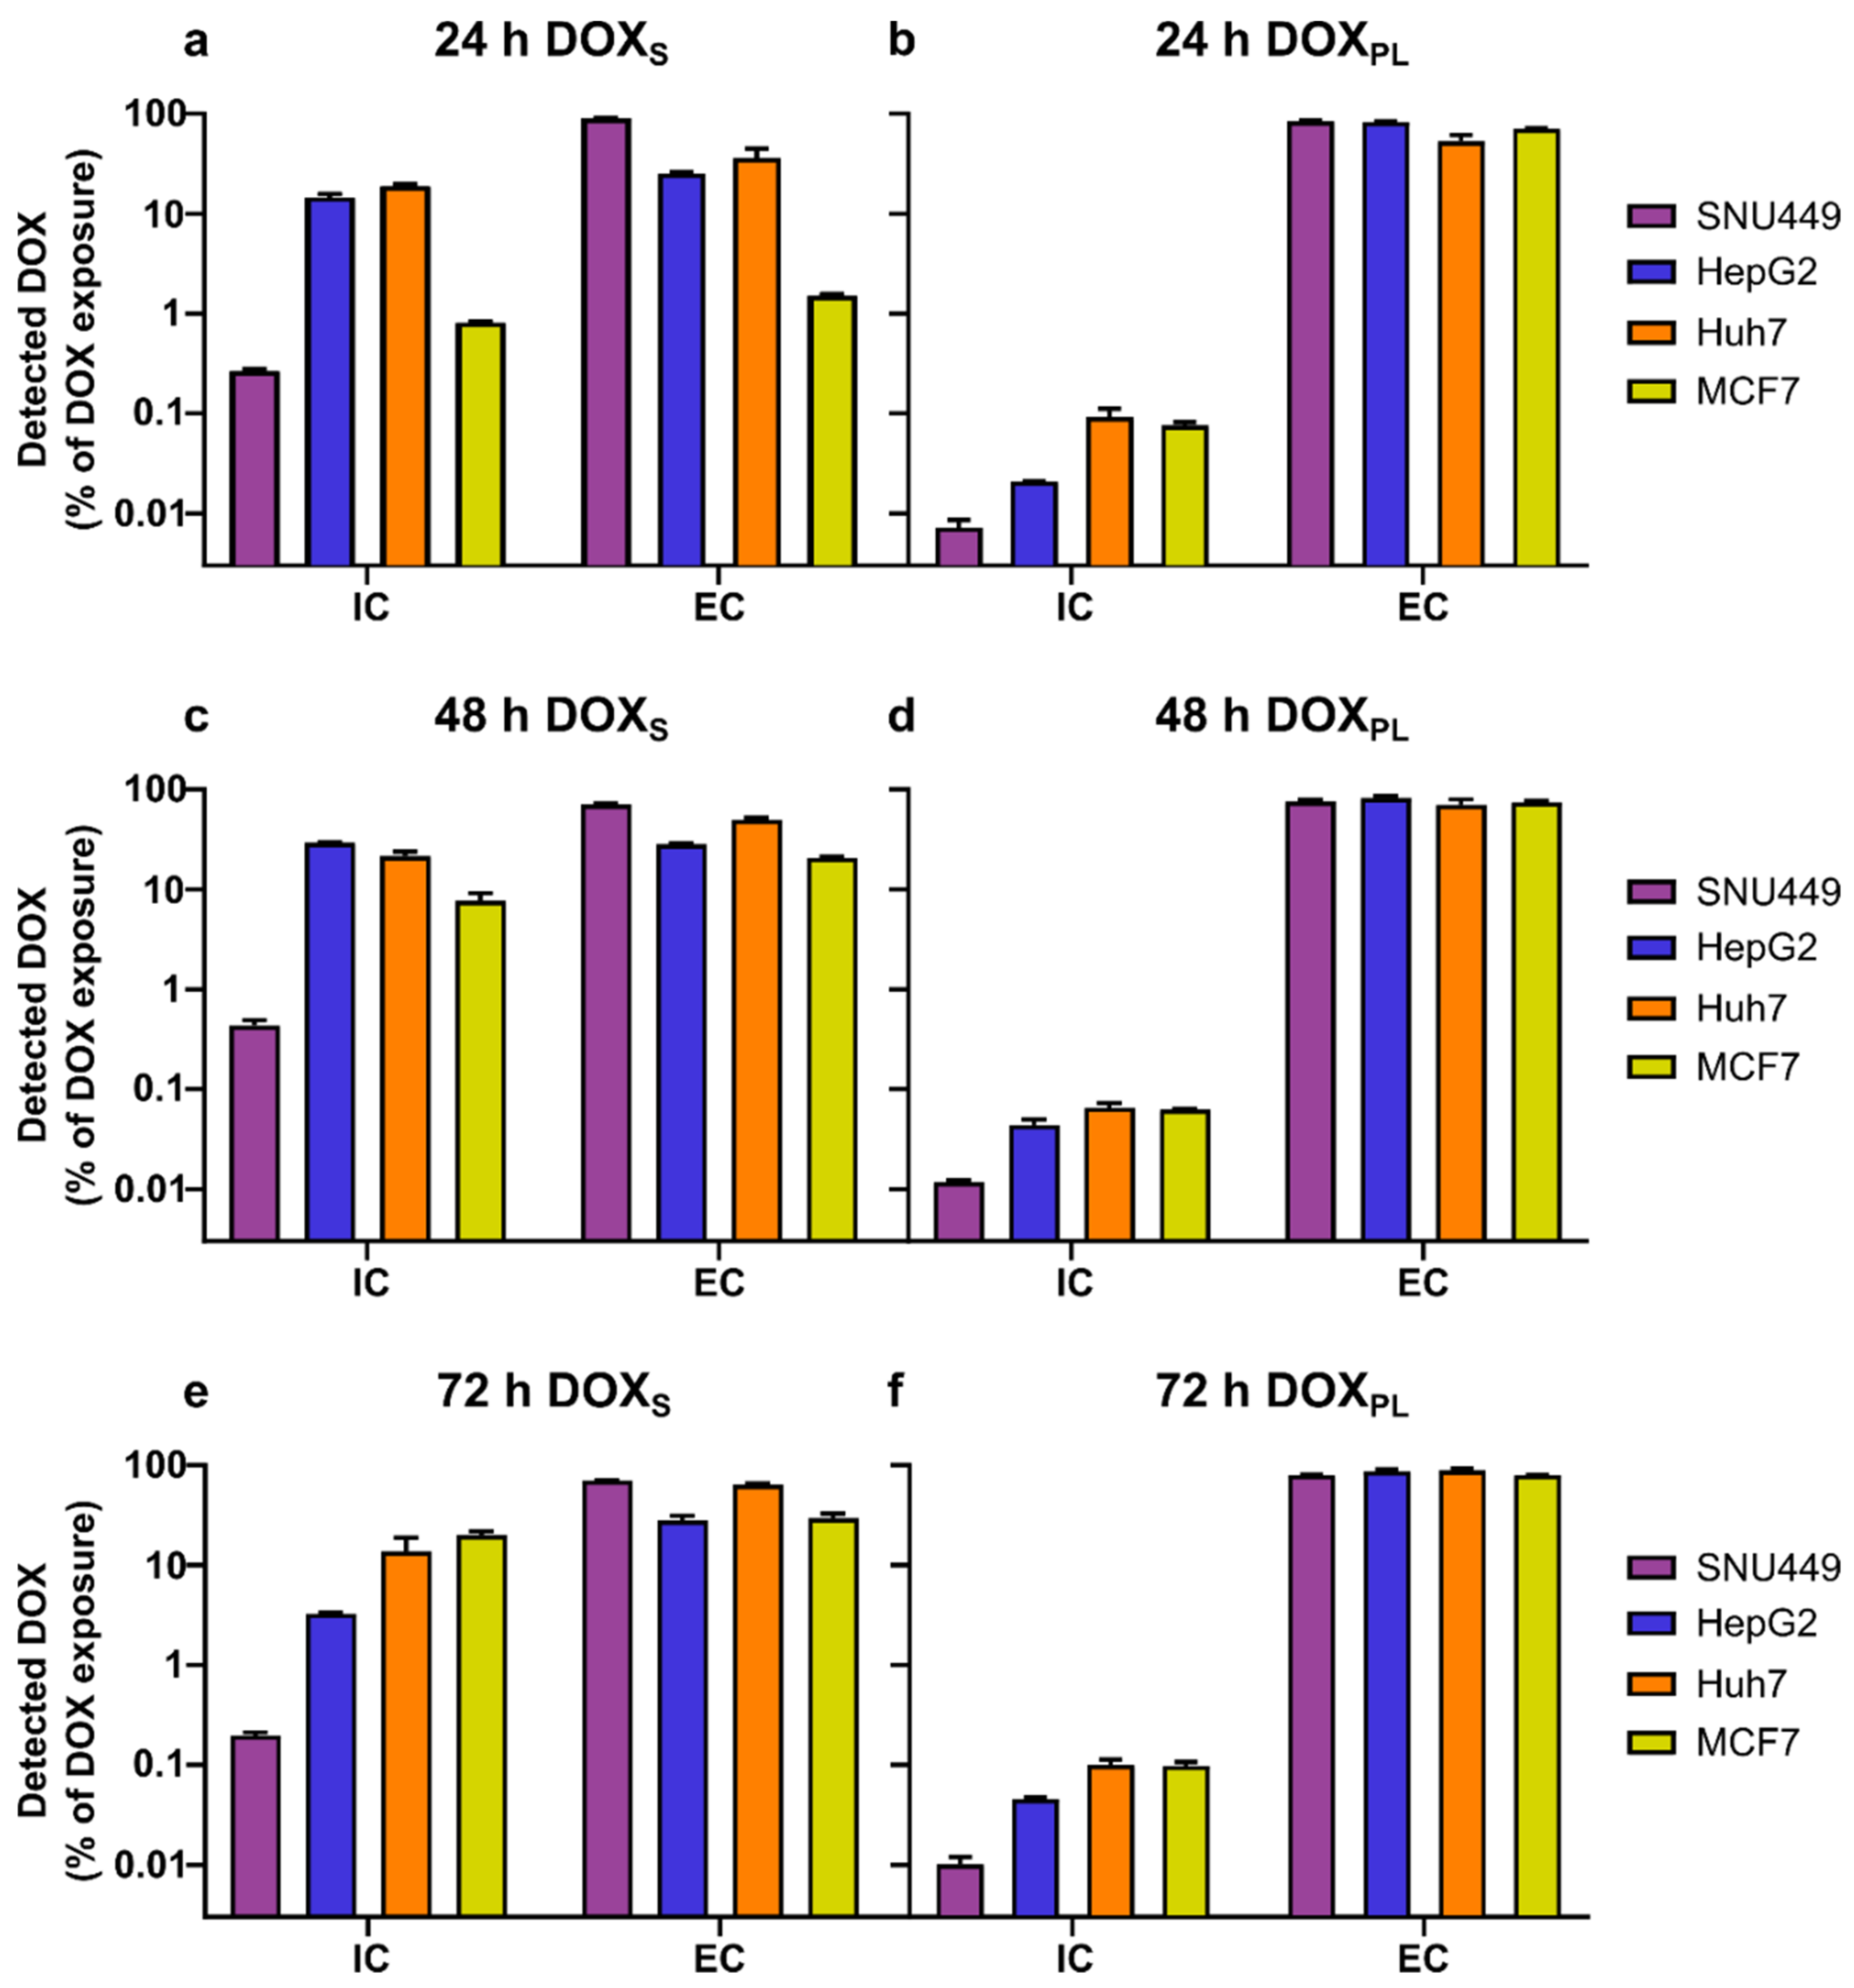
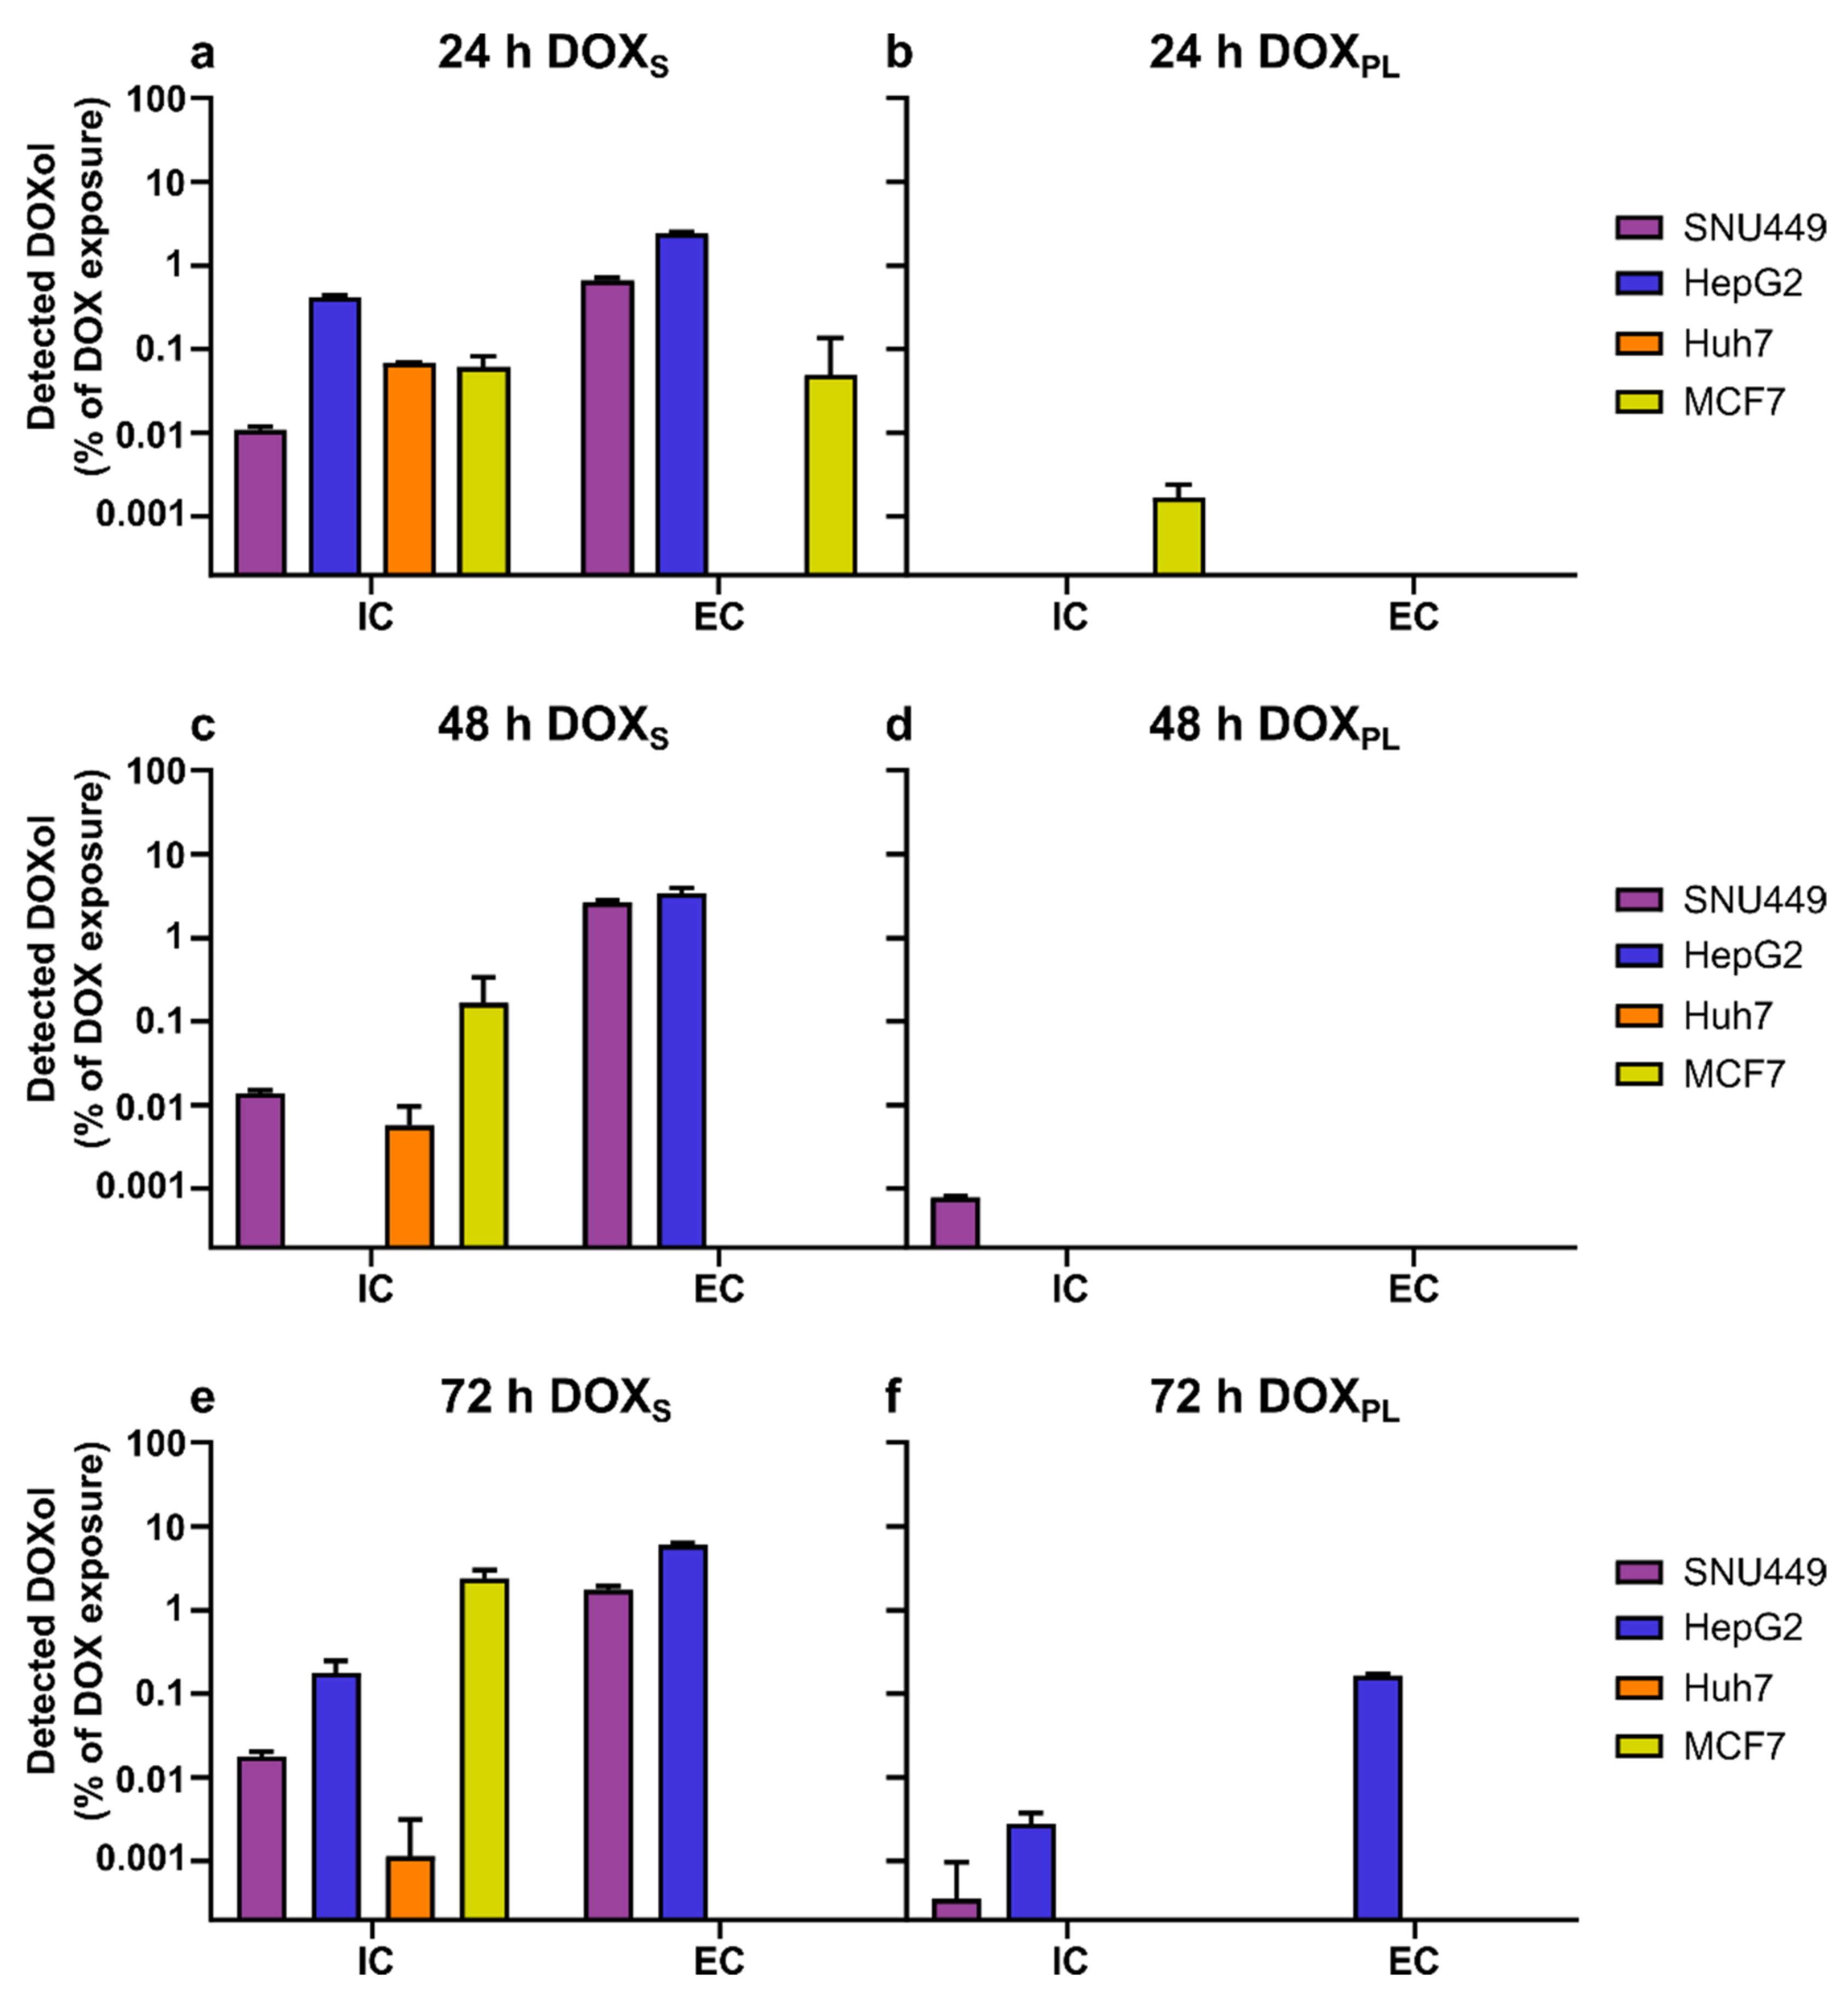
3.2. Intracellular Concentration and Uptake Ratio of DOX and DOXol Determined with a Bioanalytical Method Using UPLC-MS
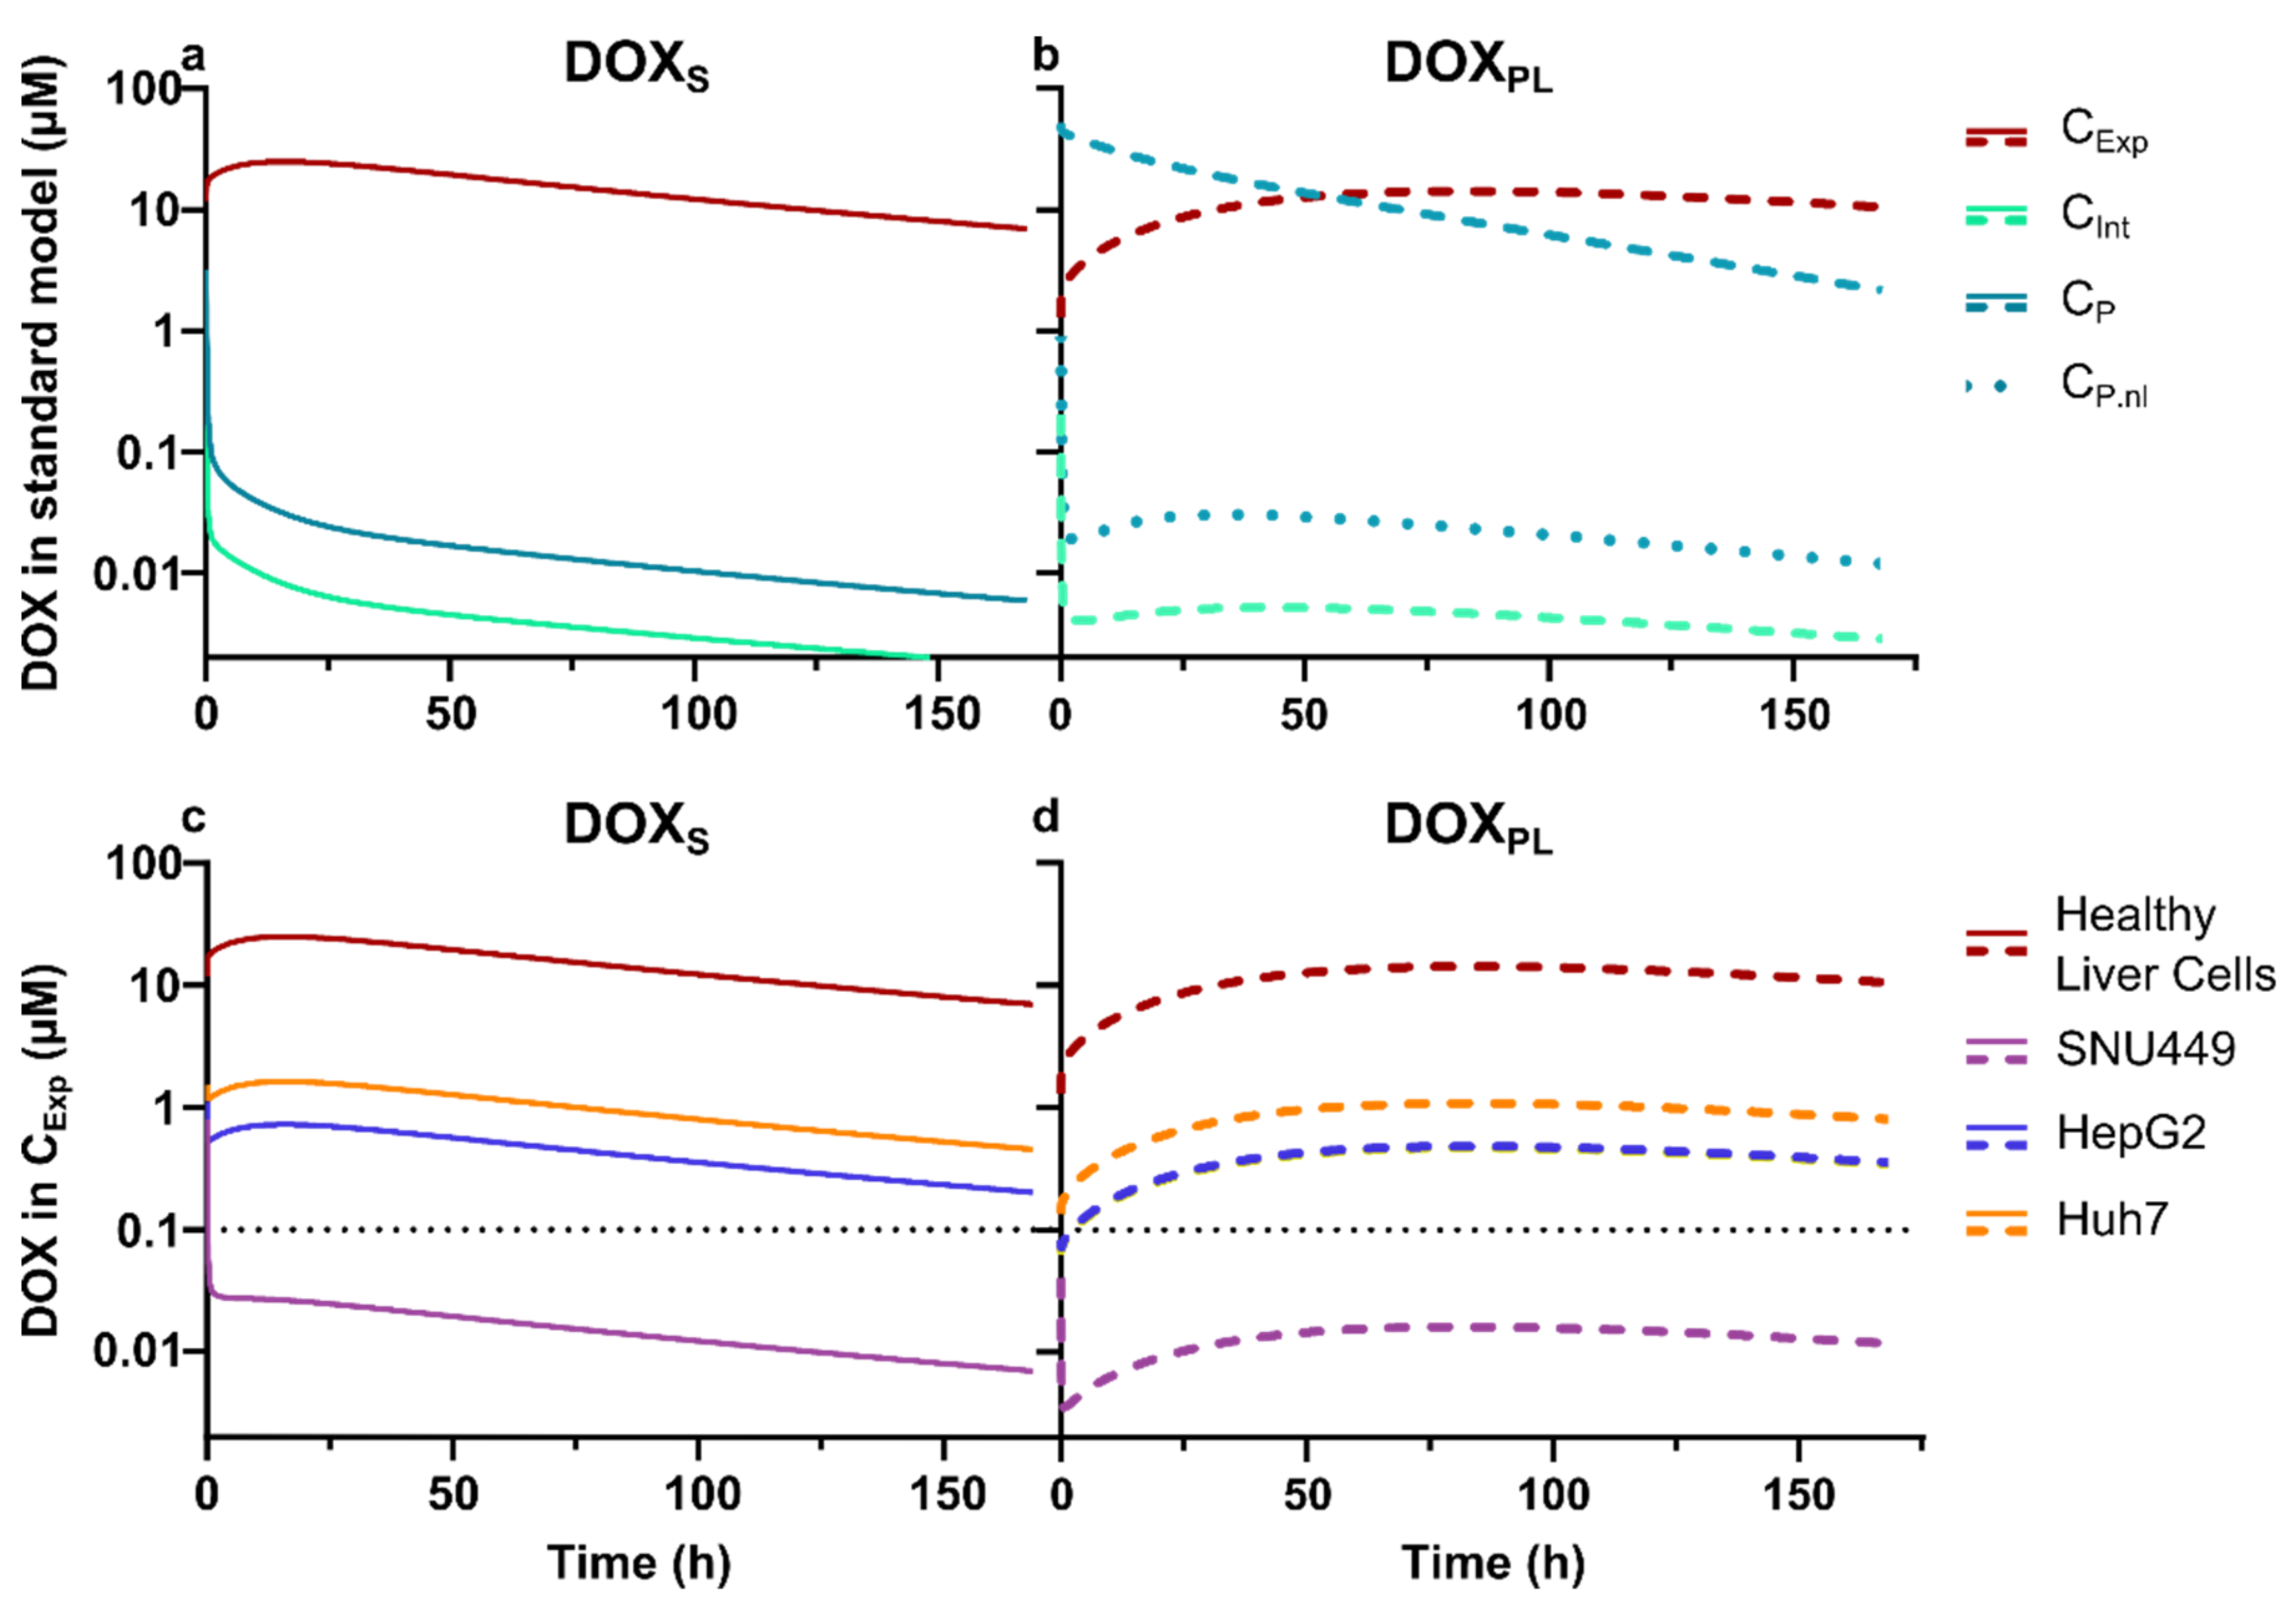
3.3. Physiologically Based Pharmacokinetic Modeling
4. Discussion
5. Conclusions
Supplementary Materials
Author Contributions
Funding
Acknowledgments
Conflicts of Interest
References
- Yarchoan, M.; Agarwal, P.; Villanueva, A.; Rao, S.; Dawson, L.A.; Llovet, J.M.; Finn, R.S.; Groopman, J.D.; El-Serag, H.B.; Monga, S.P. Recent developments and therapeutic strategies against hepatocellular carcinoma. Cancer Res. 2019, 79, 4326–4330. [Google Scholar] [CrossRef] [Green Version]
- Gewirtz, D. A critical evaluation of the mechanisms of action proposed for the antitumor effects of the anthracycline antibiotics adriamycin and daunorubicin. Biochem. Pharmacol. 1999, 57, 727–741. [Google Scholar] [CrossRef]
- Shen, F.; Chu, S.; Bence, A.K.; Bailey, B.; Xue, X.; Erickson, P.A.; Montrose, M.H.; Beck, W.T.; Erickson, L.C. Quantitation of doxorubicin uptake, efflux, and modulation of multidrug resistance (MDR) in MDR human cancer cells. J. Pharmacol. Exp. Ther. 2008, 324, 95–102. [Google Scholar] [CrossRef] [Green Version]
- Matyszewska, D.; Nazaruk, E.; Campbell, R.A. Interactions of anticancer drugs doxorubicin and idarubicin with lipid monolayers: New insight into the composition, structure and morphology. J. Colloid Interface Sci. 2020, 581, 403–416. [Google Scholar] [CrossRef]
- Siegfried, J.M.; Burke, T.G.; Tritton, T.R. Cellular transport of anthracyclines by passive diffusion: Implications for drug resistance. Biochem. Pharmacol. 1985, 34, 593–598. [Google Scholar] [CrossRef]
- Rivory, L.P.; Avent, K.M.; Pond, S.M. Effects of lipophilicity and protein binding on the hepatocellular uptake and hepatic disposition of two anthracyclines, doxorubicin and iododoxorubicin. Cancer Chemother. Pharmacol. 1996, 38, 439–445. [Google Scholar] [CrossRef]
- Kozin, S.; Gerweck, L. Cytotoxicity of weak electrolytes after the adaptation of cells to low pH: Role of the transmembrane pH gradient. Br. J. Cancer 1998, 77, 1580. [Google Scholar] [CrossRef] [PubMed] [Green Version]
- Gerweck, L.; Kozin, S.; Stocks, S. The pH partition theory predicts the accumulation and toxicity of doxorubicin in normal and low-pH-adapted cells. Br. J. Cancer 1999, 79, 838–842. [Google Scholar] [CrossRef] [Green Version]
- Raghunand, N.; He, X.; Van Sluis, R.; Mahoney, B.; Baggett, B.; Taylor, C.; Paine-Murrieta, G.; Roe, D.; Bhujwalla, Z.M.; Gillies, R. Enhancement of chemotherapy by manipulation of tumour pH. Br. J. Cancer 1999, 80, 1005–1011. [Google Scholar] [CrossRef] [PubMed] [Green Version]
- Swietach, P.; Hulikova, A.; Patiar, S.; Vaughan-Jones, R.D.; Harris, A.L. Importance of intracellular pH in determining the uptake and efficacy of the weakly basic chemotherapeutic drug, doxorubicin. PLoS ONE 2012, 7, e35949. [Google Scholar] [CrossRef] [PubMed]
- Yu, M.; Lee, C.; Wang, M.; Tannock, I.F. Influence of the proton pump inhibitor lansoprazole on distribution and activity of doxorubicin in solid tumors. Cancer Sci. 2015, 106, 1438–1447. [Google Scholar] [CrossRef] [PubMed] [Green Version]
- Patel, K.J.; Lee, C.; Tan, Q.; Tannock, I.F. Use of the proton pump inhibitor pantoprazole to modify the distribution and activity of doxorubicin: A potential strategy to improve the therapy of solid tumors. Clin. Cancer Res. 2013, 19, 6766–6776. [Google Scholar] [CrossRef] [Green Version]
- Yingchoncharoen, P.; Kalinowski, D.S.; Richardson, D.R. Lipid-based drug delivery systems in cancer therapy: What is available and what is yet to come. Pharmacol. Rev. 2016, 68, 701–787. [Google Scholar] [CrossRef] [Green Version]
- Dubbelboer, I.R.; Sjögren, E.; Lennernäs, H. Porcine and human in vivo simulations for doxorubicin-containing formulations used in locoregional hepatocellular carcinoma treatment. AAPS J. 2018, 20, 96. [Google Scholar] [CrossRef] [Green Version]
- Barenholz, Y.C. Doxil®—The first FDA-approved nano-drug: Lessons learned. J. Control. Release 2012, 160, 117–134. [Google Scholar] [CrossRef]
- Matsumura, Y.; Maeda, H. A new concept for macromolecular therapeutics in cancer chemotherapy: Mechanism of tumoritropic accumulation of proteins and the antitumor agent smancs. Cancer Res. 1986, 46, 6387–6392. [Google Scholar]
- Danhier, F. To exploit the tumor microenvironment: Since the EPR effect fails in the clinic, what is the future of nanomedicine? J. Control. Release 2016, 244, 108–121. [Google Scholar] [CrossRef]
- Nakamura, Y.; Mochida, A.; Choyke, P.L.; Kobayashi, H. Nanodrug delivery: Is the enhanced permeability and retention effect sufficient for curing cancer? Bioconjugate Chem. 2016, 27, 2225–2238. [Google Scholar] [CrossRef]
- Sindhwani, S.; Syed, A.M.; Ngai, J.; Kingston, B.R.; Maiorino, L.; Rothschild, J.; MacMillan, P.; Zhang, Y.; Rajesh, N.U.; Hoang, T. The entry of nanoparticles into solid tumours. Nat. Mater. 2020, 19, 566–575. [Google Scholar] [CrossRef] [PubMed]
- Petersen, G.H.; Alzghari, S.K.; Chee, W.; Sankari, S.S.; La-Beck, N.M. Meta-analysis of clinical and preclinical studies comparing the anticancer efficacy of liposomal versus conventional non-liposomal doxorubicin. J. Control. Release 2016, 232, 255–264. [Google Scholar] [CrossRef] [PubMed]
- Kohli, A.G.; Kivimäe, S.; Tiffany, M.R.; Szoka, F.C. Improving the distribution of Doxil® in the tumor matrix by depletion of tumor hyaluronan. J. Control. Release 2014, 191, 105–114. [Google Scholar] [CrossRef] [Green Version]
- Jain, D. Cardiotoxicity of doxorubicin and other anthracycline derivatives. J. Nucl. Cardiol. 2000, 7, 53. [Google Scholar] [CrossRef] [PubMed]
- El Fouly, A.; Ertle, J.; El Dorry, A.; Shaker, M.K.; Dechêne, A.; Abdella, H.; Mueller, S.; Barakat, E.; Lauenstein, T.; Bockisch, A. In intermediate stage hepatocellular carcinoma: Radioembolization with yttrium 90 or chemoembolization? Liver Int. 2015, 35, 627–635. [Google Scholar] [CrossRef]
- Lilienberg, E.; Dubbelboer, I.R.; Karalli, A.; Axelsson, R.; Brismar, T.B.; Ebeling Barbier, C.; Norén, A.; Duraj, F.; Hedeland, M.; Bondesson, U. In vivo drug delivery performance of Lipiodol-based emulsion or drug-eluting beads in patients with hepatocellular carcinoma. Mol. Pharm. 2017, 14, 448–458. [Google Scholar] [CrossRef] [PubMed]
- Shen, L.; Zhang, Y.; Zhang, J.; Wang, T.; Li, H.; Wang, Y.; Quan, D. Reversed lipid-based nanoparticles dispersed in iodized oil for transarterial chemoembolization. ACS Appl. Mater. Interfaces 2019, 11, 20642–20648. [Google Scholar] [CrossRef]
- Zhang, J.; Zhou, F.; Wu, X.; Zhang, X.; Chen, Y.; Zha, B.S.; Niu, F.; Lu, M.; Hao, G.; Sun, Y. Cellular pharmacokinetic mechanisms of adriamycin resistance and its modulation by 20 (S)-ginsenoside Rh2 in MCF-7/Adr cells. Br. J. Pharmacol. 2012, 165, 120–134. [Google Scholar] [CrossRef] [Green Version]
- El-Kareh, A.W.; Secomb, T.W. Two-mechanism peak concentration model for cellular pharmacodynamics of Doxorubicin. Neoplasia 2005, 7, 705–713. [Google Scholar] [CrossRef] [PubMed] [Green Version]
- Capes-Davis, A.; Theodosopoulos, G.; Atkin, I.; Drexler, H.G.; Kohara, A.; MacLeod, R.A.; Masters, J.R.; Nakamura, Y.; Reid, Y.A.; Reddel, R.R. Check your cultures! A list of cross-contaminated or misidentified cell lines. Int. J. Cancer 2010, 127, 1–8. [Google Scholar] [CrossRef] [PubMed]
- Dubbelboer, I.R.; Pavlovic, N.; Heindryckx, F.; Sjögren, E.; Lennernäs, H. Liver cancer cell lines treated with doxorubicin under normoxia and hypoxia: Cell viability and oncologic protein profile. Cancers 2019, 11, 1024. [Google Scholar] [CrossRef] [Green Version]
- Marwood, T.; Vasudevan, C.; Brevig, T. Increasing throughput in cellular assays: Reduction of edge effect allows results to remain consistent across entire plate. Genet. Eng. Biotechnol. News 2011, 31, 22–23. [Google Scholar] [CrossRef]
- Calitz, C.; Pavlović, N.; Rosenquist, J.; Zagami, C.; Samanta, A.; Heindryckx, F. A biomimetic model for liver cancer to study tumor-stroma interactions in a 3D environment with tunable bio-physical properties. JoVE J. Vis. Exp. 2020, 162, e61606. [Google Scholar] [CrossRef] [PubMed]
- Matuszewski, B.; Constanzer, M.; Chavez-Eng, C. Strategies for the assessment of matrix effect in quantitative bioanalytical methods based on HPLC—MS/MS. Anal. Chem. 2003, 75, 3019–3030. [Google Scholar] [CrossRef] [PubMed]
- Hanke, N.; Teifel, M.; Moj, D.; Wojtyniak, J.-G.; Britz, H.; Aicher, B.; Sindermann, H.; Ammer, N.; Lehr, T. A physiologically based pharmacokinetic (PBPK) parent-metabolite model of the chemotherapeutic zoptarelin doxorubicin—Integration of in vitro results, Phase I and Phase II data and model application for drug–drug interaction potential analysis. Cancer Chemother. Pharmacol. 2018, 81, 291–304. [Google Scholar] [CrossRef]
- Niederalt, C.; Kuepfer, L.; Solodenko, J.; Eissing, T.; Siegmund, H.-U.; Block, M.; Willmann, S.; Lippert, J. A generic whole body physiologically based pharmacokinetic model for therapeutic proteins in PK-Sim. J. Pharmacokinet. Pharmacodyn. 2018, 45, 235–257. [Google Scholar] [CrossRef] [PubMed] [Green Version]
- Harrington, K.J.; Mohammadtaghi, S.; Uster, P.S.; Glass, D.; Peters, A.M.; Vile, R.G.; Stewart, J.S.W. Effective targeting of solid tumors in patients with locally advanced cancers by radiolabeled pegylated liposomes. Clin. Cancer Res. 2001, 7, 243–254. [Google Scholar]
- Gabizon, A.; Catane, R.; Uziely, B.; Kaufman, B.; Safra, T.; Cohen, R.; Martin, F.; Huang, A.; Barenholz, Y. Prolonged circulation time and enhanced accumulation in malignant exudates of doxorubicin encapsulated in polyethylene-glycol coated liposomes. Cancer Res. 1994, 54, 987–992. [Google Scholar]
- Holliday, D.L.; Speirs, V. Choosing the right cell line for breast cancer research. Breast Cancer Res. 2011, 13, 215. [Google Scholar] [CrossRef] [PubMed] [Green Version]
- Burdall, S.E.; Hanby, A.M.; Lansdown, M.R.; Speirs, V. Breast cancer cell lines: Friend or foe? Breast Cancer Res. 2003, 5, 89. [Google Scholar] [CrossRef] [Green Version]
- Gomes, A.R.; Abrantes, A.M.; Brito, A.F.; Laranjo, M.; Casalta-Lopes, J.E.; Gonçalves, A.C.; Sarmento-Ribeiro, A.B.; Botelho, M.F.; Tralhão, J.G. Influence of P53 on the radiotherapy response of hepatocellular carcinoma. Clin. Mol. Hepatol. 2015, 21, 257. [Google Scholar] [CrossRef] [Green Version]
- Lee, Y.R.; Park, S.Y. P53 expression in hepatocellular carcinoma: Influence on the radiotherapeutic response of the hepatocellular carcinoma. Clin. Mol. Hepatol. 2015, 21, 230–231. [Google Scholar] [CrossRef] [Green Version]
- Huun, J.; Lønning, P.E.; Knappskog, S. Effects of concomitant inactivation of p53 and pRb on response to doxorubicin treatment in breast cancer cell lines. Cell Death Discov. 2017, 3, 1–6. [Google Scholar] [CrossRef]
- Ao, L.; Guo, Y.; Song, X.; Guan, Q.; Zheng, W.; Zhang, J.; Huang, H.; Zou, Y.; Guo, Z.; Wang, X. Evaluating hepatocellular carcinoma cell lines for tumour samples using within-sample relative expression orderings of genes. Liver Int. 2017, 37, 1688–1696. [Google Scholar] [CrossRef]
- Nwosu, Z.C.; Battello, N.; Rothley, M.; Piorońska, W.; Sitek, B.; Ebert, M.P.; Hofmann, U.; Sleeman, J.; Wölfl, S.; Meyer, C. Liver cancer cell lines distinctly mimic the metabolic gene expression pattern of the corresponding human tumours. J. Exp. Clin. Cancer Res. 2018, 37, 211. [Google Scholar] [CrossRef]
- Joshua, A.M.; Tannock, I.F. Oncology in 2050—A Retrospective? Oncologist 2020, 25, e1127. [Google Scholar] [CrossRef] [Green Version]
- Bains, O.S.; Szeitz, A.; Lubieniecka, J.M.; Cragg, G.E.; Grigliatti, T.A.; Riggs, K.W.; Reid, R.E. A correlation between cytotoxicity and reductase-mediated metabolism in cell lines treated with doxorubicin and daunorubicin. J. Pharmacol. Exp. Ther. 2013, 347, 375–387. [Google Scholar] [CrossRef] [PubMed]
- Balgoma, D.; Kullenberg, F.; Calitz, C.; Kopsida, M.; Heindryckx, F.; Lennernäs, H.; Hedeland, M. Anthracyclines increase PUFAs: Potential implications in ER stress and cell death. Cells 2021, 10, 1163. [Google Scholar] [CrossRef] [PubMed]
- Soininen, S.K.; Vellonen, K.-S.; Heikkinen, A.T.; Auriola, S.; Ranta, V.-P.; Urtti, A.; Ruponen, M. Intracellular PK/PD relationships of free and liposomal doxorubicin: Quantitative analyses and PK/PD modeling. Mol. Pharm. 2016, 13, 1358–1365. [Google Scholar] [CrossRef] [PubMed]
- Seynhaeve, A.L.; Dicheva, B.M.; Hoving, S.; Koning, G.A.; ten Hagen, T.L. Intact Doxil is taken up intracellularly and released doxorubicin sequesters in the lysosome: Evaluated by in vitro/in vivo live cell imaging. J. Control. Release 2013, 172, 330–340. [Google Scholar] [CrossRef] [PubMed]
- Liang, B.; Zhao, D.; Liu, Y.; Guo, X.; Zhang, H.; Zhang, L.; Zheng, C. Chemoembolization of liver cancer with doxorubicin-loaded CalliSpheres microspheres: Plasma pharmacokinetics, intratumoral drug concentration, and tumor necrosis in a rabbit model. Drug Deliv. Transl. Res. 2020, 10, 185–191. [Google Scholar] [CrossRef]
- Dubbelboer, I.R.; Lilienberg, E.; Hedeland, M.; Bondesson, U.; Piquette-Miller, M.; Sjögren, E.; Lennernäs, H. The effects of lipiodol and cyclosporin A on the hepatobiliary disposition of doxorubicin in pigs. Mol. Pharm. 2014, 11, 1301–1313. [Google Scholar] [CrossRef]
- Li, Y.; Gao, F.; Guo, J.; Ren, P.; Tian, Z.; Bai, J.; Hua, J. Polymeric micelles with aggregation-induced emission based on microbial ε-polylysine for doxorubicin delivery. Eur. Polym. J. 2020, 122, 109355. [Google Scholar] [CrossRef]
- Czarnik-Kwaśniak, J.; Kwaśniak, K.; Tutaj, K.; Filiks, I.; Uram, Ł.; Stompor, M.; Wołowiec, S. Glucoheptoamidated polyamidoamine PAMAM G3 dendrimer as a vehicle for succinate linked doxorubicin; enhanced toxicity of DOX against grade IV glioblastoma U-118 MG cells. J. Drug Deliv. Sci. Technol. 2020, 55, 101424. [Google Scholar] [CrossRef]
- Csuhai, E.; Kangarlou, S.; Xiang, T.-X.; Ponta, A.; Bummer, P.; Choi, D.; Anderson, B.D. Determination of key parameters for a mechanism-based model to predict doxorubicin release from actively loaded liposomes. J. Pharm. Sci. 2015, 104, 1087–1098. [Google Scholar] [CrossRef]
- Silverman, L.; Barenholz, Y. In vitro experiments showing enhanced release of doxorubicin from Doxil® in the presence of ammonia may explain drug release at tumor site. Nanomed. Nanotechnol. Biol. Med. 2015, 11, 1841–1850. [Google Scholar] [CrossRef] [PubMed]
- Paškevičiūtė, M.; Petrikaitė, V. Proton pump inhibitors modulate transport of doxorubicin and its liposomal form into 2D and 3D breast cancer cell cultures. Cancer Manag. Res. 2019, 11, 9761. [Google Scholar] [CrossRef] [PubMed] [Green Version]
- Yang, Y.; Liu, S.; Chen, C.; Huang, H.; Tao, L.; Qian, Z.; Li, W. Microfluidic-enabled self-organized tumor model for in vitro cytotoxicity assessment of doxorubicin. Biomed. Microdevices 2020, 22, 1–11. [Google Scholar] [CrossRef] [PubMed]
- Lilienberg, E.; Ebeling Barbier, C.; Nyman, R.; Hedeland, M.; Bondesson, U.; Axen, N.; Lennernäs, H. Investigation of hepatobiliary disposition of doxorubicin following intrahepatic delivery of different dosage forms. Mol. Pharm. 2014, 11, 131–144. [Google Scholar] [CrossRef]
- Chen, H.; Cheng, H.; Wu, W.; Li, D.; Mao, J.; Chu, C.; Liu, G. The blooming intersection of transcatheter hepatic artery chemoembolization and nanomedicine. Chin. Chem. Lett. 2020, 31, 1375–1381. [Google Scholar] [CrossRef]


| SNU449 | ||||
|---|---|---|---|---|
| DOXS | DOXS + PPI | DOXPL | DOXPL + PPI | |
| 24 h | 218 ± 38 | 405 ± 1.0 | n/a | n/a |
| 48 h | 32.9 ± 31 | 79.5 ± 11 | n/a | n/a |
| 72 h | 12.2 ± 11 | 6.10 ± 0.32 | n/a | 614 ± 75 |
| Huh-7 | ||||
| 24 h | 22.8 ± 10 | 15.2 ± 0.56 | n/a | n/a |
| 48 h | 5.06 ± 1.5 | 5.89 ± 0.53 | n/a | n/a |
| 72 h | 0.943 ± 0.78 | 2.15 ± 0.49 | 256 ± 82 | 504 ± 42 |
| HepG2 | ||||
| 24 h | 11.1 ± 6.4 | 4.13 ± 0.79 | 589 ± 370 | 225 ± 110 |
| 48 h | 0.584 ± 0.11 | 0.428 ± 0.048 | 139 ± 108 | 122 ± 43 |
| 72 h | 0.478 ± 0.031 | 0.531 ± 0.21 | 111 ± 62 | 26.4± 22 |
| MCF7 | ||||
| 24 h | 13.5 ± 14 | 1.56 ± 0.20 | 757 ± 150 | 292 ± 25 |
| 48 h | 0.547 ± 0.22 | 0.409 ± 0.017 | 164 ± 79 | 571 ± 34 |
| 72 h | 0.267 ± 0.11 | 0.119 ± 0.034 | 136 ± 140 | 60.3 ± 4.5 |
| SNU449 | ||||||
|---|---|---|---|---|---|---|
| Exposure Time | Treatment | EA (nmol) | ICA DOX (nmol) | ICA DOXol (pmol) | ECA DOX (nmol) | ECA DOXol (nmol) |
| 24 h | DOXS | 3000 | 7.94 ± 0.44 | 332 ± 25 | 2700 ± 13 | 20.3 ± 1.3 |
| DOXPL | 3000 | 0.218 ± 0.040 | n/a | 2540 ± 49 | n/a | |
| 48 h | DOXS | 450 | 1.96 ± 0.25 | 63.0 ± 48 | 321 ± 6.8 | 12.0 ± 0.71 |
| DOXPL | 3000 | 0.352 ± 0.012 | 23.8 ± 0.80 | 2280 ± 86 | n/a | |
| 72 h | DOXS | 150 | 0.297 ± 0.021 | 25.8 ± 3.5 | 106 ± 1.1 | 2.54 ± 0.25 |
| DOXPL | 3000 | 0.295 ± 0.0526 | 10.3 ± 18 | 2310 ± 39 | n/a | |
| HepG2 | ||||||
| 24 h | DOXS | 150 | 21.8 ± 1.9 | 631 ± 40 | 37.9 ± 1.2 | 3.67 ± 0.15 |
| DOXPL | 3000 | 0.624 ± 0.0092 | n/a | 2490 ± 46 | n/a | |
| 48 h | DOXS | 7.5 | 0.293 ± 0.017 | n/a | 2.12 ± 0.034 | 0.256 ± 0.043 |
| DOXPL | 1500 | 0.659 ± 0.087 | n/a | 1230 ± 58 | n/a | |
| 72 h | DOXS | 7.5 | 0.245 ± 0.0060 | 12.9 ± 4.9 | 2.10 ± 0.19 | 0.435 ± 0.023 |
| DOXPL | 1500 | 0.663 ± 0.023 | 40.4 ± 14 | 1260 ± 63 | 2.39 ± 0.083 | |
| Huh-7 | ||||||
| 24 h | DOXS | 300 | 56.3 ± 3.1 | 210 ± 1.1 | 108 ± 25 | n/a |
| DOXPL | 3000 | 2.76 ± 0.58 | n/a | 1600 ± 240 | n/a | |
| 48 h | DOXS | 75 | 16.2 ± 1.8 | 4.33 ± 2.9 | 37.3± 1.9 | n/a |
| DOXPL | 3000 | 1.96 ± 0.21 | n/a | 2110 ± 270 | n/a | |
| 72 h | DOXS | 15 | 2.06 ± 0.77 | n/a | 9.59 ± 0.12 | n/a |
| DOXPL | 3000 | 2.92 ± 0.36 | 13.3 ± 1.2 | 2600 ± 92 | n/a | |
| MCF7 | ||||||
| 24 h | DOXS | 150 | 1.22 ± 0.035 | 92.5 ± 33 | 2.26 ± 0.087 | 0.0758 ± 0.13 |
| DOXPL | 3000 | 2.28 ± 0.19 | 50.8 ± 22 | 2140 ± 35 | n/a | |
| 48 h | DOXS | 7.5 | 0.579 ± 0.11 | 12.5 ± 13 | 1.51 ± 0.035 | n/a |
| DOXPL | 3000 | 1.89 ± 0.014 | n/a | 2240 ± 84 | n/a | |
| 72 h | DOXS | 4.5 | 0.901 ± 0.076 | 104 ± 27 | 1.29 ± 0.13 | n/a |
| DOXPL | 1500 | 1.41 ± 0.13 | n/a | 1150 ± 15 | n/a | |
| SNU449 | ||||||
|---|---|---|---|---|---|---|
| Exposure Time | Treatment | EConc (µM) | Cells after Treatment (M) | ICC DOX (µM) | ICC DOXol (µM) | ICUR |
| 24 h | DOXS | 200 | 2.77 ± 0.044 | 2000 ± 140 | 83.4 ± 7.0 | 10.4 ± 0.73 |
| DOXPL | 200 | 3.37 ± 0.86 | 47.8 ± 18 | n/a | 0.24 ± 0.088 | |
| 48 h | DOXS | 30 | 3.29 ± 0.044 | 414 ± 48 | 13.3 ± 0.87 | 14.3 ± 1.6 |
| DOXPL | 200 | 6.07 ± 0.26 | 40.5 ± 3.1 | 2.73 ± 0.031 | 0.22 ± 0.016 | |
| 72 h | DOXS | 10 | 5.04 ± 0.43 | 41.1 ± 3.6 | 3.59 ± 0.75 | 4.47 ± 0.38 |
| DOXPL | 200 | 8.86 ± 0.54 | 23.2 ± 4.2 | 0.81 ± 1.4 | 0.12 ± 0.028 | |
| HepG2 | ||||||
| 24 h | DOXS | 10 | 6.21 ± 0.62 | 5090 ± 680 | 147 ± 20.6 | 523 ± 70 |
| DOXPL | 200 | 5.71 ± 2.5 | 178 ± 76 | n/a | 0.89 ± 0.38 | |
| 48 h | DOXS | 0.5 | 4.87 ± 0.67 | 87.1 ± 8.1 | n/a | 174 ± 16 |
| DOXPL | 100 | 5.89 ± 0.17 | 161 ± 21 | 0.77 ± 1.28 | 1.61 ± 0.212 | |
| 72 h | DOXS | 0.5 | 3.26 ± 0.30 | 108 ± 7.9 | 5.62 ± 1.7 | 228 ± 15 |
| DOXPL | 100 | 4.17 ± 0.19 | 228 ± 17 | 14.0± 4.9 | 2.42 ± 0.18 | |
| Huh-7 | ||||||
| 24 h | DOXS | 20 | 6.32 ± 0.35 | 6 220 ± 590 | 23.2 ± 1.3 | 312 ± 29 |
| DOXPL | 200 | 4.72 ± 0.35 | 412 ± 120 | 0.27 ± 0.47 | 2.1 ± 0.58 | |
| 48 h | DOXS | 5 | 3.01 ± 2.1 | 7 450 ± 8 400 | 2.34 ± 2.9 | 1490 ± 1 700 |
| DOXPL | 200 | 6.06 ± 1.6 | 233 ± 43 | n/a | 1.16 ± 0.21 | |
| 72 h | DOXS | 1 | 5.28 ± 0.55 | 280 ± 125 | 0.024 ± 0.042 | 280 ± 120 |
| DOXPL | 200 | 6.46 ± 0.39 | 314 ± 38 | 0.14 ± 0.16 | 1.57 ± 0.19 | |
| MCF7 | ||||||
| 24 h | DOXS | 10 | 5.65 ± 0.82 | 151 ± 21 | 11.2 ± 2.5 | 16.2 ± 1.9 |
| DOXPL | 200 | 5.55 ± 0.80 | 292 ± 60 | 6.67 ± 3.4 | 1.49 ± 0.31 | |
| 48 h | DOXS | 0.5 | 3.51 ± 0.16 | 115 ± 17 | 2.56 ± 2.7 | 234 ± 33 |
| DOXPL | 200 | 2.34 ± 0.61 | 593 ± 180 | 0.10 ± 0.10 | 2.96 ± 0.89 | |
| 72 h | DOXS | 0.3 | 3.69 ± 0.51 | 174 ± 41 | 19.5 ± 2.8 | 644 ± 130 |
| DOXPL | 100 | 1.93 ± 0.33 | 517 ± 87 | n/a | 5.17 ± 0.87 | |
Publisher’s Note: MDPI stays neutral with regard to jurisdictional claims in published maps and institutional affiliations. |
© 2021 by the authors. Licensee MDPI, Basel, Switzerland. This article is an open access article distributed under the terms and conditions of the Creative Commons Attribution (CC BY) license (https://creativecommons.org/licenses/by/4.0/).
Share and Cite
Kullenberg, F.; Degerstedt, O.; Calitz, C.; Pavlović, N.; Balgoma, D.; Gråsjö, J.; Sjögren, E.; Hedeland, M.; Heindryckx, F.; Lennernäs, H. In Vitro Cell Toxicity and Intracellular Uptake of Doxorubicin Exposed as a Solution or Liposomes: Implications for Treatment of Hepatocellular Carcinoma. Cells 2021, 10, 1717. https://doi.org/10.3390/cells10071717
Kullenberg F, Degerstedt O, Calitz C, Pavlović N, Balgoma D, Gråsjö J, Sjögren E, Hedeland M, Heindryckx F, Lennernäs H. In Vitro Cell Toxicity and Intracellular Uptake of Doxorubicin Exposed as a Solution or Liposomes: Implications for Treatment of Hepatocellular Carcinoma. Cells. 2021; 10(7):1717. https://doi.org/10.3390/cells10071717
Chicago/Turabian StyleKullenberg, Fredrik, Oliver Degerstedt, Carlemi Calitz, Nataša Pavlović, David Balgoma, Johan Gråsjö, Erik Sjögren, Mikael Hedeland, Femke Heindryckx, and Hans Lennernäs. 2021. "In Vitro Cell Toxicity and Intracellular Uptake of Doxorubicin Exposed as a Solution or Liposomes: Implications for Treatment of Hepatocellular Carcinoma" Cells 10, no. 7: 1717. https://doi.org/10.3390/cells10071717
APA StyleKullenberg, F., Degerstedt, O., Calitz, C., Pavlović, N., Balgoma, D., Gråsjö, J., Sjögren, E., Hedeland, M., Heindryckx, F., & Lennernäs, H. (2021). In Vitro Cell Toxicity and Intracellular Uptake of Doxorubicin Exposed as a Solution or Liposomes: Implications for Treatment of Hepatocellular Carcinoma. Cells, 10(7), 1717. https://doi.org/10.3390/cells10071717