
Lipid Droplets Formation Represents an Integral Component of Endothelial Inflammation Induced by LPS

 , ,
, ,  , ,
, ,  , and
, and 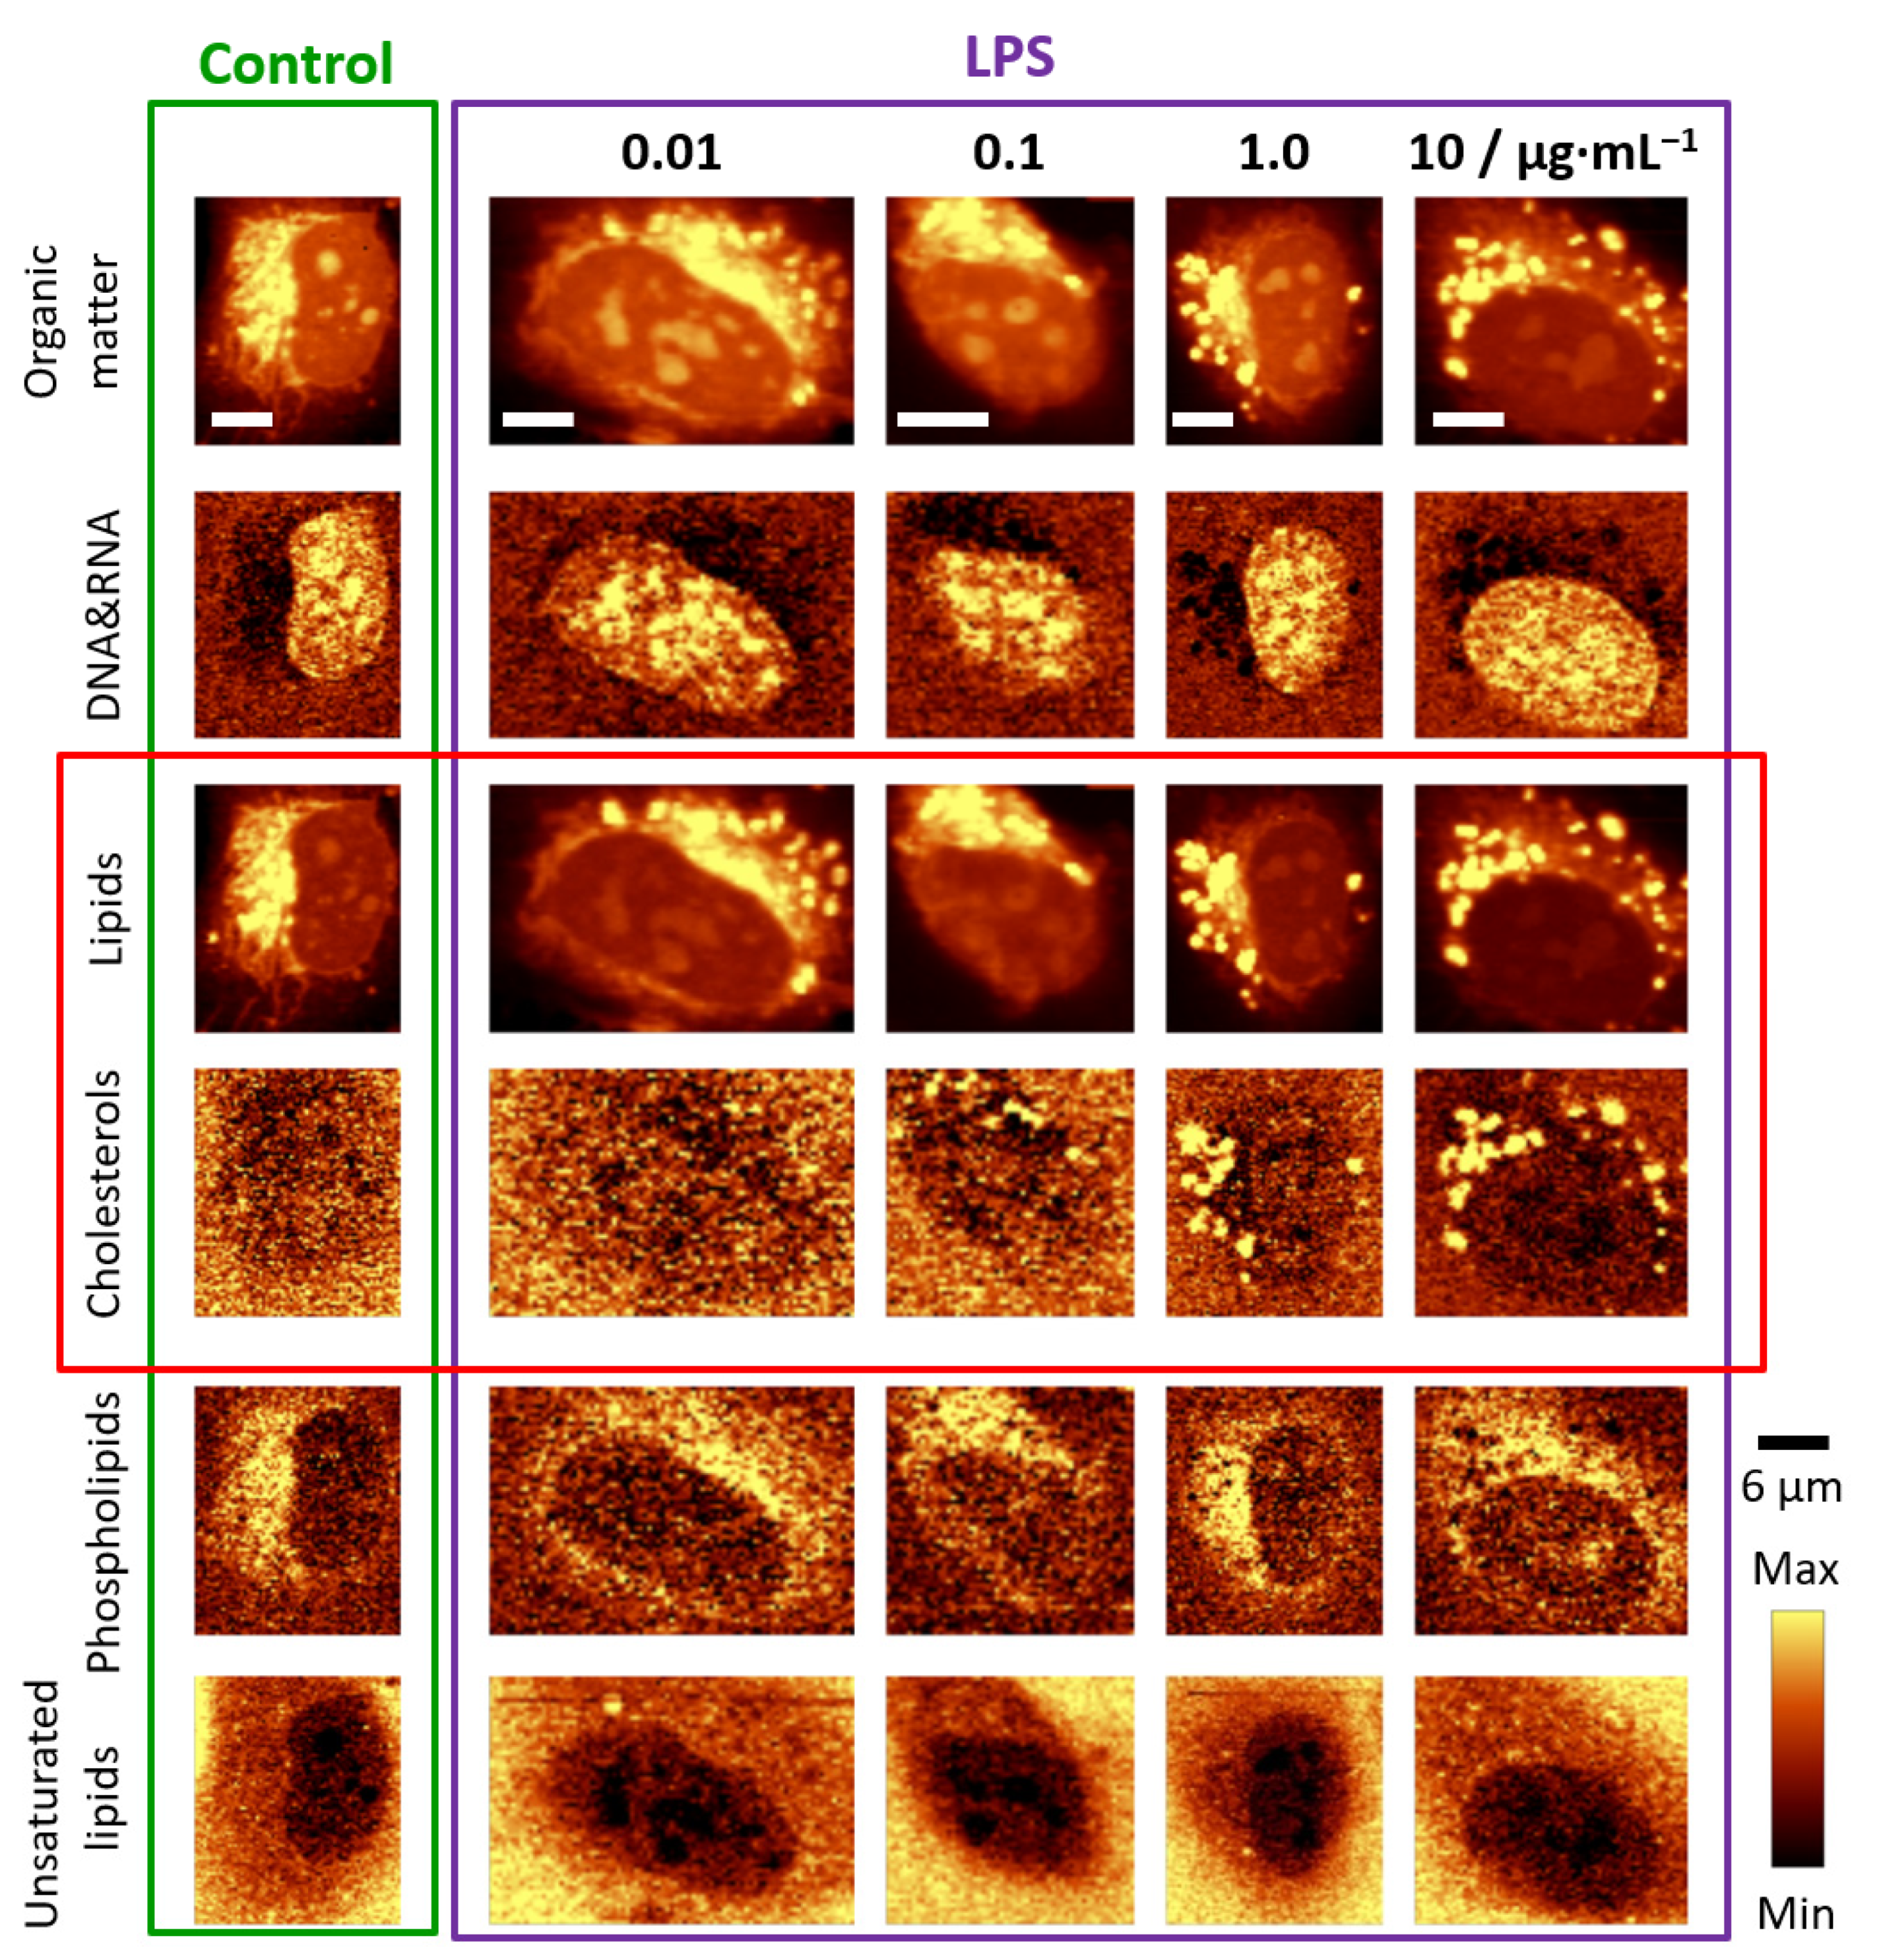
Abstract
1. Introduction
2. Materials and Methods
2.1. Cell Culture
2.2. Raman and AFM Microscopy
2.3. Expression of ICAM-1
2.4. MTS Assay
2.5. BODIPY Staining of Lipid Droplets
2.6. Assessment of LPS Induced PGI2 Release in HMEC-1
2.7. Data Analysis and Processing
3. Results
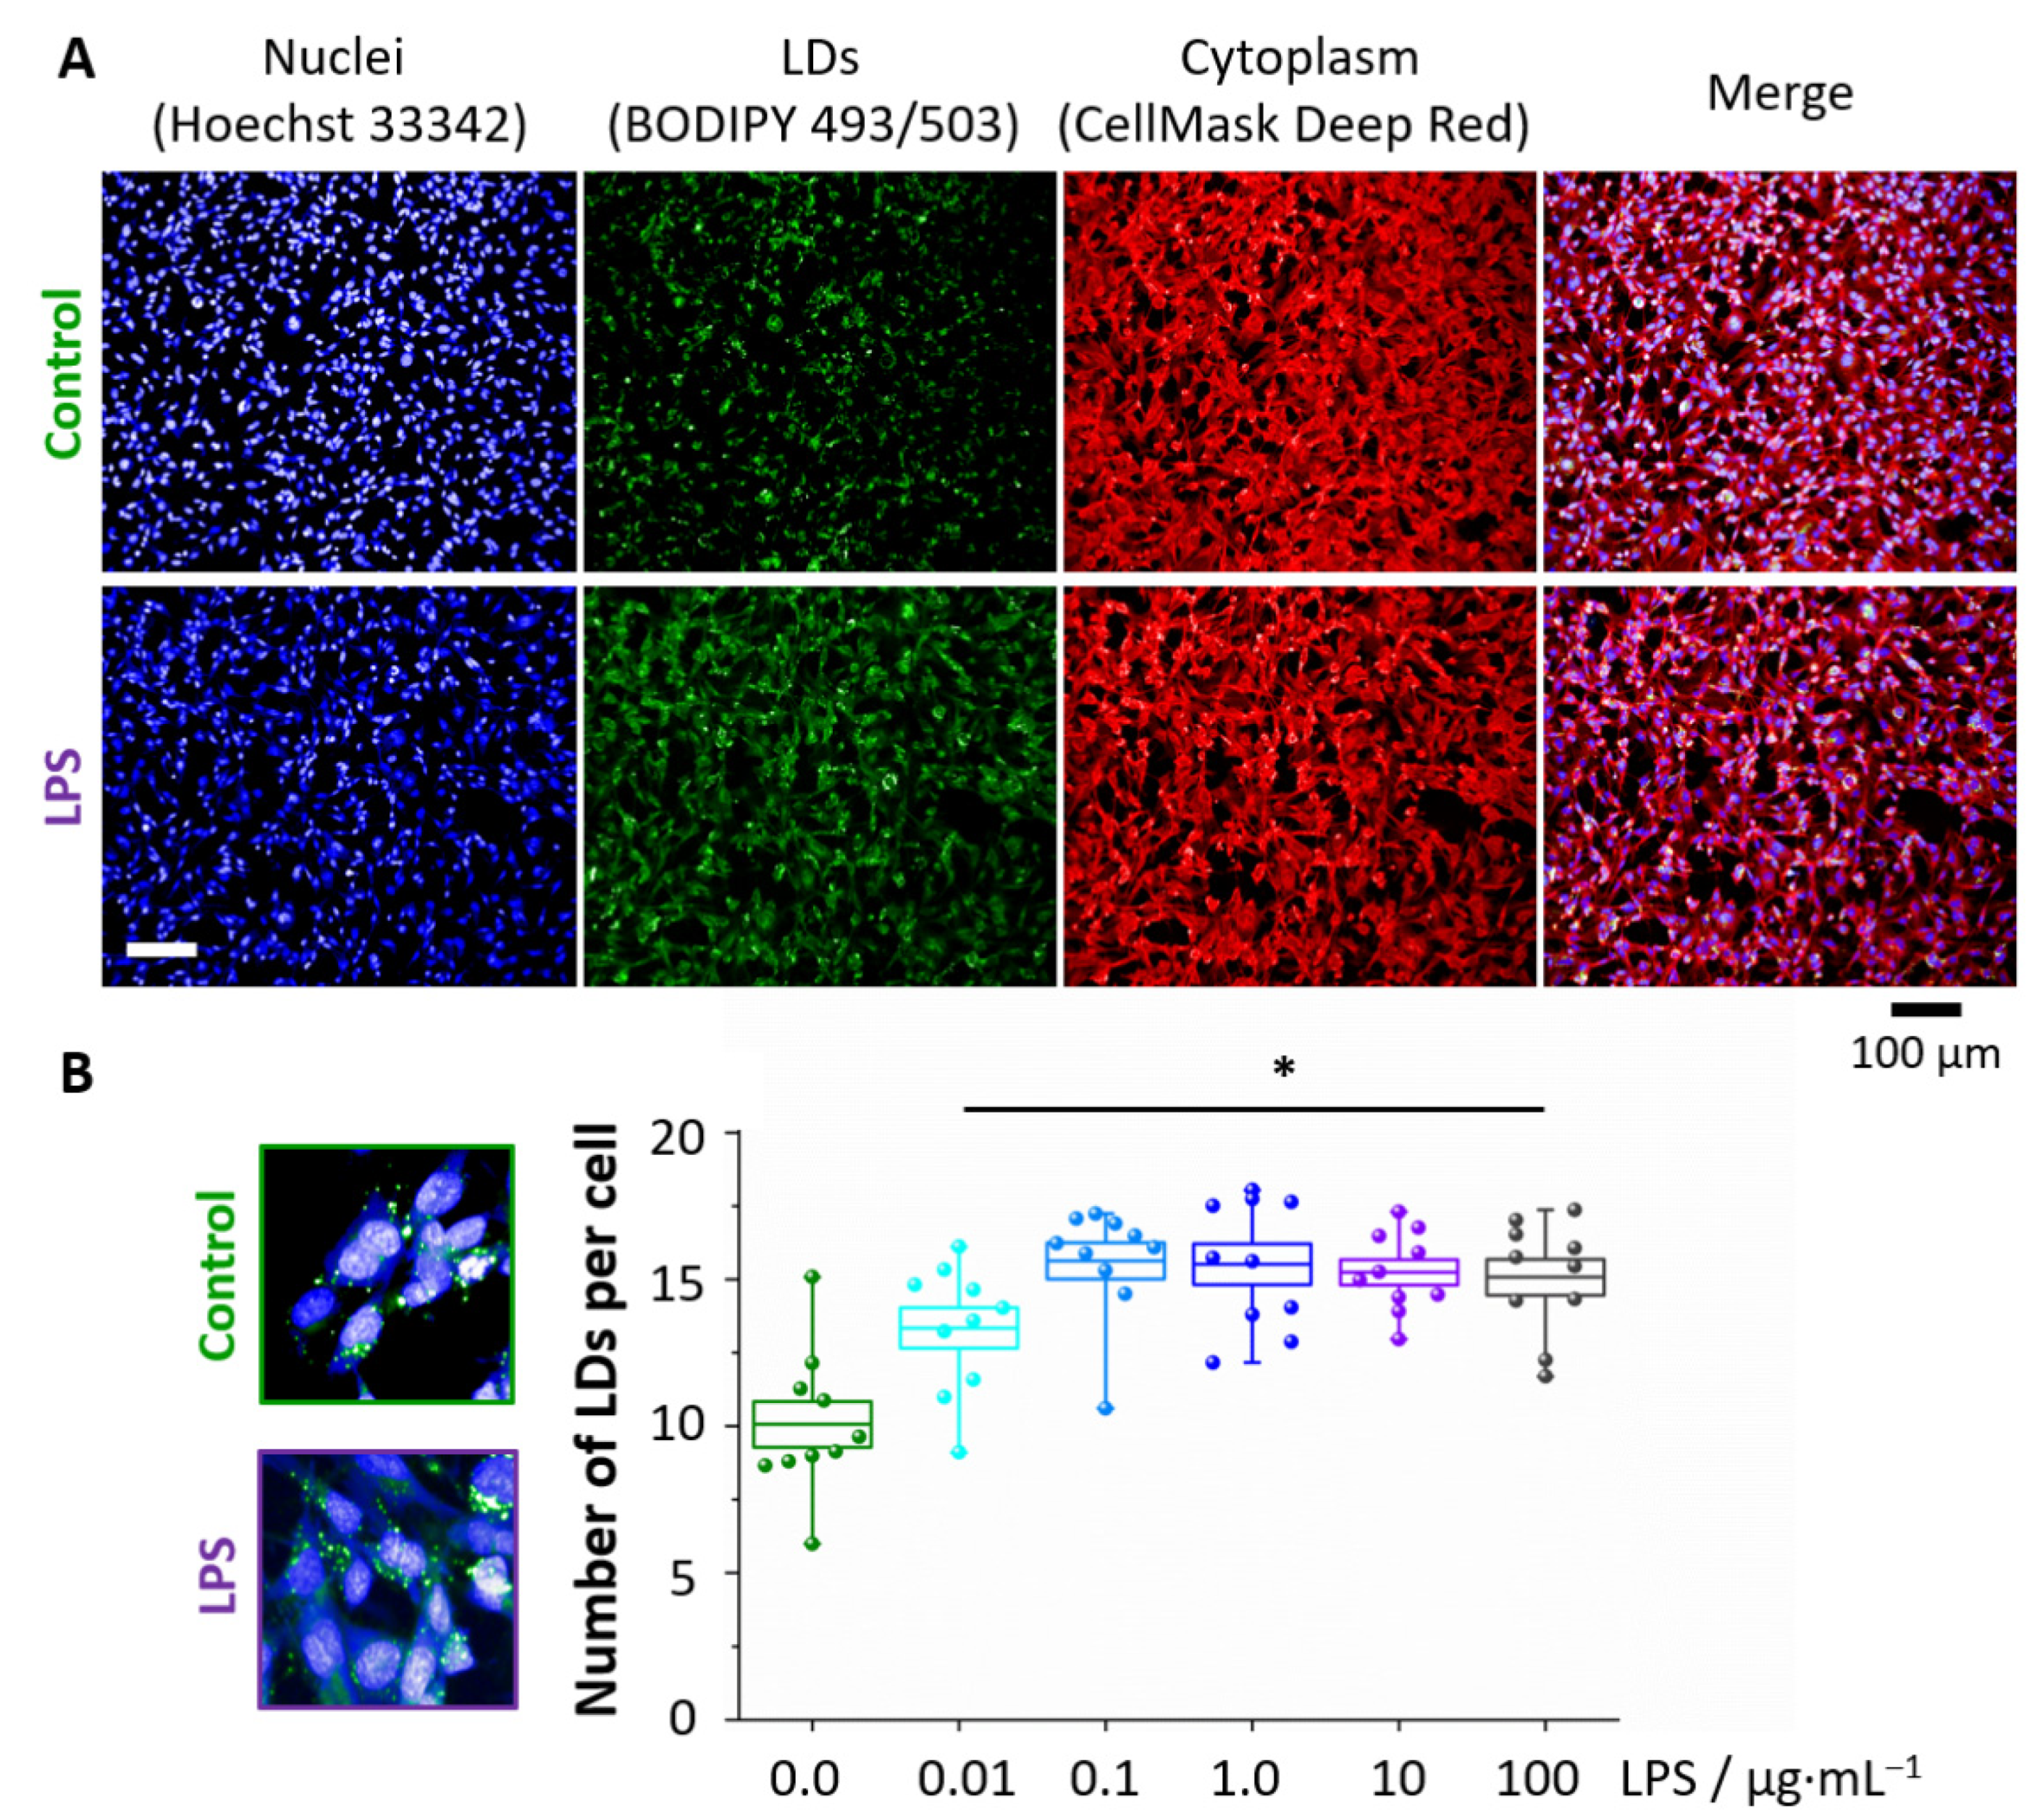
3.1. LPS Induces Formation of Lipid Droplets
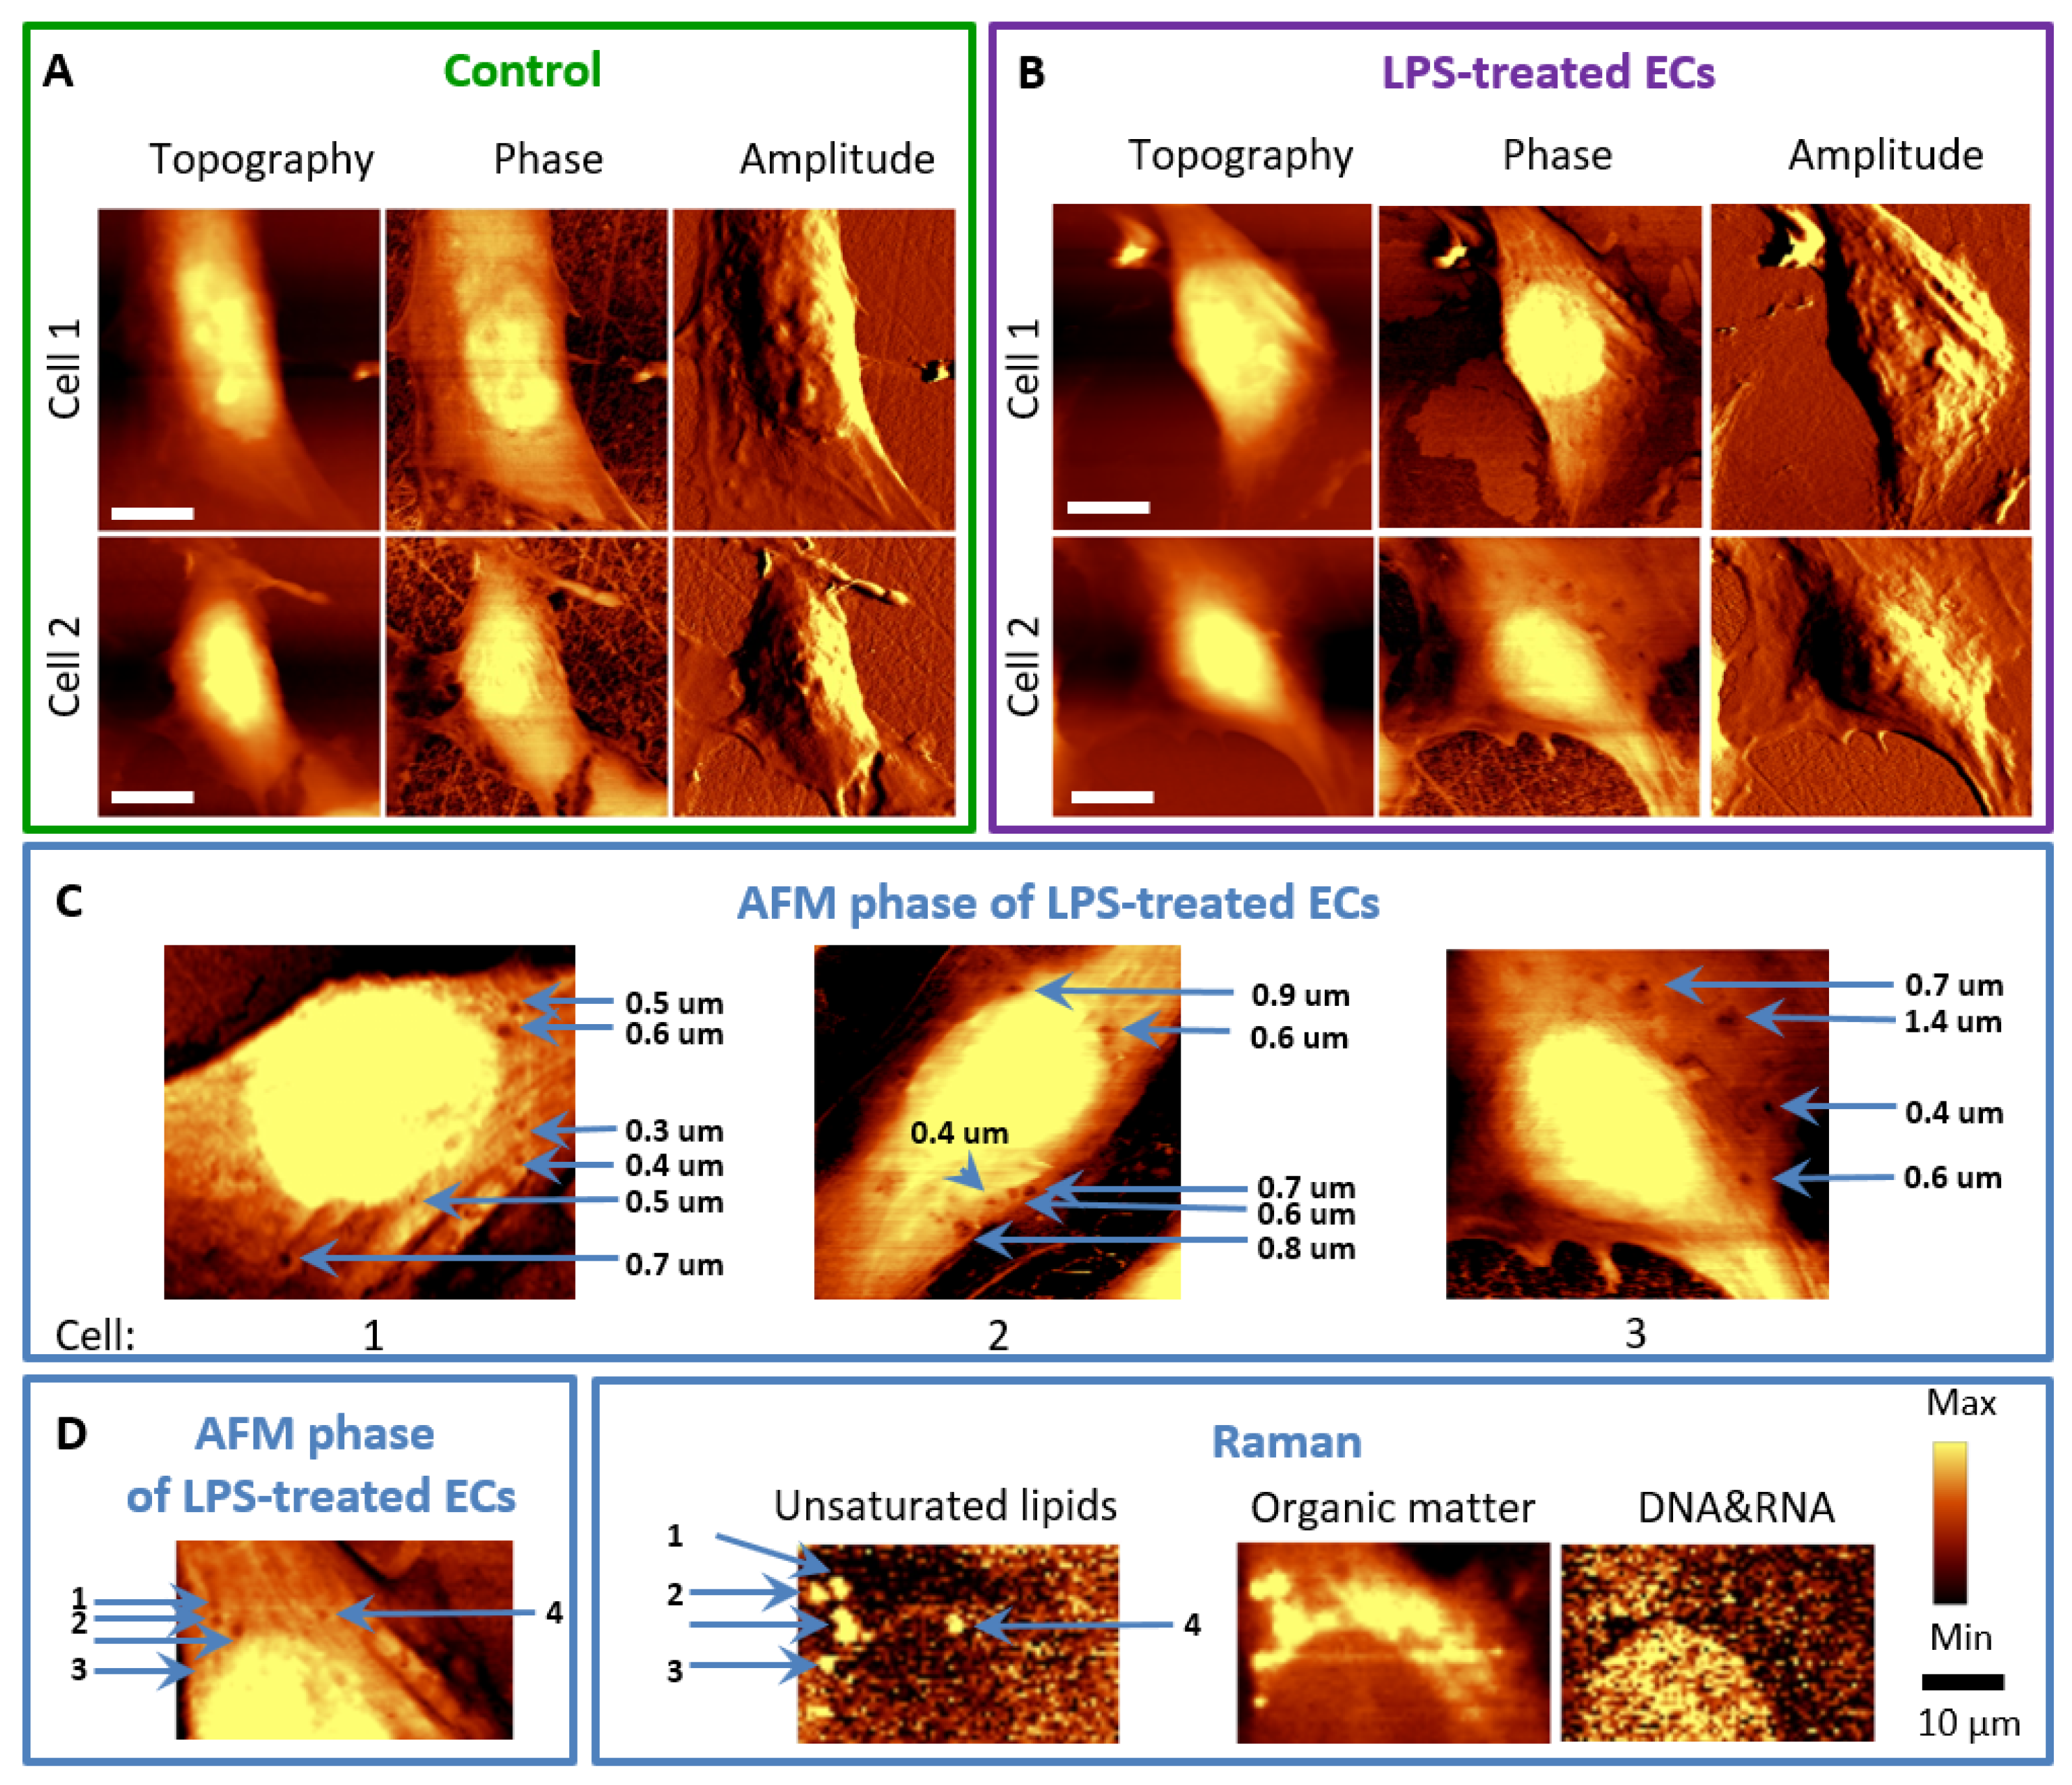
3.2. LPS Induces Changes in the Topography of the HMEC-1 Cell Membrane
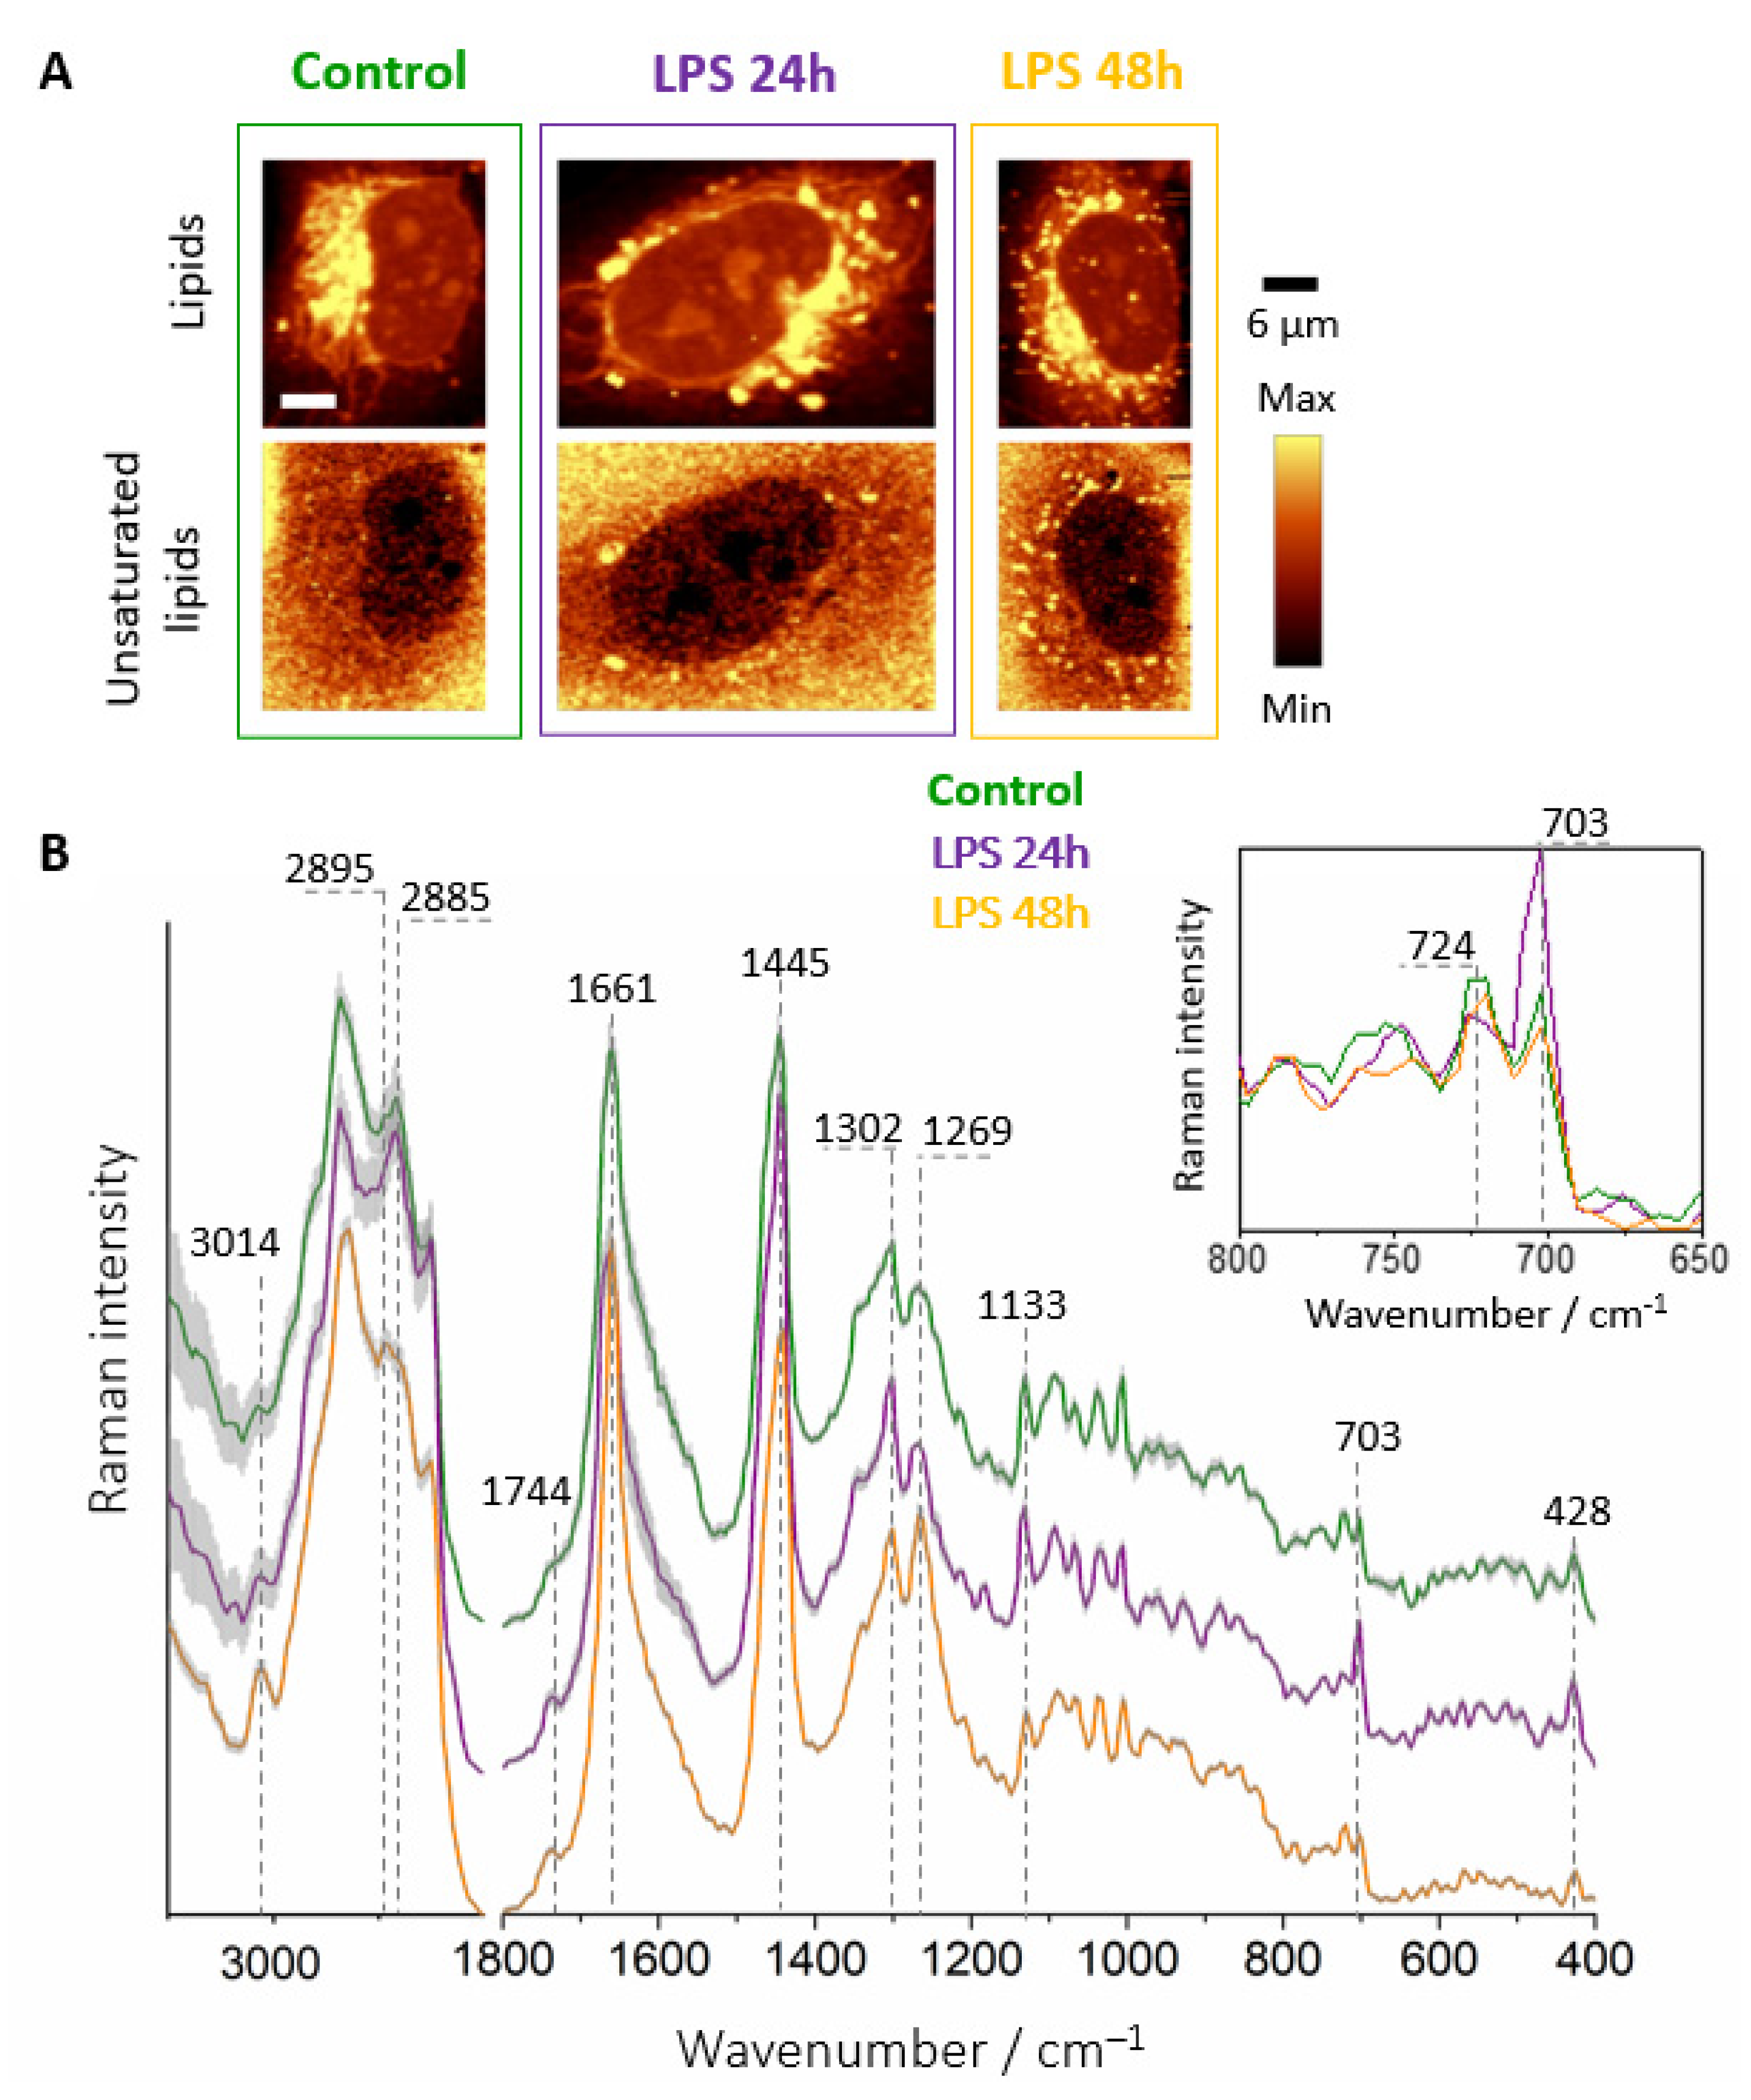
3.3. Chemical Composition of LDs Triggered by LPS Depends on Incubation Time
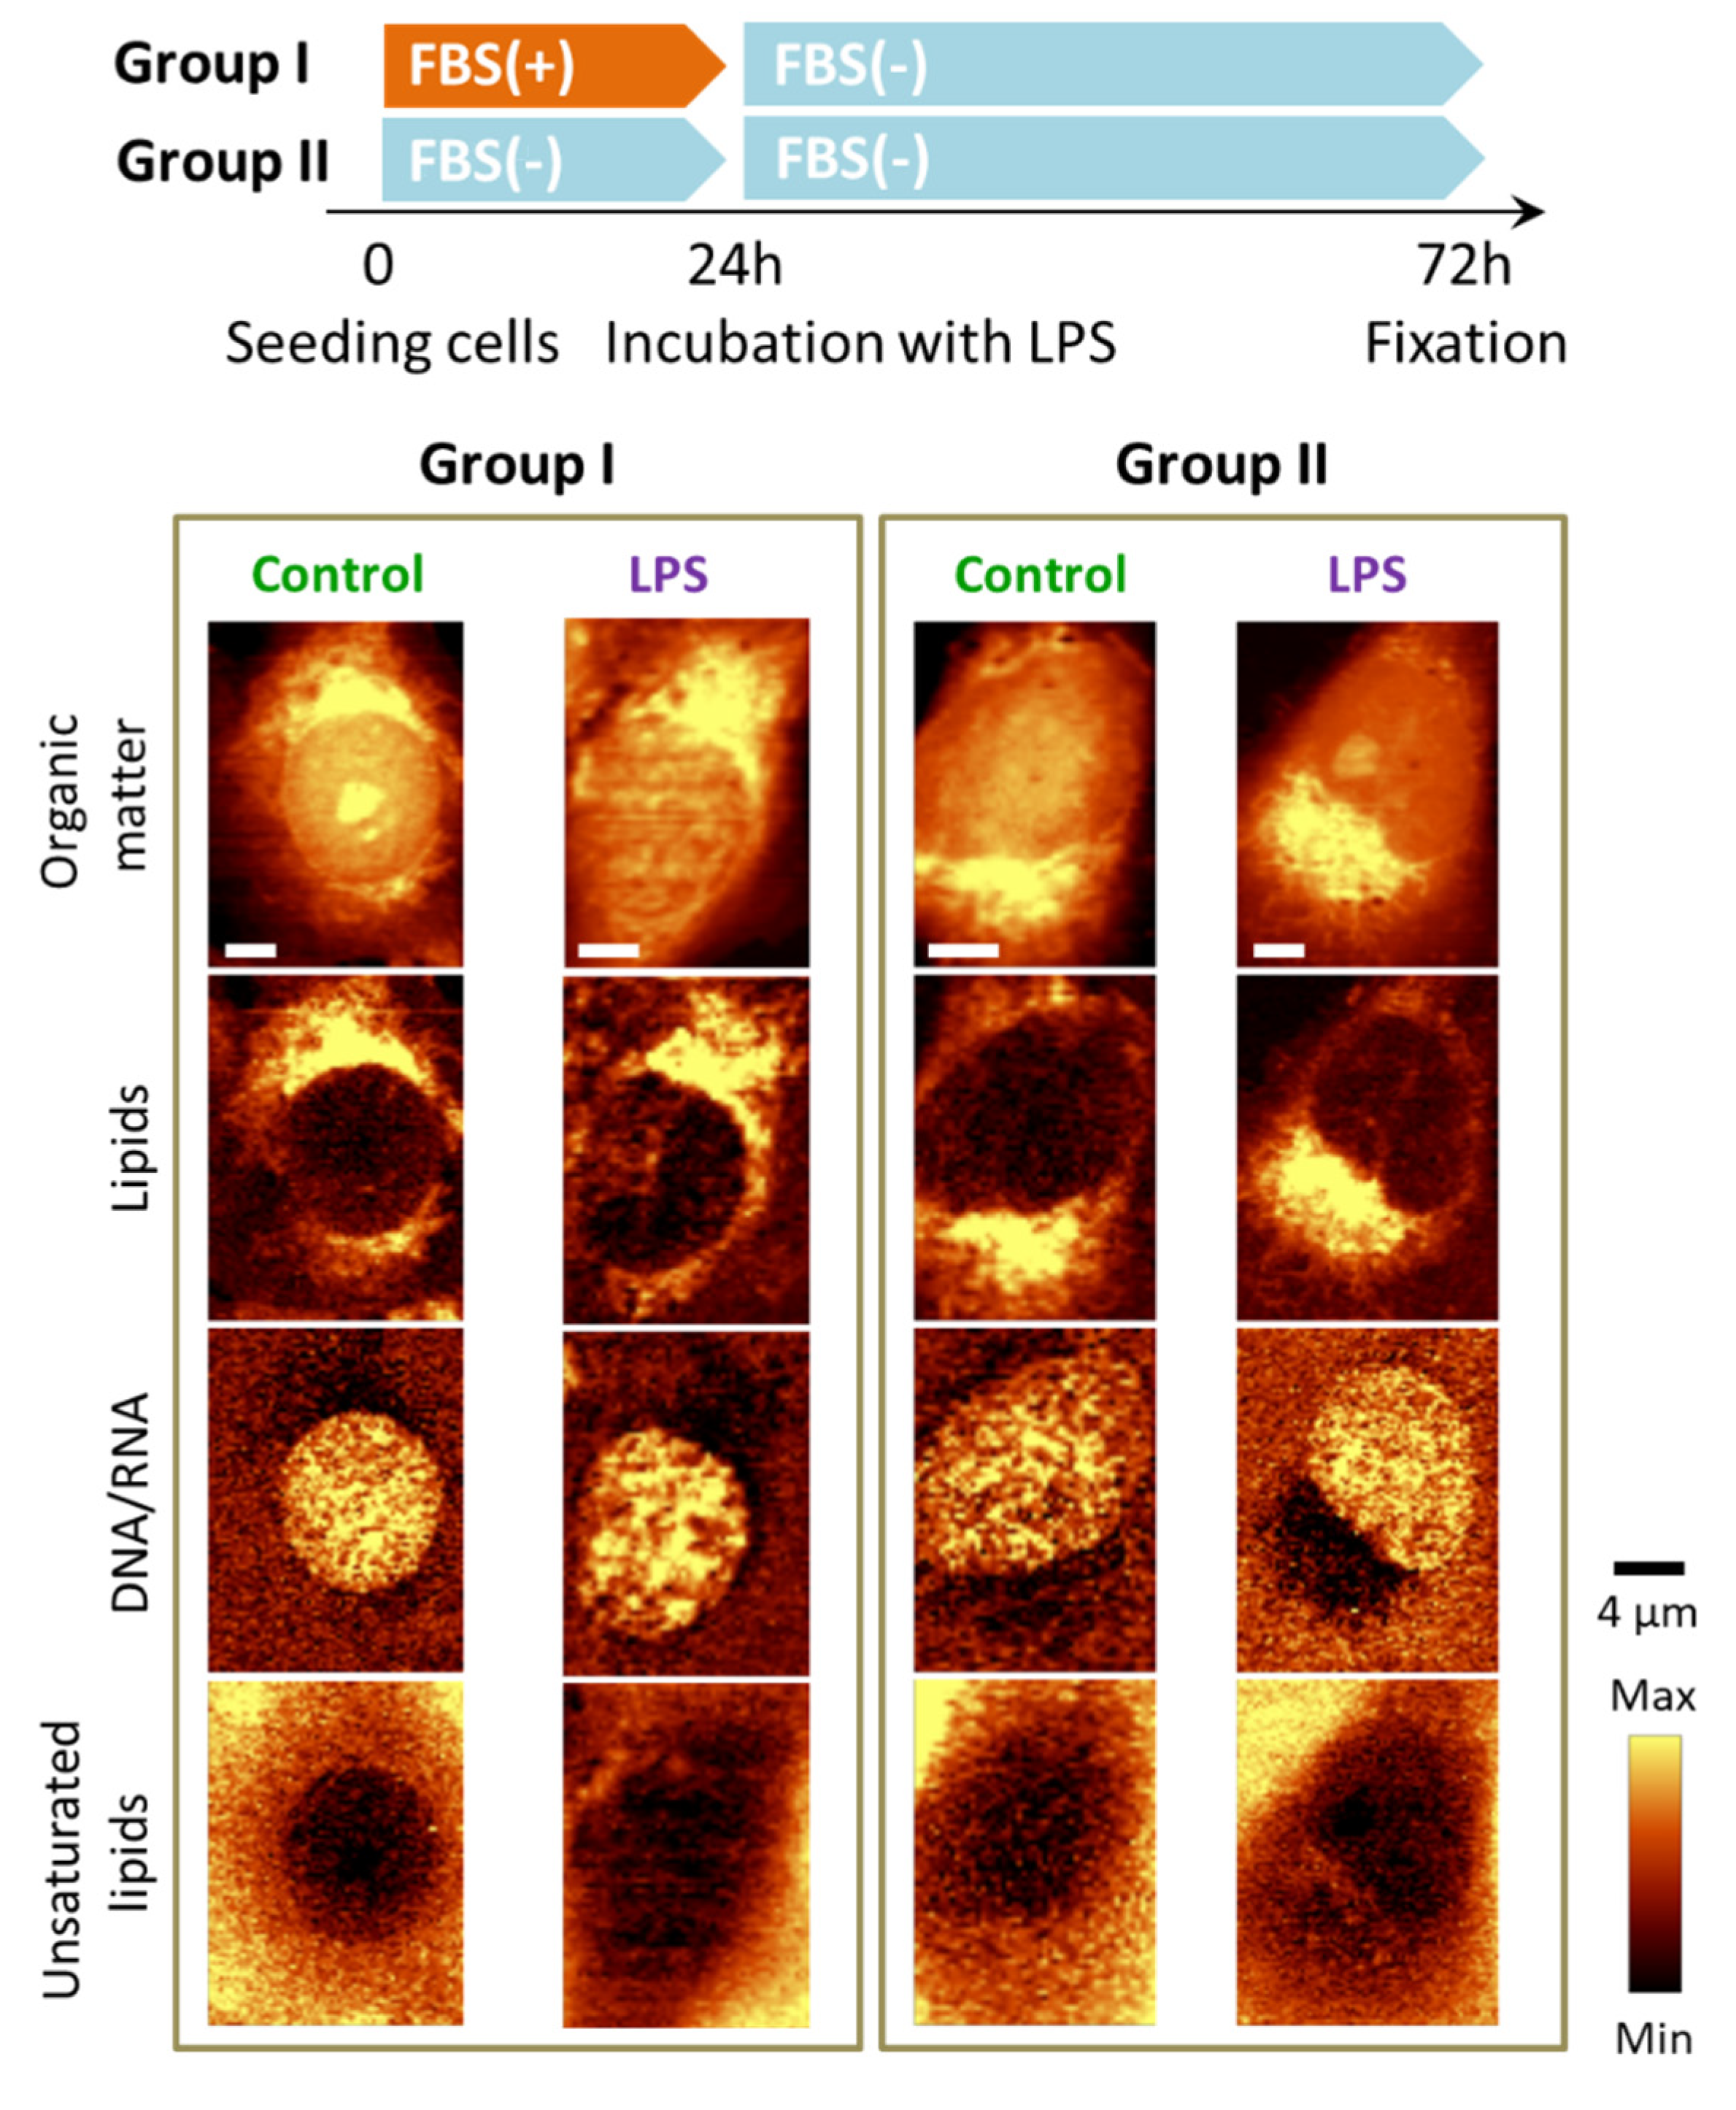
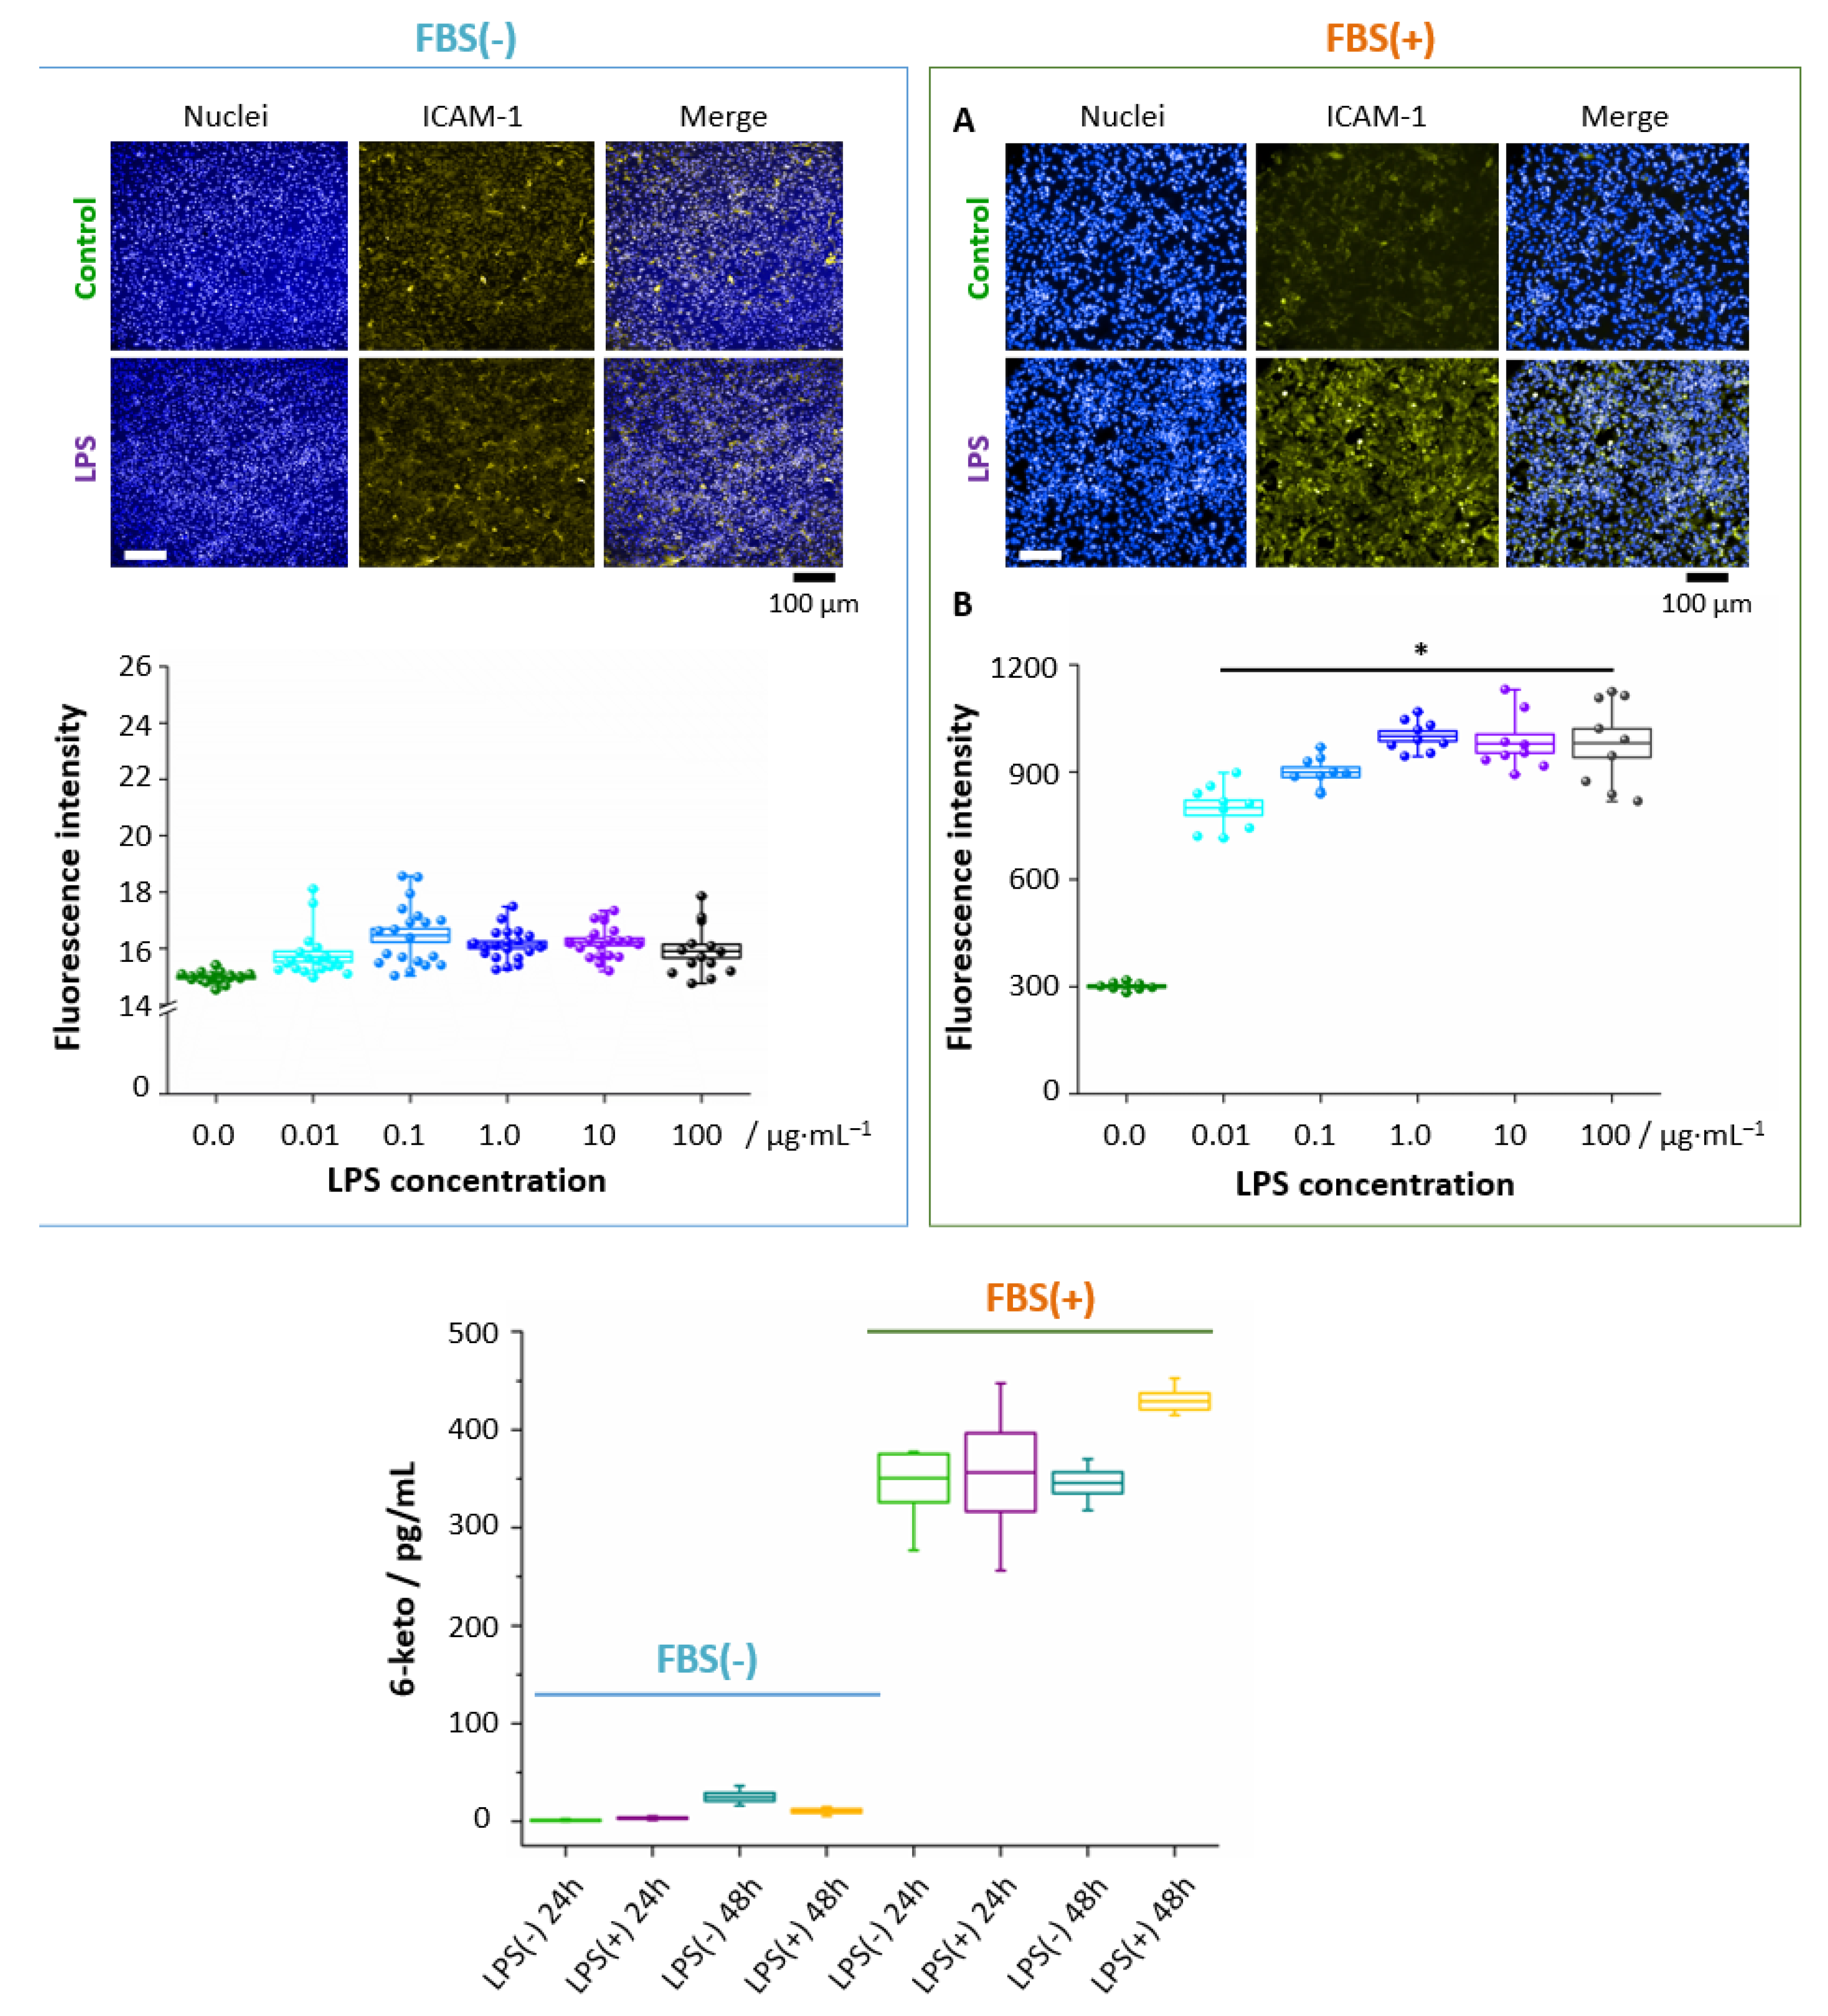
3.4. Absence of FBS Prevents Formation of Lipid Droplets in Response to LPS
4. Discussion
Supplementary Materials
Author Contributions
Funding
Institutional Review Board Statement
Informed Consent Statement
Acknowledgments
Conflicts of Interest
Abbreviations
| 6-keto PGF1α | 6-keto prostaglandin F1α |
| AFM | Atomic Force Microscopy |
| AC | tapping mode in AFM |
| CD14 (sCD14) | (soluble) Cluster of Differentiation 14, serum protein |
| ECs | Endothelial cells |
| EA.hy926 | immortalized hybrids, fusion of HUVEC with human lung carcinoma cell line A549 |
| FBS | Fetal Bovine Serum |
| HCAEC | Human Coronary Artery Endothelial Cells |
| HMEC-1 | Human dermal Microvascular Endothelial Cells transfected with pSVT vector, a pBR-322 based plasmid containing the coding region for Simian virus 40A |
| HPMEC | Human Pulmonary Microvascular Endothelial Cells |
| HUVEC | Human Umbilical Vascular Endothelial Cells |
| ICAM-1 | Intercellular Adhesion Molecule 1 |
| JAM-A | Junctional Adhesion Molecule-A |
| KMCA | k-means Cluster Analysis |
| LDs | Lipid Droplets |
| LPS | Lipopolysaccharides |
| NF-κB | Nuclear Factor Kappa-light-chain-enhancer of Activated B Cells |
| NO | Nitric Oxide |
| PGI2 | Prostacyclin I2 |
| SERS | Surface Enhanced Raman Spectroscopy |
| TLR-4 | Toll-like Receptor 4 |
| TNF-α | Tumor Necrosis Factor alpha |
| TNF-R1 | Tumor Necrosis Factor Receptor 1 |
| VCAM-1 | Vascular Adhesion Molecule 1 |
References
- Cook-Mills, J.M.; Deem, T.L. Active participation of endothelial cells in inflammation. J. Leukoc. Biol. 2004, 77, 487–495. [Google Scholar] [CrossRef] [PubMed]
- Pober, J.S.; Sessa, W.C. Evolving functions of endothelial cells in inflammation. Nat. Rev. Immunol. 2007, 7, 803–815. [Google Scholar] [CrossRef] [PubMed]
- Galanos, C.; Luderitz, O.; Rietschel, E.T.; Westphal, O.; Brade, H.; Brade, L.; Freudenberg, M.; Schade, U.; Imoto, M.; Yoshimura, H.; et al. Synthetic and natural Escherichia coli free lipid A express identical endotoxic activities. Eur. J. Biochem. 1985, 148, 1–5. [Google Scholar] [CrossRef] [PubMed]
- Pugin, J.; Ulevitch, R.J.; Tobias, P.S. A critical role for monocytes and CD14 in endotoxin-induced endothelial cell activation. J. Exp. Med. 1993, 178, 2193–2200. [Google Scholar] [CrossRef] [PubMed]
- Frey, E.A.; Miller, D.S.; Jahr, G.; Sundan, A.; Espevik, I.I.T.; Finlay, S.B.B.; Wright, S.D. Soluble CD14 Participates in the Response of Cells to Lipopolysaccharides. J. Exp. Med. 1992, 176, 1665–1671. [Google Scholar] [CrossRef]
- Wong, F.; Hull, C.; Zhande, R.; Law, J.; Karsan, A. Lipopolysaccharide initiates a TRAF6-mediated endothelial survival signal. Blood 2004, 103, 4520–4526. [Google Scholar] [CrossRef]
- Ricciotti, E.; Fitzgerald, G.A. Prostaglandins and inflammation. Arterioscler. Thromb. Vasc. Biol. 2011, 31, 986–1000. [Google Scholar] [CrossRef] [PubMed]
- Coleman, R.A. The “discovery” of lipid droplets: A brief history of organelles hidden in plain sight. Biochim. Biophys. Acta Mol. Cell Biol. Lipids 2020, 1865, 158762. [Google Scholar] [CrossRef] [PubMed]
- Missaglia, S.; Coleman, R.; Mordente, A.; Tavian, D. Neutral Lipid Storage Diseases as Cellular Model to Study Lipid Droplet Function. Cells 2019, 8, 187. [Google Scholar] [CrossRef]
- Cruz, A.L.S.; Barreto, E.A.; Fazolini, N.P.B.; Viola, J.P.B.; Bozza, P.T. Lipid droplets: Platforms with multiple functions in cancer hallmarks. Cell Death Dis. 2020, 11, 105. [Google Scholar] [CrossRef] [PubMed]
- Czamara, K.; Majzner, K.; Selmi, A.; Baranska, M.; Ozaki, Y.; Kaczor, A. Unsaturated lipid bodies as a hallmark of inflammation studied by Raman 2D and 3D microscopy. Sci. Rep. 2017, 7, 1–10. [Google Scholar] [CrossRef] [PubMed]
- Pacia, M.Z.; Sternak, M.; Mateuszuk, L.; Stojak, M.; Kaczor, A.; Chlopicki, S. Heterogeneity of chemical composition of lipid droplets in endothelial inflammation and apoptosis. Biochim. Biophys. Acta Mol. Cell Res. 2020, 1867, 118681. [Google Scholar] [CrossRef] [PubMed]
- Targosz-korecka, M.; Brzezinka, G.D.; Danilkiewicz, J.; Rajfur, Z. Glutaraldehyde Fixation Preserves the Trend of Elasticity Alterations for Endothelial Cells Exposed to TNF- a. Cytoskeleton 2015, 130, 124–130. [Google Scholar] [CrossRef] [PubMed]
- Lee, S.Y.; Zaske, A.M.; Novellino, T.; Danila, D.; Ferrari, M.; Conyers, J.; Decuzzi, P. Probing the mechanical properties of TNF-α stimulated endothelial cell with atomic force microscopy. Int. J. Nanomed. 2011, 6, 179–195. [Google Scholar] [CrossRef] [PubMed]
- Kang, I.; Panneerselvam, D.; Panoskaltsis, V.P.; Eppell, S.J.; Marchant, R.E.; Doerschuk, C.M. Changes in the hyperelastic properties of endothelial cells induced by tumor necrosis factor-α. Biophys. J. 2008, 94, 3273–3285. [Google Scholar] [CrossRef] [PubMed]
- Stroka, K.M.; Vaitkus, J.A.; Aranda-Espinoza, H. Endothelial cells undergo morphological, biomechanical, and dynamic changes in response to tumor necrosis factor-α. Eur. Biophys. J. 2012, 41, 939–947. [Google Scholar] [CrossRef]
- Szymonski, M.; Targosz-Korecka, M.; Malek-Zietek, K.E. Nano-mechanical model of endothelial dysfunction for AFM-based diagnostics at the cellular level. Pharmacol. Rep. 2015, 67, 728–735. [Google Scholar] [CrossRef] [PubMed]
- Szczygiel, A.M.; Brzezinka, G.; Targosz-Korecka, M.; Chlopicki, S.; Szymonski, M. Elasticity changes anti-correlate with NO production for human endothelial cells stimulated with TNF-α. Pflugers Arch. 2012, 463, 487–496. [Google Scholar] [CrossRef]
- Franz, J.; Brinkmann, B.F.; König, M.; Huve, J.; Stock, C.; Ebnet, K.; Riethmuller, C. Nanoscale imaging reveals a tetraspanin-CD9 coordinated elevation of endothelial ICAM-1 clusters. PLoS ONE 2016, 11, 1–20. [Google Scholar] [CrossRef]
- Ades, E.W.; Candal, F.J.; Swerlick, R.A.; George, V.G.; Summers, S.; Bosse, D.C.; Lawley, T.J. HMEC-1: Establishment on an Immortalized Human Microvascular Endothelial Cell Line. J. Investig. Demratol. 1992, 99, 683–690. [Google Scholar] [CrossRef]
- Czamara, K.; Majzner, K.; Pacia, M.Z.; Kochan, K.; Kaczor, A.; Baranska, M. Raman spectroscopy of lipids: A review. J. Raman Spectrosc. 2015, 46, 4–20. [Google Scholar] [CrossRef]
- Albuschies, J.; Vogel, V. The role of filopodia in the recognition of nanotopographies. Sci. Rep. 2013, 3, 1–9. [Google Scholar] [CrossRef] [PubMed]
- Wojciak-Stothard, B.; Ridley, A.J. Rho GTPases and the regulation of endothelial permeability. Vascul. Pharmacol. 2002, 39, 187–199. [Google Scholar] [CrossRef]
- Riethmüller, C.; Schäffer, T.E.; Kienberger, F.; Stracke, W.; Oberleithner, H. Vacuolar structures can be identified by AFM elasticity mapping. Ultramicroscopy 2007, 107, 895–901. [Google Scholar] [CrossRef] [PubMed]
- Kaur, J.; Kubes, P. A Critical Detector of Lipopolysaccharide. In Endothelial Biomedicine; Aird, W.C., Ed.; Cambridge University Press: Cambridge, UK, 2007; pp. 410–418. [Google Scholar]
- Nooteboom, A.; Van der Linden, G.J.; Hendriks, T. Tumor necrosis factor-α and interleukin-1β mediate endothelial permeability induced by lipopolysaccharide-stimulated whole blood. Crit. Care Med. 2002, 30, 2063–2068. [Google Scholar] [CrossRef]
- Goldblum, S.E.; Ding, X.; Brann, T.W.; Campbell-Washington, J. Bacterial lipopolysaccharide induces actin reorganization, intercellular gap formation, and endothelial barrier dysfunction in pulmonary vascular endothelial cells: Concurrent F-actin depolymerization and new actin synthesis. J. Cell. Physiol. 1993, 157, 13–23. [Google Scholar] [CrossRef] [PubMed]
- Bannerman, D.D.; Fitzpatrick, M.J.; Anderson, D.Y.; Bhattacharjee, A.K.; Novitsky, T.J.; Hasday, J.D.; Cross, A.S.; Goldblum, S.E. Endotoxin-Neutralizing Protein Protects against Endotoxin-Induced Endothelial Barrier Dysfunction. Infect. Immun. 1998, 66, 1400–1407. [Google Scholar] [CrossRef]
- Czamara, K.; Petko, F.; Baranska, M.; Kaczor, A. Raman microscopy at the subcellular level: A study on early apoptosis in endothelial cells induced by Fas ligand and cycloheximide. Analyst 2016, 1390–1397. [Google Scholar] [CrossRef] [PubMed]
- Wright, S.D.; Ramos, R.A.; Tobias, P.S.; Ulevitch, R.J.; Mathison, J.C. CD14, a Receptor for Complexes of Lipopolysaccharide (LPS) and LPS Binding Protein. Science 1990, 249, 1431–1433. [Google Scholar] [CrossRef] [PubMed]
- Jersmann, H.P.A.; Hii, C.S.T.; Hodge, G.L.; Ferrante, A. Synthesis and surface expression of CD14 by human endothelial cells. Infect. Immun. 2001, 69, 479–485. [Google Scholar] [CrossRef] [PubMed]
- Zheng, X.; Zhang, W.; Hu, X. Different concentrations of lipopolysaccharide regulate barrier function through the PI3K/Akt signalling pathway in human pulmonary microvascular endothelial cells. Sci. Rep. 2018, 8, 1–11. [Google Scholar] [CrossRef] [PubMed]
- Lawson, C.; Wolf, S. ICAM-1 signaling in endothelial cells. Pharmacol. Rep. 2009, 61, 22–32. [Google Scholar] [CrossRef]
- Hoesel, L.M.; Ward, P.A. The Role of the Endothelium in Systemic Inflammatory Response Syndrome and Sepsis. In Endothelial Biomedicine; Aird, W.C., Ed.; Cambridge University Press: London, UK, 2007; pp. 1294–1303. [Google Scholar]
- McDonald, D.M.; Thurston, G.; Baluk, P. Endothelial gaps as sites for plasma leakage in inflammation. Microcirculation 1999, 6, 7–22. [Google Scholar] [CrossRef] [PubMed]


Publisher’s Note: MDPI stays neutral with regard to jurisdictional claims in published maps and institutional affiliations. |
© 2021 by the authors. Licensee MDPI, Basel, Switzerland. This article is an open access article distributed under the terms and conditions of the Creative Commons Attribution (CC BY) license (https://creativecommons.org/licenses/by/4.0/).
Share and Cite
Czamara, K.; Stojak, M.; Pacia, M.Z.; Zieba, A.; Baranska, M.; Chlopicki, S.; Kaczor, A. Lipid Droplets Formation Represents an Integral Component of Endothelial Inflammation Induced by LPS. Cells 2021, 10, 1403. https://doi.org/10.3390/cells10061403
Czamara K, Stojak M, Pacia MZ, Zieba A, Baranska M, Chlopicki S, Kaczor A. Lipid Droplets Formation Represents an Integral Component of Endothelial Inflammation Induced by LPS. Cells. 2021; 10(6):1403. https://doi.org/10.3390/cells10061403
Chicago/Turabian StyleCzamara, Krzysztof, Marta Stojak, Marta Z. Pacia, Alicja Zieba, Malgorzata Baranska, Stefan Chlopicki, and Agnieszka Kaczor. 2021. "Lipid Droplets Formation Represents an Integral Component of Endothelial Inflammation Induced by LPS" Cells 10, no. 6: 1403. https://doi.org/10.3390/cells10061403
APA StyleCzamara, K., Stojak, M., Pacia, M. Z., Zieba, A., Baranska, M., Chlopicki, S., & Kaczor, A. (2021). Lipid Droplets Formation Represents an Integral Component of Endothelial Inflammation Induced by LPS. Cells, 10(6), 1403. https://doi.org/10.3390/cells10061403