Article

Modeling Retinal Ganglion Cell Dysfunction in Optic Neuropathies

Bascom Palmer Eye Institute, University of Miami Miller School of Medicine, Miami, FL 33136, USA
*
Author to whom correspondence should be addressed.
Cells 2021, 10(6), 1398; https://doi.org/10.3390/cells10061398
Submission received: 19 April 2021 / Revised: 24 May 2021 / Accepted: 3 June 2021 / Published: 5 June 2021

Abstract

:
As in glaucoma and other optic neuropathies cellular dysfunction often precedes cell death, the assessment of retinal ganglion cell (RGC) function represents a key outcome measure for neuroprotective strategies aimed at targeting distressed but still viable cells. RGC dysfunction can be assessed with the pattern electroretinogram (PERG), a sensitive measure of electrical activity of RGCs that is recorded non-invasively in human subjects and mouse models. Here, we offer a conceptual framework based on an intuitive state-transition model used for disease management in patients to identify progressive, potentially reversible stages of RGC dysfunction leading to cell death in mouse models of glaucoma and other optic neuropathies. We provide mathematical equations to describe state-transitions with a set of modifiable parameters that alter the time course and severity of state-transitions, which can be used for hypothesis testing and fitting experimental PERG data. PERG dynamics as a function of physiological stimuli are also used to differentiate phenotypic and altered RGC response dynamics, to assess susceptibility to stressors and to assess reversible dysfunction upon pharmacological treatment.

1. Introduction

Neuroprotection in glaucoma and other optic neuropathies is an area of intense investigation in preclinical models [1,2,3,4,5,6,7,8]. Neuroprotective strategies include a large variety of methods (dietary, exercise, environment, pharmacological, molecular, radiation, stem cells, gene therapy) that target specific aspects of neuronal biology or nonspecifically target conditions such as elevated IOP, inflammation, or immune system malfunction that may eventually cause neuronal damage. It is becoming increasing clear that, in glaucoma and other optic neuropathies, cellular and axonal dysfunction often precede cell death [9,10,11,12,13]. This helps in focusing neuroprotective strategies in a time window of opportunity at which distressed but still viable cells can be rescued from irreversible stages of neurodegeneration and perhaps restored to their normal function [14].
Thus, sensitive assessment of retinal ganglion cell (RGC) function in preclinical models and investigation of the effects of stressors and neuroprotectants can provide a powerful tool for the early detection of neuronal dysfunction, as well as the prediction of disease progression with or without treatment. Here, we offer a conceptual framework to model progressive RGC dysfunction in glaucoma and other optic neuropathies based on non-invasive, high-throughput electrophysiological methods suitable for neuroprotection studies.

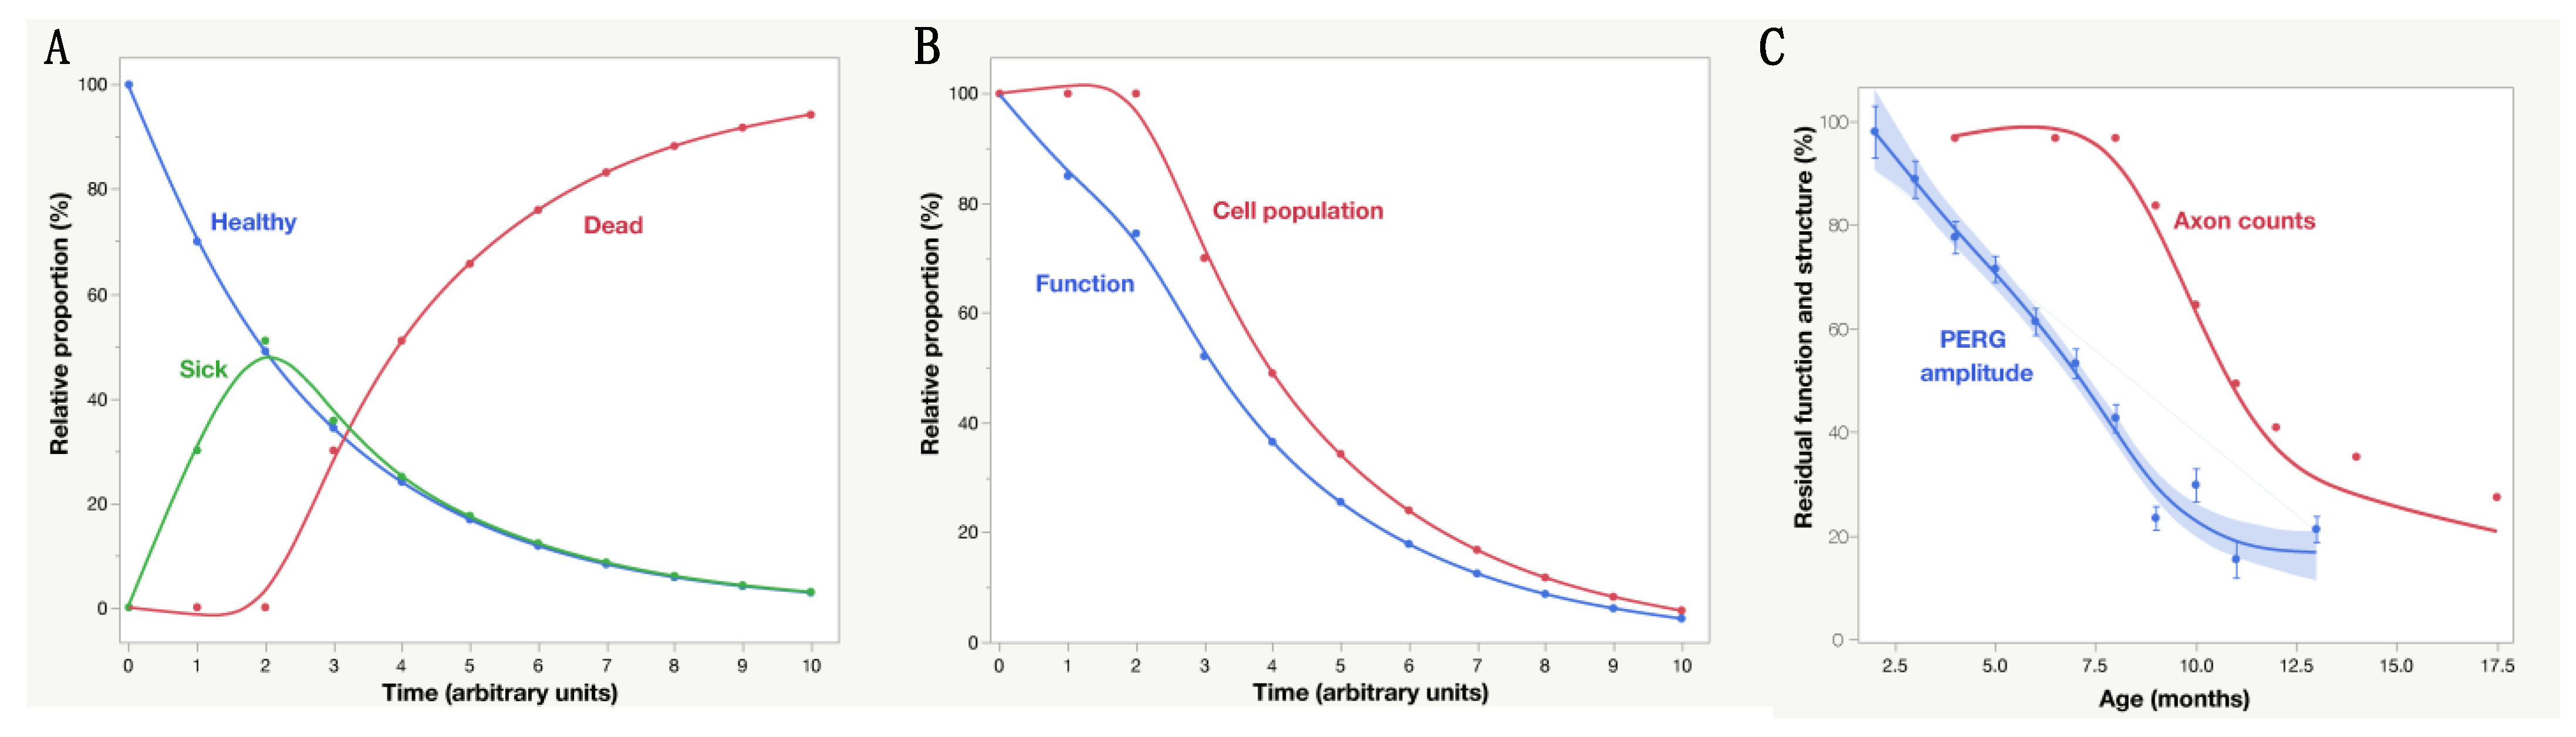
2. To Be or Not to Be, This Is the Question

Progressive RGC dysfunction and death can be thought to undergo six stages that can be defined in lay terms (Table 1) from stage 0 (healthy) to stage 6 (effaced). The stages of cell damage are based on an intuitive state-transition model such as the Markov decision process used for disease management in patients [15] that also includes stages of dying and effaced RGCs that are detectable with retinal imaging and are relevant to neuroprotection. Each stage is potentially identifiable in vivo with non-invasive electrophysiology and/or non-invasive imaging, which probe different aspects of RGC population. For a first approximation, a reduced electrical signal represents the activity of surviving neurons, while OCT thinning represents lost neurons. The ideal time window of opportunity for early detection, prediction of progression, and effective neuroprotection appears to be at stages 1–2 (functional tipping point) and at stage 3 (very sick). RGC dysfunction at stages 1–3 is unlikely to be detected with imaging. Stage 4 is identifiable with real-time imaging of apoptosing RGCs [16,17], and stages 4–5 are identifiable with OCT imaging, such as the loss of inner retina thickness. At stages 4–6, electrophysiology is expected to be at floor level and is no longer useful to monitor disease progression. Note that RGCs at different stages may coexist in the same population. Non-invasive electrophysiology represents the integrated response of the cell population subtended by the visual stimulus.

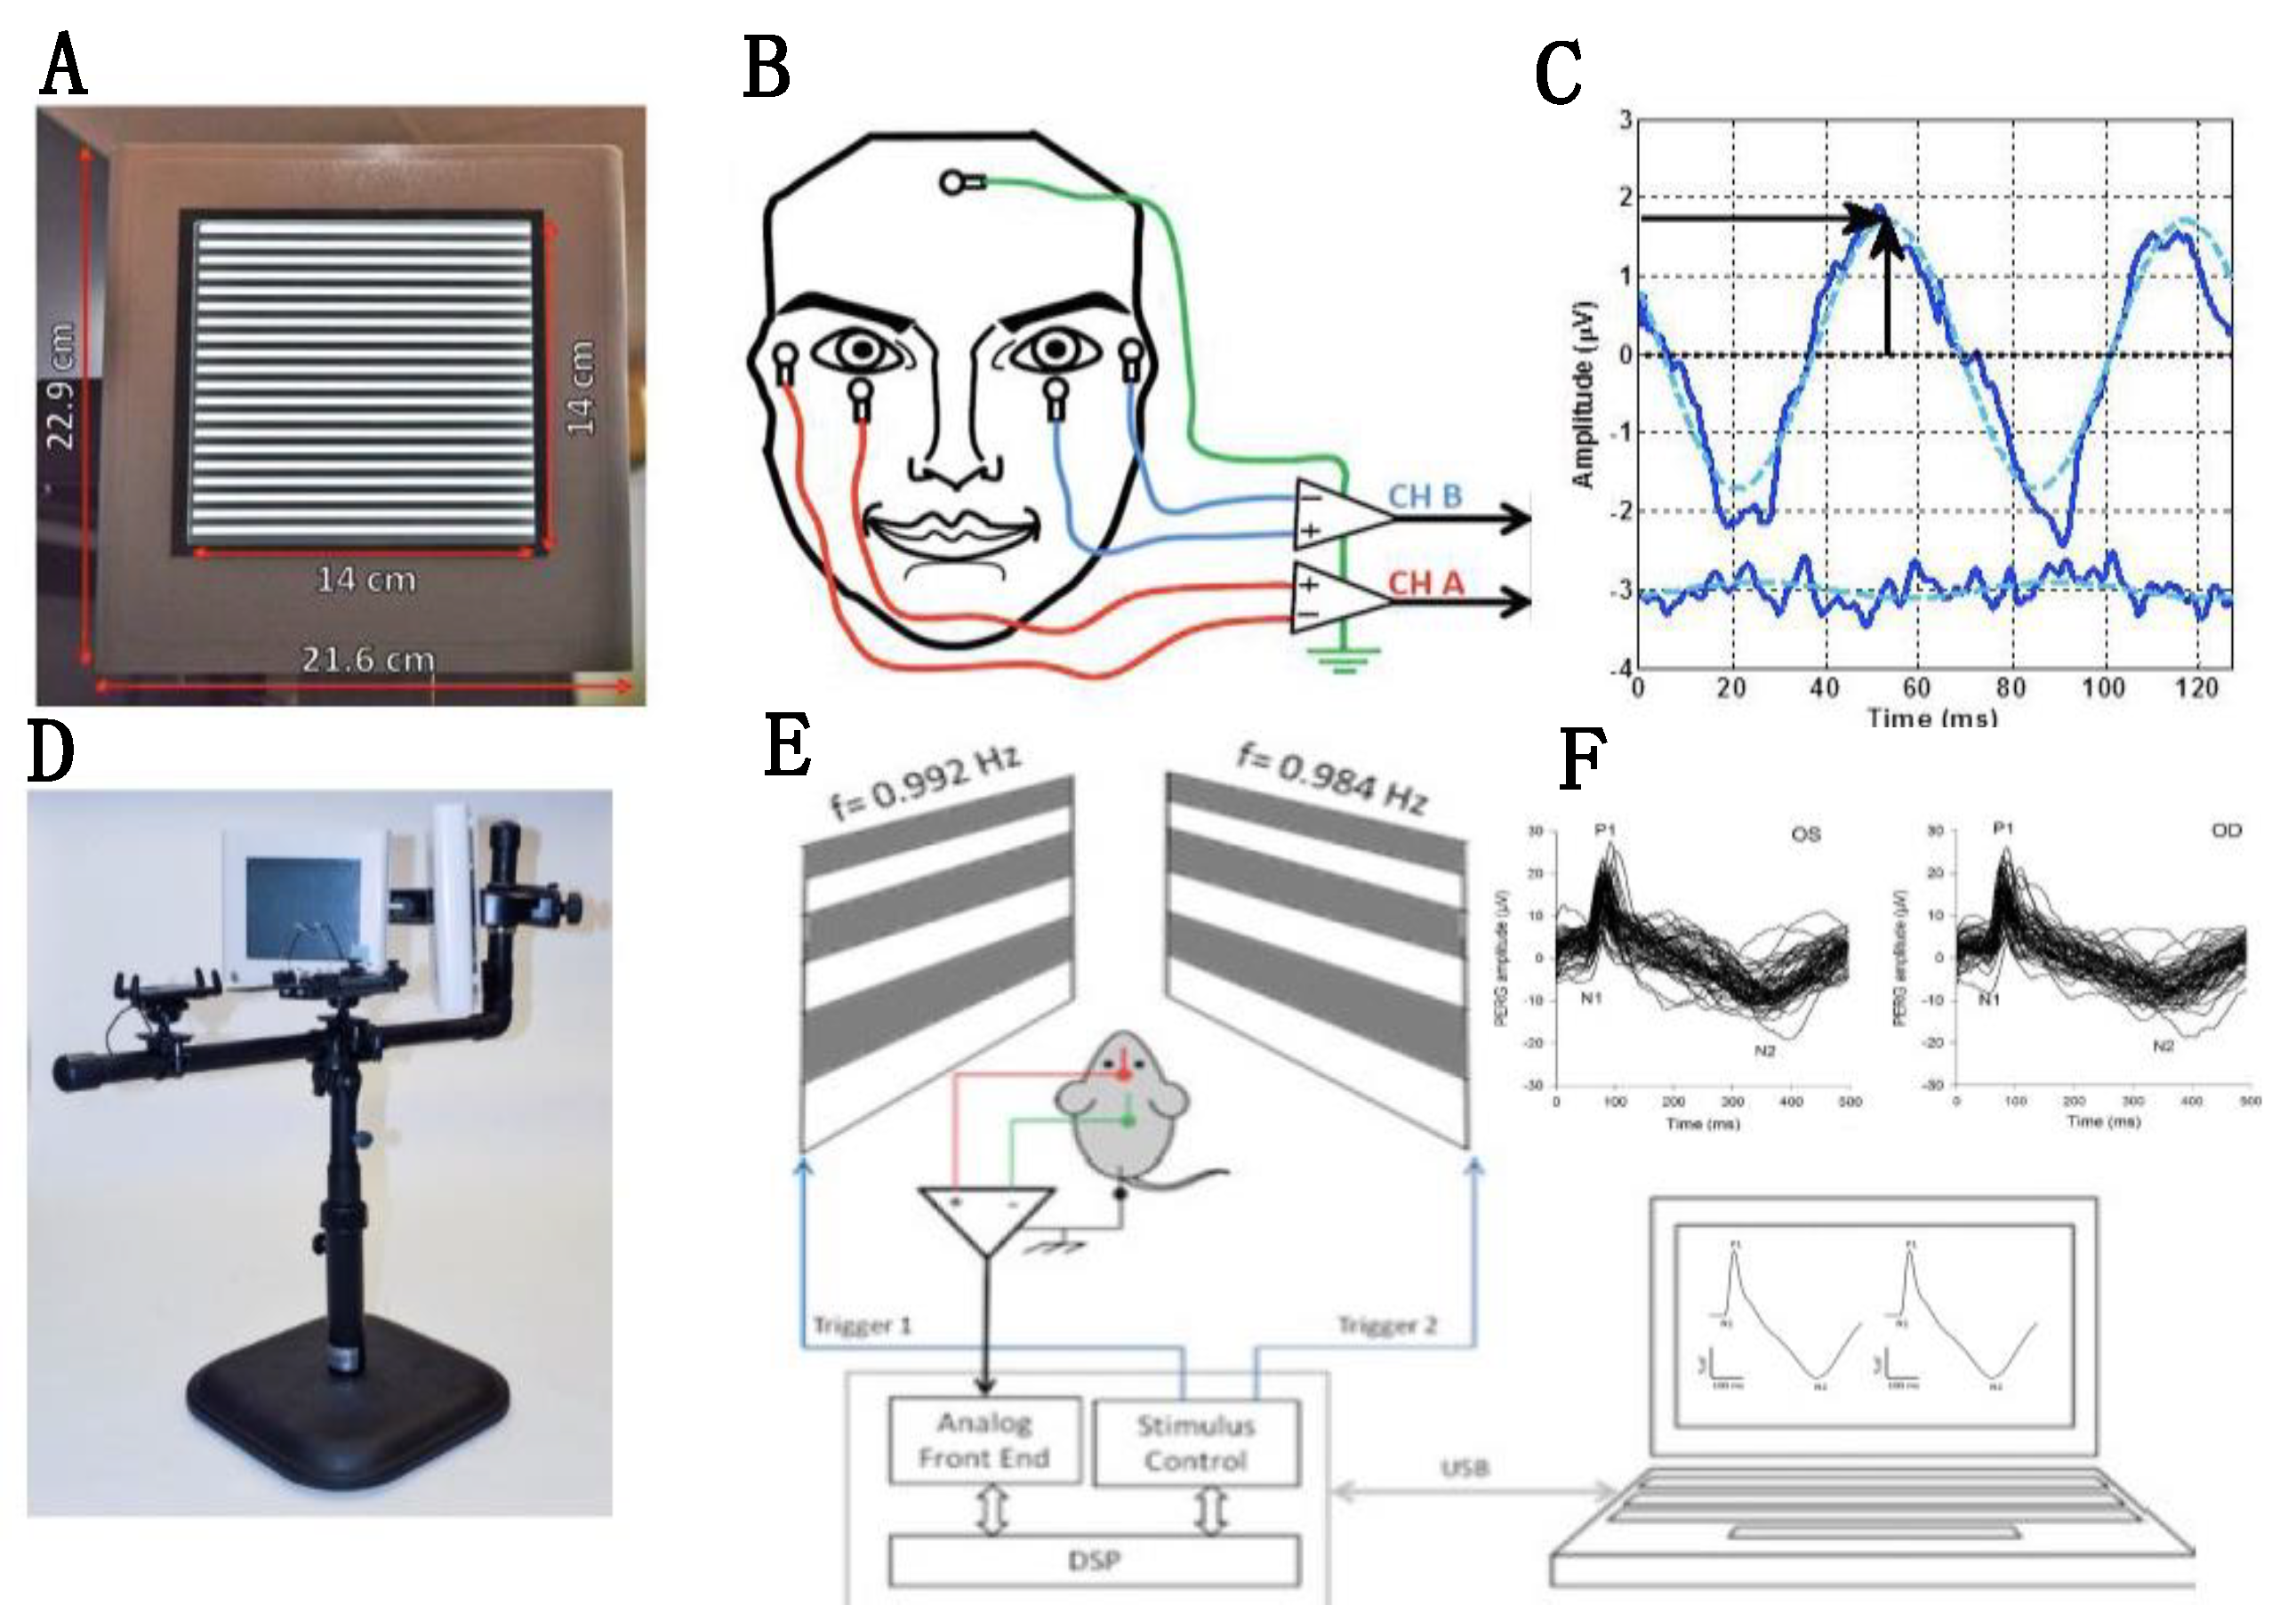
2.1. Non-Invasive Assessment of RGC Function

Visual function can be assessed with several methods [18] that depend on the activity of both retinal and post retinal pathways such as visually evoked potentials (VEP), reflex-based optomotor response (OMR) and operant training. Here, we focus on the pattern electroretinogram (PERG), which assesses RGC function directly. While there are other RGC-sensitive ERG methods, the PERG is the best understood and most sensitive technique which specifically depends on the presence of functional RGCs [19]. The PERG amplitude is proportional to the number of RGCs at a given retinal location, and the spectrum of spatial frequencies at which a PERG response can be generated corresponds to the size to RGC receptive field centers [20,21,22]. The PERG spatial resolution for gratings (acuity) and contract threshold correspond to corresponding behavioral measurements [23]. Crucially, the PERG is rapidly abolished after optic nerve crush and is altered early in glaucoma, before histological RGC loss [19]. Importantly for neuroprotection studies, the PERG signal has a signal-to-noise ratio of about 1 Log unit, which allows meaningful assessment of changes over time and treatment over the entire disease scale. The assessment of PERG changes is simplified by recent developments of PERG technology that allow simultaneous assessment of responses with high signal-to-noise ratio from each eye in mice using a single subcutaneous needle in the snout [24]. This eliminates the necessity of corneal electrodes that may damage the cornea, deteriorate eye optics and alter eye pressure, and also facilitates experiments based on comparison between the responses of the two eyes. An example of the recording set up used for human and mouse PERG, and an example of a corresponding PERG waveforms are shown in Figure 1.

2.2. Physiological Significance of Altered PERG Signal

The PERG has been extensively used in preclinical and clinical studies of glaucoma and optic neuropathies to detect RGC dysfunction in cross-sectional and longitudinal studies. Losses of PERG signal have been shown to be reversible after IOP-lowering treatment [25,26]. While these are important applications, they do not provide information on the nature of PERG changes. For example, a reduced PERG signal may be the result of the missing contribution of lost RGCs and dying RGCs, reduced contribution of dysfunctional RGCs, and the normal contribution of healthy RGCs in unknown relative proportions. An observable example of this originates from in vivo, real-time imaging of human and rodent glaucomatous retinas labeled with the fluorescent biomarker annexin 5, which identifies a subpopulation of apoptosing RGCs coexisting with apparently normal RGCs [27]. Figure 2A summarizes a simple model of progressive glaucoma in which, between time zero and time 1, a proportion of RGCs (30%) becomes sick, function at 50% of normal capacity and survive for a limited amount of time. At time 2, sick RGCs start dying while 30% of the remaining healthy RGCs become sick, with the process repeating over time. These events will be reflected in progressive loss of function (PERG amplitude) and inner retina structure (OCT thinning), with the former expected to anticipate loss to a greater extent compared to the latter.
The proposed model is based on a simple two-parameter exponential decay function H(t) = H0*(1−b)^t where H(t) is the number of healthy RGCs at a given arbitrary time unit t, H0 is the number of healthy RGCs at disease onset (100 RGCs in the example) and b is the continuous decay rate (b = 0.3 in the example of Figure 2A) at which healthy RGCs become sick. Assuming that there is a time lag τ from sick to dead conditions (τ = 2 in the example of Figure 2A), then the number of dead RGCs at a given time t will be D(t) = H0 − [1 − (1 − b)^(t − τ)], t > 2; D(t) = 0, 0 ≤ t ≤ 2. The number of sick RGCs at a given time t will be S(t) = H0*[1 − (1 − b)^2]*(1 − b)^(t − 2), t > 2; S(t) = H0[1 − (1 − b)^t], 0 ≤ t ≤ 2. At any given time, the overall function F of surviving RGCs will be proportional to the number of healthy RGCs plus the number of sick RGCs multiplied by a dysfunction factor d (d = 0.5 in the example) F(t) = H(t) + S(t)*d. The overall surviving RGC population P will be proportional to the number of healthy RGCs plus the number of sick RGCs P(t) = H(t) + S(t) (Figure 2B). Thus, modifiable parameters are the continuous decay rate b at which healthy RGCs become sick, the time lag τ between sick and dead RGC, and the dysfunction coefficient d of sick RGCs. Changes in these factors generate a family of functions that can be used for hypothesis testing and modeling experimental data. The experimental data in Figure 2C obtained in DBA/2J glaucoma [28] could be reasonably well modeled with parameters b = 0.3, τ = 6.5 months, and d = 0.5. In Figure 2B, the horizontal distance between the decay curves of function and structure provides an estimate of the lifespan of sick RGCs, which represents a time window of opportunity for treatment to prevent RGC death. The vertical distance between the decay curves of function and structure provides an estimate of RGC dysfunction that is not accounted for by cell death, which represents an opportunity for treatment to restore RGC function. Longitudinal clinical data in early glaucoma patients [29] also show PERG functional decay, anticipating retinal nerve fiber thickness decay by several years. Analogue models may be hypothesized for a variety of conditions impacting the susceptibly and lifespan of RGCs together with their ability to generate electrical signals under a protracted degenerative process.

2.3. PERG Dynamics and RGC Functional Properties

To have a better insight into the significance of PERG changes in optic nerve disorders, it is necessary to isolate the activity of surviving and still functional RGCs. This can be done by investigating how the PERG response changes over a range of conditions. The resulting response dynamics reflects the ability of functional RGCs to detect changing conditions and regulate their activity accordingly. Additional insight into the activity of functional RGCs is provided by the PERG response latency, which reflects the contribution of healthy and sick RGCs but not the missing contribution of dying and dead RGCs. PERG latency is defined as the time that elapses between the onset of the visual stimulus and the peak of the response. PERG amplitude and latency dynamics can be investigated for a variety of physiological stimuli and positive/negative stressors, eventually providing a panel of biomarkers that will be helpful to identify the cause of dysfunction and formulate predictions on disease progression with or without treatments. A number of neuronal function properties are reflected in changes in PERG response dynamics (Table 2). These properties, not mutually exclusive, are widely used in different contexts with varying semantics, but are pragmatically defined here as they provide a framework to test hypotheses of different RGC functional conditions as well as biomarkers for neuroprotection studies.

2.4. PERG Dynamics—Physiological Approaches
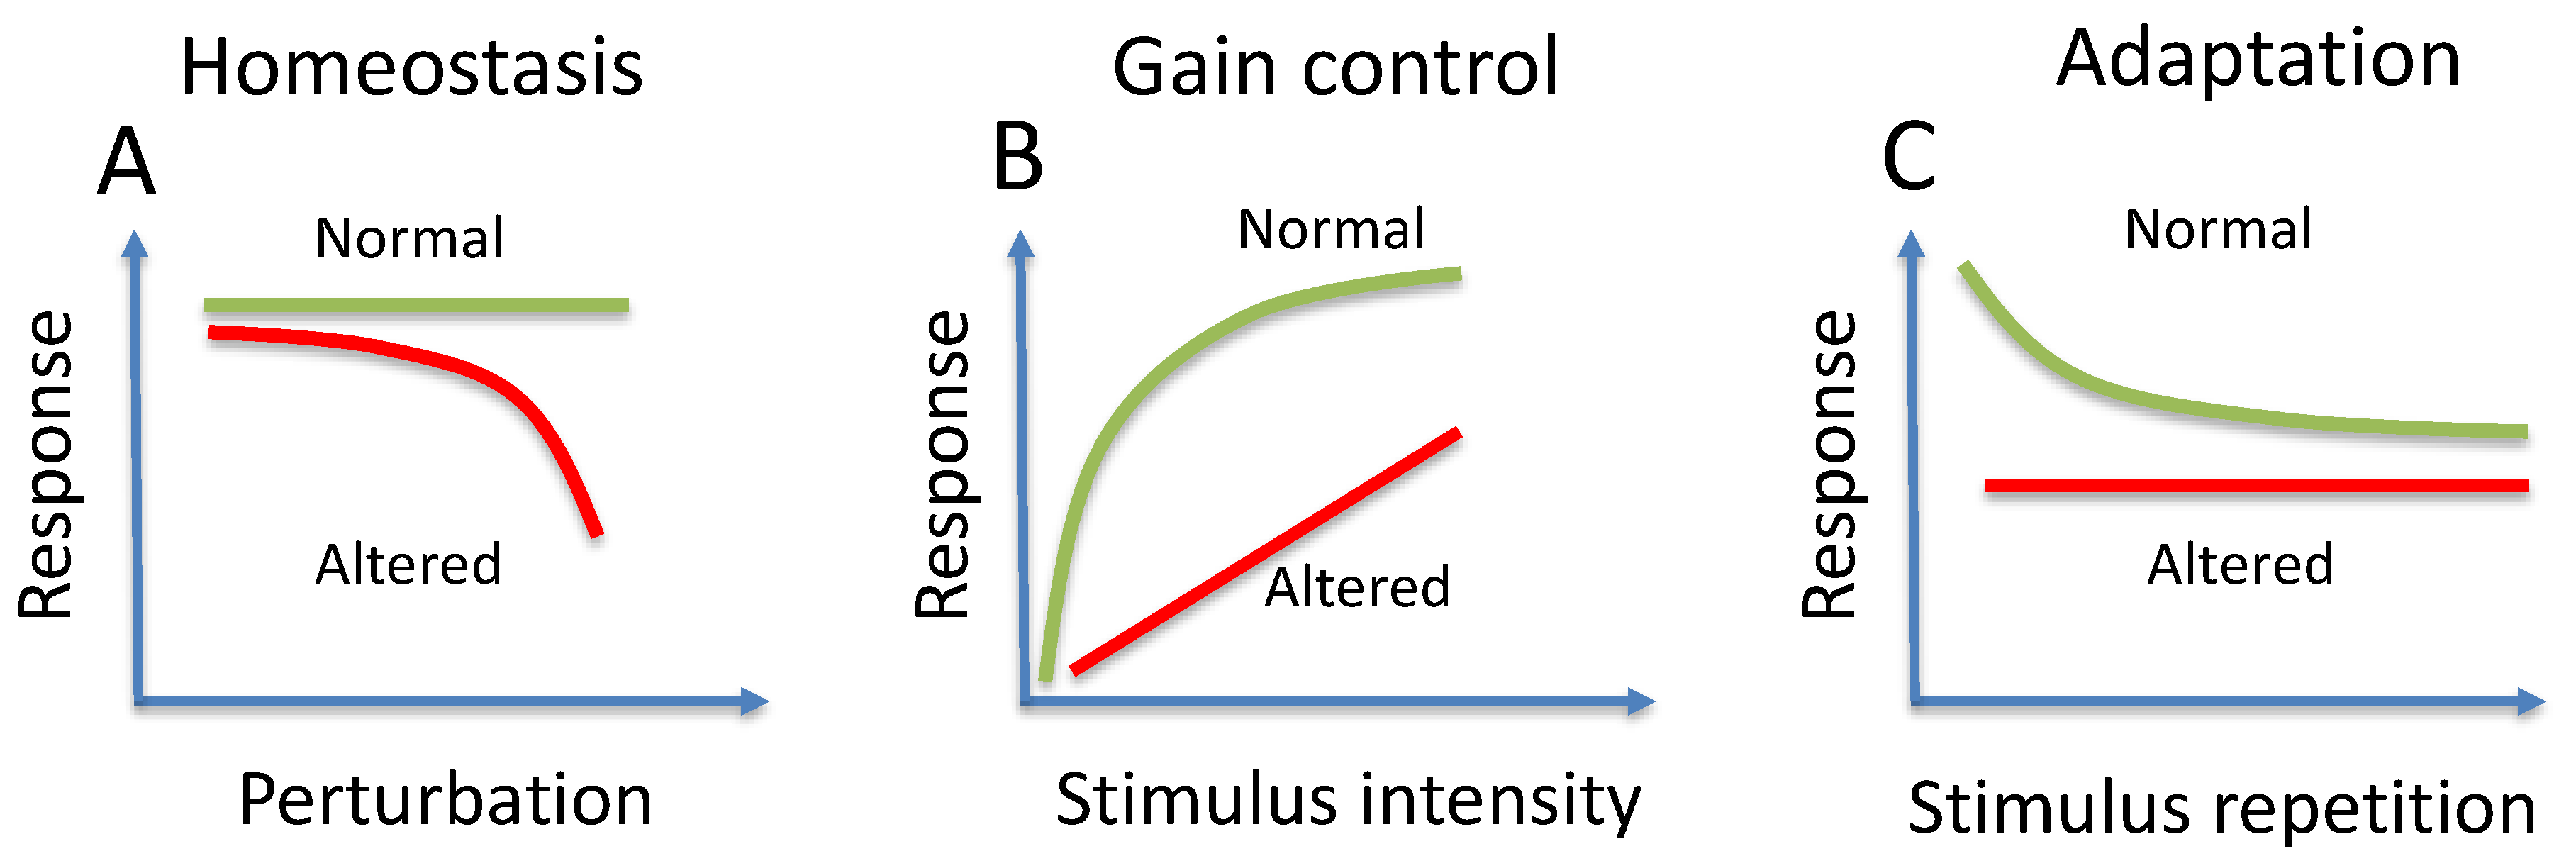
Physiological approaches such as changes in stimulus intensity/duration or body posture may result in different PERG changes that reflect the ability of functional RGCs to regulate their activity. Figure 3 summarizes conceptual examples of homeostasis, gain control, and adaptation.

3. Homeostasis

Homeostasis (Figure 3A) characterizes the ability of RGCs to maintain a constant response over a wide range of physical and biological perturbations. Altered homeostasis perhaps represents the earliest stage of RGC dysfunction that is reflected in the PERG. The detection of altered homeostasis helps in formulating an early diagnosis and predicting progression and may represent the rationale for neuroprotective intervention. Altered RGC homeostasis is thought to occur in pre-glaucomatous DBA/2J mice and patients with suspected glaucoma, where a normal PERG may become reduced in susceptible eyes but not in control eyes upon physiological IOP elevation during head down tilt [30,31]. PERG susceptibility upon head-down tilt in those with suspected glaucoma predicts thinning of retinal fiber layer thickness after 5 years [32].

4. Gain Control

Gain control (Figure 3B) characterizes the ability of RGCs to regulate their activity with increasing stimulus strength. Typically, the relationship between PERG amplitude/latency and stimulus contrast is not linear, implying regulatory mechanisms in the RGCs and/or in the inner retinal circuitry impinging on them to contain RGC response in an optimal dynamic range. Altered PERG contrast gain control means that RGCs function in a different way, which may represent a biomarker of functional remodeling to improve survival rather than heralding cell death. Examples of altered PERG contrast gain control dynamics of amplitude and latency are provided by experiments in different mouse models in which neurotrophic support has been disturbed without causing cell death, including intravitreally injection of brain-derived neurotrophic factor (BDNF), anti-BDNF or lesion of the superior colliculus [33]. These results represent a proof of concept that PERG dynamics could be used as a tool for in vivo monitoring of RGC functional plasticity and for phenotypic screening (see Figure 5).

5. Adaptation

Adaptation (Figure 3C) characterizes the autoregulatory ability of RGCs to reduce their activity to a lower level in response to sustained visual stimuli that cause high energy demand. Visual stimuli that induce strong PERG adaptation are steady-state, high-contrast reversing patterns in humans [34] and transient, high-contrast reversing patterns with superimposed flickering light in mice [35] that are associated with increased metabolic demand and vasodilation. PERG adaptation is reduced in human aging, glaucoma, optic neuritis and non-artheritic-ischemic-neuropathy (NAION) [36,37] and is also reduced in DBA/2J mouse glaucoma [38]. PERG adaptation can be restored in DBA/2J glaucoma with sustained diet that supports mitochondrial function [38].

6. PERG Dynamics—Interventional Approaches
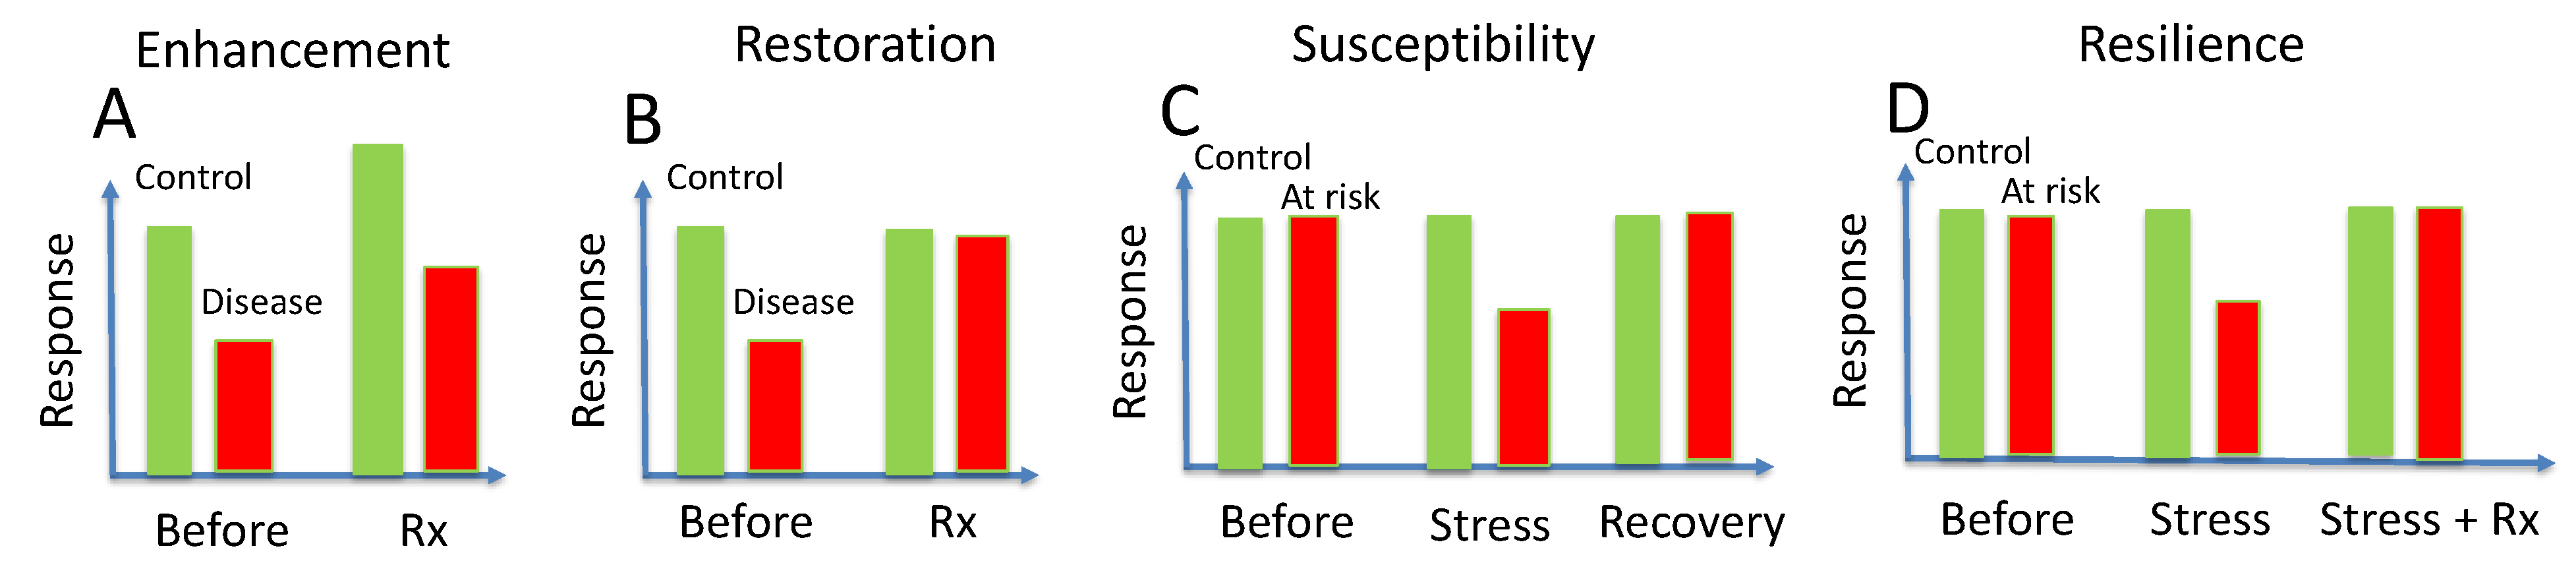
Interventional approaches such as treatment or exposure to stressful conditions may result in a variety of PERG changes that reflect temporary changes in RGC function. Figure 4 summarizes conceptual examples of enhancement, restoration, susceptibility and resilience that can be applied to both standard PERG responses and PERG response dynamics.

7. Enhancement

Enhancement (Figure 4A) characterizes nonspecific improvement of the PERG signal after treatment. Both the normal PERG amplitude of the control group and the reduced PERG amplitude of the group with manifest pathology improve, meaning that the treatment boosts function of all RGCs independently of pathology. For example, citicoline (cytidine-5′-diphosphocholine) has been shown to improve the PERG amplitude in glaucoma and NAION patients [39], but has been also shown to induce sustained improvement of PERG amplitude in control subjects [40]. Enhancement of PERG amplitude in control human subjects is also reported to occur after oral administration of levodopa [41].

8. Restoration

Restoration (Figure 4B) characterizes specific improvement of PERG amplitude after treatment in the manifest pathology group but not in the control group. For example, Ventura and Porciatti [26] treated both controls and glaucoma patients with IOP-lowering medications. Comparable reduction in IOP in both groups resulted in PERG amplitude improvement in the glaucoma group but not the control group.

9. Susceptibility

The intrinsic susceptibility to glaucoma and optic neuropathies due to complex trait inheritance and aging is well known [42,43,44,45]. Susceptibility to exogenous factors (Figure 4C) is less investigated and less understood, and it is used here to characterize reversible reduction in an otherwise normal PERG amplitude in response to a variety of stressors (physiological, physical, chemical, molecular, etc.). Inducible, reversible PERG reduction can be used as a provocative test to investigate factors that impair RGC defense mechanisms. Examples include temporary IOP elevation in glaucoma [30,46], while inducible, reversible PERG loss that targets the optic nerve is provided by retrobulbar lidocaine injections in mice, which temporarily block axon transport in the optic nerve [47]. Postconditioning after repeated lidocaine injections results in endogenous upregulation of trophic factors in the retina that have a neuroprotective effect in the DBA/2J mouse glaucoma [48]. Investigation of susceptibility to stressors may represent a very promising field, as susceptibility to specific stressors provides the rationale and a target for neuroprotection.

10. Acquired Resilience

Body tissues have the ability to autoregulate protective or repair mechanisms, including adaptive remodeling, in response to a large variety of everyday exogenous stressors, similarly to the immune system, which make the tissue resilient to future stress of the same nature [49]. Repair mechanisms include adaptive remodeling during the course of the neurodegenerative disease [50]. Acquired resilience is used here to characterize resilience gained after specific treatments that minimize susceptibility to provocative tests (Figure 4D). So far, a few provocative tests have been proposed, such as head-down posture [30,31] or water drinking [51], which cause IOP elevation and may result in PERG reduction in susceptible eyes. Combined assessment of susceptibility to novel provocative tests and acquired resilience to the same provocative test after treatment may represent a promising field of investigation, as it would provide a predictive index of neuroprotective efficacy of treatments based on baseline assessment.

11. Functional Phenotyping

The need for functional phenotyping increases in parallel with the ever-increasing number of genetically engineered rodent models. Susceptibility and resilience in glaucoma have a strong genetic component [52]. For example, BXD mice (derived from crossing glaucoma-resilient C57BL/6J mice with glaucoma-prone DBA/2J mice) allow investigation of genetic regulation of factors associated with glaucoma risk [9,53]. One way to determine the RGC functional phenotype of genotypes with different resilience/susceptibility is to investigate the PERG contrast dynamics (Figure 5). At low contrast (0.3), PERGs of pre-glaucomatous C57BL/6J and DBA/2J mice have similar amplitude and latency. With increasing contrast, the rates of change in amplitude and latency of the two strains substantially diverge, indicating different contrast gain and integration time [54]. This suggests different functional circuitry in the inner retina that may be related to the larger RGC population in DBA/2J compared to C57BL/6J [55]. Contrast gain and integration time also change in the same phenotype upon genetic and induced changes in neurotrophic support [33], suggesting altered functional circuitry subserving RGC response.

12. Age-Related Factors

Neuroprotection studies are typically performed over an extended time period. Intrinsic, age-dependent functional changes need to be accounted for to isolate the effect of specific stressors and treatments. For example, as shown in Figure 6A, in D2 mice IOP increases with increasing age while the PERG amplitude progressively decreases to a floor at about 11 months [28]. Statistical analysis reveals that while there is a strong inverse correlation between PERG amplitude and IOP (r2 = 0.43, p < 0.001), age independently contributes (p < 0.0001) to progressive PERG loss. This implies that there are specific age-related factors that could be the target of neuroprotective strategies, in addition to IOP lowering [56]. Williams et al. [10] identified mitochondrial abnormalities as major driver of neuronal dysfunction. B2 mice treated with either vitamin B3 rich diet or gene therapy driving Nmnat1, a key NAD+-producing enzyme, did not develop glaucoma despite IOP elevation [10]. Similar results have been obtained with a diet enriched with pyruvate, which provides bioenergetic support [57]. Age-related factors also alter eye structure independently of IOP [58,59] (Figure 6B–D). Between 2.5 and 6 months of age, both B6 and D2 mice grow in weight and eye length, although after 6 months eye elongation and anterior chamber depth are considerably larger in D2 in association with increased IOP. Cone et al., 2010 [60] induced IOP elevation in B6, D2, and CD1 mice by an average of 4.4 mmHg with intracameral injections of microbeads, resulting in different eye elongation and RGC death in the three strains after 6–12 weeks. Altogether, spontaneous and induced change in eye size may alter biomechanical properties of eye tissues which may also play a role in RGC and axon susceptibility independently of IOP.

13. Conclusions

The conceptual framework we have discussed is based on the assumptions that (1) in the progression of glaucoma and optic neuropathies, reversible RGC dysfunction precedes RGC death, (2) RGC dysfunction and its dynamics can be assessed non-invasively with PERG, (3) the susceptibility to positive/negative stressors is reflected in PERG changes of the opposite sign. Although these assumptions have not been firmly demonstrated, they are supported by a substantial body of literature including the examples shown above and the proposed mathematical model that fits the experimental data. We realize that the pathophysiology and temporal dynamics of glaucoma and optic neuropathies are more complex than those we have assumed to minimize the contributing factors to the model. Future studies will prove or disprove this model and introduce additional models. We also realize that the PERG is a global metric and cannot distinguish local changes that are frequent in early manifest glaucoma and can be detected with imaging. Altogether, the proposed conceptual framework emphasizes several different RGC physiological conditions that can be characterized with PERG and used as biomarkers for staging the disease, for establishing sensitive functional endpoints at early stages of disease before irreversible RGC death, and for assessing the effect of neuroprotective treatments. PERG dynamics can also be used for phenotyping genetically engineered models with possible alteration of RGC function.

Author Contributions

Conceptualization, analysis, and draft preparation (V.P.); analysis, review, and editing (T.-H.C.); funding acquisition (V.P.). All authors have read and agreed to the published version of the manuscript.

Funding

NIH-NEI RO1 EY019077; NIH-NEI R24 EY028785; NIH center grant P30-EY014801; unrestricted grant to Bascom Palmer Eye Institute from Research to Prevent Blindness, Inc.

Institutional Review Board Statement

Not applicable.

Informed Consent Statement

Not applicable.

Data Availability Statement

Not applicable.

Conflicts of Interest

The authors declare no conflict of interest.

Financial Disclosure

None for all authors.

References

  1. Almasieh, M.; Levin, L.A. Neuroprotection in Glaucoma: Animal Models and Clinical Trials. Annu. Rev. Vis. Sci. 2017, 3, 91–120. [Google Scholar] [CrossRef]
  2. Wareham, L.K.; Risner, M.L.; Calkins, D.J. Protect, Repair, and Regenerate: Towards Restoring Vision in Glaucoma. Curr. Ophthalmol. Rep. 2020, 8, 301–310. [Google Scholar] [CrossRef] [PubMed]
  3. Khatib, T.Z.; Martin, K.R. Neuroprotection in Glaucoma: Towards Clinical Trials and Precision Medicine. Curr. Eye Res. 2020, 45, 327–338. [Google Scholar] [CrossRef] [PubMed] [Green Version]
  4. Tsai, J.C. Innovative IOP-Independent Neuroprotection and Neuroregeneration Strategies in the Pipeline for Glaucoma. J. Ophthalmol. 2020, 2020, 1–6. [Google Scholar] [CrossRef] [Green Version]
  5. Levin, L.A. Neuroprotection in Optic Neuropathy. Asia-Pacific J. Ophthalmol. 2018, 7, 246–250. [Google Scholar] [CrossRef]
  6. Guymer, C.; Wood, J.P.; Chidlow, G.; Casson, R.J. Neuroprotection in glaucoma: Recent advances and clinical translation. Clin. Exp. Ophthalmol. 2019, 47, 88–105. [Google Scholar] [CrossRef]
  7. Pearson, C.; Martin, K. Stem cell approaches to glaucoma: From aqueous outflow modulation to retinal neuroprotection. Prog. Brain Res. 2015, 220, 241–256. [Google Scholar] [CrossRef] [PubMed]
  8. Shen, J.; Wang, Y.; Yao, K. Protection of retinal ganglion cells in glaucoma: Current status and future. Exp. Eye Res. 2021, 205, 108506. [Google Scholar] [CrossRef] [PubMed]
  9. Howell, G.R.; Libby, R.T.; Jakobs, T.; Smith, R.S.; Phalan, F.C.; Barter, J.W.; Barbay, J.M.; Marchant, J.K.; Mahesh, N.; Porciatti, V.; et al. Axons of retinal ganglion cells are insulted in the optic nerve early in DBA/2J glaucoma. J. Cell Biol. 2007, 179, 1523–1537. [Google Scholar] [CrossRef] [Green Version]
  10. Williams, P.A.; Harder, J.M.; Foxworth, N.E.; Cochran, K.E.; Philip, V.M.; Porciatti, V.; Smithies, O.; John, S.W.M. Vitamin B3modulates mitochondrial vulnerability and prevents glaucoma in aged mice. Science 2017, 355, 756–760. [Google Scholar] [CrossRef] [PubMed] [Green Version]
  11. Crish, S.D.; Sappington, R.M.; Inman, D.; Horner, P.J.; Calkins, D.J. Distal axonopathy with structural persistence in glaucomatous neurodegeneration. Proc. Natl. Acad. Sci. USA 2010, 107, 5196–5201. [Google Scholar] [CrossRef] [PubMed] [Green Version]
  12. Buckingham, B.P.; Inman, D.; Lambert, W.; Oglesby, E.; Calkins, D.J.; Steele, M.R.; Vetter, M.L.; Marsh-Armstrong, N.; Horner, P.J. Progressive Ganglion Cell Degeneration Precedes Neuronal Loss in a Mouse Model of Glaucoma. J. Neurosci. 2008, 28, 2735–2744. [Google Scholar] [CrossRef] [Green Version]
  13. Enriquez-Algeciras, M.; Ding, D.; Chou, T.-H.; Wang, J.; Padgett, K.R.; Porciatti, V.; Bhattacharya, S.K. Evaluation of a Transgenic Mouse Model of Multiple Sclerosis with Noninvasive Methods. Investig. Opthalmology Vis. Sci. 2011, 52, 2405–2411. [Google Scholar] [CrossRef] [Green Version]
  14. Porciatti, V.; Ventura, L.M. Retinal ganglion cell functional plasticity and optic neuropathy: A comprehensive model. J. Neuro-Ophthalmol. 2012, 32, 354–358. [Google Scholar] [CrossRef] [Green Version]
  15. Siebert, U.; Alagoz, O.; Bayoumi, A.M.; Jahn, B.; Owens, D.K.; Cohen, D.J.; Kuntz, K.M. State-Transition Modeling: A report of the ISPOR-SMDM Modeling Good Research Practices Task Force-3. Med. Decis. Mak. 2012, 32, 690–700. [Google Scholar] [CrossRef]
  16. Cordeiro, M.F.; Migdal, C.; Bloom, P.; Fitzke, F.W.; E Moss, S. Imaging apoptosis in the eye. Eye 2011, 25, 545–553. [Google Scholar] [CrossRef] [PubMed]
  17. Yap, T.E.; Donna, P.; Almonte, M.T.; Cordeiro, M.F. Real-Time Imaging of Retinal Ganglion Cell Apoptosis. Cells 2018, 7, 60. [Google Scholar] [CrossRef] [PubMed] [Green Version]
  18. Leinonen, H.; Tanila, H. Vision in laboratory rodents—Tools to measure it and implications for behavioral research. Behav. Brain Res. 2018, 352, 172–182. [Google Scholar] [CrossRef] [PubMed] [Green Version]
  19. Porciatti, V. Electrophysiological assessment of retinal ganglion cell function. Exp. Eye Res. 2015, 141, 164–170. [Google Scholar] [CrossRef] [PubMed] [Green Version]
  20. Thompson, D.; Drasdo, N. The origins of luminance and pattern responses of the pattern electroretinogram. Int. J. Psychophysiol. 1994, 16, 219–227. [Google Scholar] [CrossRef]
  21. Hess, R.F.; Baker, C.L., Jr. Human pattern-evoked electroretinogram. J. Neurophysiol. 1984, 51, 939–951. [Google Scholar] [CrossRef]
  22. Porciatti, V.; Saleh, M.; Nagaraju, M. The Pattern Electroretinogram as a Tool to Monitor Progressive Retinal Ganglion Cell Dysfunction in the DBA/2J Mouse Model of Glaucoma. Investig. Opthalmology Vis. Sci. 2007, 48, 745–751. [Google Scholar] [CrossRef] [PubMed] [Green Version]
  23. Porciatti, V. The mouse pattern electroretinogram. Doc. Ophthalmol. 2007, 115, 145–153. [Google Scholar] [CrossRef] [Green Version]
  24. Chou, T.-H.; Bohorquez, J.; Toft-Nielsen, J.; Ozdamar, O.; Porciatti, V. Robust mouse pattern electroretinograms derived simultaneously from each eye using a common snout electrode. Investig. Opthalmology Vis. Sci. 2014, 55, 2469–2475. [Google Scholar] [CrossRef] [PubMed]
  25. Sehi, M.; Grewal, D.; Goodkin, M.L.; Greenfield, D.S. Reversal of Retinal Ganglion Cell Dysfunction after Surgical Reduction of Intraocular Pressure. Ophthalmology 2010, 117, 2329–2336. [Google Scholar] [CrossRef] [PubMed]
  26. Ventura, L.M.; Porciatti, V. Restoration of retinal ganglion cell function in early glaucoma after intraocular pressure reduction: A pilot study. Ophthalmology 2005, 112, 20–27. [Google Scholar] [CrossRef] [Green Version]
  27. Yang, E.; Al-Mugheiry, T.S.; Normando, E.M.; Cordeiro, M.F. Real-Time Imaging of Retinal Cell Apoptosis by Confocal Scanning Laser Ophthalmoscopy and Its Role in Glaucoma. Front. Neurol. 2018, 9, 338. [Google Scholar] [CrossRef] [PubMed]
  28. Saleh, M.; Nagaraju, M.; Porciatti, V. Longitudinal evaluation of retinal ganglion cell function and IOP in the DBA/2J mouse model of glaucoma. Investig. Opthalmology Vis. Sci. 2007, 48, 4564–4572. [Google Scholar] [CrossRef] [PubMed] [Green Version]
  29. Banitt, M.R.; Ventura, L.M.; Feuer, W.J.; Savatovsky, E.; Luna, G.; Shif, O.; Bosse, B.; Porciatti, V. Progressive Loss of Retinal Ganglion Cell Function Precedes Structural Loss by Several Years in Glaucoma Suspects. Investig. Opthalmology Vis. Sci. 2013, 54, 2346–2352. [Google Scholar] [CrossRef]
  30. Nagaraju, M.; Saleh, M.; Porciatti, V. IOP-Dependent Retinal Ganglion Cell Dysfunction in Glaucomatous DBA/2J Mice. Investig. Opthalmology Vis. Sci. 2007, 48, 4573–4579. [Google Scholar] [CrossRef]
  31. Ventura, L.M.; Golubev, I.; Lee, W.; Nose, I.; Parel, J.-M.; Feuer, W.J.; Porciatti, V. Head-down posture induces PERG alterations in early glaucoma. J. Glaucoma 2013, 22, 255–264. [Google Scholar] [CrossRef] [Green Version]
  32. Porciatti, V.; Feuer, W.J.; Monsalve, P.; Triolo, G.; Vazquez, L.; McSoley, J.; Ventura, L.M. Head-down Posture in Glaucoma Suspects Induces Changes in IOP, Systemic Pressure, and PERG That Predict Future Loss of Optic Nerve Tissue. J. Glaucoma 2017, 26, 459–465. [Google Scholar] [CrossRef] [PubMed] [Green Version]
  33. Chou, T.-H.; Feuer, W.J.; Schwartz, O.; Rojas, M.J.; Roebber, J.K.; Porciatti, V. Integrative properties of retinal ganglion cell electrical responsiveness depend on neurotrophic support and genotype in the mouse. Exp. Eye Res. 2016, 145, 68–74. [Google Scholar] [CrossRef] [PubMed] [Green Version]
  34. Porciatti, V.; Sorokac, N.; Buchser, W. Habituation of retinal ganglion cell activity in response to steady state pattern visual stimuli in normal subjects. Investig. Opthalmology Vis. Sci. 2005, 46, 1296–1302. [Google Scholar] [CrossRef] [PubMed]
  35. Chou, T.-H.; Toft-Nielsen, J.; Porciatti, V. Adaptation of retinal ganglion cell function during flickering light in the mouse. Sci. Rep. 2019, 9, 18396. [Google Scholar] [CrossRef] [PubMed] [Green Version]
  36. Monsalve, P.; Ren, S.; Triolo, G.; Vazquez, L.; Henderson, A.D.; Kostic, M.; Gordon, P.; Feuer, W.J.; Porciatti, V. Steady-state PERG adaptation: A conspicuous component of response variability with clinical significance. Doc. Ophthalmol. 2018, 136, 157–164. [Google Scholar] [CrossRef] [PubMed]
  37. Monsalve, P.; Triolo, G.; Toft-Nielsen, J.; Bohorquez, J.; Henderson, A.D.; Delgado, R.; Miskiel, E.; Ozdamar, O.; Feuer, W.J.; Porciatti, V. Next Generation PERG Method: Expanding the Response Dynamic Range and Capturing Response Adaptation. Transl. Vis. Sci. Technol. 2017, 6, 5. [Google Scholar] [CrossRef] [PubMed] [Green Version]
  38. Chou, T.-H.; Romano, G.L.; Amato, R.; Porciatti, V. Nicotinamide-Rich Diet in DBA/2J Mice Preserves Retinal Ganglion Cell Metabolic Function as Assessed by PERG Adaptation to Flicker. Nutrients. 2020, 12, 1910. [Google Scholar] [CrossRef]
  39. Gandolfi, S.; Marchini, G.; Caporossi, A.; Scuderi, G.; Tomasso, L.; Brunoro, A. Cytidine 5′-Diphosphocholine (Citicoline): Evidence for a Neuroprotective Role in Glaucoma. Nutrients. 2020, 12, 793. [Google Scholar] [CrossRef] [Green Version]
  40. Parisi, V.; Barbano, L.; Di Renzo, A.; Coppola, G.; Ziccardi, L. Neuroenhancement and neuroprotection by oral solution citicoline in non-arteritic ischemic optic neuropathy as a model of neurodegeneration: A randomized pilot study. PLoS ONE 2019, 14, e0220435. [Google Scholar] [CrossRef]
  41. Gottlob, I.; Weghaupt, H.; Vass, C.; Auff, E. Effect of levodopa on the human pattern electroretinogram and pattern visual evoked potentials. Graefe’s Arch. Clin. Exp. Ophthalmol. 1989, 227, 421–427. [Google Scholar] [CrossRef]
  42. Libby, R.T.; Anderson, M.; Pang, I.-H.; Robinson, Z.H.; Savinova, O.V.; Cosma, I.M.; Snow, A.; Wilson, L.A.; Smith, R.S.; Clark, A.F.; et al. Inherited glaucoma in DBA/2J mice: Pertinent disease features for studying the neurodegeneration. Vis. Neurosci. 2005, 22, 637–648. [Google Scholar] [CrossRef] [PubMed]
  43. Libby, R.T.; Gould, D.B.; Anderson, M.G.; John, S.W. Complex genetics of glaucoma susceptibility. Annu. Rev. Genom. Hum. Genet. 2005, 6, 15–44. [Google Scholar] [CrossRef] [Green Version]
  44. Carelli, V.; Achilli, A.; Valentino, M.L.; Rengo, C.; Semino, O.; Pala, M.; Olivieri, A.; Mattiazzi, M.; Pallotti, F.; Carrara, F.; et al. Haplogroup effects and recombination of mitochondrial DNA: Novel clues from the analysis of Leber hereditary optic neuropathy pedigrees. Am. J. Hum. Genet. 2006, 78, 564–574. [Google Scholar] [CrossRef] [PubMed] [Green Version]
  45. Hudson, G.; Yu-Wai-Man, P.; Griffiths, P.G.; Caporali, L.; Salomao, S.S.; Berezovsky, A.; Carelli, V.; Zeviani, M.; Chinnery, P.F. Variation in OPA1 does not explain the incomplete penetrance of Leber hereditary optic neuropathy. Mol. Vis. 2010, 16, 2760–2764. [Google Scholar]
  46. Crowston, J.G.; Kong, Y.X.G.; Trounce, I.A.; Dang, T.M.; Fahy, E.T.; Bui, B.; Morrison, J.C.; Chrysostomou, V. An acute intraocular pressure challenge to assess retinal ganglion cell injury and recovery in the mouse. Exp. Eye Res. 2015, 141, 3–8. [Google Scholar] [CrossRef]
  47. Chou, T.-H.; Park, K.K.; Luo, X.; Porciatti, V. Retrograde signaling in the optic nerve is necessary for electrical responsiveness of retinal ganglion cells. Investig. Opthalmology Vis. Sci. 2013, 54, 1236–1243. [Google Scholar] [CrossRef] [Green Version]
  48. Chou, T.-H.; Musada, G.R.; Romano, G.L.; Bolton, E.; Porciatti, V. Anesthetic Preconditioning as Endogenous Neuroprotection in Glaucoma. Int. J. Mol. Sci. 2018, 19, 237. [Google Scholar] [CrossRef] [PubMed] [Green Version]
  49. Stone, J.; Mitrofanis, J.; Johnstone, D.M.; Falsini, B.; Bisti, S.; Adam, P.; Nuevo, A.B.; George-Weinstein, M.; Mason, R.; Eells, J. Acquired Resilience: An Evolved System of Tissue Protection in Mammals. Dose-Response 2018, 16, 1559325818803428. [Google Scholar] [CrossRef] [PubMed]
  50. Calkins, D.J. Adaptive responses to neurodegenerative stress in glaucoma. Prog. Retin. Eye Res. 2021, 2021, 100953. [Google Scholar] [CrossRef]
  51. Gameiro, G.; Monsalve, P.; Golubev, I.; Ventura, L.; Porciatti, V. Neurovascular Changes Associated with the Water Drinking Test. J. Glaucoma 2018, 27, 429–432. [Google Scholar] [CrossRef]
  52. Anderson, M.G.; Libby, R.T.; Mao, M.; Cosma, I.M.; A Wilson, L.; Smith, R.S.; John, S.W.M. Genetic context determines susceptibility to intraocular pressure elevation in a mouse pigmentary glaucoma. BMC Biol. 2006, 4, 20. [Google Scholar] [CrossRef] [Green Version]
  53. Geisert, E.E.; Williams, R.W. Using BXD mouse strains in vision research: A systems genetics approach. Mol. Vis. 2020, 26, 173–187. [Google Scholar]
  54. Porciatti, V.; Chou, T.H.; Feuer, W.J. C57BL/6J, DBA/2J, and DBA/2J.Gpnmb mice have different visual signal processing in the inner retina. Mol. Vis. 2010, 16, 2939–2947. [Google Scholar] [PubMed]
  55. Williams, R.W.; Strom, R.C.; Rice, D.S.; Goldowitz, D. Genetic and environmental control of variation in retinal ganglion cell number in mice. J. Neurosci. 1996, 16, 7193–7205. [Google Scholar] [CrossRef] [Green Version]
  56. Schuettauf, F.; Quinto, K.; Naskar, R.; Zurakowski, D. Effects of anti-glaucoma medications on gangion cell survival: The DBA/2J mouse model. Vis. Res. 2002, 42, 2333–2337. [Google Scholar] [CrossRef] [Green Version]
  57. Harder, J.M.; Guymer, C.; Wood, J.P.M.; Daskalaki, E.; Chidlow, G.; Zhang, C.; Balasubramanian, R.; Cardozo, B.H.; Foxworth, N.E.; Deering, K.E.; et al. Disturbed glucose and pyruvate metabolism in glaucoma with neuroprotection by pyruvate or rapamycin. Proc. Natl. Acad. Sci. USA 2020, 117, 33619–33627. [Google Scholar] [CrossRef] [PubMed]
  58. Chou, T.-H.; Kocaoglu, O.P.; Borja, D.; Ruggeri, M.; Uhlhorn, S.R.; Manns, F.; Porciatti, V. Postnatal Elongation of Eye Size in DBA/2J Mice Compared with C57BL/6J Mice: In Vivo Analysis with Whole-Eye OCT. Investig. Opthalmology Vis. Sci. 2011, 52, 3604–3612. [Google Scholar] [CrossRef] [PubMed]
  59. Fiedorowicz, M.; Wełniak-Kamińska, M.; Świątkiewicz, M.; Orzeł, J.; Chorągiewicz, T.; Toro, M.D.; Rejdak, R.; Bogorodzki, P.; Grieb, P. Changes of Ocular Dimensions as a Marker of Disease Progression in a Murine Model of Pigmentary Glaucoma. Front. Pharmacol. 2020, 11. [Google Scholar] [CrossRef]
  60. Cone, F.E.; Gelman, S.E.; Son, J.L.; Pease, M.; Quigley, H.A. Differential susceptibility to experimental glaucoma among 3 mouse strains using bead and viscoelastic injection. Exp. Eye Res. 2010, 91, 415–424. [Google Scholar] [CrossRef] [PubMed] [Green Version]
Figure 1. Recording set up for human and mouse PERG. (A,D) Patterned visual stimuli generated on LED tablets. (B) Surface electrode placement in human subjects for binocular PERG recording. (C) Example of human PERG and noise waveforms in response to fine gratings alternating 15.6 times/s. The blue dashed line superimposed to the PERG waveform represents the 15.6 Hz response component isolated in the frequency domain that is actually measured. Amplitude is measured from zero to the positive peak (vertical arrow), and latency is the corresponding time-to-peak (horizontal arrow). (E) Dual stimulus for binocular PERG recording in the mouse using subcutaneous needle electrodes in the snout and on the back of the head. (F) Example of mouse PERG waveforms response to large gratings alternating at slight different rates for each eye around 2 times/s. Amplitude is measured from the positive wave P1 to the negative wave N2, and latency is the time-to-peak of the positive wave P1. In the example, PERGs from different normal C57Bl/6J mice are superimposed to emphasize reproducibility. Figure panels are replotted from Monsalve et al., TVST 2017 and Chou et al., IOVS 2014.
Cells 10 01398 g001
Figure 2. (A) Model of progressive optic neuropathy in which a given proportion (30%) of healthy RGCs become sick at time 1 and survive until time 2, with the process repeating at each successive time unit. (B) Assuming that sick RGCs function at 50% of normal capacity, the overall RGC function as measured by PERG decreases exponentially over time, anticipating a similar decay of the mean inner retinal thickness as measured by OCT. C: Natural history of PERG amplitude and optic nerve axon counts in DBA/2J mouse glaucoma. PERG data are replotted from Saleh et al., 2007, and represent the mean ± SEM of 32 mice; average axon counts are derived from Libby et al. 2005 and Anderson et al. 2005. The shaded area represents the 95% confidence interval of the spline regression curve interpolating PERG data.
Cells 10 01398 g002
Figure 3. Conceptual examples of normal (green lines) and altered (red lines) homeostasis (A), gain control (B), and adaptation (C).
Cells 10 01398 g003
Figure 4. Conceptual examples of enhancement (A), restoration (B), susceptibility (C) and resilience (D) in control eyes (green bars) and diseased/at risk eyed (red bars).
Cells 10 01398 g004
Figure 5. Contrast transfer function of PERG amplitude (A) and latency (B) in different mouse strains. B6: C57BL/6J; D2: DBA/2J. A: Different slopes of dashed lines represent different contrast gains of B6 and D2 PERGs. The dip in response amplitude at 0.8 contrast in the D2 contrast function indicates that generators with different spatio-temporal properties interact resulting in a reduction in the summed response. Replotted from Porciatti et al., 2010.
Cells 10 01398 g005
Figure 6. Age-related changes in C57BL/6J and DBA/2J mice. (A) PERG amplitude and IOP; (B) body weight; (C) Eye length; (D) anterior chamber depth. Panel (A) is replotted from Saleh et al., 2007 and panels (BD) from Chou et al., 2010. The shaded areas represent the 95% confidence interval of the spline regression curves.
Cells 10 01398 g006
Table 1. Conceptual stages of retinal ganglion cell (RGC) death in glaucoma and optic neuropathies that can be tested with non-invasive electrophysiology such as pattern electroretinogram (PERG) and imaging such as optical coherence tomography (OCT) and scanning laser ophthalmoscopy (SLO) combined with apoptotic markers.
Hypothetical Transitional Stages of RGCs in Degenerative Optic Neuropathies
0123456
HealthyAt RiskSickVery sickDying DeadEffaced
Non-Invasive Electrophysiology
Normal±AbnormalAbnormal, ReversibleAbnormal,
Reversible
Floor,
Irreversible
FloorFloor
Non-Invasive Imaging
NormalNormalNormalNormalAbnormalAbnormalAbnormal
Table 2. Relevant attributes of RGC function that can be investigated with PERG dynamics before and after neuroprotective treatment.
Neuronal Processes Altering PERG Dynamics
HomeostasisStable function despite perturbance
Gain controlReduction of sensitivity for high intensity stimuli
AdaptationReduction of response for repeated stimuli
SusceptibilityTemporary loss of function upon stress
ResilienceReduced susceptibility to stress
EnhancementNonspecific improvement of function
RestorationRecovery of lost function
ProtectionPrevention of future loss of function
RescueSalvage of residual function
PlasticityReconfigured function
Publisher’s Note: MDPI stays neutral with regard to jurisdictional claims in published maps and institutional affiliations.

