Article

Silencing of Poly(ADP-Ribose) Polymerase-2 Induces Mitochondrial Reactive Species Production and Mitochondrial Fragmentation

1
Department of Medical Chemistry, Faculty of Medicine, University of Debrecen, H-4032 Debrecen, Hungary
2
Department of Biochemistry and Molecular Biology, Faculty of Medicine, University of Debrecen, H-4032 Debrecen, Hungary
3
Department of Anatomy, Histology and Embryology, Faculty of Medicine, University of Debrecen, H-4032 Debrecen, Hungary
4
Biological Research Center of the Hungarian Academy of Sciences, H-6726 Szeged, Hungary
5
MTA-DE Neuroscience Research Group, H-4032 Debrecen, Hungary
6
MTA-DE Lendület Laboratory of Cellular Metabolism, H-4032 Debrecen, Hungary
7
Research Center for Molecular Medicine, Faculty of Medicine, University of Debrecen, H-4032 Debrecen, Hungary
*
Author to whom correspondence should be addressed.
Cells 2021, 10(6), 1387; https://doi.org/10.3390/cells10061387
Submission received: 23 January 2021 / Revised: 18 May 2021 / Accepted: 2 June 2021 / Published: 4 June 2021
(This article belongs to the Special Issue Molecular Role of PARP in Health and Disease 2020)

Abstract

:
PARP2 is a DNA repair protein. The deletion of PARP2 induces mitochondrial biogenesis and mitochondrial activity by increasing NAD+ levels and inducing SIRT1 activity. We show that the silencing of PARP2 causes mitochondrial fragmentation in myoblasts. We assessed multiple pathways that can lead to mitochondrial fragmentation and ruled out the involvement of mitophagy, the fusion–fission machinery, SIRT1, and mitochondrial unfolded protein response. Nevertheless, mitochondrial fragmentation was reversed by treatment with strong reductants, such as reduced glutathione (GSH), N-acetyl-cysteine (NAC), and a mitochondria-specific antioxidant MitoTEMPO. The effect of MitoTEMPO on mitochondrial morphology indicates the production of reactive oxygen species of mitochondrial origin. Elimination of reactive oxygen species reversed mitochondrial fragmentation in PARP2-silenced cells.

1. Introduction

Optimal mitochondrial biogenesis requires the coordinated expression of nuclear and mitochondrial genes. Most mitochondrial genes are coded in the nucleus. There is a dominant flow of information and material from the nucleus and the cytosol to the mitochondria, termed anterograde signaling [1]. The appropriate flux of protein from the cytosol to the mitochondria requires the coordinated regulation of nuclear transcription by a large set of nuclear transcription factors [2]. This web of transcription factors responds to changes in nutrient levels (amino acids, oxygen, NAD+, etc.) and cellular energy charge. Therefore, the transcriptional programs can accommodate the actual nutrient and energy charge of cells [3,4,5,6]. The disruption of nutrient sensing and mitonuclear proteostasis plays a pathogenic role in metabolic and neoplastic diseases [7,8,9].
An increase in the mitochondrial content of cells is termed mitochondrial biogenesis [2,10]. Mitochondria undergo constant quality control [10,11,12,13,14,15], in which, among others, mitophagy [16,17,18] and the mitochondrial unfolded protein response (mtUPR) [19,20] play a major role. Mitochondrial activity and mitochondrial quality control modulate the structure of the cellular mitochondrial network. Higher mitochondrial output usually accompanies fusion of the mitochondrial network, while removal of damaged mitochondrial components is associated with the fragmentation of the mitochondrial network [12,21,22,23].
poly(ADP-ribose) polymerases constitute a large protein family (PARP/ARTD1-17). Members of the PARP/ARTD family share the PARP catalytic domain that can cleave NAD+ to nicotinamide and ADP-ribose, subsequently using ADP-ribose as building blocks to build large poly(ADP-ribose) polymers (PAR) [24,25]. PARP2 accounts for around 15% of total cellular PARP activity, as a function of the model system used [26,27,28,29]. PARP2 can be activated by DNA strand breaks, irregular DNA forms [29,30,31], lipid species [32,33], and signal transduction pathways [34,35,36]. PARP2 is primarily localized to the nucleus [29,37] and is highly expressed in the testes [29], thymus, central nervous system, liver, cortex of the kidney, stomach, and intestinal epithelia [26]. PARP2 was first described as a DNA remodeling and repair enzyme [26,29,38,39,40] with a role in tumor biology [41,42,43,44,45]. Since then, other physiological and pathophysiological roles were identified for PARP2 in spermiogenesis [40,46], immune function [47,48,49,50,51], oxidative injury [27,52,53], metabolic and mitochondrial regulation [33,54,55,56,57], autophagy [58], cancer cachexia [59,60], and transcription [33,48,49,50,54,56,61] (we refer the readers to thorough reviews [35,36]). Importantly, the inhibition of PARP2 is responsible for many of the side effects of clinical PARP inhibitors [49,50].
PARP2 is involved in mitochondrial and metabolic regulation. The interactions are multipronged; nevertheless, from the perspective of our study, two biological processes are vital for understanding the interplay between SIRT1 and PARP2 and the involvement of PARP2 in autophagy. SIRT1 is a NAD+-dependent protein deacetylase [62] that can deacetylate and, hence, induce key mitochondrial transcription factors, such as the peroxisome proliferator-activated receptor cofactor-1α (PGC1α) or the forkhead box protein O1 (FOXO1) [63,64,65,66,67]. PARP2 can induce SIRT1 expression and activity that consequently leads to mitochondrial biogenesis [27,55,57]. Furthermore, we recently showed that the genetic deletion or silencing of PARP2 blocks autophagy [58], which can influence mitochondrial morphology and mitochondrial quality control. In that study, our aim was to assess how PARP2 affects mitochondrial morphology.

2. Materials and Methods

2.1. Chemicals

All chemicals, glutathione (GSH), N-acetyl-L-cysteine (NAC), and MitoTEMPO, were from Sigma-Aldrich (St. Louis, MO, USA). GSH (cat. no. G4251) and NAC (cat. no. A7250) antioxidants were used at a final concentration of 5 mM for 48 h. A mitochondria-targeted antioxidant MitoTEMPO (cat. no. SML0737) was used at a concentration of 10 µM for 48 h.

2.2. Cell Culture

PARP2-silenced C2C12 cells were described in [55]. C2C12 cells were cultured in DMEM (cat. no. D6429, Sigma-Aldrich, 4500 mg/L glucose) containing 10% FBS, 1% penicillin/streptomycin, and 2 mM L-glutamine at 37 °C with 5% CO2.
PARP2-silenced HepG2 cells were described in [54]. HepG2 cells were cultured in DMEM (cat. no. D5546, Sigma-Aldrich, 1000 mg/L glucose) containing 10% FBS, 1% penicillin/streptomycin, and 2 mM L-glutamine at 37 °C with 5% CO2.
PARP2 was silenced by specific shRNA in both cell lines and maintained over extended periods by selection with 2.5 µg/mL of puromycin for C2C12 cells and with 0.25 µg/mL of puromycin for HepG2 cells. Cells that harbor the plasmid expressing the small hairpin RNA against PARP2 (i.e., PARP2 silenced) are referred to as shPARP2, while cells that harbor the plasmid expressing a small hairpin RNA that has no target in human or murine cells (controls) are referred to as scPARP2. Both cell lines were established earlier [54,55], and the effectiveness of silencing was verified before experimentation (Figure 1A,B).

2.3. Transient Transfection

Silencer Select siRNAs were purchased from Thermo Fisher Scientific (Walthan, MA, USA). SiRNAs targeting PARP2 (cat. no. 4390771, ID: s62056 as #1, s62057 as #2, s62058 as #3), SIRT1 (cat. no. 4390771, ID: s96766), PARP1 (cat. no. 4390771, ID: s62053 as #1, s62054 as #2, s62055 as #3), PARP3 (cat. no. 4390771, ID: s108205 as #1, s108206 as #2, s108207 as #3), and negative control (cat. no. 4390843) were used. Cells were plated in 24-well plates and transfected with siRNA at a final concentration of 30 nM using Lipofectamine RNAiMax reagent (cat. no. 13778075, Invitrogen, Carlsbad, CA, USA). Cells were assayed 48 h post-transfection.

2.4. In Vitro Cell Proliferation Assay (SRB Assay)

Cellular proliferation was determined using Sulphorhodamine B (SRB) assay, as described in [68].

2.5. Detection of Cell Death

To evaluate changes in apoptotic and necrotic cell death, an FITC Annexin V/Dead Cell Apoptosis Kit (cat. no. V13242, Invitrogen) was used according to the manufacturer’s instructions. Cells were seeded into 6-well plates and treated with the different chemicals, as stated. Then, cells were collected and stained with 5 µL of FITC annexin V and 100 µg/mL of PI for 15 min at room temperature. Cells were analyzed by flow cytometry (FACS Calibur, Becton Dickinson Biosciences, San Jose, CA, USA), and data were analyzed using BD CellQuest Pro software v5.2 (Becton Dickinson Biosciences).

2.6. Determination of Cellular ATP Level

Cells were seeded into 6-well plates and treated, as indicated. ATP levels were determined using an ATP Assay Kit (cat. no. MAK190, Sigma-Aldrich, St. Louis, MO, USA). ATP concentration was measured in 96-well black plates using a fluorimeter (Spark 20M, Tecan Life Sciences, Männedorf, Switzerland). ATP levels were normalized to protein content, and normalized readings are presented.

2.7. MitoTracker Red Staining

Cells grown on glass coverslips were treated with the specified chemicals, as indicated, or transfected with the indicated siRNAs (see Figure legend). Mitochondria were stained with MitoTracker Red, as described in [69]. Confocal images were acquired with a Leica TCS SP8 confocal microscope (Leica, Wetzlar, Germany) and LAS X software v3.5.5.19976 (Leica). Processed images were analyzed using ImageJ v1.44 software with Mito-Morphology Macro [70], yielding the mitochondrial number, content, circularity, and form factor. Form factor is derived from the area-to-perimeter ratio [71]; hence its decrease would signify fragmentation. Circularity increases if the shape of an object is closer to a circle; hence, increased circularity suggests that the mitochondria are not elongated, which is a feature of a disassembled mitochondrial network. Perimeter is a similar term; a decrease in perimeter indicates smaller mitochondria. For co-localization analysis and the assessment of the Pearson correlation coefficient, ImageJ software with EzColocalization plug-in was used [72].

2.8. Immunofluorescence

Immunofluorescence was described in [58]. Antibodies used in immunofluorescence are listed in Table 1.

2.9. Total RNA Preparation and Reverse Transcription–Quantitative PCR (RT-qPCR)

Total RNA preparation, reverse transcription, and qPCR were performed, as described in [58]. Expression was normalized to the geometric mean of murine 36B4 and cyclophilin values. Primers are listed in Table 2.

2.10. SDS-PAGE and Western Blotting

SDS-PAGE and Western blotting were described in [58]. Primary and secondary antibodies are listed in Table 3. Bands were quantified by densitometry using ImageJ software v1.44 [73], and densitometry data were analyzed by statistical methods.

2.11. Determination of Lipid Peroxidation (TBARS Assay)

Lipid peroxidation was assessed by determining the production rate of thiobarbituric acid-reactive substances (TBARS) similar to [74].

2.12. Determination of the Oxygen Consumption Rate (OCR)

The oxygen consumption rate was determined using the XF96 Flux Analyzer (Agilent Technologies, Santa Clara, CA, USA). Cells were seeded into 96-well assay plates and treated with the indicated concentration of different chemicals for 48 h (see Figure legend). After recording the baseline, the OCR was recorded every 5 min, and 50 µM etomoxir (cat. no. E1905, Sigma-Aldrich) was used for determining the fatty acid oxidation. Data were normalized to protein content, and normalized readings are displayed.

2.13. Measurement of Superoxide Production (DHE Staining)

Superoxide production was measured using dihydroethidium (DHE) staining. Cells were seeded into 6-well plates for 1 day. Cells were stained with 2.5 µM DHE (cat. no. D7008, Sigma-Aldrich) for 30 min, and fluorescence was analyzed by flow cytometry (FACSCalibur, Becton Dickinson Biosciences, San Jose, CA, USA). For data evaluation, BD CellQuest Pro software v5.2 (Becton Dickinson Biosciences) was used.

2.14. Electron Microscopy

Data from a previous study [58] were re-analyzed. All relevant methodology can be found in [58].

2.15. Statistical Analysis

Statistical analyses were performed using GraphPad Prism v8 software (GraphPad Software, San Diego, CA, USA). The number of repetitions for each experiment is indicated in the figure legends. All groups were checked for normal distribution. For comparing two groups, two-sided Student’s t-tests were applied. For multiple comparisons, one-way ANOVA was conducted, followed by Tukey’s post hoc test (to compare all possible combinations) or Dunnett’s post hoc test (to compare data to one selected group). The levels of significance are indicated in figure captions; n denotes the number of biological replicates.

3. Results

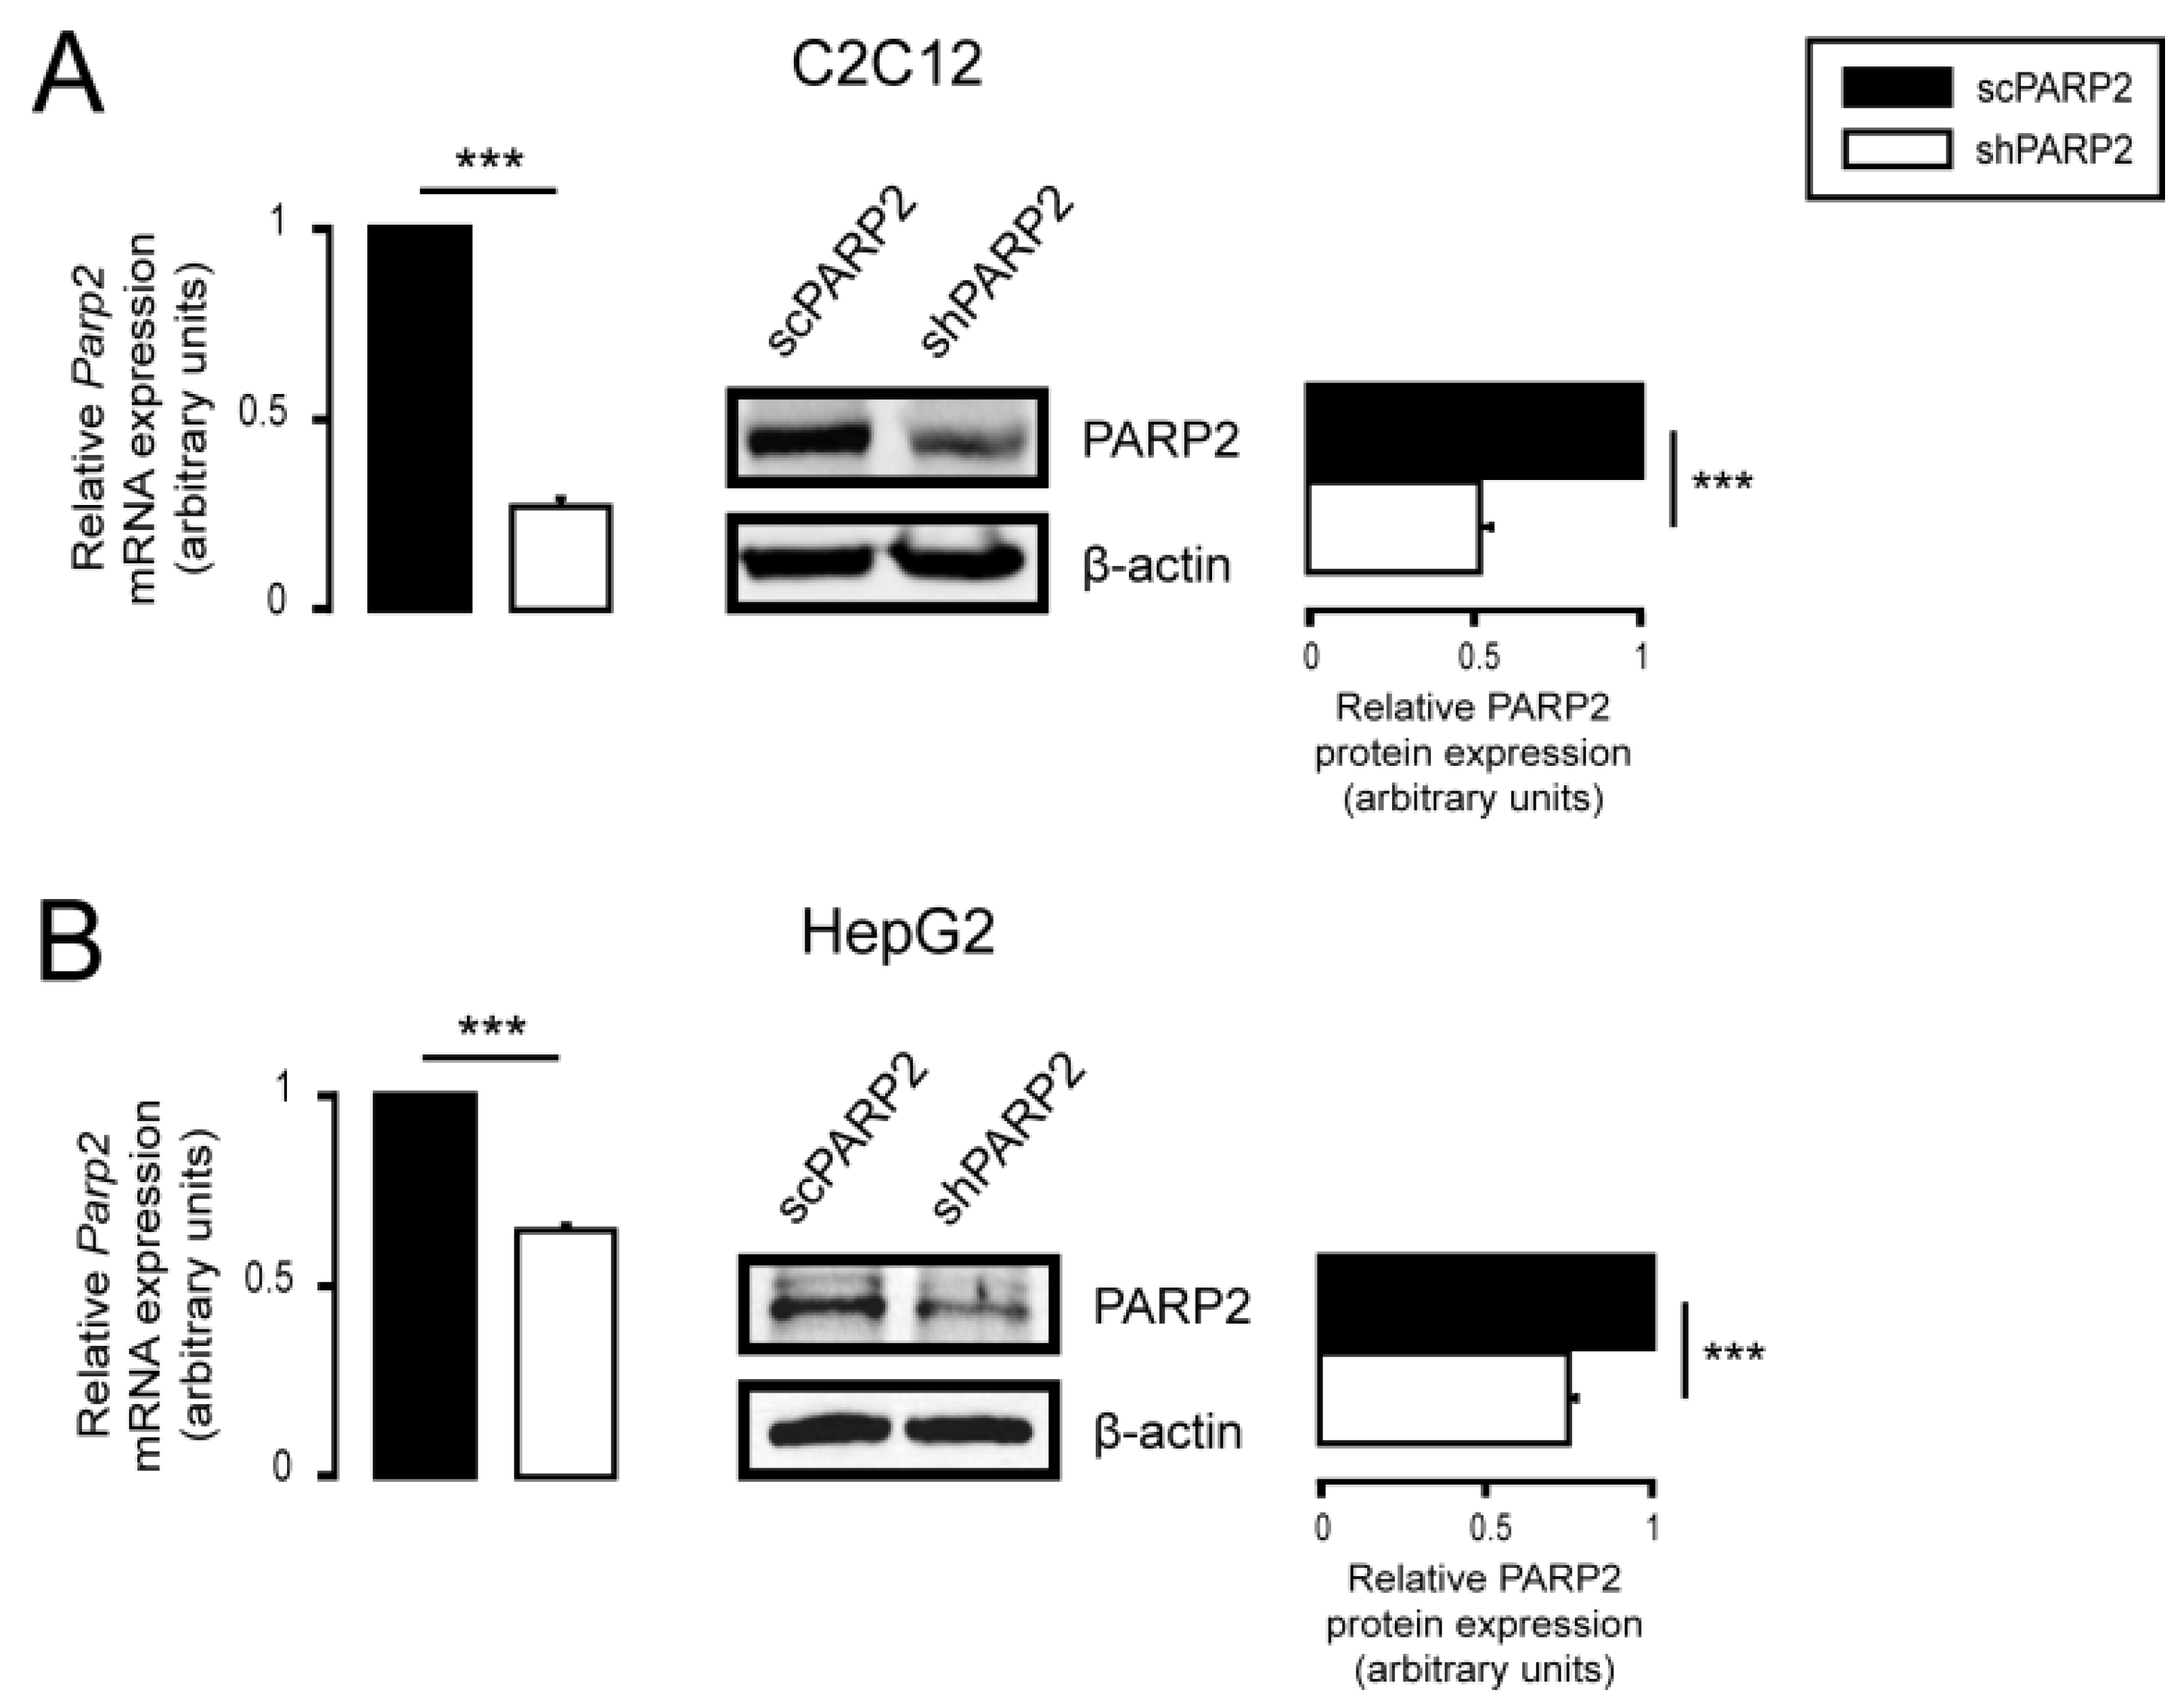
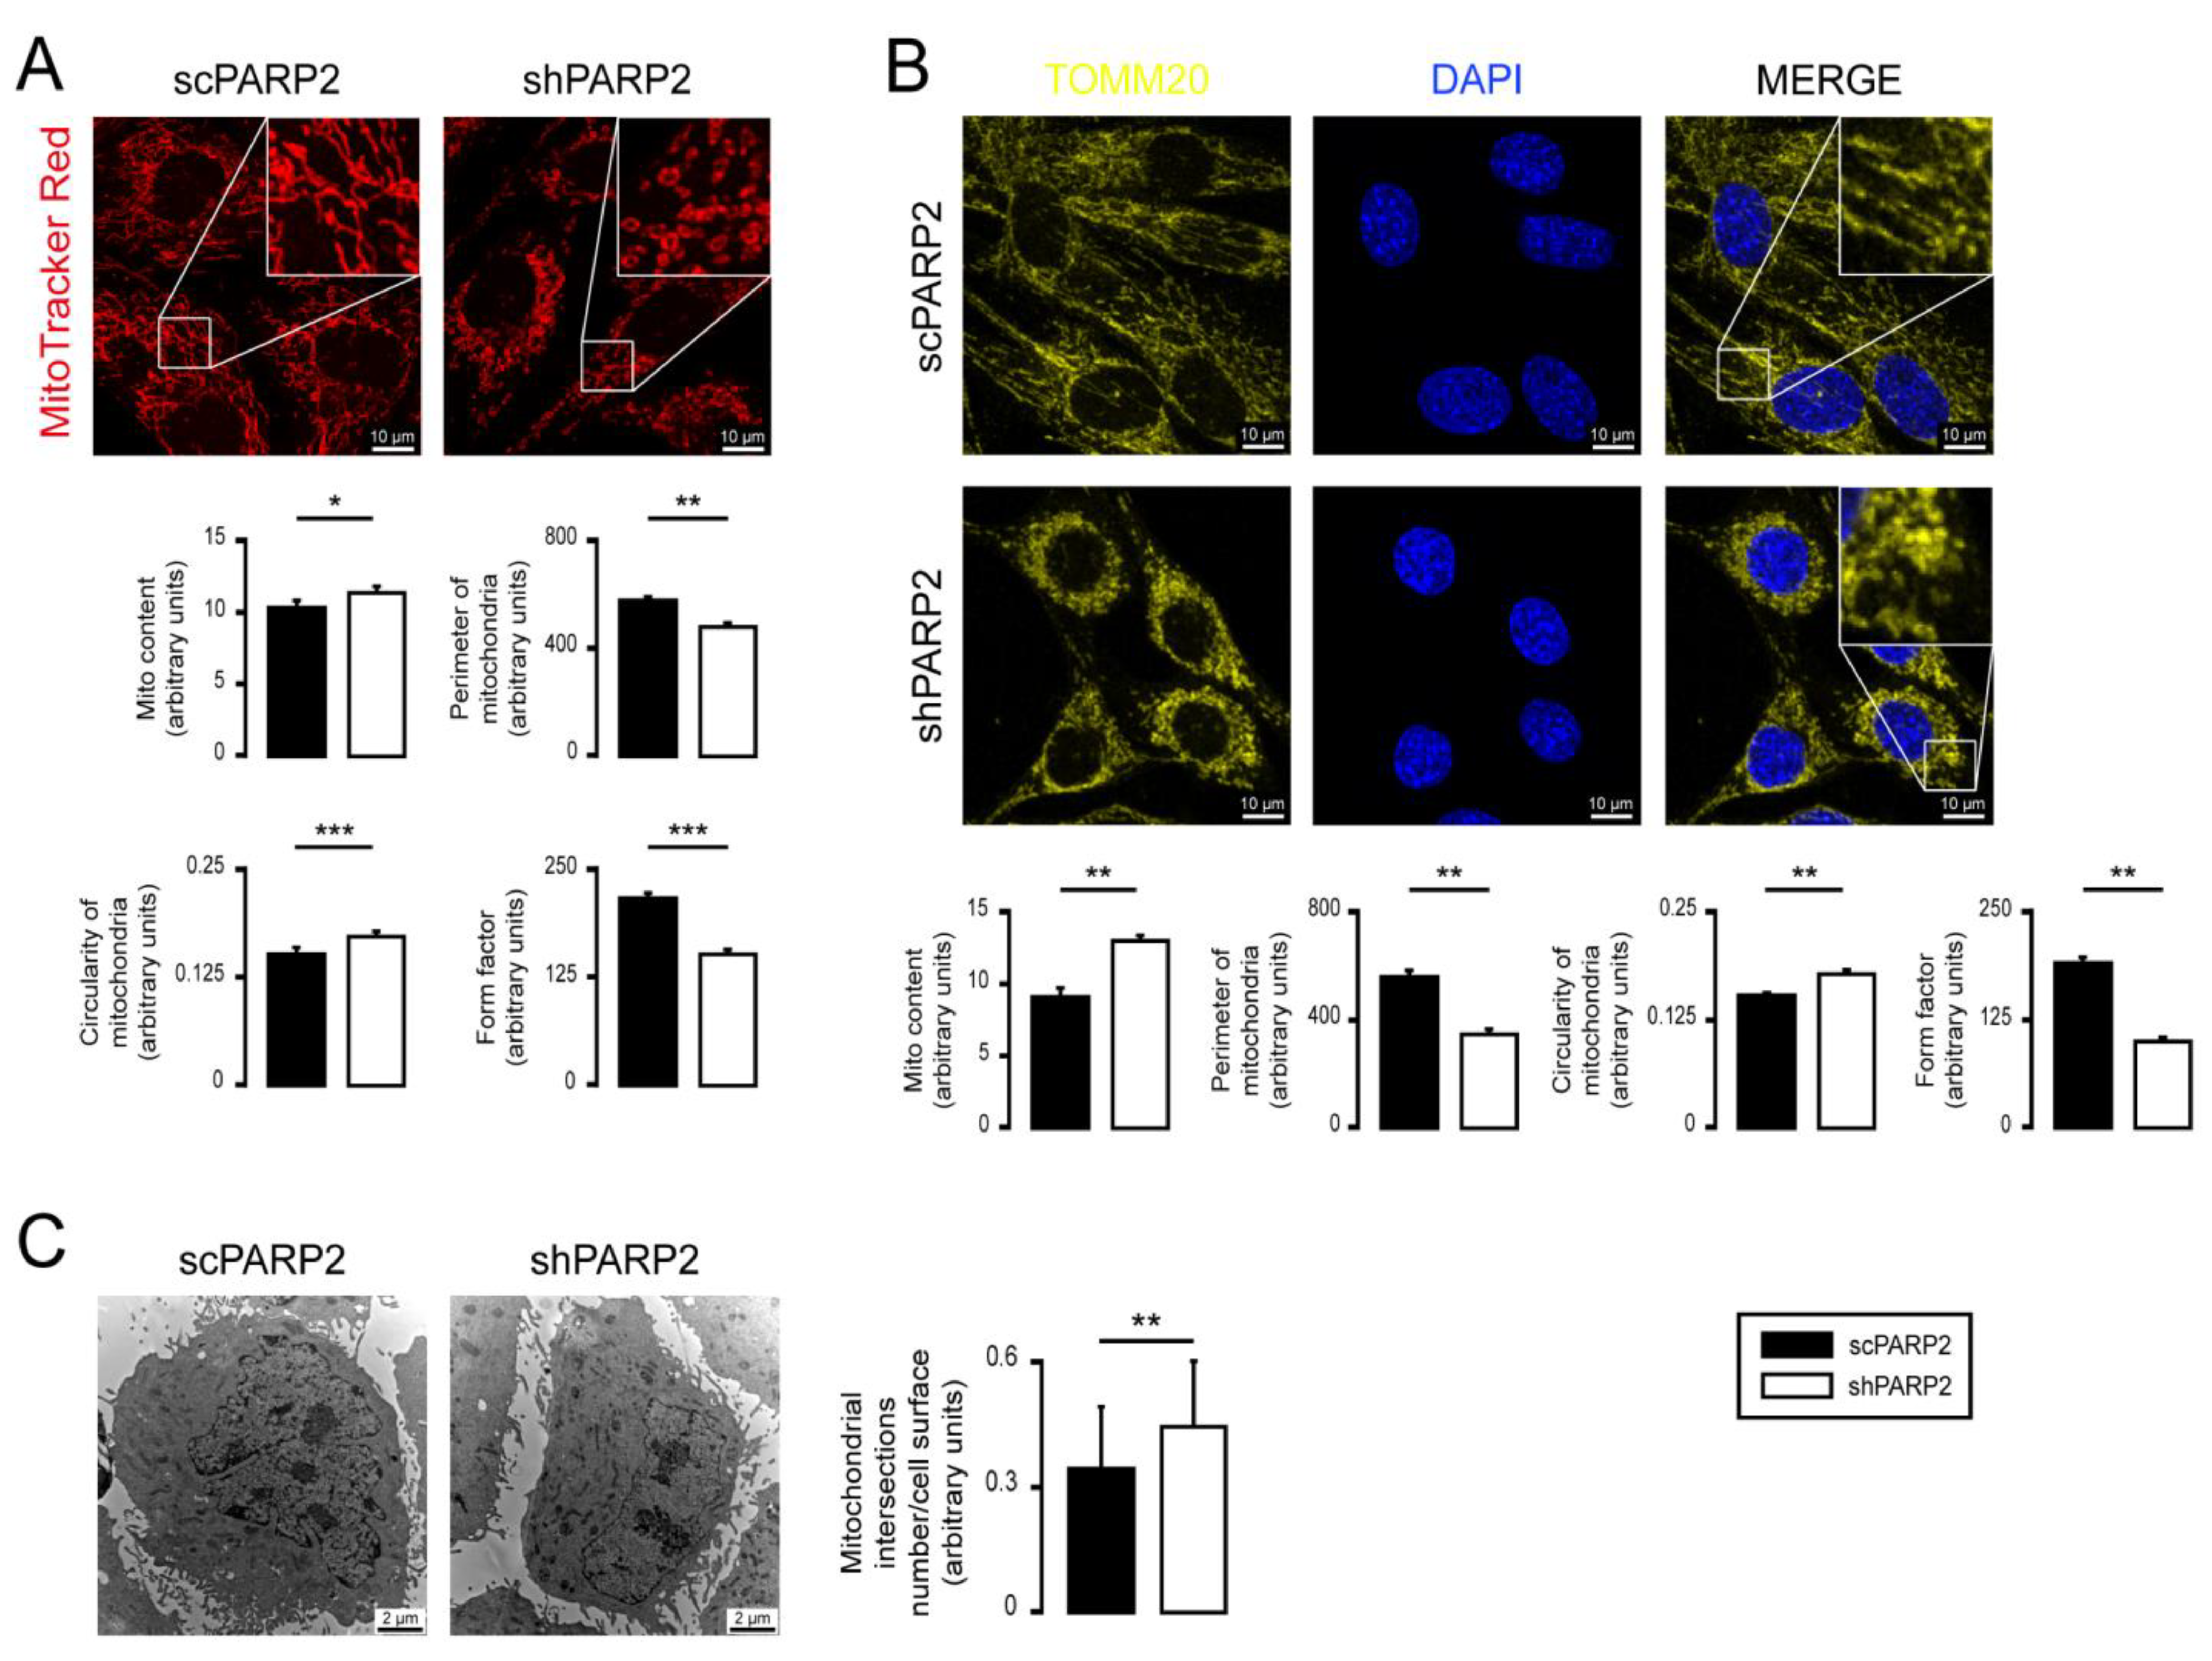
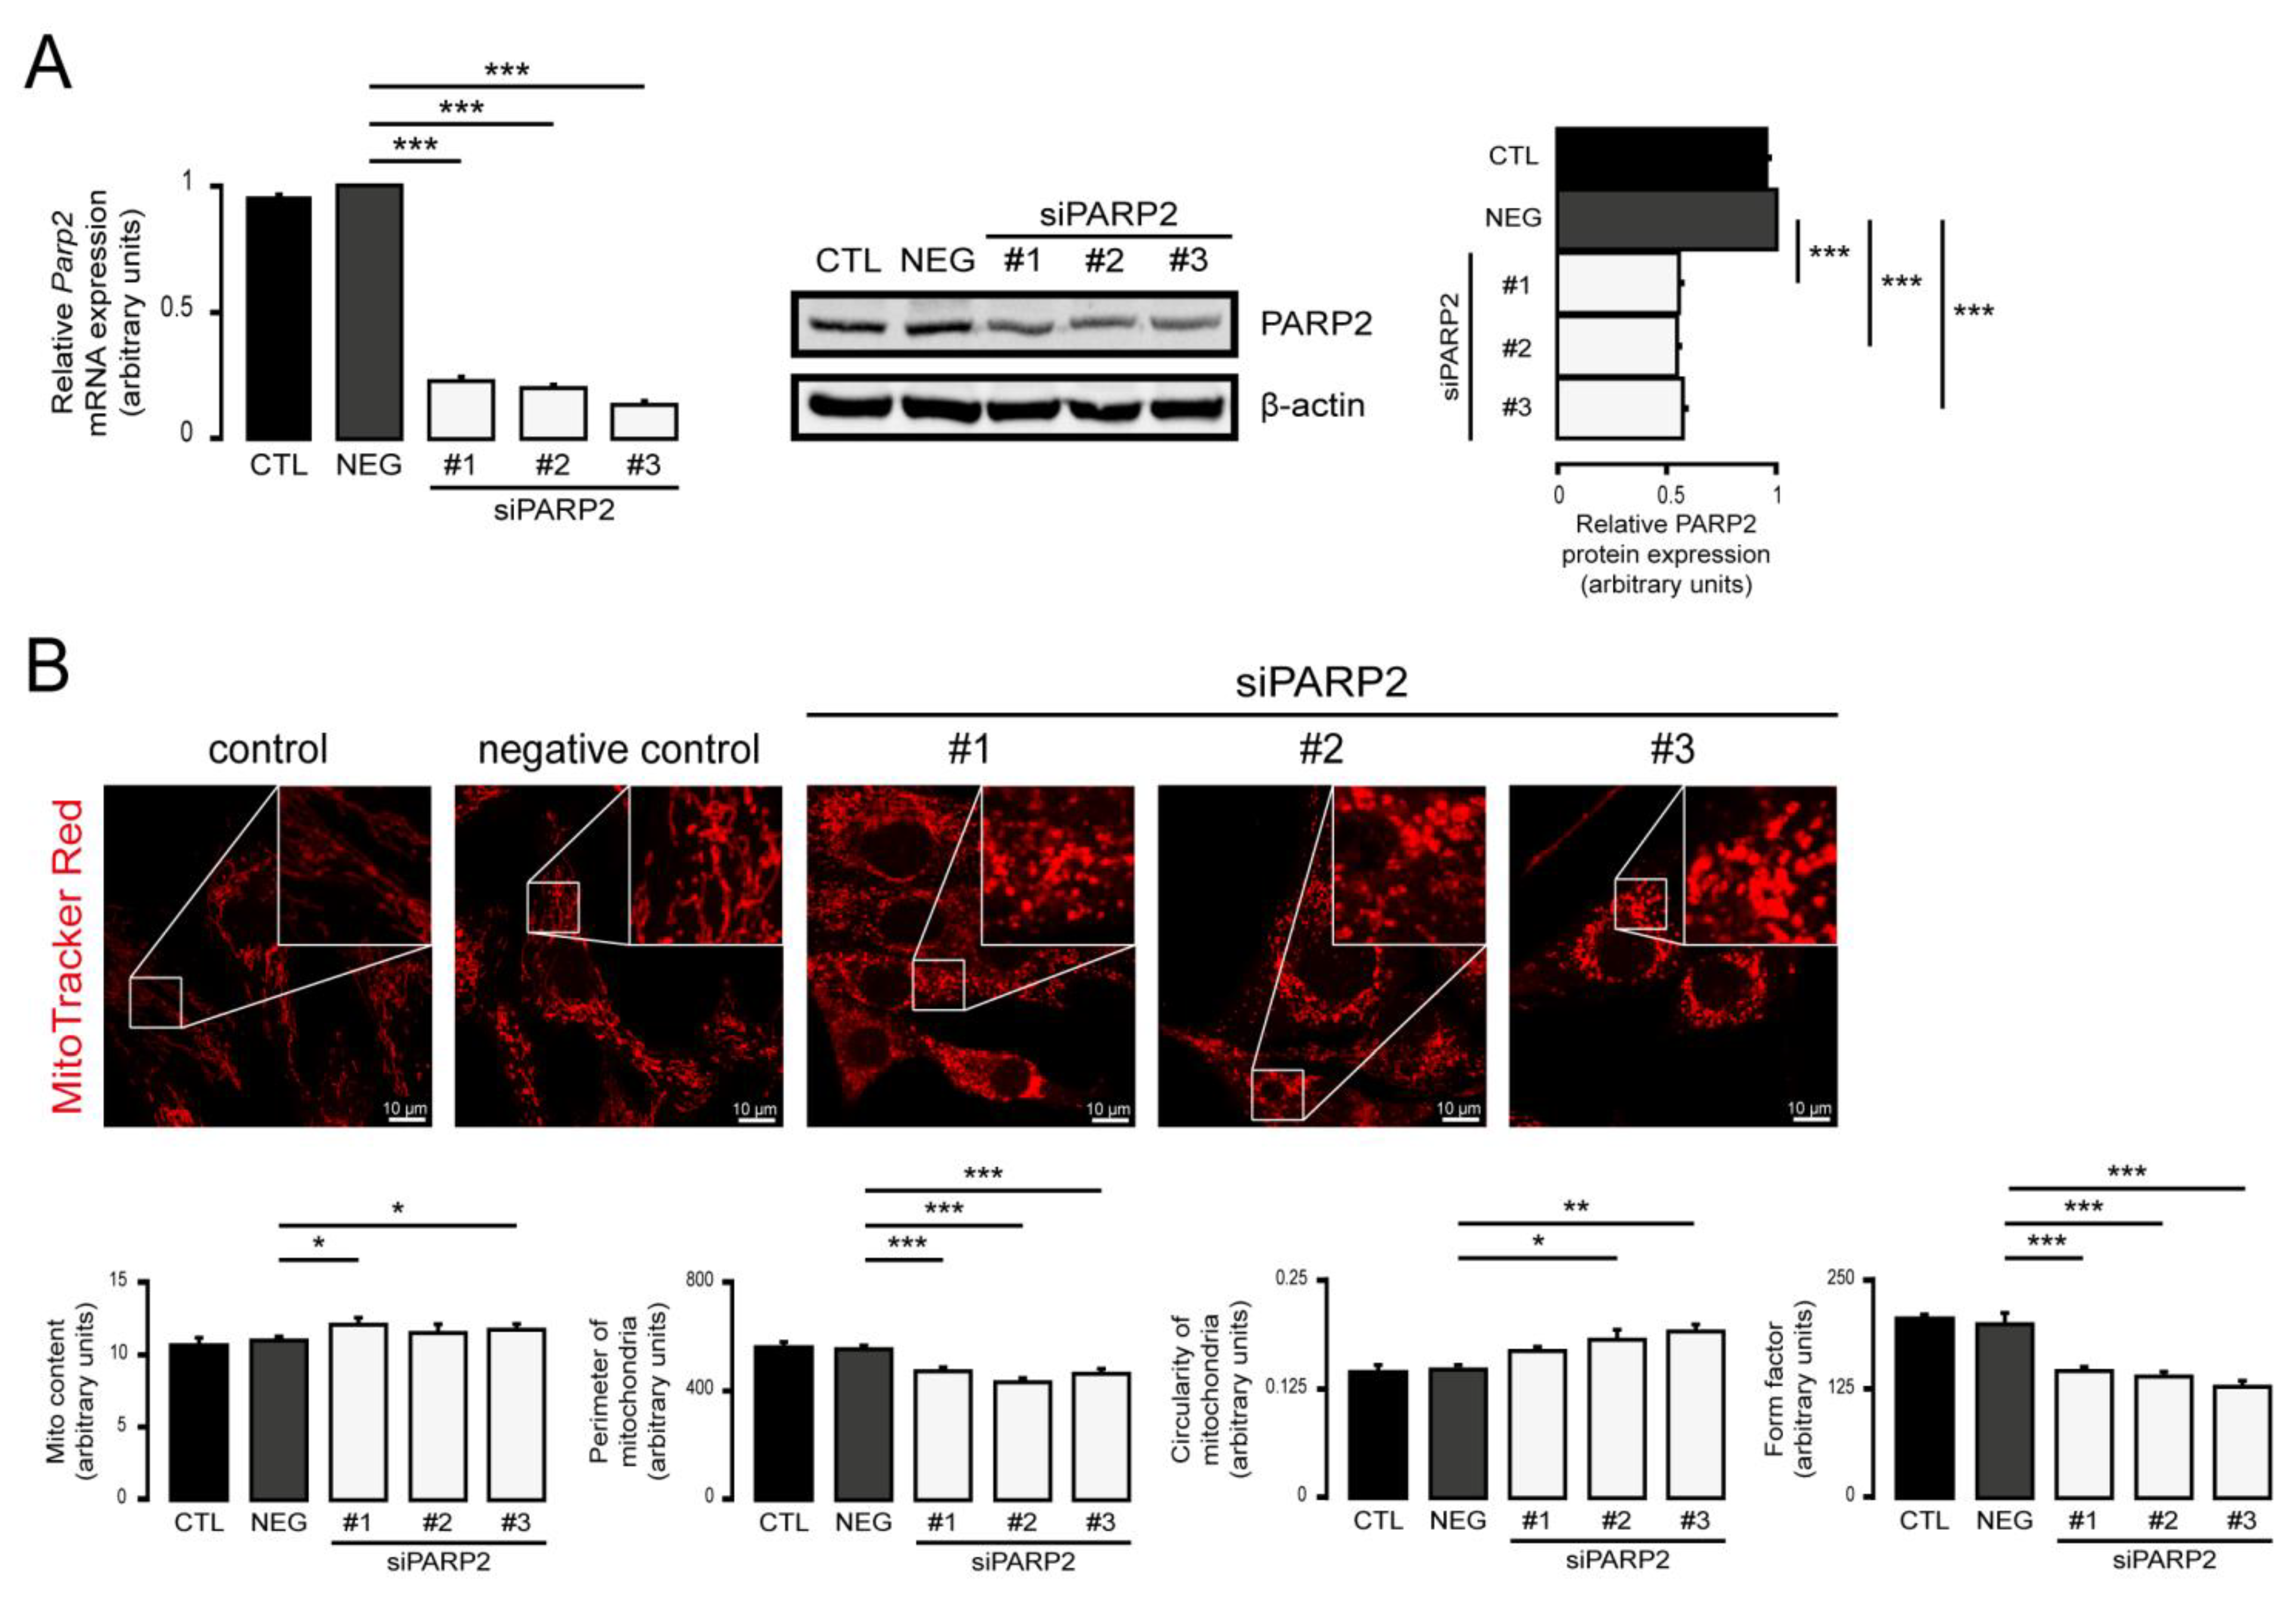
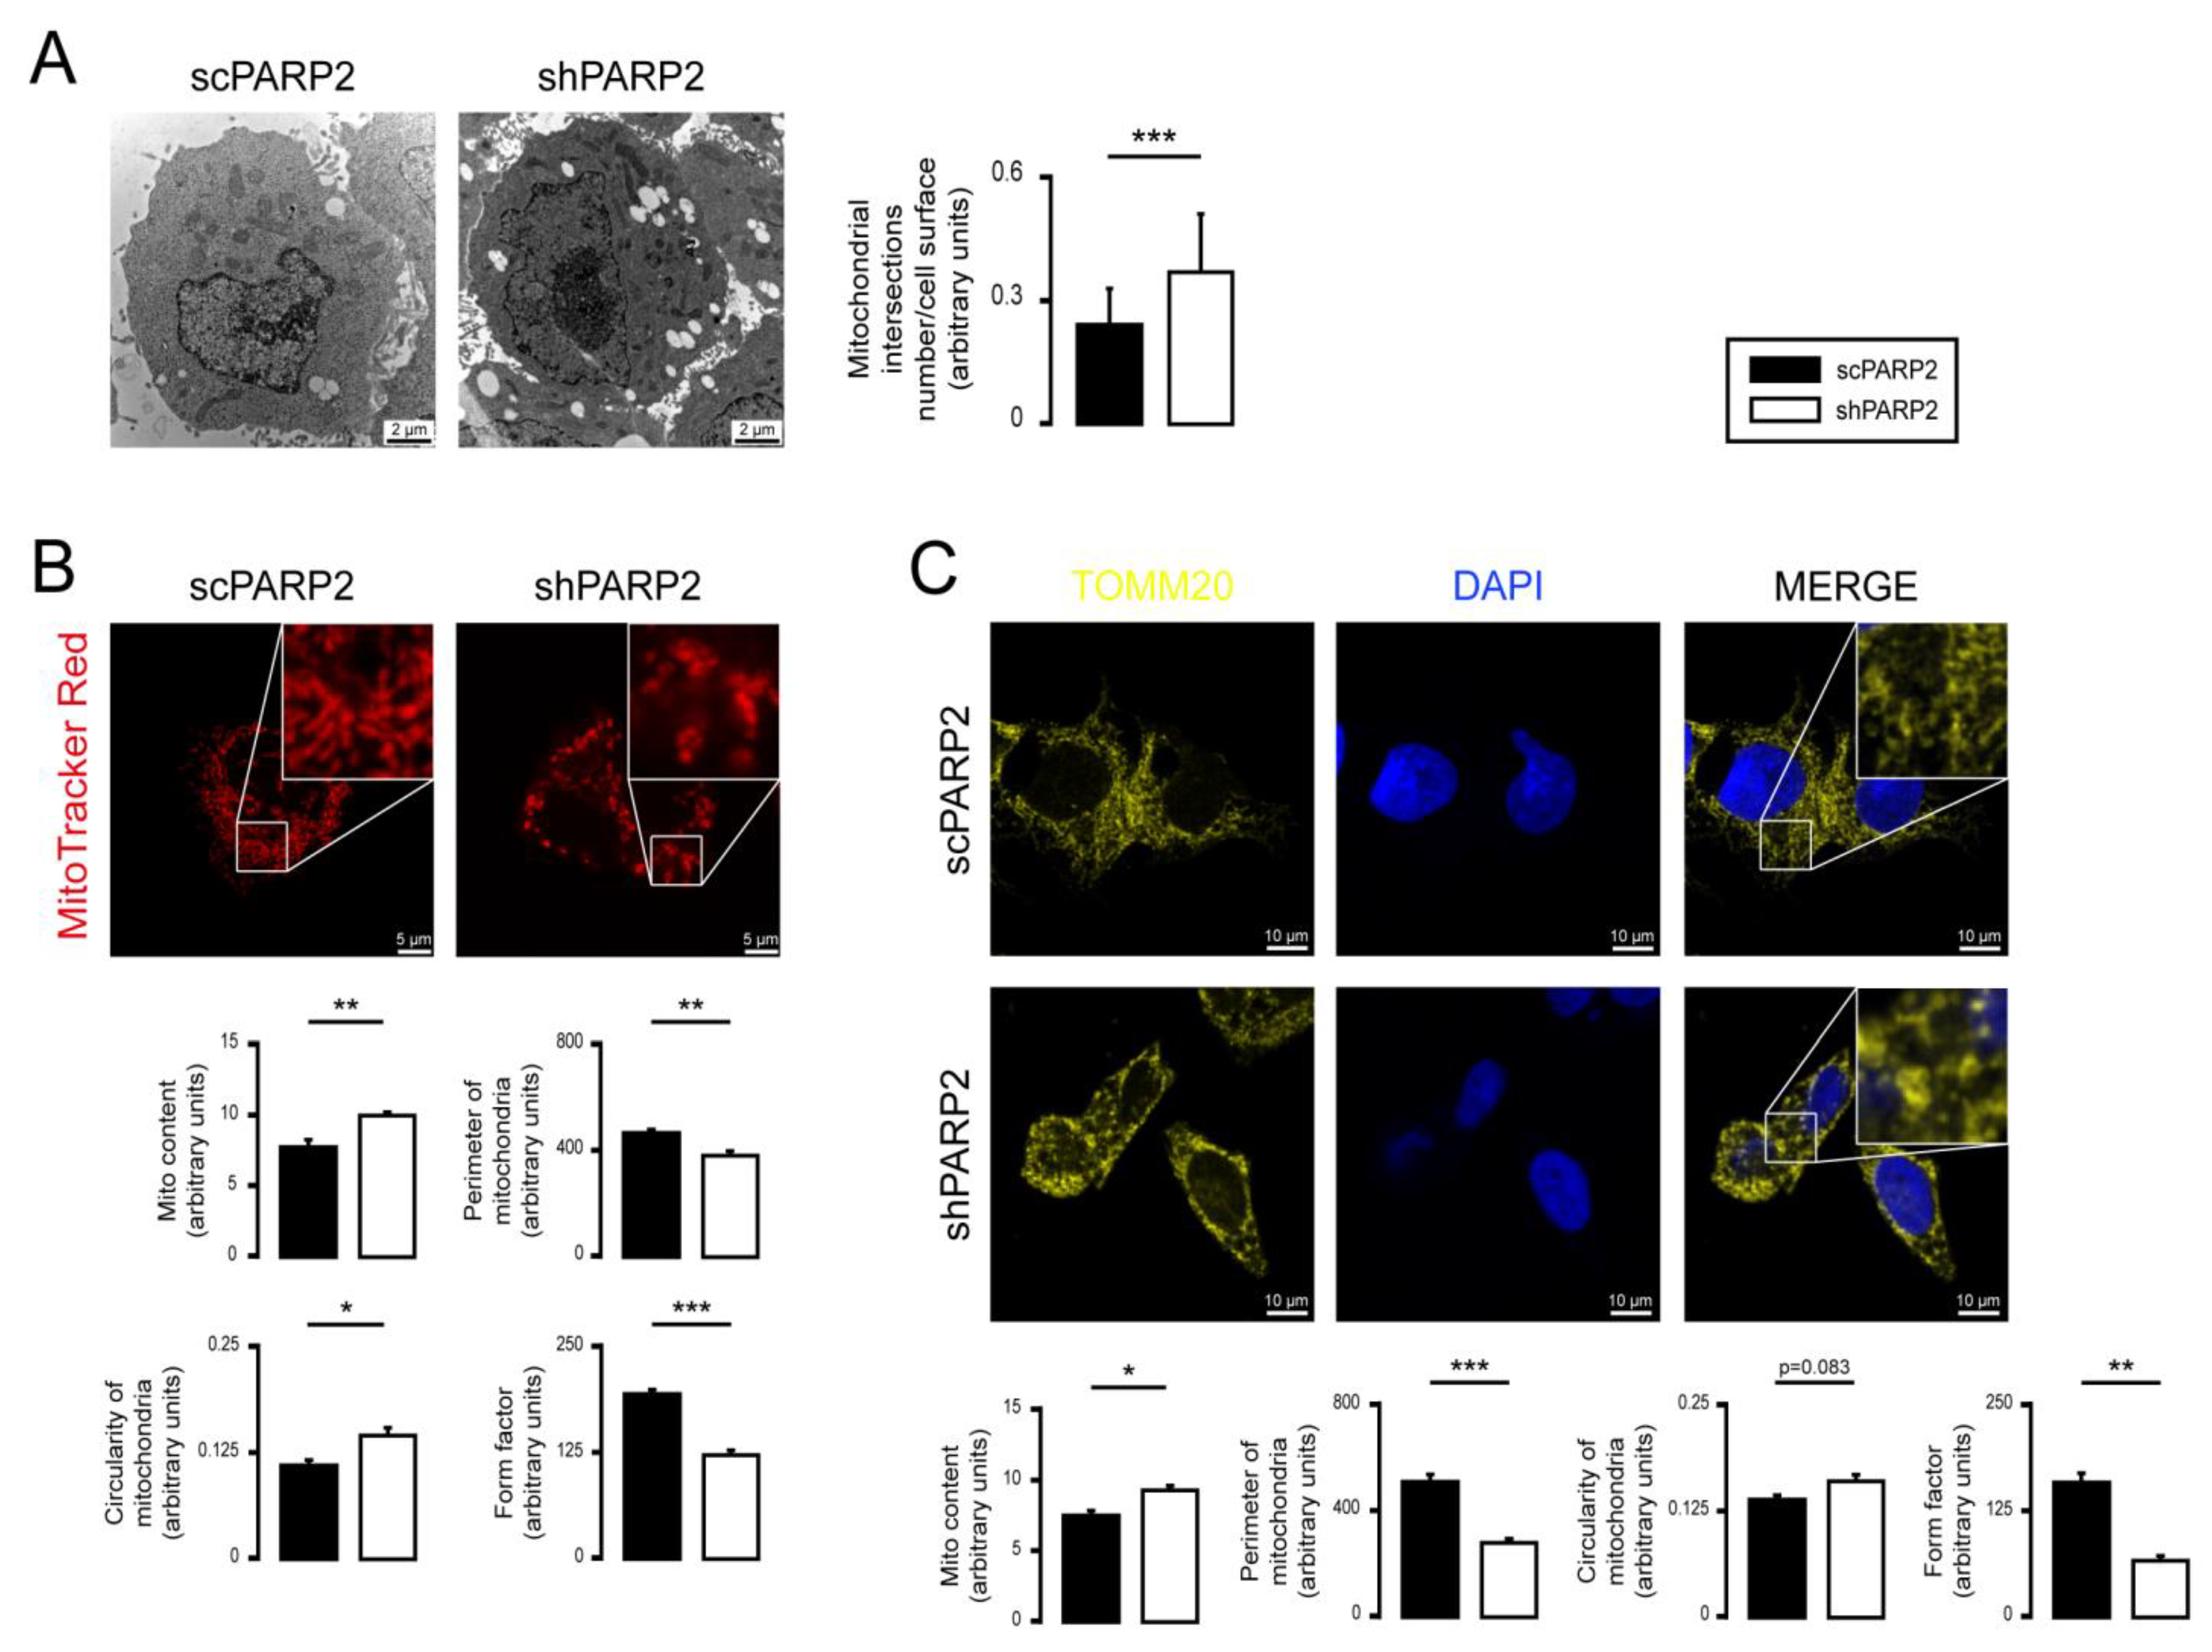
3.1. Silencing of PARP2 Leads to Fragmented Mitochondria

We assessed the mitochondrial morphology in scPARP2 and shPARP2 C2C12 myoblasts. Silencing of PARP2 induced the mitochondrial content in cells (a readout called “Mito Content”), as visualized by Mitotracker Red (Figure 2A) and TOMM20 immunostaining (Figure 2B), in good agreement with previous observations [27,55,57]. In addition, the silencing of PARP2 resulted in fragmentation of the mitochondrial network, marked by increased circularity and decreased individual mitochondria perimeters and form factors (Figure 2A,B). We re-analyzed electron microscopy sections from a previous study [58] and found that the number of mitochondrial cross sections increase in cells, which indicates the fragmentation of mitochondria (Figure 2C). Acute silencing of PARP2 by siRNA in C2C12 cells led to the induction of mitochondrial content and fragmentation of the mitochondrial network, similar to the findings in the established cell line (Figure 3A–C). Pharmacological inhibition of PARP1 by olaparib or nicotinamide was shown to induce mitochondrial fragmentation [20], similar to boosting in cellular NAD+ levels [75,76,77,78,79,80] that aligns well with our observations.

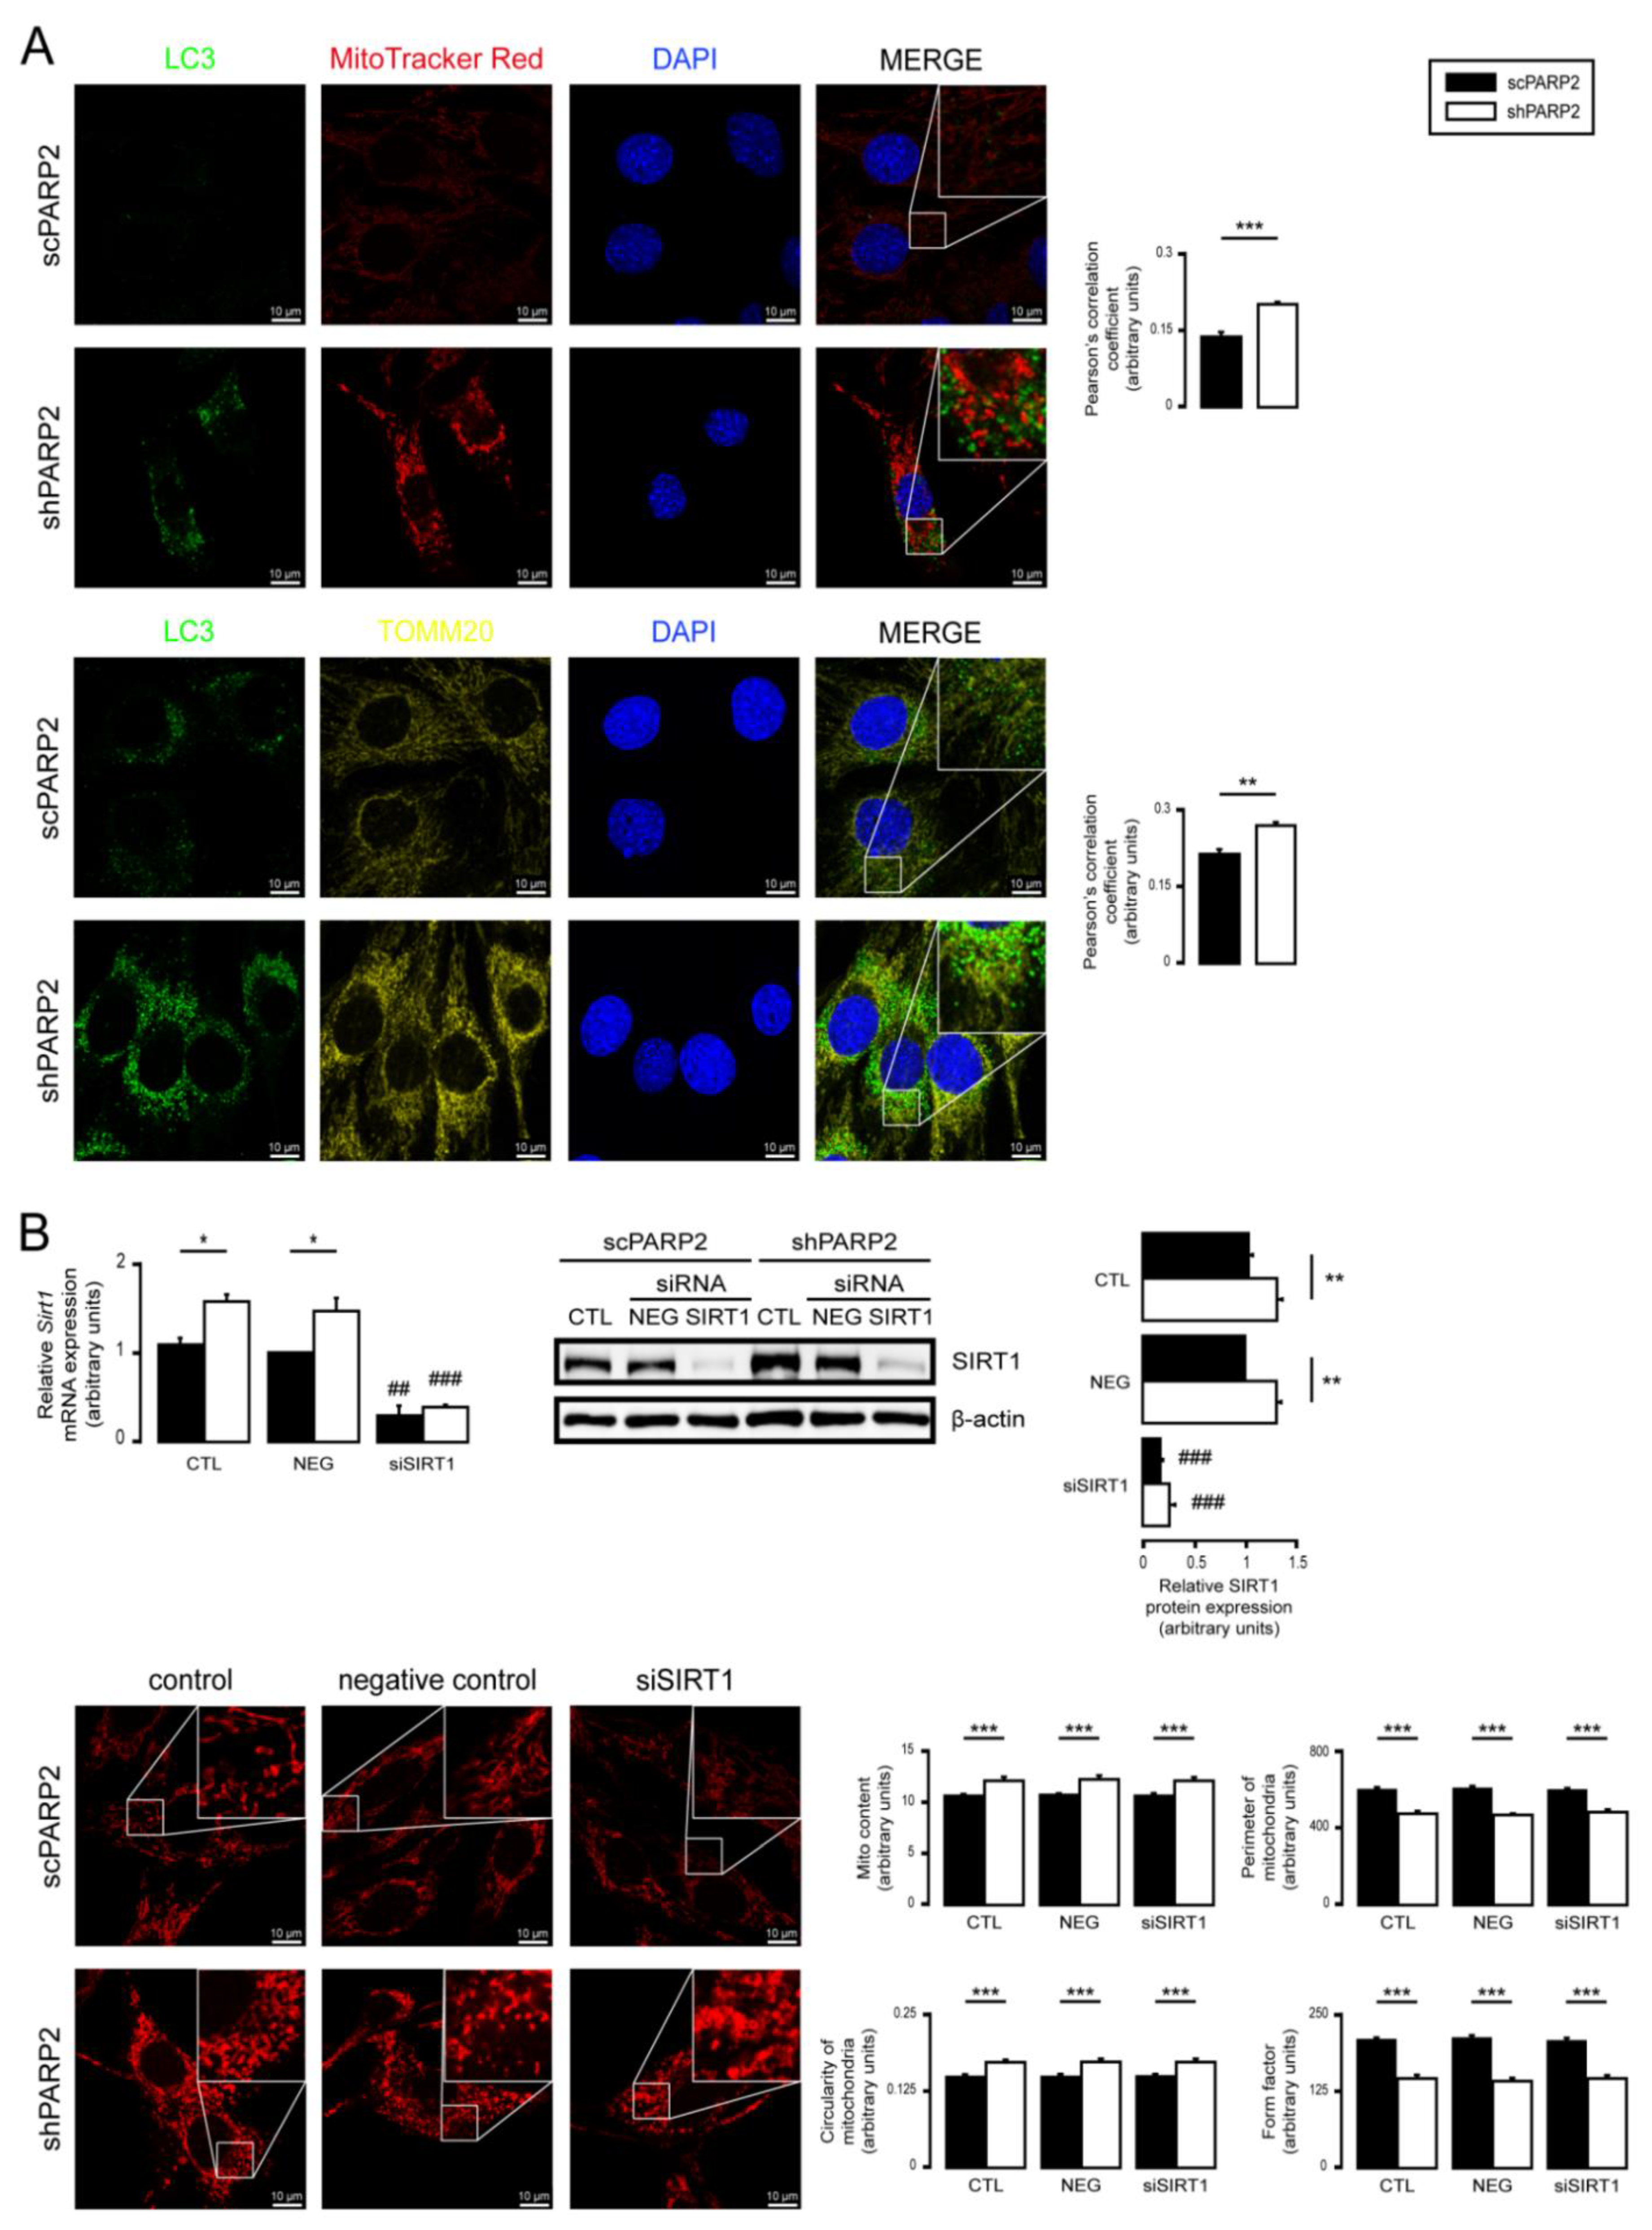
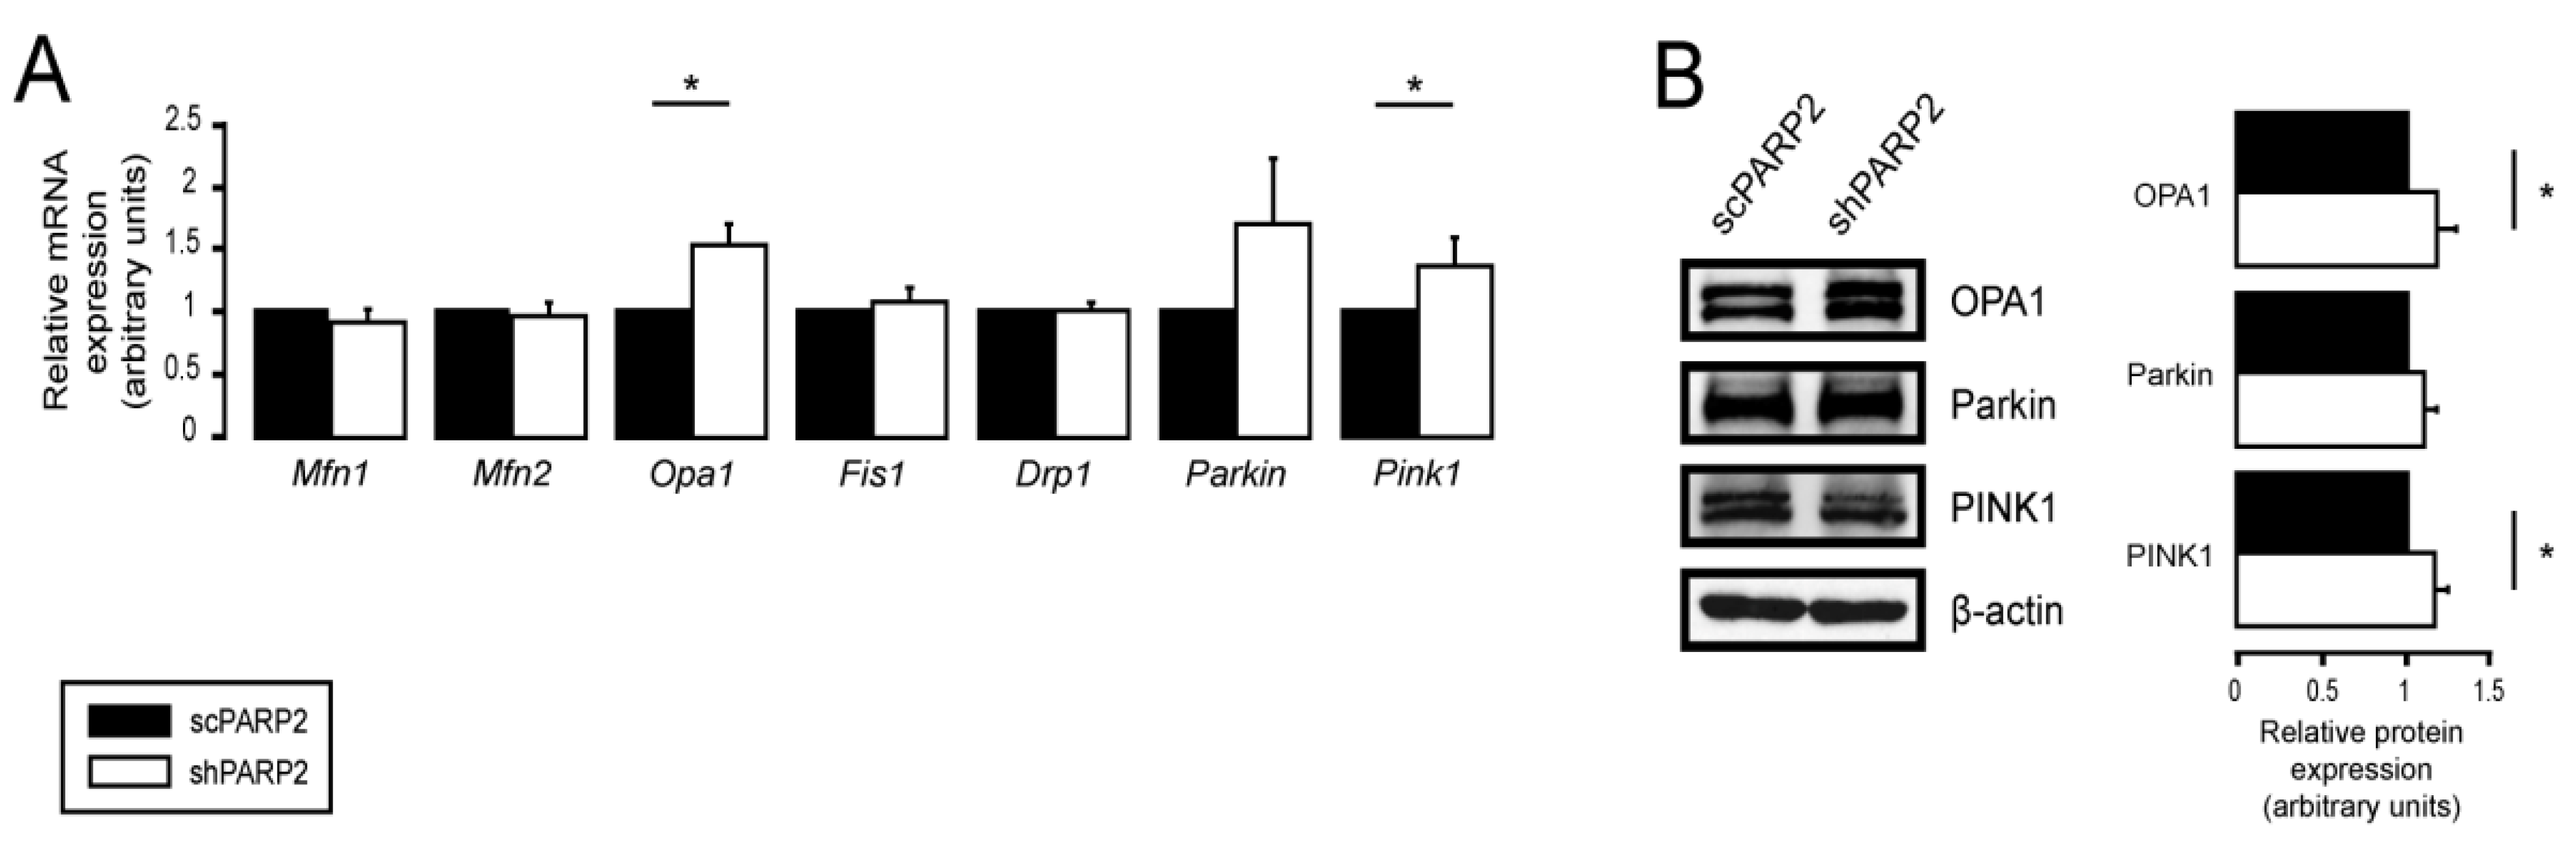
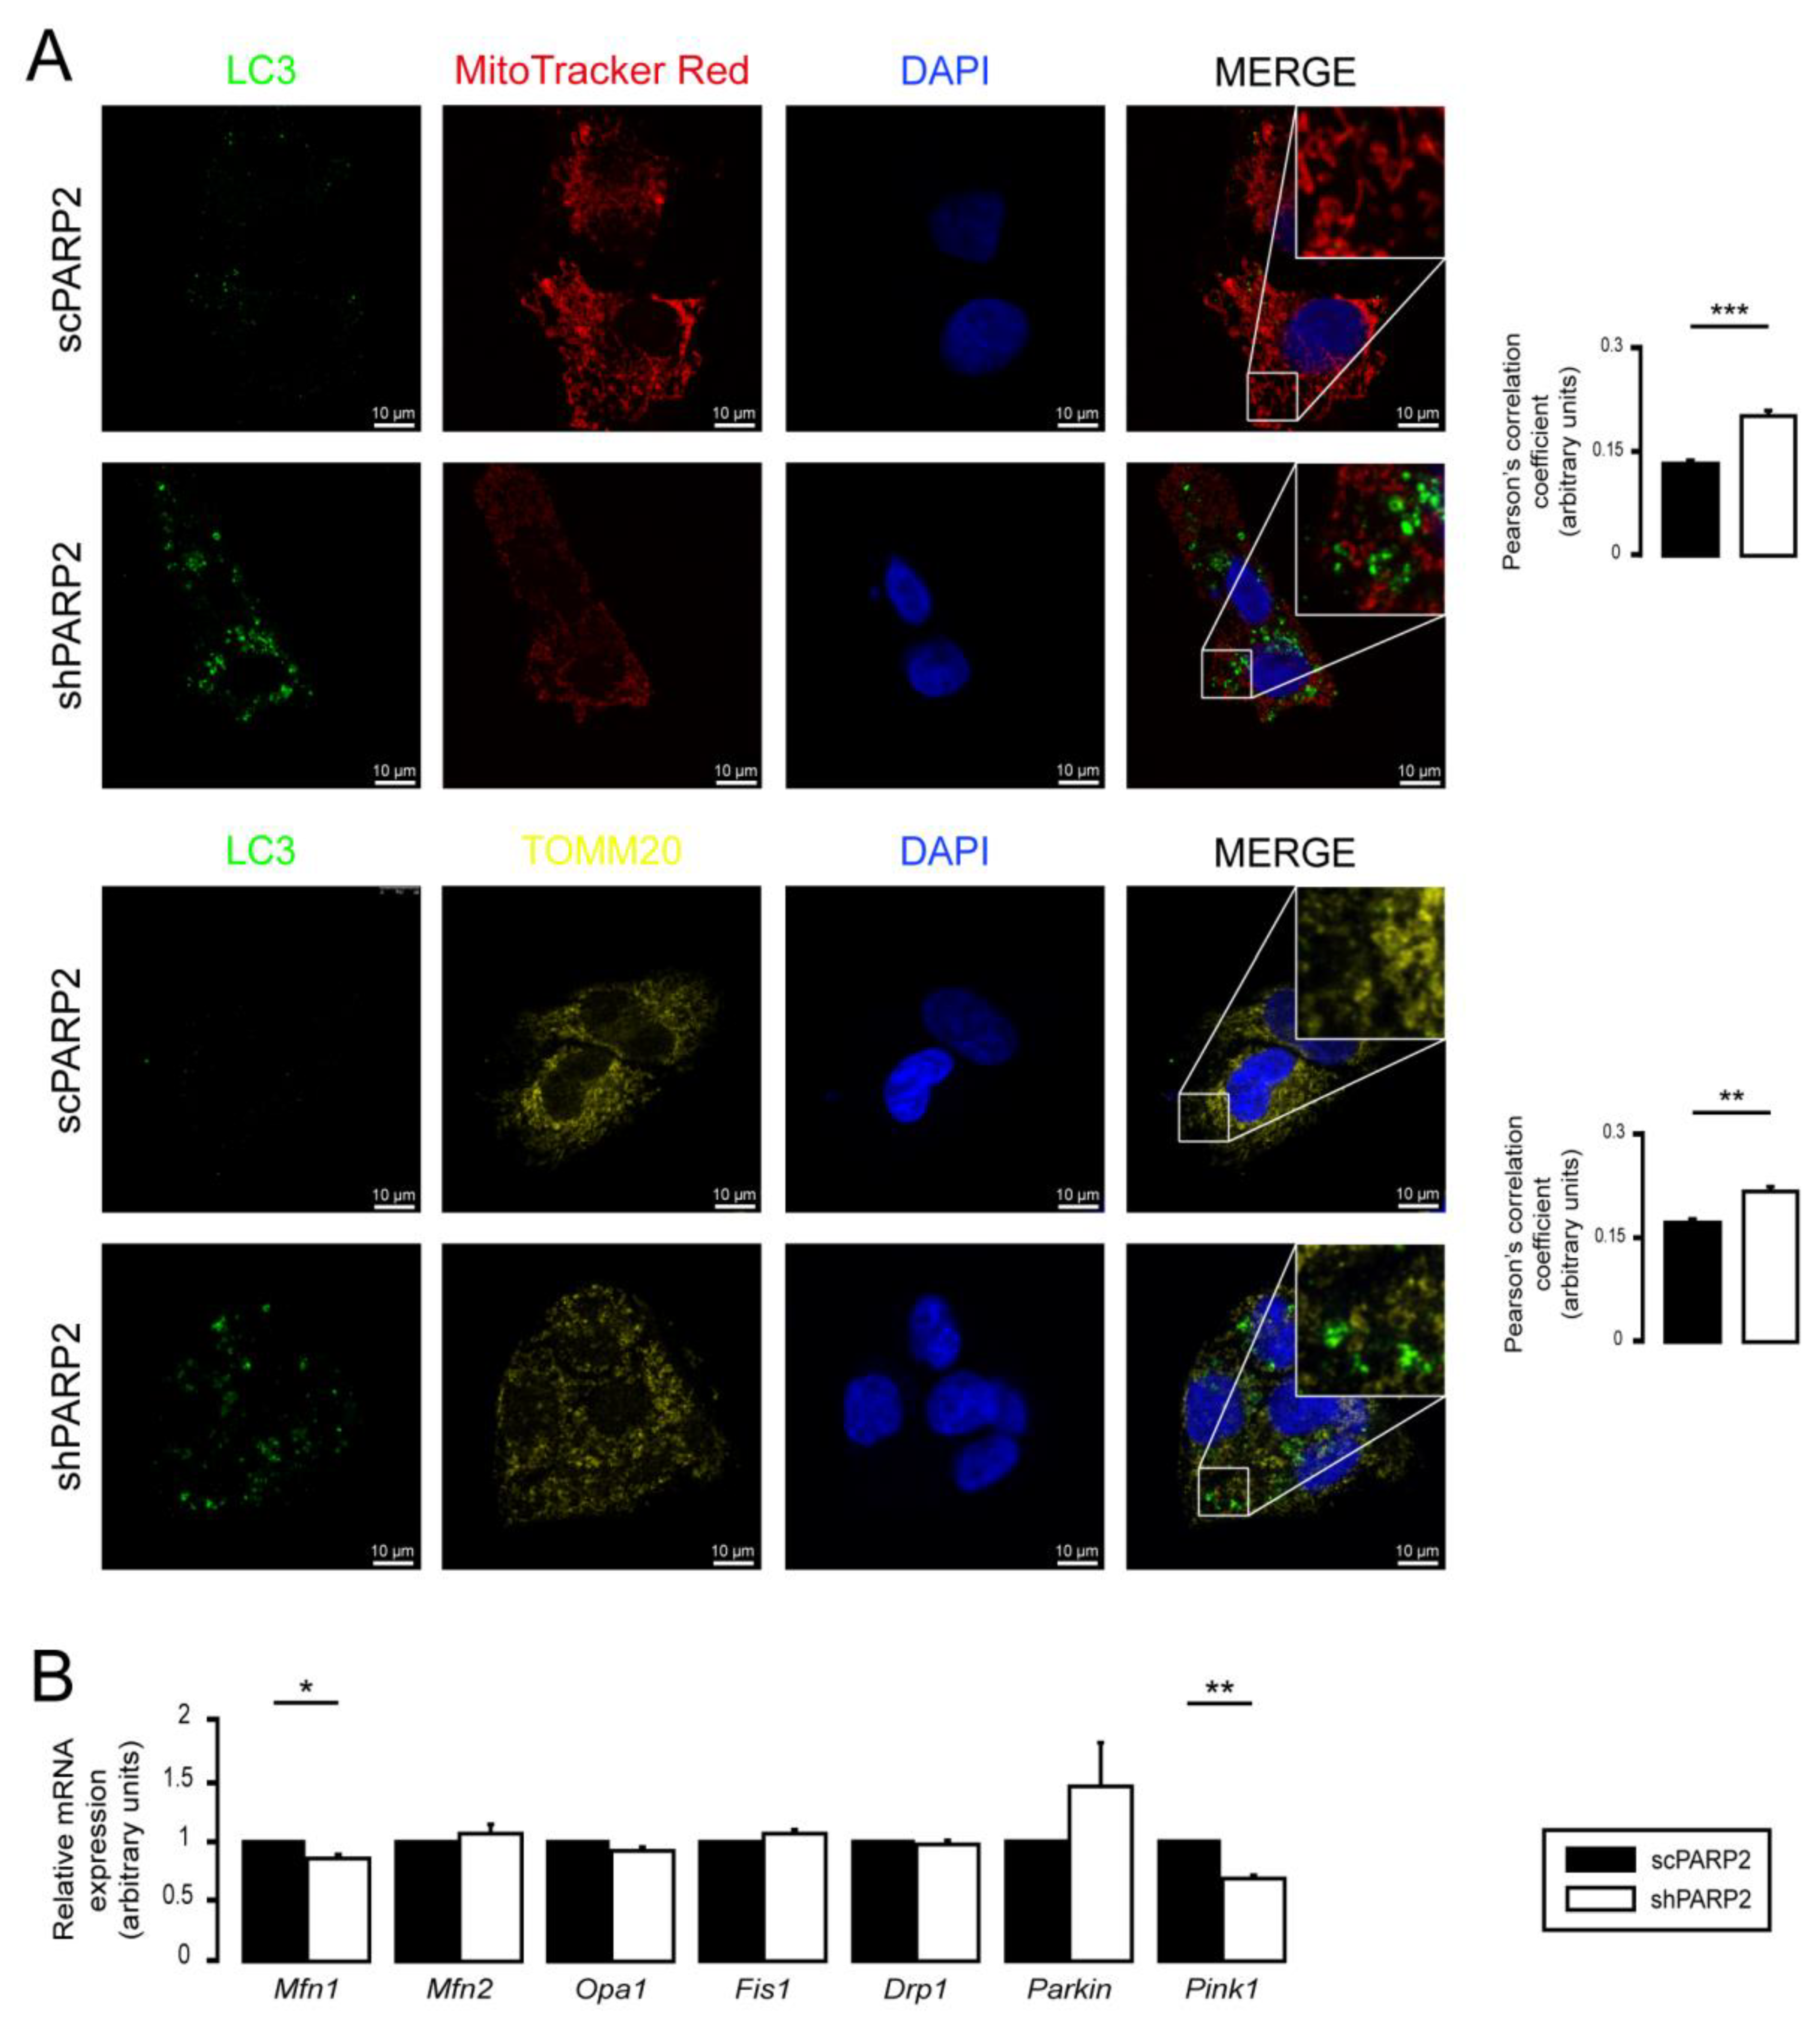
3.2. SIRT1 Activation, Mitophagy, mtUPR, and the Deregulation of the Mitochondrial Fusion–Fission System Are Not Involved in Mitochondrial Fragmentation in PARP2-Silenced Cells

Multiple parallel pathways can govern the fragmentation of the mitochondrial network. Therefore, we assessed these possibilities. The silencing of PARP2 blocks autophagy [58], which may affect mitophagy, leading to mitochondrial fragmentation. We assessed the co-localization of LC3, a marker of autophagic vesicles, and TOMM20, a mitochondrial marker; however, there was no overlap between the LC3+ (a marker for autophagosomes) and MitoTracker Red+ or TOMM20+ (both mitochondrial markers) features (Figure 4A). For a positive control demonstrating overlap of staining, C2C12 cells were co-stained with Tomm20 and MitoTracker Red (Supplementary Figure S1). Thus, PARP2 silencing did not increase mitophagy. SIRT1 activation is associated with PARP2 silencing [27,55,57], and SIRT1 regulates mitochondrial morphology [75,81]. However, genetic silencing of SIRT1 in shPARP2 cells did not reverse the changes to mitochondrial morphology (Figure 4B). We also checked the involvement of mtUPR, which was shown to play a role in mitochondrial biogenesis induced by pharmacological PARP inhibition [82]. However, no consistent induction in the expression of key heat shock proteins (Hsp25, Hsp40, Hsp60, Hsp70, Hsp90, Hsp110) were detected when scPARP2 and shPARP2 C2C12 cells were compared under control conditions or after heat shock (Supplementary Figure S2). These pathways are, therefore, unlikely to contribute to mitochondrial fragmentation. We observed a mild increase in the mRNA and protein expression of OPA1, Parkin, and Pink1 (Figure 5A,B).

3.3. Mitochondrial Fragmentation Is Not Specific for C2C12 Myoblasts

We assessed another cell line in which PARP2 was silenced (scPARP2 and shPARP2 cell lines). Similar to shPARP2 C2C12 cells, in shPARP2 HepG2 cells also, we observed mitochondrial fragmentation marked by an increased number of mitochondrial cross sections on EM sections, decreased perimeter of individual mitochondria, decreased form factor, and increased circularity of mitochondria in MitoTracker-stained and TOMM20-stained cells (Figure 6A–C). Nevertheless, similar to C2C12 cells, no overlap between LC3- and TOMM20-positive features in shHepG2cells was detected (Figure 7A), suggesting that mitochondrial fragmentation is not due to increased mitophagy. We also assessed the mRNA expression of a set of genes involved in regulating mitochondrial morphology. The silencing of PARP2 decreased the expression of Mitofusin1 (Mfn1) and Pink1 (Figure 7B). The expression pattern of the genes involved in regulating mitochondrial morphology was not similar in shPARP2 C2C12 cells and shPARP2 HepG2 cells, making it unlikely that the deregulation of these genes could be responsible for mitochondrial fragmentation.

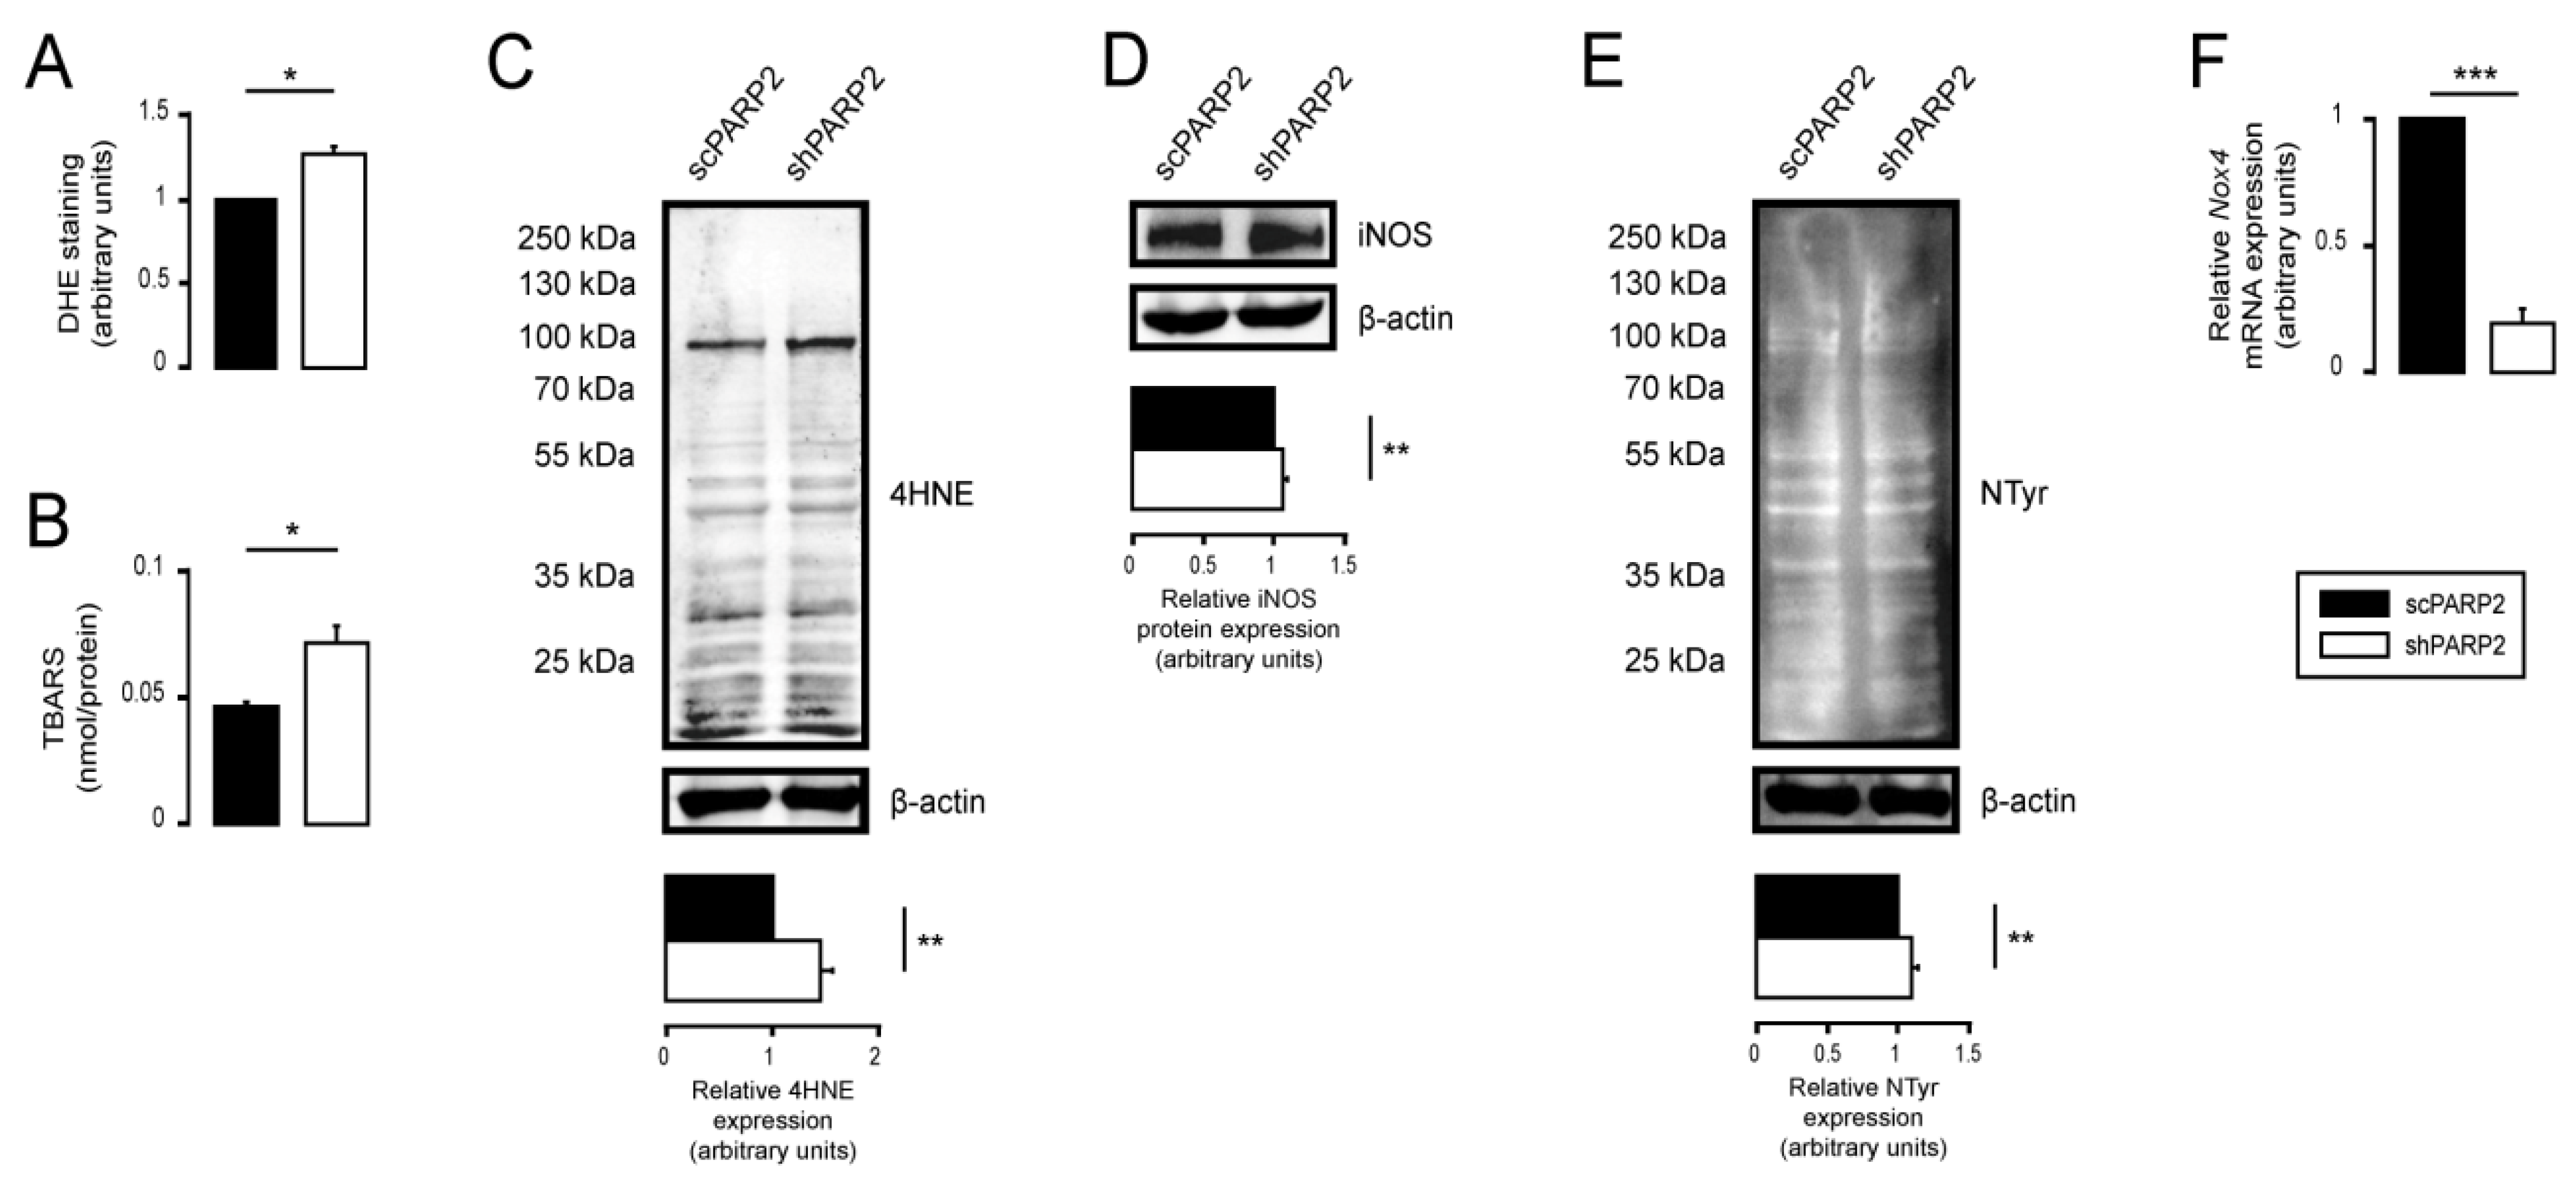
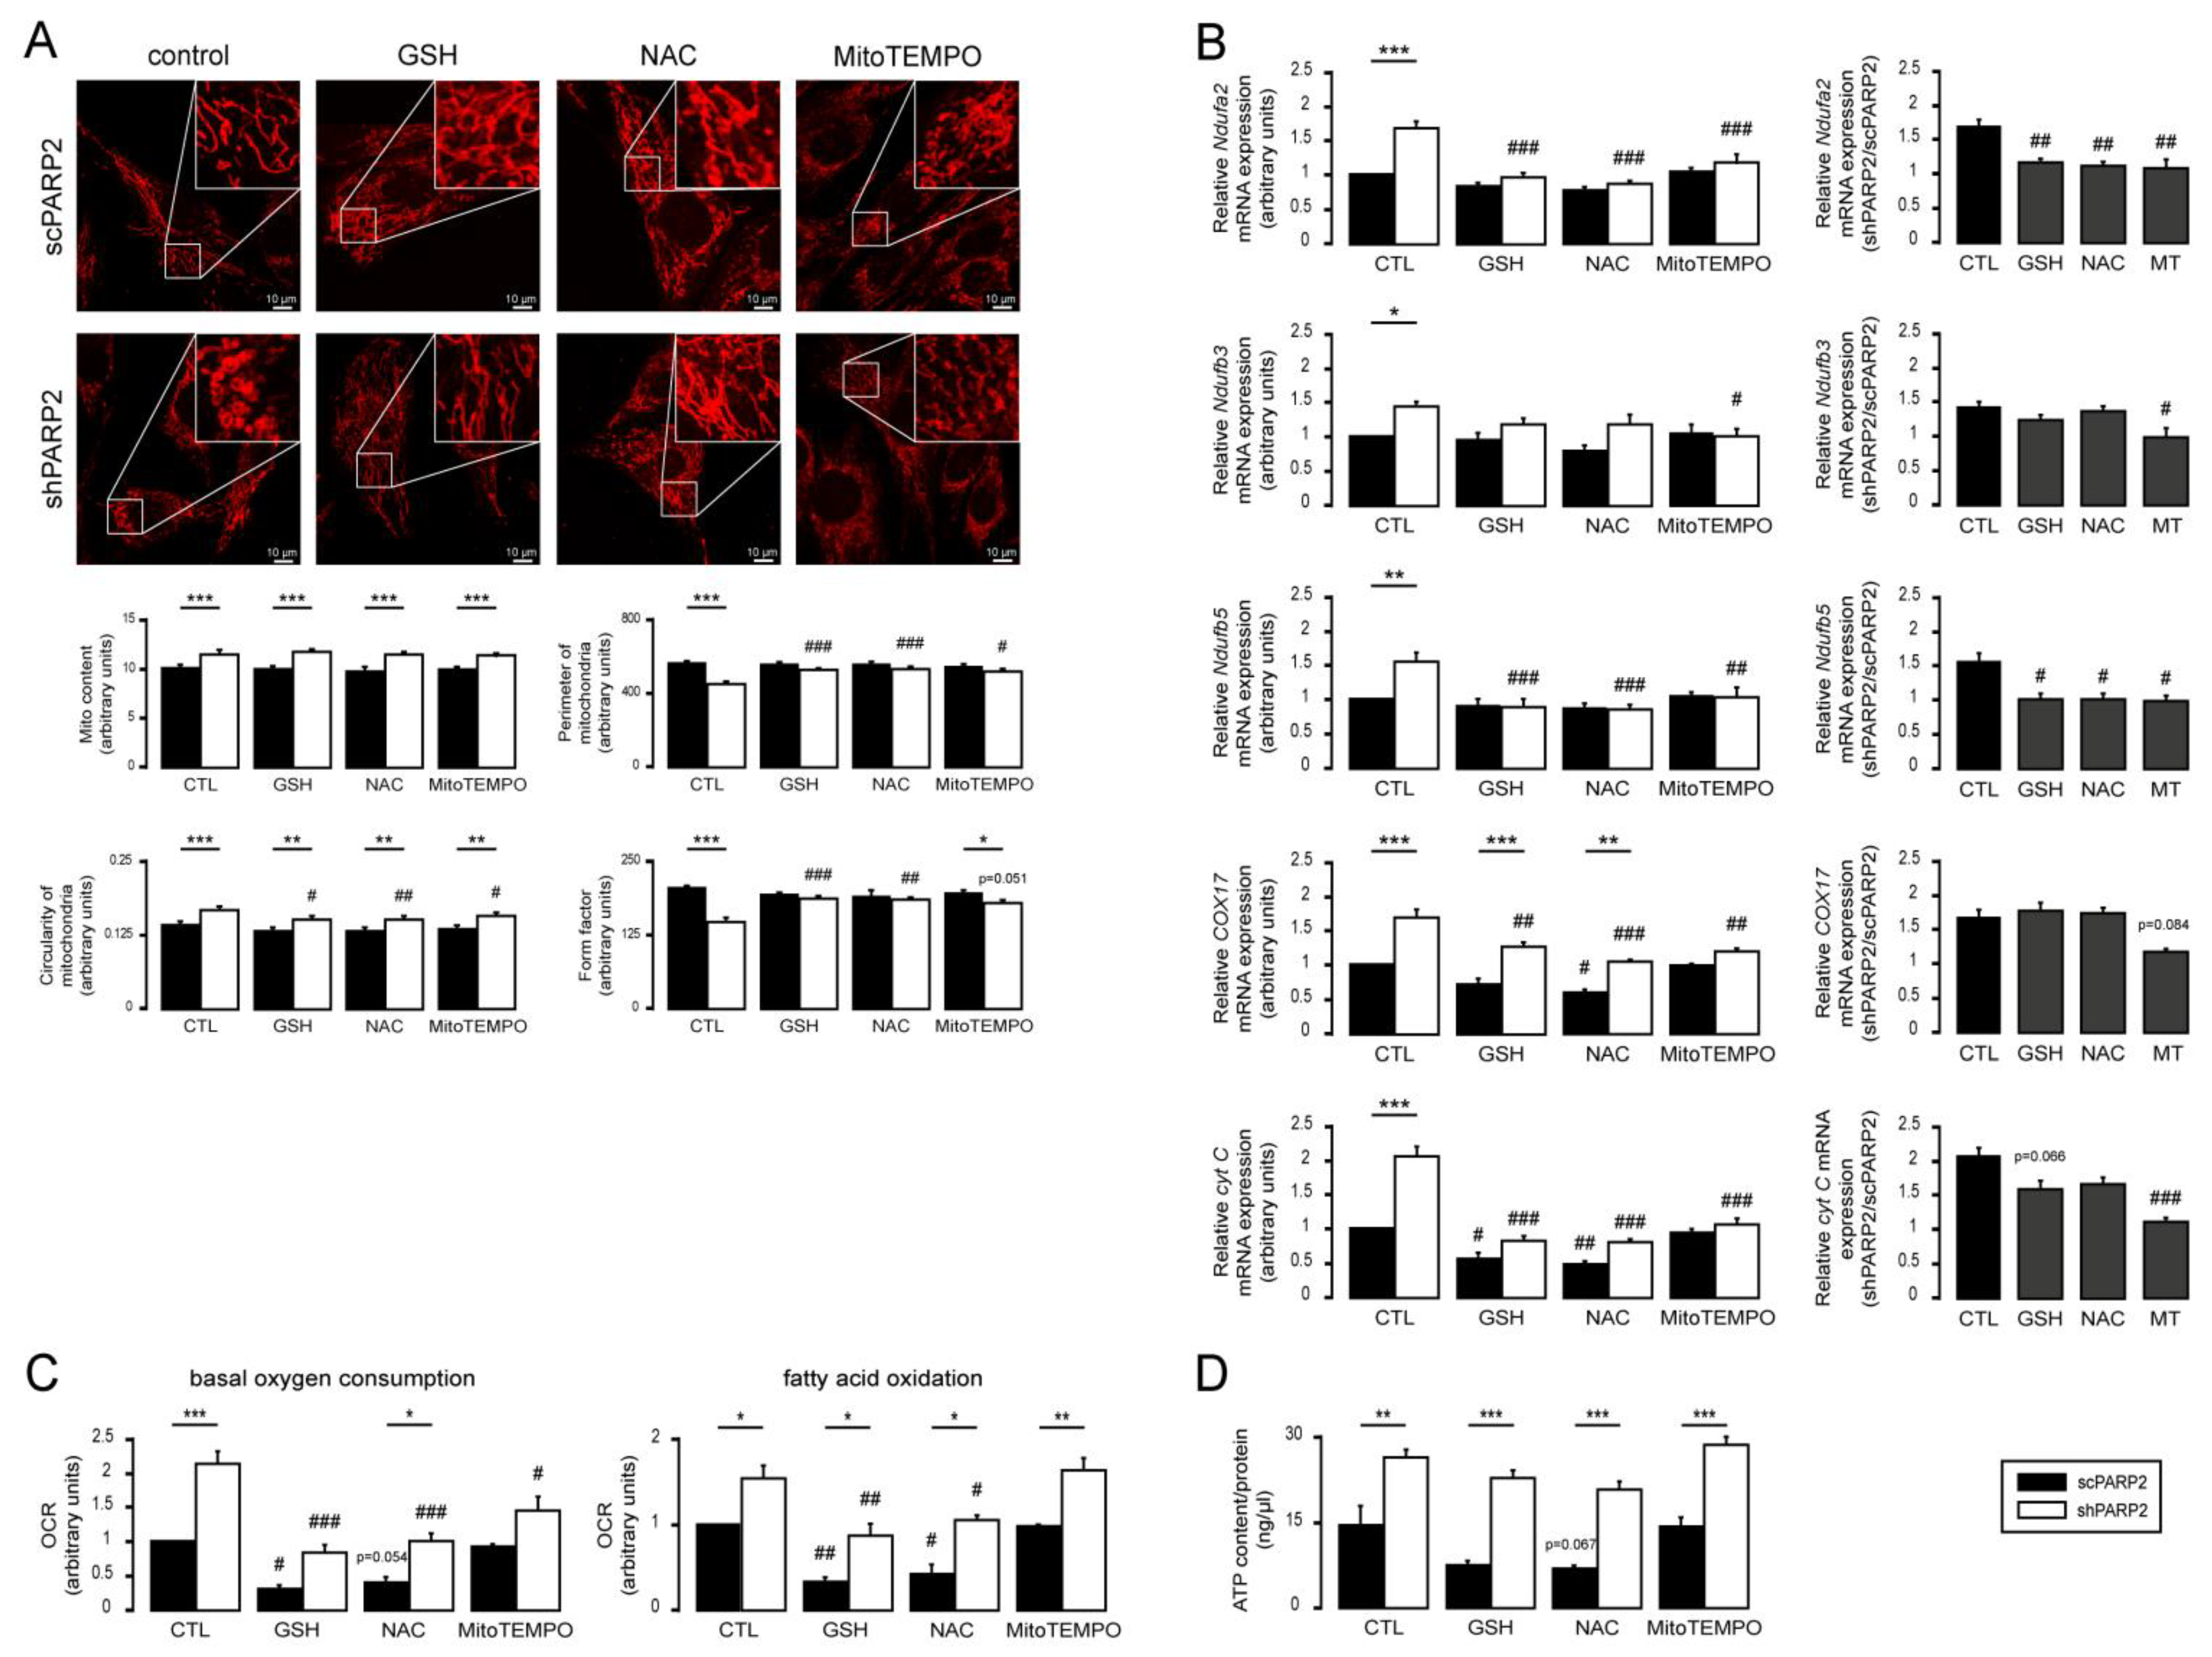
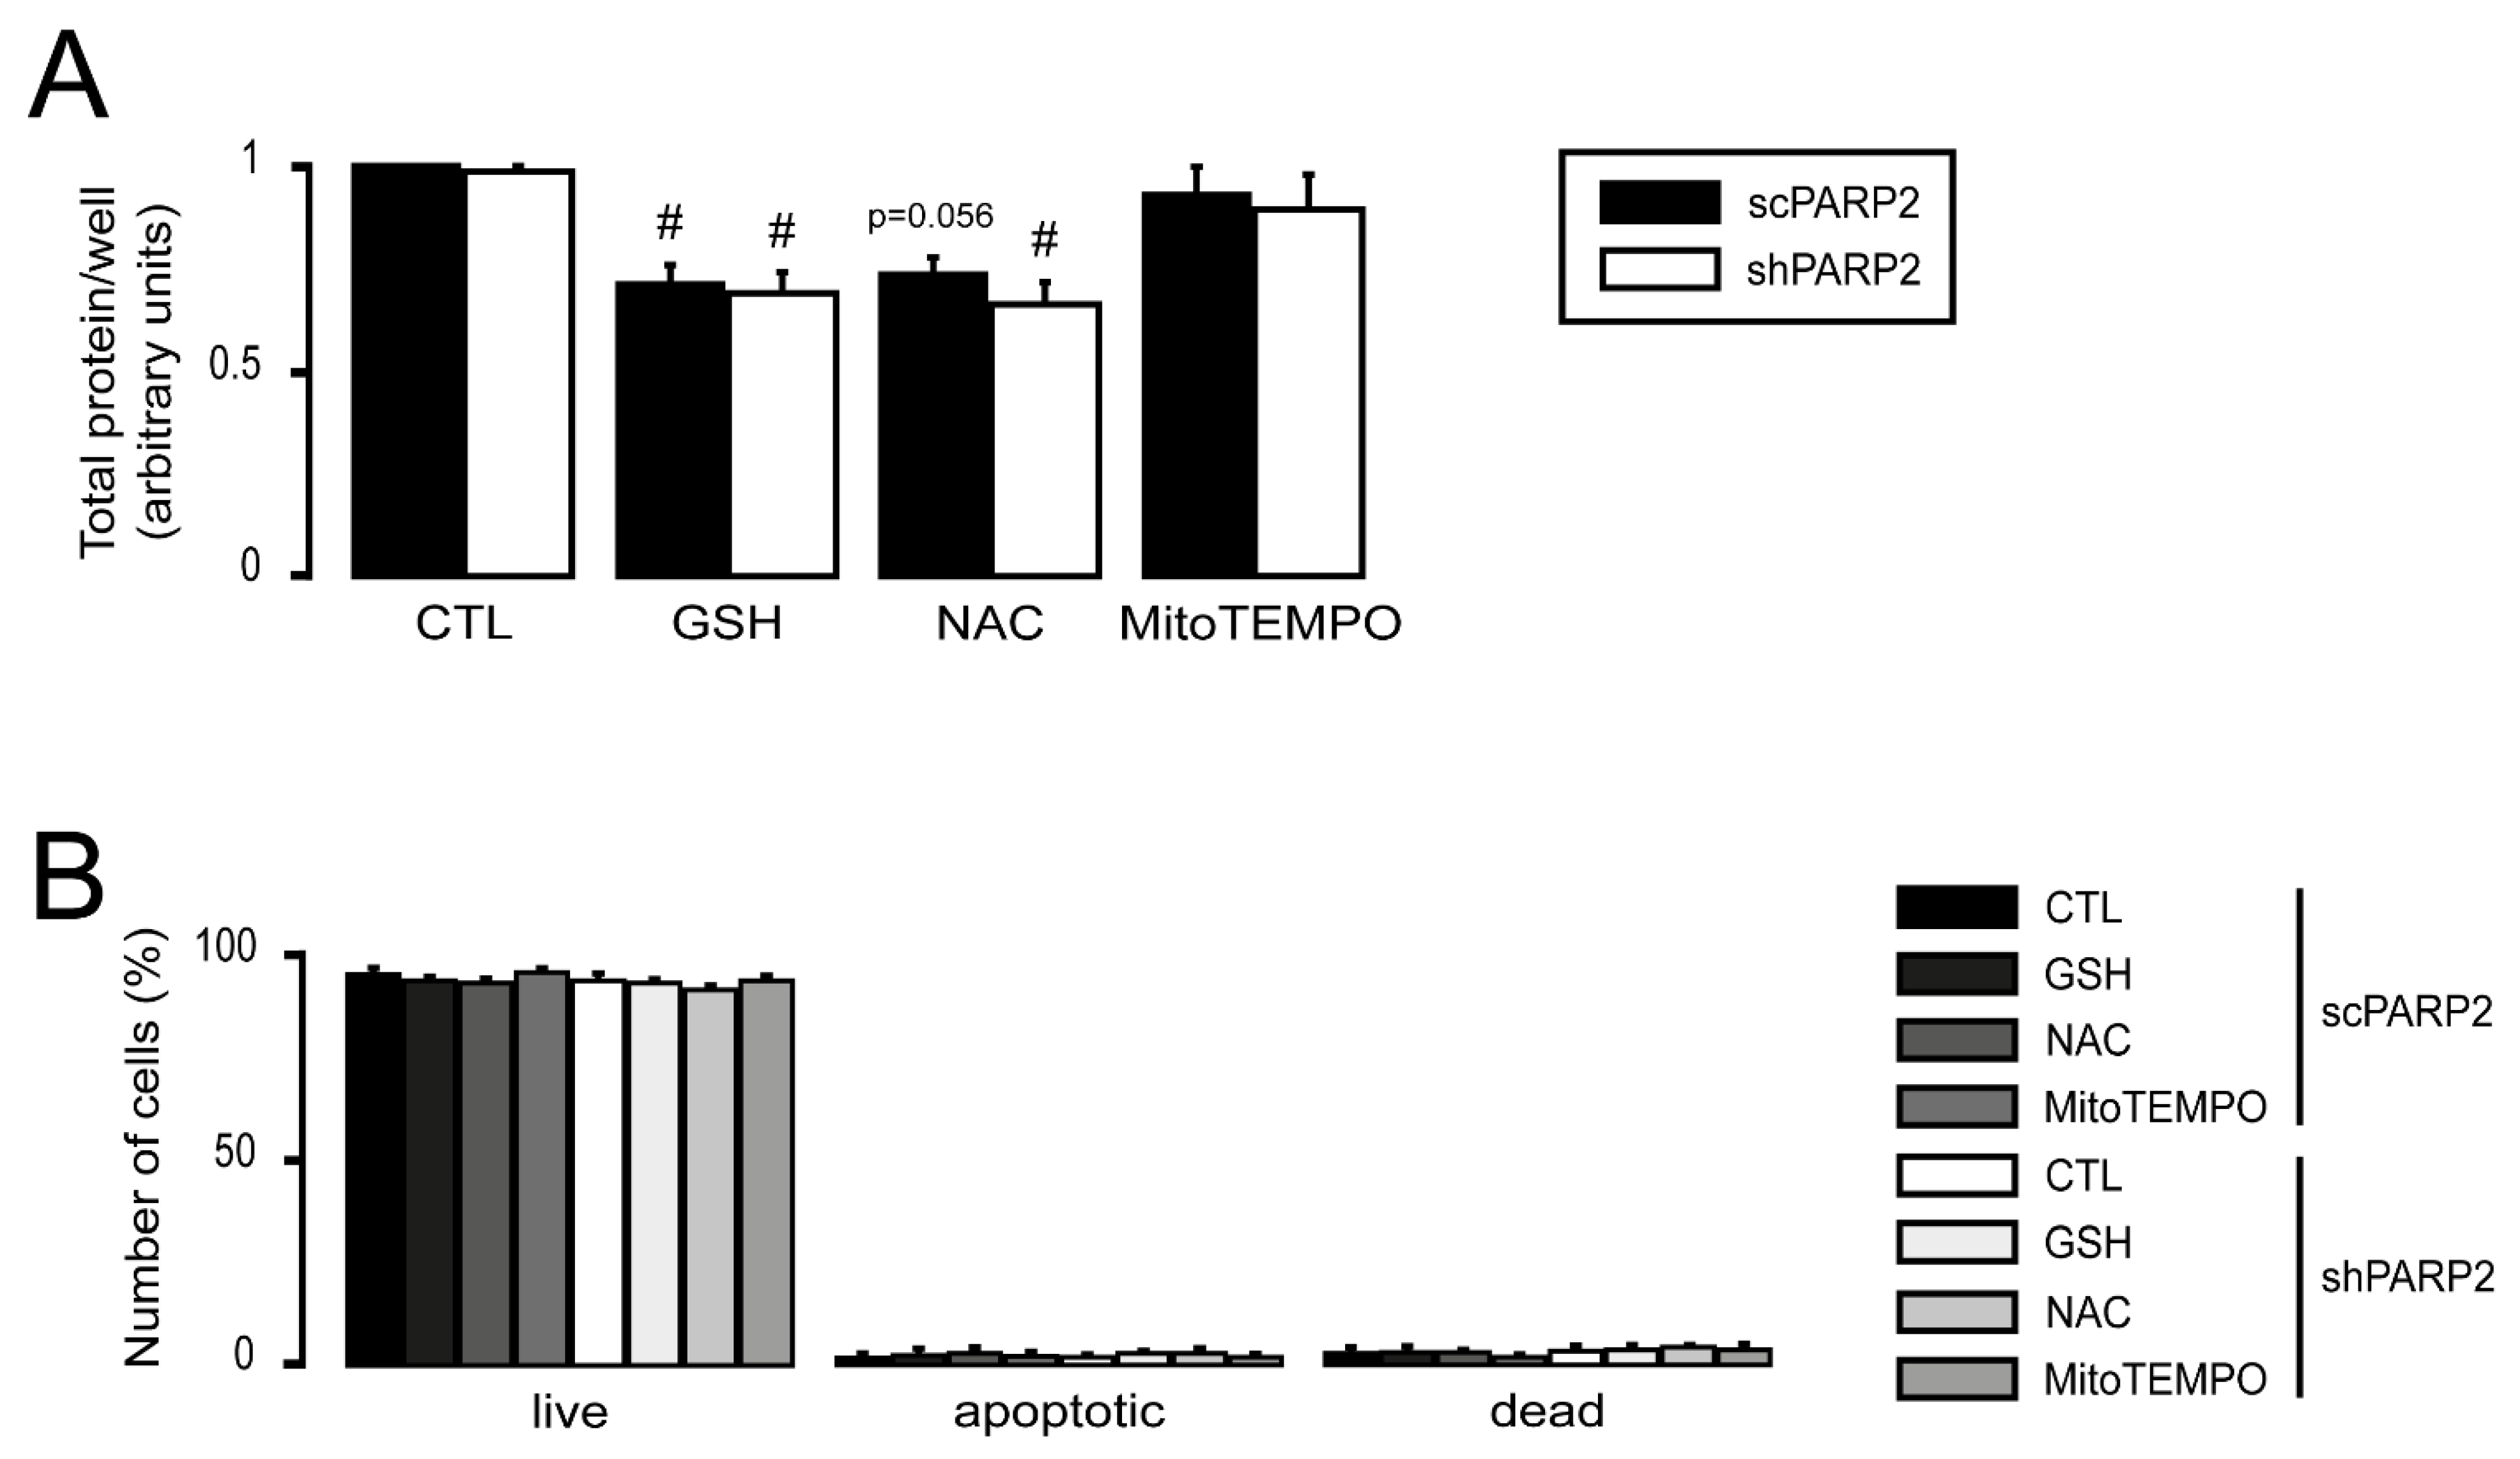
3.4. Silencing of PARP2 Leads to Oxidative Stress, Originating Partly from the Mitochondria through Mitochondrial Protein Imbalance and Fragmentation

The redox state of cells changes in response to PARP inhibition (reviewed in [83,84]). The oxidative stress markers, dihydroethidine fluorescence, 4-hidroxynonenal (4HNE), and thiobarbituric acid-reactive substances (TBARS), increased in shPARP2 C2C12 cells (Figure 8A–C) compared with controls. Nitrosative stress markers did not exhibit large changes (Figure 8D–F).
To determine the effects of increased oxidative stress on mitochondrial fragmentation, we assessed how general reductants, such as reduced glutathione (GSH) or N-acetyl-cysteine (NAC), and a mitochondrial-targeted antioxidant MitoTEMPO affected mitochondrial morphology (similar to [69]). Although the antioxidants did not prevent mitochondrial biogenesis (marked by “Mito content” in Figure 9A), they affected the structure of the mitochondrial network (“Perimeter” and “Form factor” in Figure 9A). All three antioxidants increased the perimeters and form factors in mitochondria and slightly decreased the circularity of mitochondria in shPARP2 cells (Figure 9A). These results suggest that mitochondrial fragmentation relies on oxidative stress of mitochondrial origin.
We assessed how the expression of mitochondrial genes responds to antioxidant treatment. The expression of Ndufa2, Ndufb3, Ndufb5, Cox17, and cyt C was induced in shPARP2 C2C12 cells compared with scPARP2 cells (Figure 9B). The expression of all genes reduced upon treatment with GSH, NAC, and MitoTEMPO (Figure 9B), similar to [69]. These responses were translated into physiological changes, as the antioxidants reduced mitochondrial oxygen consumption (Figure 9C), fatty acid oxidation (Figure 9C), and ATP content (Figure 9D). There were no differences in cell proliferation and spontaneous cell death between scPARP2 and shPARP2 cells, even in the presence of GSH, NAC, and MitoTEMPO (Figure 10A,B).

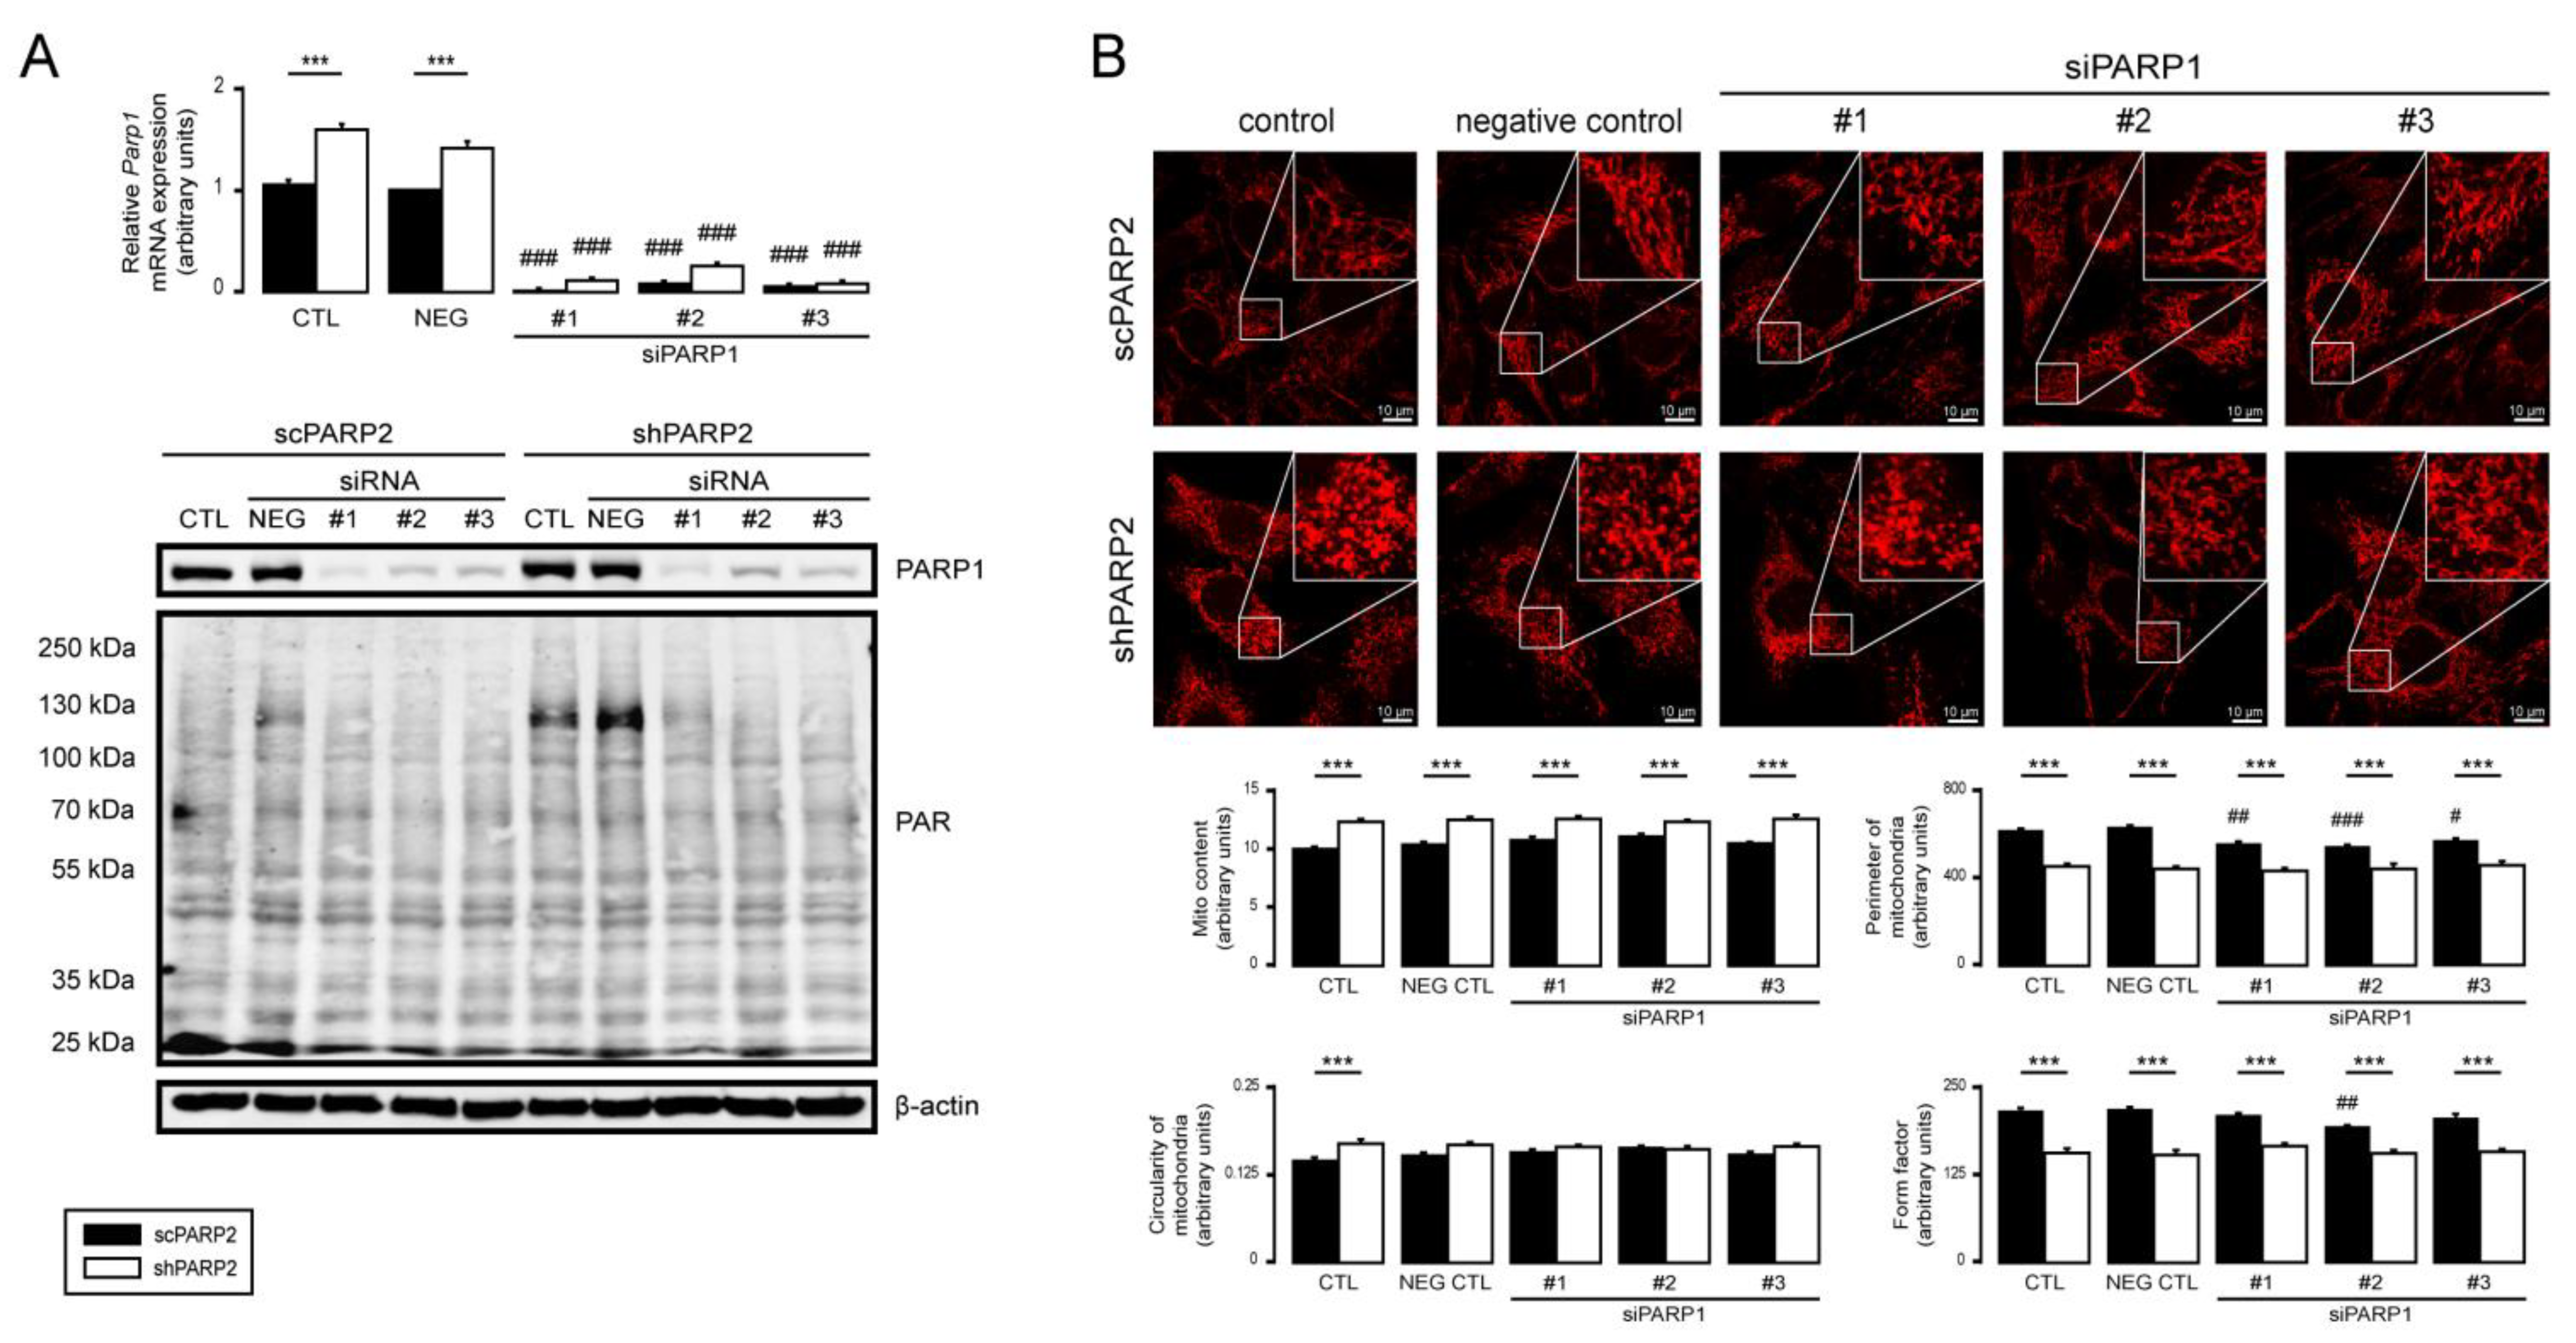
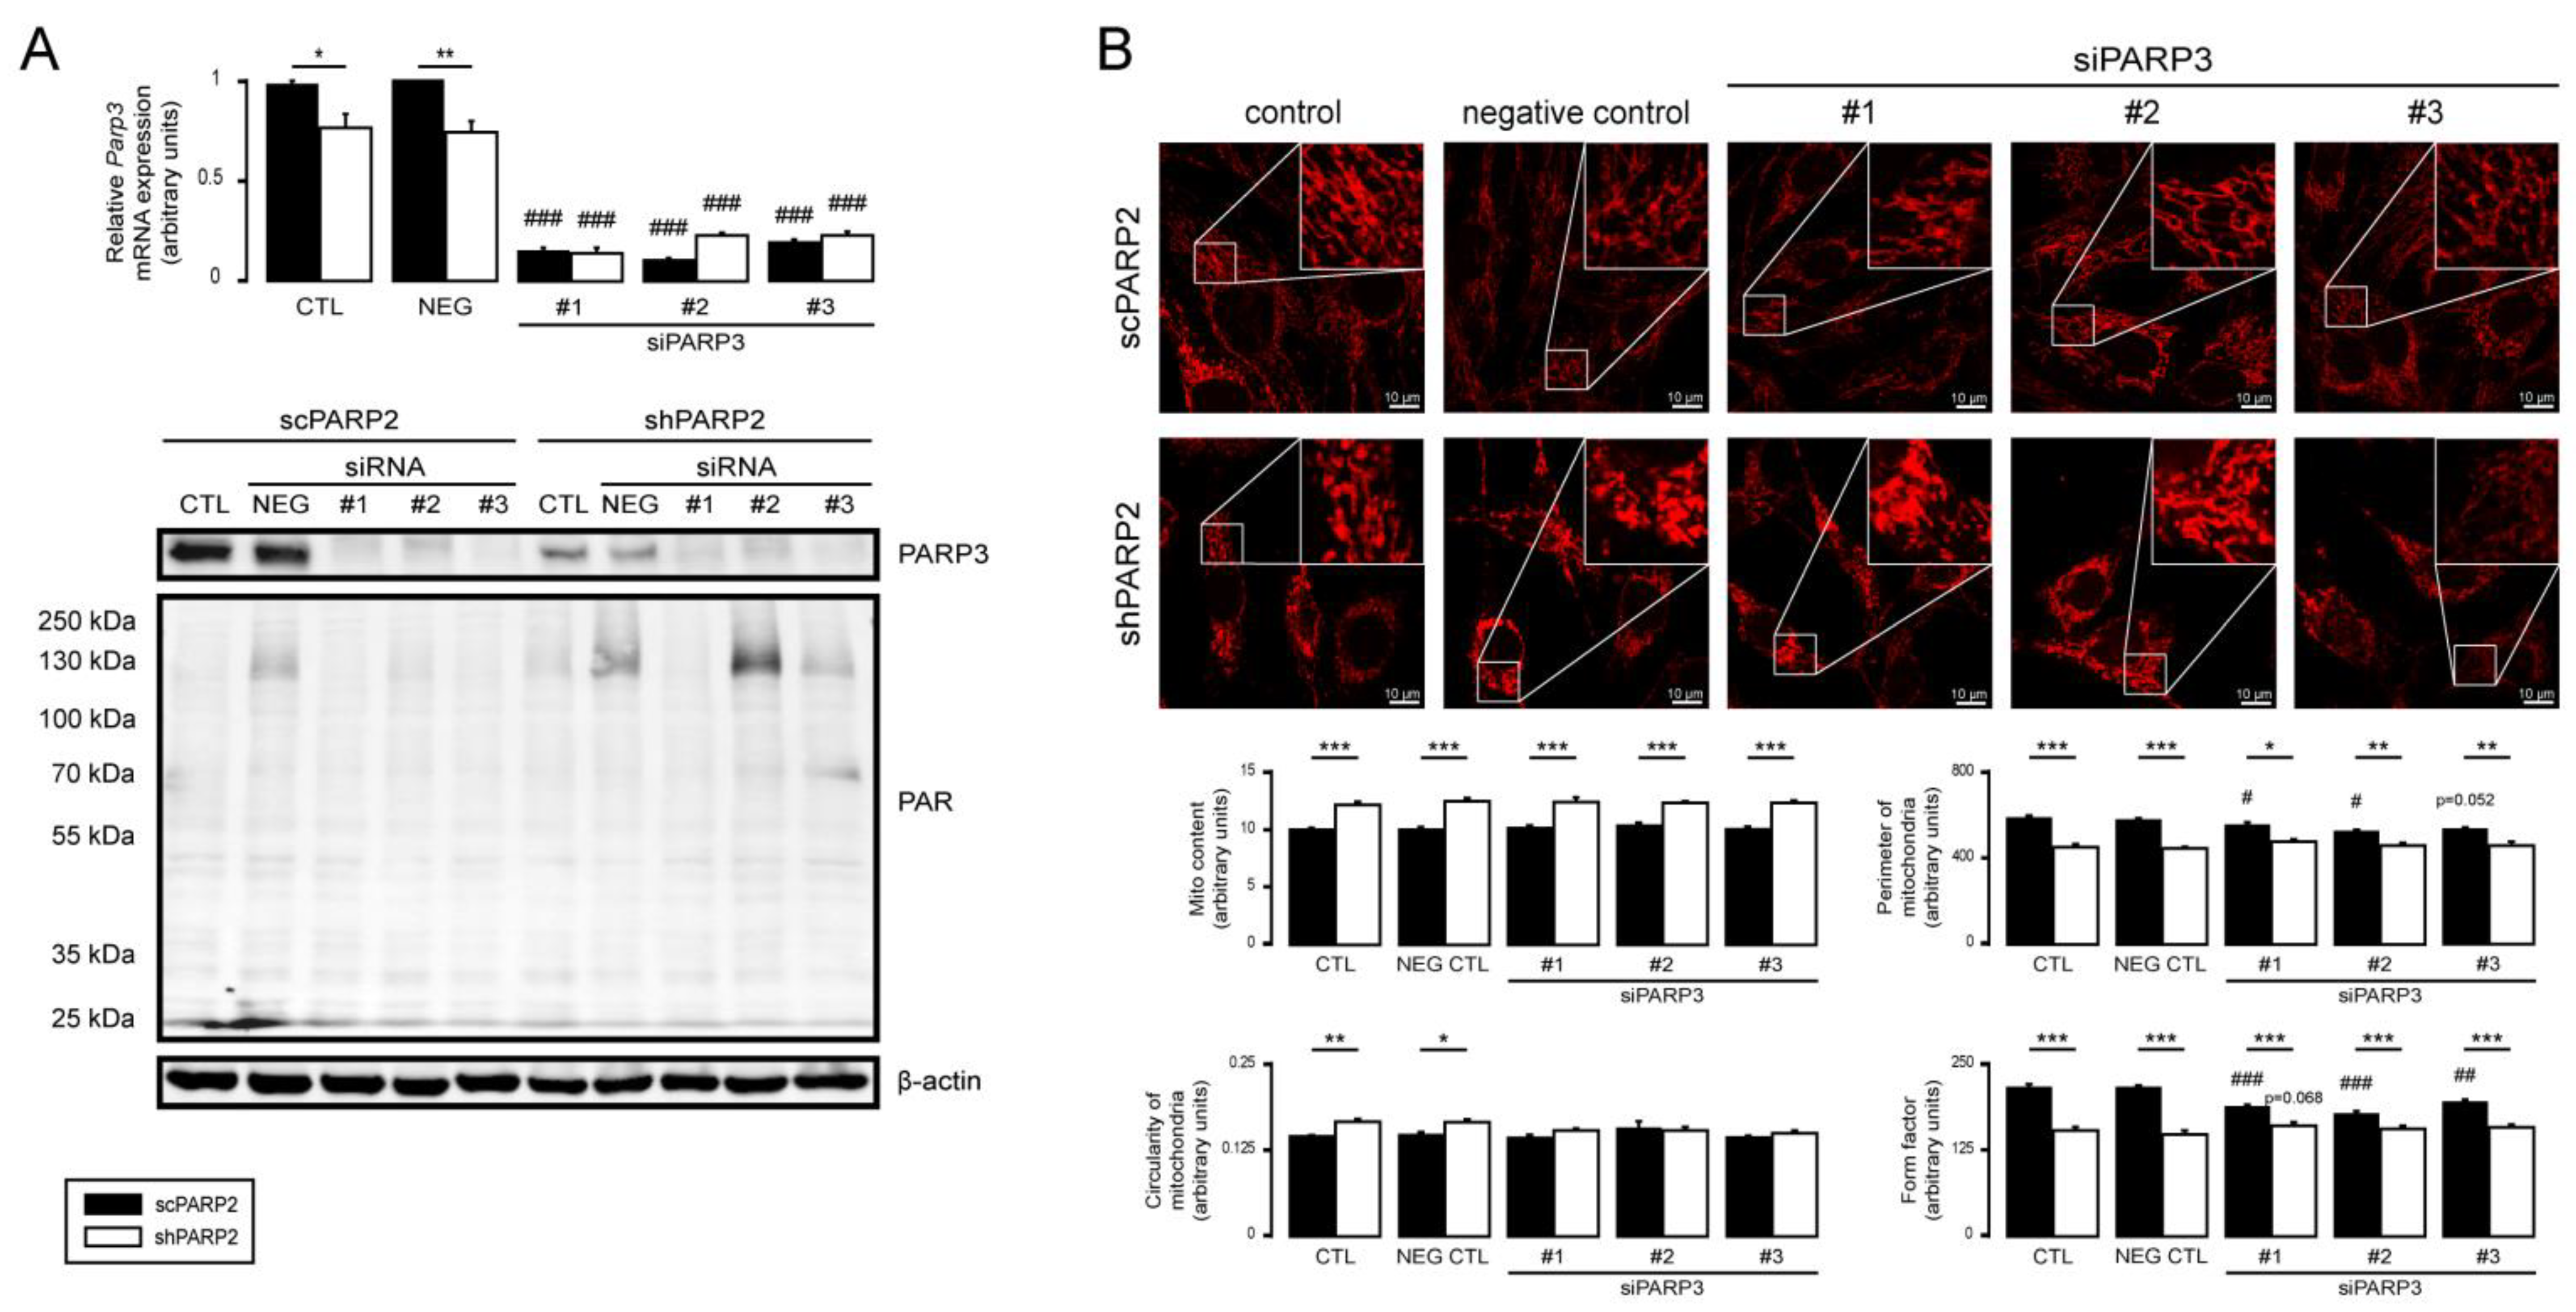
3.5. PARP1 and PARP3 Are Not Involved in Mitochondrial Fragmentation Elicited by the Silencing of PARP2

PARP1 and PARP3 were implicated in regulating mitochondrial morphology [20,85,86]; hence, we assessed the possible involvement of PARP1 and PARP3. Silencing PARP1 in scPARP2 and shPARP2 C2C12 cells (Figure 11A) led to the loss of PARP1 auto-PARylation (Figure 11A). Silencing of PARP1 induced mild mitochondrial fragmentation in scPARP2 cells; nevertheless, it did not influence the morphology in shPARP2 cells (Figure 11B), suggesting little or no involvement in the mitochondrial phenotype in shPARP2 cells. When PARP3 was silenced (Figure 12A), upon the application of the negative control, unspecific siRNA, and two specific siRNA, activation of PARP1 was observed (Figure 12A). Similar to the case of PARP1, silencing of PARP3 in scPARP2 C2C12 cells induces mild mitochondrial fragmentation but does not change the phenotype of the shPARP2 C2C12 cells (Figure 12B), suggesting little or no involvement in the mitochondrial phenotype in shPARP2 cells.

4. Discussion

Previous studies have shown that the genetic deletion of PARP1 or PARP2 [55,87,88,89,90,91,92,93] or pharmacological PARP inhibition [82,87,94] induces mitochondrial biogenesis in multiple organs and tissues, including skeletal muscle. In this study, we provide evidence for fragmentation of the mitochondrial network via induction of oxidative stress in cells. Reduced glutathione (GSH) and N-acetyl-cysteine (NAC), which are known antioxidants that minimize the effect of oxidative stress, reversed the changes to mitochondrial morphology that occur when PARP2 expression is decreased. The mitochondria-targeted antioxidant MitoTEMPO also affected the structure of the mitochondrial network, suggesting that the fragmentation of the mitochondrial network leans on the oxidative stress of mitochondria. GSH, NAC, and MitoTEMPO also reduced mitochondrial oxidative phosphorylation. In good agreement with these results, pharmacological PARP inhibition by olaparib or nicotinamide, as well as increased cellular NAD+ levels [75,76,77,78,79,80], also induce mitochondrial fragmentation [20]. PARP1 or PARP3 does not compensate for the loss of PARP2 in C2C12 cells. Furthermore, the silencing of PARP1 or PARP3 can bring about signs of mitochondrial fragmentation.
Although SIRT1 activation in the absence of PARP2 was shown to induce mitochondrial biogenesis [27,55,57] and SIRT1 can regulate mitochondrial morphology [75,81], modulating SIRT1 activity does not influence mitochondrial fragmentation. Silencing of PARP2 induces autophagy [58], making it likely that mitochondrial fragmentation is due to enhanced mitophagy. However, we ruled out the involvement of mitophagy, despite the indication that PARP1 inhibition can induce mitophagy [18]. Furthermore, in the absence of PARP2, the consistent dysregulation of the mitochondrial fusion/fission machinery and the induction of mtUPR were both ruled out.
Treatment of cells with GSH, NAC, or MitoTEMPO reduced the expression of mitochondrial genes and reduced mitochondrial output but did not reduce mitochondrial content in shPARP2 cells. Taken together, mitochondrial biogenesis upon the absence of PARP2 is dependent on the combined action of increased expression and NAD+-dependent activation of SIRT1 and mitochondrial reactive species production. SIRT1 activation [20,82,86] and reactive species production [95,96,97] were linked with mitonuclear proteostasis in other models. Yet, the source of reactive species has not been identified. Nevertheless, higher mitochondrial activity in a cell leads to higher levels of oxygen-centered reactive species in the Szent–Györgyi–Krebs cycle and the mitochondrial electron transport chain [98].
PARP2 has physiological roles in skeletal muscle. Namely, the silencing of PARP2 supports isotype switching, inducing proportions of slow-twitch, type I fibers and supporting mitochondrial biogenesis through inducing SIRT1 [55,57]. Furthermore, the silencing of PARP2 induces the expression of myogenic transcription factors in differentiating C2C12 myoblasts [58], suggesting pro-differentiation effects, while at the same time, the silencing of PARP2 leads to an aberrant stress fiber-like actin structure [58]. The role of PARP2 in skeletal muscle biology warrants further examination. Nevertheless, there is a large set of human diseases involving PARP activation and mitochondrial damage [53,99,100,101,102,103]; hence, our results, in terms of mitochondrial output and mitochondrial morphology, have implications for understanding the protective action of PARP inhibitors in these diseases.

Supplementary Materials

The following are available online at https://www.mdpi.com/article/10.3390/cells10061387/s1, Figure S1: Mitochondrial fragmentation in C2C12 is not due to mitophagy or SIRT1 activation, Figure S2: Lack of consistent difference in HSP expression and induction in scPARP2 andshPARP2 cells.

Author Contributions

Conceptualization, P.B. and L.J.; methodology, P.B., L.J., B.L.B., M.L. and M.A.; validation, L.J., P.B. and M.A.; formal analysis, L.J. and M.L.; investigation, L.J., Z.S., T.K., G.K., I.H., G.U. and M.L.; resources, P.B.; data curation, P.B. and L.J.; writing—original draft preparation, P.B. and L.J.; writing—review and editing, P.B., L.J., B.L.B. and K.U.; visualization, L.J.; supervision, P.B., M.A., L.V. and B.L.B.; project administration, L.J. and P.B.; funding acquisition, P.B. All authors have read and agreed to the published version of the manuscript.

Funding

This research was funded by grants from the NKFIH (K123975, GINOP-2.3.2-15-2016-00006, EFOP-3.6.2-16-2017-00006), the Momentum fellowship of the Hungarian Academy of Sciences, and the University of Debrecen. The research was financed by the Higher Education Institutional Excellence Program (NKFIH-1150-6/2019) of the Ministry of Innovation and Technology in Hungary, within the framework of the biotechnology thematic program of the University of Debrecen. Tünde Kovács was supported by the ÚNKP-20-4-II-DE-68 grant. B.L.B. was supported by MOLMEDEX FUN-OMICS (GINOP-2.3.3-15-2016-00007), Debrecen Venture Catapult Program (EFOP-3.6.1-16-2016-00022), NKFIH K 129166.

Institutional Review Board Statement

Not applicable.

Informed Consent Statement

Not applicable.

Data Availability Statement

All primary data are uploaded to FIGSHARE at https://figshare.com/s/afe02e5a75b4a1bd584c (doi:10.6084/m9.figshare.12570068).

Acknowledgments

We are grateful to László Finta for his technical assistance.

Conflicts of Interest

The authors declare no conflict of interest.

References

  1. Mottis, A.; Herzig, S.; Auwerx, J. Mitocellular communication: Shaping health and disease. Science 2019, 366, 827–832. [Google Scholar] [CrossRef]
  2. Scarpulla, R.C. Transcriptional paradigms in mammalian mitochondrial biogenesis and function. Physiol. Rev. 2008, 88, 611–638. [Google Scholar] [CrossRef] [PubMed] [Green Version]
  3. Kim, D.H.; Sarbassov, D.D.; Ali, S.M.; King, J.E.; Latek, R.R.; Erdjument-Bromage, H.; Tempst, P.; Sabatini, D.M. mTOR interacts with raptor to form a nutrient-sensitive complex that signals to the cell growth machinery. Cell 2002, 110, 163–175. [Google Scholar] [CrossRef] [Green Version]
  4. Gwinn, D.M.; Shackelford, D.B.; Egan, D.F.; Mihaylova, M.M.; Mery, A.; Vasquez, D.S.; Turk, B.E.; Shaw, R.J. AMPK phosphorylation of raptor mediates a metabolic checkpoint. Mol. Cell 2008, 30, 214–226. [Google Scholar] [CrossRef] [Green Version]
  5. Houtkooper, R.H.; Canto, C.; Wanders, R.J.; Auwerx, J. The secret life of NAD+: An old metabolite controlling new metabolic signaling pathways. Endocr. Rev. 2010, 31, 194–223. [Google Scholar] [CrossRef] [Green Version]
  6. Green, D.R.; Galluzzi, L.; Kroemer, G. Cell biology. Metabolic control of cell death. Science 2014, 345, 1250256. [Google Scholar] [CrossRef] [Green Version]
  7. Hanahan, D.; Weinberg, R.A. The hallmarks of cancer. Cell 2000, 100, 57–70. [Google Scholar] [CrossRef] [Green Version]
  8. Hanahan, D.; Weinberg, R.A. Hallmarks of cancer: The next generation. Cell 2011, 144, 646–674. [Google Scholar] [CrossRef] [PubMed] [Green Version]
  9. Bai, P.; Nagy, L.; Fodor, T.; Liaudet, L.; Pacher, P. Poly(ADP-ribose) polymerases as modulators of mitochondrial activity. Trends Endocrinol. Metab. 2015, 26, 75–83. [Google Scholar] [CrossRef] [PubMed] [Green Version]
  10. Valero, T. Mitochondrial biogenesis: Pharmacological approaches. Curr. Pharm. Des. 2014, 20, 5507–5509. [Google Scholar] [CrossRef]
  11. Mottis, A.; Jovaisaite, V.; Auwerx, J. The mitochondrial unfolded protein response in mammalian physiology. Mamm. Genome 2014, 25, 424–433. [Google Scholar] [CrossRef] [PubMed] [Green Version]
  12. Ni, H.M.; Williams, J.A.; Ding, W.X. Mitochondrial dynamics and mitochondrial quality control. Redox Biol. 2015, 4, 6–13. [Google Scholar] [CrossRef] [Green Version]
  13. Pickles, S.; Vigié, P.; Youle, R.J. Mitophagy and Quality Control Mechanisms in Mitochondrial Maintenance. Curr. Biol. 2018, 28, R170–R185. [Google Scholar] [CrossRef] [Green Version]
  14. Song, J.; Herrmann, J.M.; Becker, T. Quality control of the mitochondrial proteome. Nat. Rev. Mol. Cell. Biol. 2021, 22, 54–70. [Google Scholar] [CrossRef]
  15. Hill, S.; Van Remmen, H. Mitochondrial stress signaling in longevity: A new role for mitochondrial function in aging. Redox Biol. 2014, 2, 936–944. [Google Scholar] [CrossRef] [PubMed] [Green Version]
  16. Andreux, P.A.; Houtkooper, R.H.; Auwerx, J. Pharmacological approaches to restore mitochondrial function. Nat. Rev. Drug Discov. 2013, 12, 465–483. [Google Scholar] [CrossRef] [Green Version]
  17. Ashrafi, G.; Schwarz, T.L. The pathways of mitophagy for quality control and clearance of mitochondria. Cell Death Differ. 2013, 20, 31–42. [Google Scholar] [CrossRef] [PubMed] [Green Version]
  18. Fang, E.F.; Scheibye-Knudsen, M.; Brace, L.E.; Kassahun, H.; Sengupta, T.; Nilsen, H.; Mitchell, J.R.; Croteau, D.L.; Bohr, V.A. Defective Mitophagy in XPA via PARP-1 Hyperactivation and NAD(+)/SIRT1 Reduction. Cell 2014, 157, 882–896. [Google Scholar] [CrossRef] [Green Version]
  19. Yi, H.S.; Chang, J.Y.; Shong, M. The mitochondrial unfolded protein response and mitohormesis: A perspective on metabolic diseases. J. Mol. Endocrinol. 2018, 61, R91–R105. [Google Scholar] [CrossRef]
  20. Mouchiroud, L.; Houtkooper, R.H.; Moullan, N.; Katsyuba, E.; Ryu, D.; Canto, C.; Mottis, A.; Jo, Y.S.; Viswanathan, M.; Schoonjans, K.; et al. The NAD+/Sirtuin Pathway Modulates Longevity through Activation of Mitochondrial UPR and FOXO Signaling. Cell 2013, 154, 430–441. [Google Scholar] [CrossRef] [Green Version]
  21. Wai, T.; Langer, T. Mitochondrial Dynamics and Metabolic Regulation. Trends Endocrinol. Metab. 2016, 27, 105–117. [Google Scholar] [CrossRef]
  22. Meyer, J.N.; Leuthner, T.C.; Luz, A.L. Mitochondrial fusion, fission, and mitochondrial toxicity. Toxicology 2017, 391, 42–53. [Google Scholar] [CrossRef]
  23. Nunnari, J.; Suomalainen, A. Mitochondria: In sickness and in health. Cell 2012, 148, 1145–1159. [Google Scholar] [CrossRef] [PubMed] [Green Version]
  24. Hottiger, M.O.; Hassa, P.O.; Luscher, B.; Schuler, H.; Koch-Nolte, F. Toward a unified nomenclature for mammalian ADP-ribosyltransferases. Trends Biochem. Sci. 2010, 35, 208–219. [Google Scholar] [CrossRef]
  25. Schreiber, V.; Dantzer, F.; Ame, J.C.; de Murcia, G. Poly(ADP-ribose): Novel functions for an old molecule. Nat. Rev. Mol. Cell Biol. 2006, 7, 517–528. [Google Scholar] [CrossRef] [PubMed]
  26. Schreiber, V.; Ame, J.C.; Dolle, P.; Schultz, I.; Rinaldi, B.; Fraulob, V.; Menissier-de Murcia, J.; de Murcia, G. Poly(ADP-ribose) polymerase-2 (PARP-2) is required for efficient base excision DNA repair in association with PARP-1 and XRCC1. J. Biol. Chem. 2002, 277, 23028–23036. [Google Scholar] [CrossRef] [Green Version]
  27. Szanto, M.; Rutkai, I.; Hegedus, C.; Czikora, A.; Rozsahegyi, M.; Kiss, B.; Virag, L.; Gergely, P.; Toth, A.; Bai, P. Poly(ADP-ribose) polymerase-2 depletion reduces doxorubicin-induced damage through SIRT1 induction. Cardiovasc. Res. 2011, 92, 430–438. [Google Scholar] [CrossRef] [Green Version]
  28. Shieh, W.M.; Ame, J.C.; Wilson, M.V.; Wang, Z.Q.; Koh, D.W.; Jacobson, M.K.; Jacobson, E.L. Poly(ADP-ribose) polymerase null mouse cells synthesize ADP-ribose polymers. J. Biol. Chem. 1998, 273, 30069–30072. [Google Scholar] [CrossRef] [Green Version]
  29. Ame, J.C.; Rolli, V.; Schreiber, V.; Niedergang, C.; Apiou, F.; Decker, P.; Muller, S.; Hoger, T.; Menissier-de Murcia, J.; de Murcia, G. PARP-2, A novel mammalian DNA damage-dependent poly(ADP-ribose) polymerase. J. Biol. Chem. 1999, 274, 17860–17868. [Google Scholar] [CrossRef] [Green Version]
  30. Kutuzov, M.M.; Khodyreva, S.N.; Ame, J.C.; Ilina, E.S.; Sukhanova, M.V.; Schreiber, V.; Lavrik, O.I. Interaction of PARP-2 with DNA structures mimicking DNA repair intermediates and consequences on activity of base excision repair proteins. Biochimie 2013, 95, 1208–1215. [Google Scholar] [CrossRef]
  31. Hanzlikova, H.; Gittens, W.; Krejcikova, K.; Zeng, Z.; Caldecott, K.W. Overlapping roles for PARP1 and PARP2 in the recruitment of endogenous XRCC1 and PNKP into oxidized chromatin. Nucleic Acids Res. 2017, 45, 2546–2557. [Google Scholar] [CrossRef] [PubMed]
  32. Sun, Q.; Gatie, M.I.; Kelly, G.M. Serum-dependent and -independent regulation of PARP2. Biochem. Cell Biol. 2019, 97, 600–611. [Google Scholar] [CrossRef]
  33. Marton, J.; Peter, M.; Balogh, G.; Bodi, B.; Vida, A.; Szanto, M.; Bojcsuk, D.; Janko, L.; Bhattoa, H.P.; Gombos, I.; et al. Poly(ADP-ribose) polymerase-2 is a lipid-modulated modulator of muscular lipid homeostasis. Biochim. Biophys. Acta 2018, 1863, 1399–1412. [Google Scholar] [CrossRef]
  34. Schreiber, V.; Ricoul, M.; Amé, J.C.; Dantzer, F.; Meder, V.S.; Spenlehauer, C.; Stiegler, P.; Niedergang, C.; Sabatier, L.; Favaudon, V.; et al. PARP-2: Structure-function relationship. In Poly(ADP-ribosyl)ation; Springer: Boston, MA, USA, 2004; pp. 13–31. [Google Scholar]
  35. Yelamos, J.; Schreiber, V.; Dantzer, F. Toward specific functions of poly(ADP-ribose) polymerase-2. Trends Mol. Med. 2008, 14, 169–178. [Google Scholar] [CrossRef] [PubMed]
  36. Szanto, M.; Brunyánszki, A.; Kiss, B.; Nagy, L.; Gergely, P.; Virag, L.; Bai, P. Poly(ADP-ribose) polymerase-2: Emerging transcriptional roles of a DNA repair protein. Cell Mol. Life Sci. 2012, 69, 4079–4092. [Google Scholar] [CrossRef] [Green Version]
  37. Bai, P. Biology of Poly(ADP-Ribose) Polymerases: The Factotums of Cell Maintenance. Mol. Cell 2015, 58, 947–958. [Google Scholar] [CrossRef] [Green Version]
  38. Menissier-de Murcia, J.; Ricoul, M.; Tartier, L.; Niedergang, C.; Huber, A.; Dantzer, F.; Schreiber, V.; Ame, J.C.; Dierich, A.; LeMeur, M.; et al. Functional interaction between PARP-1 and PARP-2 in chromosome stability and embryonic development in mouse. EMBO J. 2003, 22, 2255–2263. [Google Scholar] [CrossRef] [Green Version]
  39. Dantzer, F.; Giraud-Panis, M.J.; Jaco, I.; Ame, J.C.; Schultz, I.; Blasco, M.; Koering, C.E.; Gilson, E.; Menissier-de Murcia, J.; de Murcia, G.; et al. Functional interaction between poly(ADP-Ribose) polymerase 2 (PARP-2) and TRF2: PARP activity negatively regulates TRF2. Mol. Cell Biol. 2004, 24, 1595–1607. [Google Scholar] [CrossRef] [Green Version]
  40. Dantzer, F.; Mark, M.; Quenet, D.; Scherthan, H.; Huber, A.; Liebe, B.; Monaco, L.; Chicheportiche, A.; Sassone-Corsi, P.; de Murcia, G.; et al. Poly(ADP-ribose) polymerase-2 contributes to the fidelity of male meiosis I and spermiogenesis. Proc. Natl. Acad. Sci. USA 2006, 103, 14854–14859. [Google Scholar] [CrossRef] [Green Version]
  41. Nicolas, L.; Martinez, C.; Baro, C.; Rodriguez, M.; Baroja-Mazo, A.; Sole, F.; Flores, J.M.; Ampurdanes, C.; Dantzer, F.; Martin-Caballero, J.; et al. Loss of poly(ADP-ribose) polymerase-2 leads to rapid development of spontaneous T-cell lymphomas in p53-deficient mice. Oncogene 2010, 29, 2877–2883. [Google Scholar] [CrossRef] [PubMed] [Green Version]
  42. Yelamos, J.; Farres, J.; Llacuna, L.; Ampurdanes, C.; Martin-Caballero, J. PARP-1 and PARP-2: New players in tumour development. Am. J. Cancer Res. 2011, 1, 328–346. [Google Scholar]
  43. Mateu-Jimenez, M.; Cucarull-Martinez, B.; Yelamos, J.; Barreiro, E. Reduced tumor burden through increased oxidative stress in lung adenocarcinoma cells of PARP-1 and PARP-2 knockout mice. Biochimie 2016, 121, 278–286. [Google Scholar] [CrossRef] [PubMed] [Green Version]
  44. Navarro, J.; Gozalbo-Lopez, B.; Mendez, A.C.; Dantzer, F.; Schreiber, V.; Martinez, C.; Arana, D.M.; Farres, J.; Revilla-Nuin, B.; Bueno, M.F.; et al. PARP-1/PARP-2 double deficiency in mouse T cells results in faulty immune responses and T lymphomas. Sci. Rep. 2017, 7, 41962. [Google Scholar] [CrossRef] [PubMed] [Green Version]
  45. Yélamos, J.; Moreno-Lama, L.; Jimeno, J.; Ali, S.O. Immunomodulatory Roles of PARP-1 and PARP-2: Impact on PARP-Centered Cancer Therapies. Cancers 2020, 12, 392. [Google Scholar] [CrossRef] [Green Version]
  46. Quenet, D.; Mark, M.; Govin, J.; van Dorsselear, A.; Schreiber, V.; Khochbin, S.; Dantzer, F. Parp2 is required for the differentiation of post-meiotic germ cells: Identification of a spermatid-specific complex containing Parp1, Parp2, TP2 and HSPA2. Exp. Cell Res. 2009, 315, 2824–2834. [Google Scholar] [CrossRef] [PubMed]
  47. Popoff, I.; Jijon, H.; Monia, B.; Tavernini, M.; Ma, M.; McKay, R.; Madsen, K. Antisense oligonucleotides to poly(ADP-ribose) polymerase-2 ameliorate colitis in interleukin-10-deficient mice. J. Pharmacol. Exp. Ther. 2002, 303, 1145–1154. [Google Scholar] [CrossRef] [PubMed]
  48. Yelamos, J.; Monreal, Y.; Saenz, L.; Aguado, E.; Schreiber, V.; Mota, R.; Fuente, T.; Minguela, A.; Parrilla, P.; de Murcia, G.; et al. PARP-2 deficiency affects the survival of CD4+CD8+ double-positive thymocytes. EMBO J. 2006, 25, 4350–4360. [Google Scholar] [CrossRef]
  49. Farres, J.; Martin-Caballero, J.; Martinez, C.; Lozano, J.J.; Llacuna, L.; Ampurdanes, C.; Ruiz-Herguido, C.; Dantzer, F.; Schreiber, V.; Villunger, A.; et al. PARP-2 is required to maintain hematopoiesis following sublethal gamma-irradiation in mice. Blood 2013, 122, 44–54. [Google Scholar] [CrossRef] [PubMed] [Green Version]
  50. Farres, J.; Llacuna, L.; Martin-Caballero, J.; Martinez, C.; Lozano, J.J.; Ampurdanes, C.; Lopez-Contreras, A.J.; Florensa, L.; Navarro, J.; Ottina, E.; et al. PARP-2 sustains erythropoiesis in mice by limiting replicative stress in erythroid progenitors. Cell Death Differ. 2015, 22, 1144–1157. [Google Scholar] [CrossRef] [PubMed] [Green Version]
  51. Moreno-Lama, L.; Galindo-Campos, M.A.; Martínez, C.; Comerma, L.; Vazquez, I.; Vernet-Tomas, M.; Ampurdanés, C.; Lutfi, N.; Martin-Caballero, J.; Dantzer, F.; et al. Coordinated signals from PARP-1 and PARP-2 are required to establish a proper T cell immune response to breast tumors in mice. Oncogene 2020, 39, 2835–2843. [Google Scholar] [CrossRef]
  52. Kofler, J.; Otsuka, T.; Zhang, Z.; Noppens, R.; Grafe, M.R.; Koh, D.W.; Dawson, V.L.; Menisser-de Murcia, J.; Hurn, P.D.; Traystman, R.J. Differential effect of PARP-2 deletion on brain injury after focal and global cerebral ischemia. J. Cereb. Blood Flow Metab. 2006, 26, 135–141. [Google Scholar] [CrossRef] [Green Version]
  53. Li, X.; Klaus, J.A.; Zhang, J.; Xu, Z.; Kibler, K.K.; Andrabi, S.A.; Rao, K.; Yang, Z.J.; Dawson, T.M.; Dawson, V.L.; et al. Contributions of poly(ADP-ribose) polymerase-1 and -2 to nuclear translocation of apoptosis-inducing factor and injury from focal cerebral ischemia. J. Neurochem. 2010, 113, 1012–1022. [Google Scholar] [CrossRef] [Green Version]
  54. Szanto, M.; Brunyanszki, A.; Marton, J.; Vamosi, G.; Nagy, L.; Fodor, T.; Kiss, B.; Virag, L.; Gergely, P.; Bai, P. Deletion of PARP-2 induces hepatic cholesterol accumulation and decrease in HDL levels. Biochim. Biophys. Acta 2014, 1842, 594–602. [Google Scholar] [CrossRef] [PubMed] [Green Version]
  55. Bai, P.; Canto, C.; Brunyánszki, A.; Huber, A.; Szántó, M.; Cen, Y.; Yamamoto, H.; Houten, S.M.; Kiss, B.; Oudart, H.; et al. PARP-2 regulates SIRT1 expression and whole-body energy expenditure. Cell Metab. 2011, 13, 450–460. [Google Scholar] [CrossRef] [Green Version]
  56. Bai, P.; Houten, S.M.; Huber, A.; Schreiber, V.; Watanabe, M.; Kiss, B.; de Murcia, G.; Auwerx, J.; Menissier-de Murcia, J. Poly(ADP-ribose) polymerase-2 controls adipocyte differentiation and adipose tissue function through the regulation of the activity of the retinoid X receptor/peroxisome proliferator-activated receptor-gamma heterodimer. J. Biol. Chem. 2007, 282, 37738–37746. [Google Scholar] [CrossRef] [PubMed] [Green Version]
  57. Mohamed, J.S.; Hajira, A.; Pardo, P.S.; Boriek, A.M. MicroRNA-149 inhibits PARP-2 and promotes mitochondrial biogenesis via SIRT-1/PGC-1alpha network in skeletal muscle. Diabetes 2014, 63, 1546–1559. [Google Scholar] [CrossRef] [Green Version]
  58. Janko, L.; Sari, Z.; Kovacs, T.; Kis, G.; Szanto, M.; Antal, M.; Juhasz, G.; Bai, P. Silencing of PARP2 Blocks Autophagic Degradation. Cells 2020, 9, 380. [Google Scholar] [CrossRef] [PubMed] [Green Version]
  59. Chacon-Cabrera, A.; Fermoselle, C.; Salmela, I.; Yelamos, J.; Barreiro, E. MicroRNA expression and protein acetylation pattern in respiratory and limb muscles of Parp-1−/− and Parp-2−/− mice with lung cancer cachexia. Biochim. Biophys. Acta 2015, 1850, 2530–2543. [Google Scholar] [CrossRef] [PubMed] [Green Version]
  60. Chacon-Cabrera, A.; Mateu-Jimenez, M.; Langohr, K.; Fermoselle, C.; Garcia-Arumi, E.; Andreu, A.L.; Yelamos, J.; Barreiro, E. Role of PARP activity in lung cancer-induced cachexia: Effects on muscle oxidative stress, proteolysis, anabolic markers, and phenotype. J. Cell Physiol. 2017, 232, 3744–3761. [Google Scholar] [CrossRef] [PubMed]
  61. Maeda, Y.; Hunter, T.C.; Loudy, D.E.; Dave, V.; Schreiber, V.; Whitsett, J.A. PARP-2 interacts with TTF-1 and regulates expression of surfactant protein-B. J. Biol. Chem 2006, 281, 9600–9606. [Google Scholar] [CrossRef] [Green Version]
  62. Vaziri, H.; Dessain, S.K.; Ng Eaton, E.; Imai, S.I.; Frye, R.A.; Pandita, T.K.; Guarente, L.; Weinberg, R.A. hSIR2(SIRT1) functions as an NAD-dependent p53 deacetylase. Cell 2001, 107, 149–159. [Google Scholar] [CrossRef] [Green Version]
  63. Nemoto, S.; Fergusson, M.M.; Finkel, T. SIRT1 functionally interacts with the metabolic regulator and transcriptional coactivator PGC-1α. J. Biol. Chem. 2005, 280, 16456–16460. [Google Scholar] [CrossRef] [PubMed] [Green Version]
  64. Rodgers, J.T.; Lerin, C.; Haas, W.; Gygi, S.P.; Spiegelman, B.M.; Puigserver, P. Nutrient control of glucose homeostasis through a complex of PGC-1alpha and SIRT1. Nature 2005, 434, 113–118. [Google Scholar] [CrossRef] [PubMed]
  65. Lagouge, M.; Argmann, C.; Gerhart-Hines, Z.; Meziane, H.; Lerin, C.; Daussin, F.; Messadeq, N.; Milne, J.; Lambert, P.; Elliott, P.; et al. Resveratrol Improves Mitochondrial Function and Protects against Metabolic Disease by Activating SIRT1 and PGC-1alpha. Cell 2006, 127, 1109–1122. [Google Scholar] [CrossRef]
  66. Gerhart-Hines, Z.; Rodgers, J.T.; Bare, O.; Lerin, C.; Kim, S.H.; Mostoslavsky, R.; Alt, F.W.; Wu, Z.; Puigserver, P. Metabolic control of muscle mitochondrial function and fatty acid oxidation through SIRT1/PGC-1alpha. EMBO J. 2007, 26, 1913–1923. [Google Scholar] [CrossRef]
  67. Rodgers, J.T.; Puigserver, P. Fasting-dependent glucose and lipid metabolic response through hepatic sirtuin 1. Proc. Natl. Acad. Sci. USA 2007, 104, 12861–12866. [Google Scholar] [CrossRef] [Green Version]
  68. Fodor, T.; Szanto, M.; Abdul-Rahman, O.; Nagy, L.; Der, A.; Kiss, B.; Bai, P. Combined Treatment of MCF-7 Cells with AICAR and Methotrexate, Arrests Cell Cycle and Reverses Warburg Metabolism through AMP-Activated Protein Kinase (AMPK) and FOXO1. PLoS ONE 2016, 11, e0150232. [Google Scholar] [CrossRef] [Green Version]
  69. Hegedűs, C.; Juhász, T.; Fidrus, E.; Janka, E.A.; Juhász, G.; Boros, G.; Paragh, G.; Uray, K.; Emri, G.; Remenyik, É.; et al. Cyclobutane pyrimidine dimers from UVB exposure induce a hypermetabolic state in keratinocytes via mitochondrial oxidative stress. Redox Biol. 2021, 38, 101808. [Google Scholar] [CrossRef]
  70. Dagda, R.K. Mito-Morphology Macro. Available online: https://imagejdocu.tudor.lu/plugin/morphology/mitochondrial_morphology_macro_plug-in/start (accessed on 24 June 2020).
  71. Russ, J.C.; Neal, B.F. The Image Processing Handbook; CRC Publications: Boca Raton, FL, USA, 2016. [Google Scholar] [CrossRef]
  72. Stauffer, W.; Sheng, H.; Lim, H.N. EzColocalization: An ImageJ plugin for visualizing and measuring colocalization in cells and organisms. Sci. Rep. 2018, 8, 15764. [Google Scholar] [CrossRef]
  73. Rueden, C.T.; Schindelin, J.; Hiner, M.C.; DeZonia, B.E.; Walter, A.E.; Arena, E.T.; Eliceiri, K.W. ImageJ2: ImageJ for the next generation of scientific image data. BMC Bioinform. 2017, 18, 529. [Google Scholar] [CrossRef] [PubMed]
  74. Sári, Z.; Mikó, E.; Kovács, T.; Jankó, L.; Csonka, T.; Sebő, E.; Toth, J.; Tóth, D.; Árkosy, P.; Boratkó, A.; et al. Indolepropionic acid, a metabolite of the microbiome, has cytostatic properties in breast cancer by activating AHR and PXR receptors and inducing oxidative stress. Cancers 2020, 12, 2411. [Google Scholar] [CrossRef] [PubMed]
  75. Jang, S.Y.; Kang, H.T.; Hwang, E.S. Nicotinamide-induced mitophagy: Event mediated by high NAD+/NADH ratio and SIRT1 protein activation. J. Biol. Chem. 2012, 287, 19304–19314. [Google Scholar] [CrossRef] [Green Version]
  76. Klimova, N.; Long, A.; Kristian, T. Nicotinamide mononucleotide alters mitochondrial dynamics by SIRT3-dependent mechanism in male mice. J. Neurosci. Res. 2019, 97, 975–990. [Google Scholar] [CrossRef] [Green Version]
  77. Klimova, N.; Long, A.; Scafidi, S.; Kristian, T. Interplay between NAD+ and acetyl-CoA metabolism in ischemia-induced mitochondrial pathophysiology. Biochim. Biophys. Acta Mol. Basis Dis. 2019, 1865, 2060–2067. [Google Scholar] [CrossRef]
  78. Lovy, A.; Ahumada-Castro, U.; Bustos, G.; Farias, P.; Gonzalez-Billault, C.; Molgó, J.; Cardenas, C. Concerted Action of AMPK and Sirtuin-1 Induces Mitochondrial Fragmentation Upon Inhibition of Ca2+ Transfer to Mitochondria. Front. Cell Dev. Biol. 2020, 8, 378. [Google Scholar] [CrossRef] [PubMed]
  79. Klimova, N.; Fearnow, A.; Long, A.; Kristian, T. NAD+ precursor modulates post-ischemic mitochondrial fragmentation and reactive oxygen species generation via SIRT3 dependent mechanisms. Exp. Neurol. 2020, 325, 113144. [Google Scholar] [CrossRef]
  80. Song, S.B.; Park, J.S.; Jang, S.Y.; Hwang, E.S. Nicotinamide Treatment Facilitates Mitochondrial Fission through Drp1 Activation Mediated by SIRT1-Induced Changes in Cellular Levels of cAMP and Ca2+. Cells 2021, 10, 612. [Google Scholar] [CrossRef]
  81. Liu, G.; Park, S.H.; Imbesi, M.; Nathan, W.J.; Zou, X.; Zhu, Y.; Jiang, H.; Parisiadou, L.; Gius, D. Loss of NAD-Dependent Protein Deacetylase Sirtuin-2 Alters Mitochondrial Protein Acetylation and Dysregulates Mitophagy. Antioxid. Redox Signal. 2017, 26, 849–863. [Google Scholar] [CrossRef]
  82. Pirinen, E.; Cantó, E.; Jo, S.K.; Morato, L.; Zhang, H.; Menzies, K.J.; Williams, E.G.; Mouchiroud, L.; Moullan, N.; Hagberg, C.; et al. Pharmacological Inhibition of Poly(ADP-Ribose) Polymerases Improves Fitness and Mitochondrial Function in Skeletal Muscle. Cell Metab. 2014, 19, 1034–1041. [Google Scholar] [CrossRef] [Green Version]
  83. Pacher, P.; Beckman, J.S.; Liaudet, L. Nitric oxide and peroxynitrite in health and disease. Physiol. Rev. 2007, 87, 315–424. [Google Scholar] [CrossRef] [Green Version]
  84. Virag, L.; Szabo, C. The therapeutic potential of poly(ADP-ribose) polymerase inhibitors. Pharmacol. Rev. 2002, 54, 375–429. [Google Scholar] [CrossRef]
  85. Rodriguez-Vargas, J.M.; Martin-Hernandez, K.; Wang, W.; Kunath, N.; Suganthan, R.; Amé, J.C.; Oliver, F.J.; Ye, J.; Bjørås, M.; Dantzer, F. Parp3 promotes astrocytic differentiation through a tight regulation of Nox4-induced ROS and mTorc2 activation. Cell Death Dis. 2020, 11, 954. [Google Scholar] [CrossRef]
  86. Houtkooper, R.H.; Mouchiroud, L.; Ryu, D.; Moullan, N.; Katsyuba, E.; Knott, G.; Williams, R.W.; Auwerx, J. Mitonuclear protein imbalance as a conserved longevity mechanism. Nature 2013, 497, 451–457. [Google Scholar] [CrossRef] [Green Version]
  87. Bai, P.; Cantó, C.; Oudart, H.; Brunyánszki, A.; Cen, Y.; Thomas, C.; Yamamoto, H.; Huber, A.; Kiss, B.; Houtkooper, R.H.; et al. PARP-1 inhibition increases mitochondrial metabolism through SIRT1 activation. Cell Metab. 2011, 13, 461–468. [Google Scholar] [CrossRef] [Green Version]
  88. White, A.T.; Schenk, S. NAD+/NADH and skeletal muscle mitochondrial adaptations to exercise. Am. J. Physiol. Endocrinol. Metab. 2012, 303, E308–E321. [Google Scholar] [CrossRef] [Green Version]
  89. Huang, C.T.; Huang, D.Y.; Hu, C.J.; Wu, D.; Lin, W.W. Energy adaptive response during parthanatos is enhanced by PD98059 and involves mitochondrial function but not autophagy induction. Biochim. Biophys. Acta 2013, 1843, 531–543. [Google Scholar] [CrossRef] [Green Version]
  90. Scheibye-Knudsen, M.; Mitchell, S.J.; Fang, E.F.; Iyama, T.; Ward, T.; Wang, J.; Dunn, C.A.; Singh, N.; Veith, S.; Hasan-Olive, M.M.; et al. A high-fat diet and NAD+ activate Sirt1 to rescue premature aging in cockayne syndrome. Cell Metab. 2014, 20, 840–855. [Google Scholar] [CrossRef] [PubMed] [Green Version]
  91. Mukhopadhyay, P.; Horvath, B.; Rajesh, M.; Varga, Z.V.; Gariani, K.; Ryu, D.; Cao, Z.; Holovac, E.; Park, O.; Zhou, Z.; et al. PARP inhibition protects against alcoholic and non-alcoholic steatohepatitis. J. Hepatol. 2017, 66, 589–600. [Google Scholar] [CrossRef] [PubMed] [Green Version]
  92. Fakouri, N.B.; Durhuus, J.A.; Regnell, C.E.; Angleys, M.; Desler, C.; Hasan-Olive, M.M.; Martin-Pardillos, A.; Tsaalbi-Shtylik, A.; Thomsen, K.; Lauritzen, M.; et al. Rev1 contributes to proper mitochondrial function via the PARP-NAD+-SIRT1-PGC1alpha axis. Sci. Rep. 2017, 7, 12480. [Google Scholar] [CrossRef] [PubMed] [Green Version]
  93. Ryu, D.; Zhang, H.; Ropelle, E.R.; Sorrentino, V.; Mázala, D.A.; Mouchiroud, L.; Marshall, P.L.; Campbell, M.D.; Ali, A.S.; Knowels, G.M.; et al. NAD+ repletion improves muscle function in muscular dystrophy and counters global PARylation. Sci. Transl. Med. 2016, 8, 361ra139. [Google Scholar] [CrossRef] [Green Version]
  94. Nagy, L.; Rauch, B.; Balla, N.; Ujlaki, G.; Kis, G.; Abdul-Rahman, O.; Kristof, E.; Sipos, A.; Antal, M.; Toth, A.; et al. Olaparib induces browning of in vitro cultures of human primary white adipocytes. Biochem. Pharmacol. 2019, 25, 30250–30253. [Google Scholar] [CrossRef]
  95. Gottlieb, R.A.; Bernstein, D. Mitochondrial remodeling: Rearranging, recycling, and reprogramming. Cell Calcium 2016, 60, 88–101. [Google Scholar] [CrossRef] [Green Version]
  96. Onodera, Y.; Nam, J.M.; Horikawa, M.; Shirato, H.; Sabe, H. Arf6-driven cell invasion is intrinsically linked to TRAK1-mediated mitochondrial anterograde trafficking to avoid oxidative catastrophe. Nat. Commun. 2018, 9, 2682. [Google Scholar] [CrossRef] [PubMed]
  97. Da Cunha, F.M.; Torelli, N.Q.; Kowaltowski, A.J. Mitochondrial Retrograde Signaling: Triggers, Pathways, and Outcomes. Oxid. Med. Cell. Longev. 2015, 2015, 482582. [Google Scholar] [CrossRef] [Green Version]
  98. Adam-Vizi, V.; Chinopoulos, C. Bioenergetics and the formation of mitochondrial reactive oxygen species. Trends Pharmacol. Sci. 2006, 27, 639–645. [Google Scholar] [CrossRef]
  99. Curtin, N.; Szabo, C. Therapeutic Applications of PARP Inhibitors: Anticancer Therapy and Beyond. Mol. Asp. Med. 2013, 6, 1043–1258. [Google Scholar] [CrossRef] [Green Version]
  100. Berger, N.A.; Besson, V.C.; Boulares, A.H.; Burkle, A.; Chiarugi, A.; Clark, R.S.; Curtin, N.J.; Cuzzocrea, S.; Dawson, T.M.; Dawson, V.L.; et al. Opportunities for the repurposing of PARP inhibitors for the therapy of non-oncological diseases. Br. J. Pharmacol. 2018, 175, 192–222. [Google Scholar] [CrossRef]
  101. Curtin, N.J.; Szabo, C. Poly(ADP-ribose) polymerase inhibition: Past, present and future. Nat. Rev. Drug Discov. 2020, 19, 711–736. [Google Scholar] [CrossRef] [PubMed]
  102. Wang, Y.; Kim, N.S.; Haince, J.F.; Kang, H.C.; David, K.K.; Andrabi, S.A.; Poirier, G.G.; Dawson, V.L.; Dawson, T.M. Poly(ADP-ribose) (PAR) binding to apoptosis-inducing factor is critical for PAR polymerase-1-dependent cell death (parthanatos). Sci. Signal. 2011, 4, 20. [Google Scholar] [CrossRef] [Green Version]
  103. Andrabi, S.A.; Kang, H.C.; Haince, J.F.; Lee, Y.I.; Zhang, J.; Chi, Z.; West, A.B.; Koehler, R.C.; Poirier, G.G.; Dawson, T.M.; et al. Iduna protects the brain from glutamate excitotoxicity and stroke by interfering with poly(ADP-ribose) polymer-induced cell death. Nat. Med. 2011, 17, 692–699. [Google Scholar] [CrossRef]
Figure 1. Silencing of PARP2 in C2C12 myoblasts and HepG2 cells. (A) A total of 200,000 scPARP2 or shPARP2 C2C12 cells were seeded into 6-well plates, and the expression of PARP2 was determined by RT-qPCR (n = 3) and Western blotting (n = 3). (B) A total of 250,000 scPARP2 or shPARP2 HepG2 cells were seeded into 6-well plates, and the expression of PARP2 was determined by RT-qPCR (n = 3) and Western blotting (n = 3). Representative Western blot images are presented. Numerical values are presented as the average ± SEM. Statistical significance was determined using paired, two-tailed Student’s t-test. *** Statistically significant differences between scPARP2 and shPARP2 C2C12 cells or scPARP2 and shPARP2 HepG2 cells at p < 0.001.
Cells 10 01387 g001
Figure 2. Silencing of PARP2 leads to mitochondrial fragmentation. (A,B) A total of 70,000 scPARP2 or shPARP2 C2C12 cells were seeded into 24-well plates on glass coverslips, and the cells were labeled with MitoTracker Red (n = 3) (A) or TOMM20 antibody (B). The nuclei were visualized using DAPI (n = 3). Mitochondrial morphology was analyzed using ImageJ software with Mito-Morphology Macro (measured cells: 20/20). (C) Osmiated scPARP2 and shPARP2 C2C12 cells were analyzed by electron microscopy (n = 1; 45 cells were assessed from each group). Mitochondrial numbers were determined using ImageJ software, and mitochondrial intersections number/cell surface were plotted. Representative immunofluorescence, electron microscopic, and Western blot images are presented in the figure. Numeric values are presented as the average ± SEM in (A,B) and as the average ± SD in (C). Statistical significance was determined using paired, two-tailed Student’s t-test in (AC). *, **, and *** Statistically significant differences between the indicated groups at p < 0.05, p < 0.01, and p < 0.001, respectively.
Cells 10 01387 g002
Figure 3. Acute silencing of PARP2 leads to mitochondrial fragmentation. (A,B) A total of 30,000 C2C12 cells were seeded into 24-well plates, and PARP2 was transiently silenced using three types of siRNAs (n = 3). Cells were assessed 48 h post-transfection, then the expression of PARP2 was determined using RT-qPCR (n = 3) and Western blotting (n = 3) (A). In the same cells, mitochondrial structure was investigated using MitoTracker Red staining (n = 3) (B). Mitochondrial morphology was analyzed using ImageJ software with Mito-Morphology Macro (measured cells: 20 from each group). Representative Western blot and immunofluorescence images are presented. Numerical values are presented as the average ± SEM. Statistical significance was determined using ANOVA followed by Dunnett’s post hoc test. *, **, and *** Statistically significant differences between the negative control and transiently transfected samples at p < 0.05, p < 0.01, and p < 0.001, respectively.
Cells 10 01387 g003
Figure 4. Mitochondrial fragmentation in shPARP2 C2C12 is not due to mitophagy or SIRT1 activation. (A) A total of 70,000 scPARP2 or shPARP2 C2C12 cells were seeded into 24-well plates on glass coverslips, and LC3-MitoTracker Red–DAPI or LC3-TOMM20–DAPI co-immunofluorescence was performed (n = 3). Co-localization analysis was performed using ImageJ software with the EzColocalization plug-in (measured cells: 100/100). (B) A total of 30,000 scPARP2 or shPARP2 C2C12 cells were seeded into 24-well plates, and SIRT1 was transiently silenced. After transfection, the expression of SIRT1 was determined using RT-qPCR (n = 3) and Western blotting (n = 3). The mitochondrial structure was investigated using MitoTracker Red staining (n = 3). Mitochondrial morphology was analyzed using ImageJ software with Mito-Morphology Macro (measured cells: 20 from each group). Representative immunofluorescence and Western blot images are presented in the figure. Numerical values are presented as the average ± SEM. Statistical significance was determined using paired, two-tailed Student’s t-test in (A), while in (B), ANOVA followed by Tukey’s post hoc test was used. *, **, and *** Statistically significant differences between the scPARP2 and shPARP2 C2C12 cells at p < 0.05, p < 0.01, and p < 0.001, respectively. ## and ### Statistically significant differences between the negative control and transiently transfected samples at p < 0.01 and p < 0.001, respectively.
Cells 10 01387 g004
Figure 5. Deregulation of mitochondrial dynamics did not influence mitochondrial fragmentation. (A,B) A total of 200,000 scPARP2 or shPARP2 C2C12 cells were seeded into 6-well plates. (A) mRNA and (B) protein expression of the indicated mitochondrial fusion/fission genes were assessed by RT-qPCR (n = 4/6) or Western blotting (n = 3). Representative Western blot images are presented in (B). Numerical values are presented as the average ± SEM. Statistical significance was determined using paired, two-tailed Student’s t-test. * Statistically significant differences between the scPARP2 and shPARP2 C2C12 cells at p < 0.05.
Cells 10 01387 g005
Figure 6. Silencing of PARP2 induces mitochondrial fragmentation in HepG2 cells. (A) Osmiated scPARP2 and shPARP2 HepG2 cells were analyzed by electron microscopy (n = 1; 45 cells were assessed from each group). Mitochondrial numbers were determined using ImageJ software, and mitochondrial intersections number/cell surface were plotted. (B,C) A total of 80,000 scPARP2 or shPARP2 HepG2 cells were seeded into 24-well plates on glass coverslips, and the cells were labeled with MitoTracker Red (n = 3) (B) or TOMM20 antibody (C) (n = 3). The nuclei were visualized using DAPI. Mitochondrial morphology was analyzed using ImageJ software with Mito-Morphology Macro (measured cells: 20/20). Representative Western blot and electron microscopic and immunofluorescence images are presented in the figure. Numerical values are presented as the average ± SEM in (B,C) and as the average ± SD in (A). Statistical significance was determined using paired, two-tailed Student’s t-test. *, **, and *** Statistically significant differences between the scPARP2 and shPARP2 HepG2 cells at p < 0.05, p < 0.01, and p < 0.001, respectively.
Cells 10 01387 g006
Figure 7. Mitophagy or deregulation of the mitochondrial fusion/fission system is not responsible for mitochondrial fragmentation in HepG2 cells. (A) A total of 80,000 scPARP2 or shPARP2 HepG2 cells were seeded into 24-well plates on glass coverslips, and LC3-MitoTracker Red–DAPI or LC3-TOMM20–DAPI co-immunofluorescence was performed (n = 3). Co-localization analysis was performed using ImageJ software with the EzColocalization plug-in (measured cells: 100/100). (B) A total of 250,000 scPARP2 or shPARP2 HepG2 cells were seeded into 6-well plates. The mRNA expression of mitochondrial fusion/fission genes was assessed by RT-qPCR (n = 3). Representative immunofluorescence images are presented in (A). Numerical values are presented as the average ± SEM. Statistical significance was determined using paired, two-tailed Student’s t-test. *, **, and *** Statistically significant differences between the scPARP2 and shPARP2 HepG2 cells at p < 0.05, p < 0.01, and p < 0.001, respectively.
Cells 10 01387 g007
Figure 8. Oxidative stress is induced upon the silencing of PARP2. (A) A total of 200,000 scPARP2 or shPARP2 C2C12 cells were seeded into 6-well plates, and superoxide production was determined by dihydroethidium (DHE) staining (n = 3). (B) A total of 700,000 scPARP2 or shPARP2 C2C12 cells were seeded into T75 cell culture flasks, and lipid peroxidation was determined by TBARS assay (n = 5). Data were normalized to the cell number. (CE) A total of 200,000 scPARP2 or shPARP2 C2C12 cells were seeded into a 6-well plate. 4-Hydroxynonenal (4HNE) (C), inducible nitric oxide synthase (iNOS) (D), or nitrotyrosine (NTyr) (E) expression was assessed by Western blotting (n = 3). (F) A total of 200,000 scPARP2 or shPARP2 C2C12 cells were seeded into 6-well plates, and the expression of Nox4 was determined by RT-qPCR (n = 3). Representative Western blot images are presented in (CE). Numerical values are presented as the average ± SEM. Statistical significance was determined using paired, two-tailed Student’s t-test. *, **, and *** Statistically significant differences between the scPARP2 and shPARP2 C2C12 cells at p < 0.05, p < 0.01, and p < 0.001, respectively.
Cells 10 01387 g008
Figure 9. General reductants and MitoTEMPO can prevent mitochondrial fragmentation and mitochondrial biogenesis. (A) A total of 20,000 scPARP2 or shPARP2 C2C12 cells were seeded into 24-well plates on glass coverslips and treated with 5 mM glutathione (GSH), 5 mM N-acetyl-L-cysteine (NAC), or 10 µM MitoTEMPO for 48 h. After treatment, the mitochondrial structure was investigated using MitoTracker Red staining (n = 3). Mitochondrial morphology was analyzed using ImageJ software with Mito-Morphology Macro (measured cells: 20 from each group). (B) A total of 100,000 scPARP2 or shPARP2 C2C12 cells were seeded into 6-well plates and treated with 5 mM glutathione (GSH), 5 mM N-acetyl-L-cysteine (NAC), or 10 µM MitoTEMPO for 48 h. After treatment, mRNA expression of the indicated mitochondrial genes was assessed by RT-qPCR (n = 4). (C) A total of 2000 scPARP2 or shPARP2 C2C12 cells were seeded into 96-well assay plates and treated with 5 mM glutathione (GSH), 5 mM N-acetyl-L-cysteine (NAC), or 10 µM MitoTEMPO for 48 h. After treatment, Seahorse assays were performed in the presence or absence of etomoxir to assess total and fatty acid-dependent oxidation (n = 3). (D) A total of 100,000 scPARP2 or shPARP2 C2C12 cells were seeded into 6-well plates and treated with 5 mM glutathione (GSH), 5 mM N-acetyl-L-cysteine (NAC), or 10 µM MitoTEMPO for 48 h. ATP content was assessed using the ATP Assay Kit. Data were normalized to protein content, and normalized readings are displayed. Representative immunofluorescence images are presented in (A). Numerical values are presented as the average ± SEM. Statistical significance was determined using ANOVA followed by Tukey’s post hoc test, except for (B); in the shPARP2/scPARP ratio, Dunnett’s post hoc test was used. *, **, and *** Statistically significant differences between the scPARP2 and shPARP2 C2C12 cells at p < 0.05, p < 0.01, and p < 0.001, respectively. #, ##, and ### Statistically significant differences between control and treated samples at p < 0.05, p < 0.01, and p < 0.001, respectively.
Cells 10 01387 g009
Figure 10. Silencing of PARP2 does not affect cell proliferation or spontaneous cell death. (A) A total of 2000 scPARP2 or shPARP2 C2C12 cells were seeded into 96-well plates and treated with 5 mM glutathione (GSH), 5 mM N-acetyl-L-cysteine (NAC), or 10 µM MitoTEMPO for 48 h. After treatment, cell proliferation (SRB) assays were performed (n = 3). (B) A total of 100,000 scPARP2 or shPARP2 C2C12 cells were seeded into 6-well plates and treated with 5 mM glutathione (GSH), 5 mM N-acetyl-L-cysteine (NAC), or 10 µM MitoTEMPO for 48 h. Cell death was assessed using the FITC Annexin V/Dead Cell Apoptosis Kit. Numerical values are presented as the average ± SEM. Statistical significance was determined using ANOVA followed by Tukey’s post hoc test. # Statistically significant differences between control and treated samples at p < 0.05.
Cells 10 01387 g010
Figure 11. Silencing of PARP1 does not influence the mitochondrial morphology induced by the silencing of PARP2. (A,B) A total of 30,000 scPARP2 or shPARP2 C2C12 cells were seeded into 24-well plates, and PARP1 was transiently silenced using three types of siRNAs (n = 3). (A) Cells were assessed 48 h post-transfection, and then the expression of PARP1 was determined using RT-qPCR (n = 3). Expression of PARP1 and PAR was determined using Western blotting (n = 3). (B) In the same cells, the mitochondrial structure was investigated using MitoTracker Red staining (n = 3). Mitochondrial morphology was analyzed using ImageJ software with Mito-Morphology Macro (measured cells: 20 from each group). Representative Western blot and immunofluorescence images are presented in the figure. Numerical values are presented as the average ± SEM. Statistical significance was determined using ANOVA followed by Tukey’s post hoc test. *** Statistically significant differences between the scPARP2 and shPARP2 C2C12 cells at p < 0.05. #, ##, and ### Statistically significant differences between the negative control and transiently transfected samples at p < 0.05, p < 0.01, and p < 0.001, respectively.
Cells 10 01387 g011
Figure 12. Silencing of PARP3 does not influence the mitochondrial morphology induced by the silencing of PARP2. (A,B) A total of 30,000 scPARP2 or shPARP2 C2C12 cells were seeded into 24-well plates, and PARP3 was transiently silenced using three types of siRNAs (n = 3). (A) Cells were assessed 48 h post-transfection, and then the expression of PARP3 was determined using RT-qPCR (n = 3). Expression of PARP3 and PAR was determined using Western blotting (n = 3). (B) In the same cells, the mitochondrial structure was investigated using MitoTracker Red staining (n = 3). Mitochondrial morphology was analyzed using ImageJ software with Mito-Morphology Macro (measured cells: 20 from each group). Representative Western blot and immunofluorescence images are presented in the figure. Numerical values are presented as the average ± SEM. Statistical significance was determined using ANOVA followed by Tukey’s post hoc test. *, **, and *** Statistically significant differences between the scPARP2 and shPARP2 C2C12 cells at p < 0.05, p < 0.01, and p < 0.001, respectively. #, ##, and ### Statistically significant differences between the negative control and transiently transfected samples at p < 0.05, p < 0.01, and p < 0.001, respectively.
Cells 10 01387 g012
Table 1. List of antibodies used in immunofluorescence.
AntibodyCompanyCatalog NumberDilution
TOMM20Abcam
(Cambridge, MA, USA)
ab567831:200
LC3A/B Alexa Fluor 488 conjugateCell Signaling Technology (Danvers, MA, USA)130821:50
Goat-anti mouse IgG Alexa Fluor 546Thermo Fisher Scientific (Walthan, MA, USA)A-110031:1000
TOMM20: translocase of outer mitochondrial membrane 20.
Table 2. List of RT-qPCR primers used in the study.
Gene NamePrimers
COX175′-CGTGATGCGTGCATCATTGA-3′
5′-CATTCACAAAGTAGGCCACC-3′
Cyclophilin5′-TGGAGAGCACCAAGACAGACA-3′
5′-TGCCGGAGTCGACAATGAT-3′
Cyt C5′-TCCATCAGGGTATCCTCTCC-3′
5′-GGAGGCAAGCATAAGACTGG-3′
Drp15′-TCGAGTCCCCATTCATTGCAGT-3′
5′-GAAGAAGGTCCCTGCCCACTAG-3′
Fis15′-CTGGACTCATTGGACTGGCTGT-3′
5′-AGAGGTAGACTACAGGGGTGCA-3′
Mfn15′-GGTCCTGCAATCACTCTGTCCT-3′
5′-CCCATTTCACCCCTTCAGACCT-3′
Mfn25′-GTGATCAGGTTCAGCGTCCTCT-3′
5′-CCACTCCTCCGACCACAAGAAT-3′
Ndufa25′-GCACACATTTCCCCACACTG-3′
5′-CCCAACCTGCCCATTCTGAT-3′
Ndufb35′-TACCACAAACGCAGCAAACC-3′
5′-AAGGGACGCCATTAGAAACG-3′
Ndufb55′-CTTCGAACTTCCTGCTCCTT-3′
5′-GGCCCTGAAAAGAACTACG-3′
Nox45′-GCAGATTTACTCTGTGTGTTGCAT-3′
5′-TCCCATCTGTTTGACTGAGGT-3′
Opa15′-ATTGTGTGCTCTCAGTCAGGCT-3′
5′-ACCTTTCCCTGACGCCTAGTTC-3′
Parkin5′-AAATGCATCTGGAGGGGACGAA-3′
5′-TAACTGGACCTCTGGCTGCTTC-3′
Parp15′-GGAGCTGCTCATCTTCAACC-3′
5′-GCAGTGACATCCCCAGTACA-3′
Parp25′-GGAAGGCGAGTGCTAAATGAA-3′
5′-AAGGTCTTCACAGAGTCTCGATTG-3′
Parp35′-CCTGCTGATAATCGGGTCAT-3′
5′-TTGTTGTTGTTGCCGATGTT-3′
Pink15′-GGGAAGAACAGCCTTGAACAGC-3′
5′-GCAAAGTTCAGTGTTGGCCTCA-3′
Sirt15′-TGTGAAGTTACTGCAGGAGTGTAAA-3′
5′-GCATAGATACCGTCTCTTGATCTGAA-3′
36B45′-AGATTCGGGATATGCTGTTGG-3′
5′-AAAGCCTGGAAGAAGGAGGTC-3′
Ndufa2/Ndufb3/Ndufb5: NADH:ubiquinone oxidoreductase subunit A2/B3/B5; Cox17: cytochrome c oxidase; Cyt C: cytochrome c; Sirt1: sirtuin 1; Mfn1: mitofusin 1; Mfn2: mitofusin 2; Opa1: optic atrophy 1; Fis1: fission; Drp1: dynamin-1-like protein; Pink1: PTEN induced kinase 1; PARP1: poly(ADP-ribose) polymerase-1, PARP3: poly(ADP-ribose) polymerase-3, Nox4: NADPH oxidase 4.
Table 3. List of antibodies used for Western blotting.
AntibodyCompanyCatalog NumberDilution
GAPDHSigma-AldrichG95451:10,000
HSP25Enzo Life SciencesADI-SPA-8011:1500
HSP70/HSP72 (C92F3A-5)Enzo Life SciencesADI-SPA-8101:8000
HSC70/HSP70 (N27F3-4)Enzo Life SciencesADI-SPA-8201:1000
HSP40 (C-20)Santa Cruz Biotechnologysc-18001:1000
HSP90 (AC88)Enzo Life SciencesADI-SPA-8301:1000
HSP110Becton Dickinson Biosciences6105101:2500
iNOSNovus BiologicalsNB300-6051:1000
NTyrMillipore06-2841:1000
OPA1Thermo Fisher ScientificMA5-161491:1000
ParkinThermo Fisher ScientificPA5-133991:1000
PARP1Cell Signaling Technology95321:2000
PARP2Enzo Life SciencesALX-210-8991:2000
PARP3Novus BiologicalsNBP1-314151:1000
PARSigma-AldrichMABC5471:1000
PINK1Novus BiologicalsBC100-4941:1000
SIRT1Millipore07-1311:1000
4HNEAbcamab465451:1000
Anti-mouse IgG, HRP-linkedSigma-AldrichA90441:2000
Anti-rabbit IgG, HRP-linkedCell Signaling Technology70741:2000
Anti-β-actin-peroxidaseSigma-AldrichA38541:20,000
HNE: 4-hydroxynonenal, iNOS: inducible nitric oxide synthase; NTyr: nitrotyrosine; HSP: heat shock protein; HSC: heat shock cognate protein; GAPDH: glyceraldehyde-3-phosphate dehydrogenase.
Publisher’s Note: MDPI stays neutral with regard to jurisdictional claims in published maps and institutional affiliations.

