
Substrate Stiffness and Stretch Regulate Profibrotic Mechanosignaling in Pulmonary Arterial Adventitial Fibroblasts

Abstract
1. Introduction
2. Materials and Methods
2.1. Cell Isolation
2.2. Stretcher Preparation
2.3. Inhibition Studies
2.4. RNA Isolation
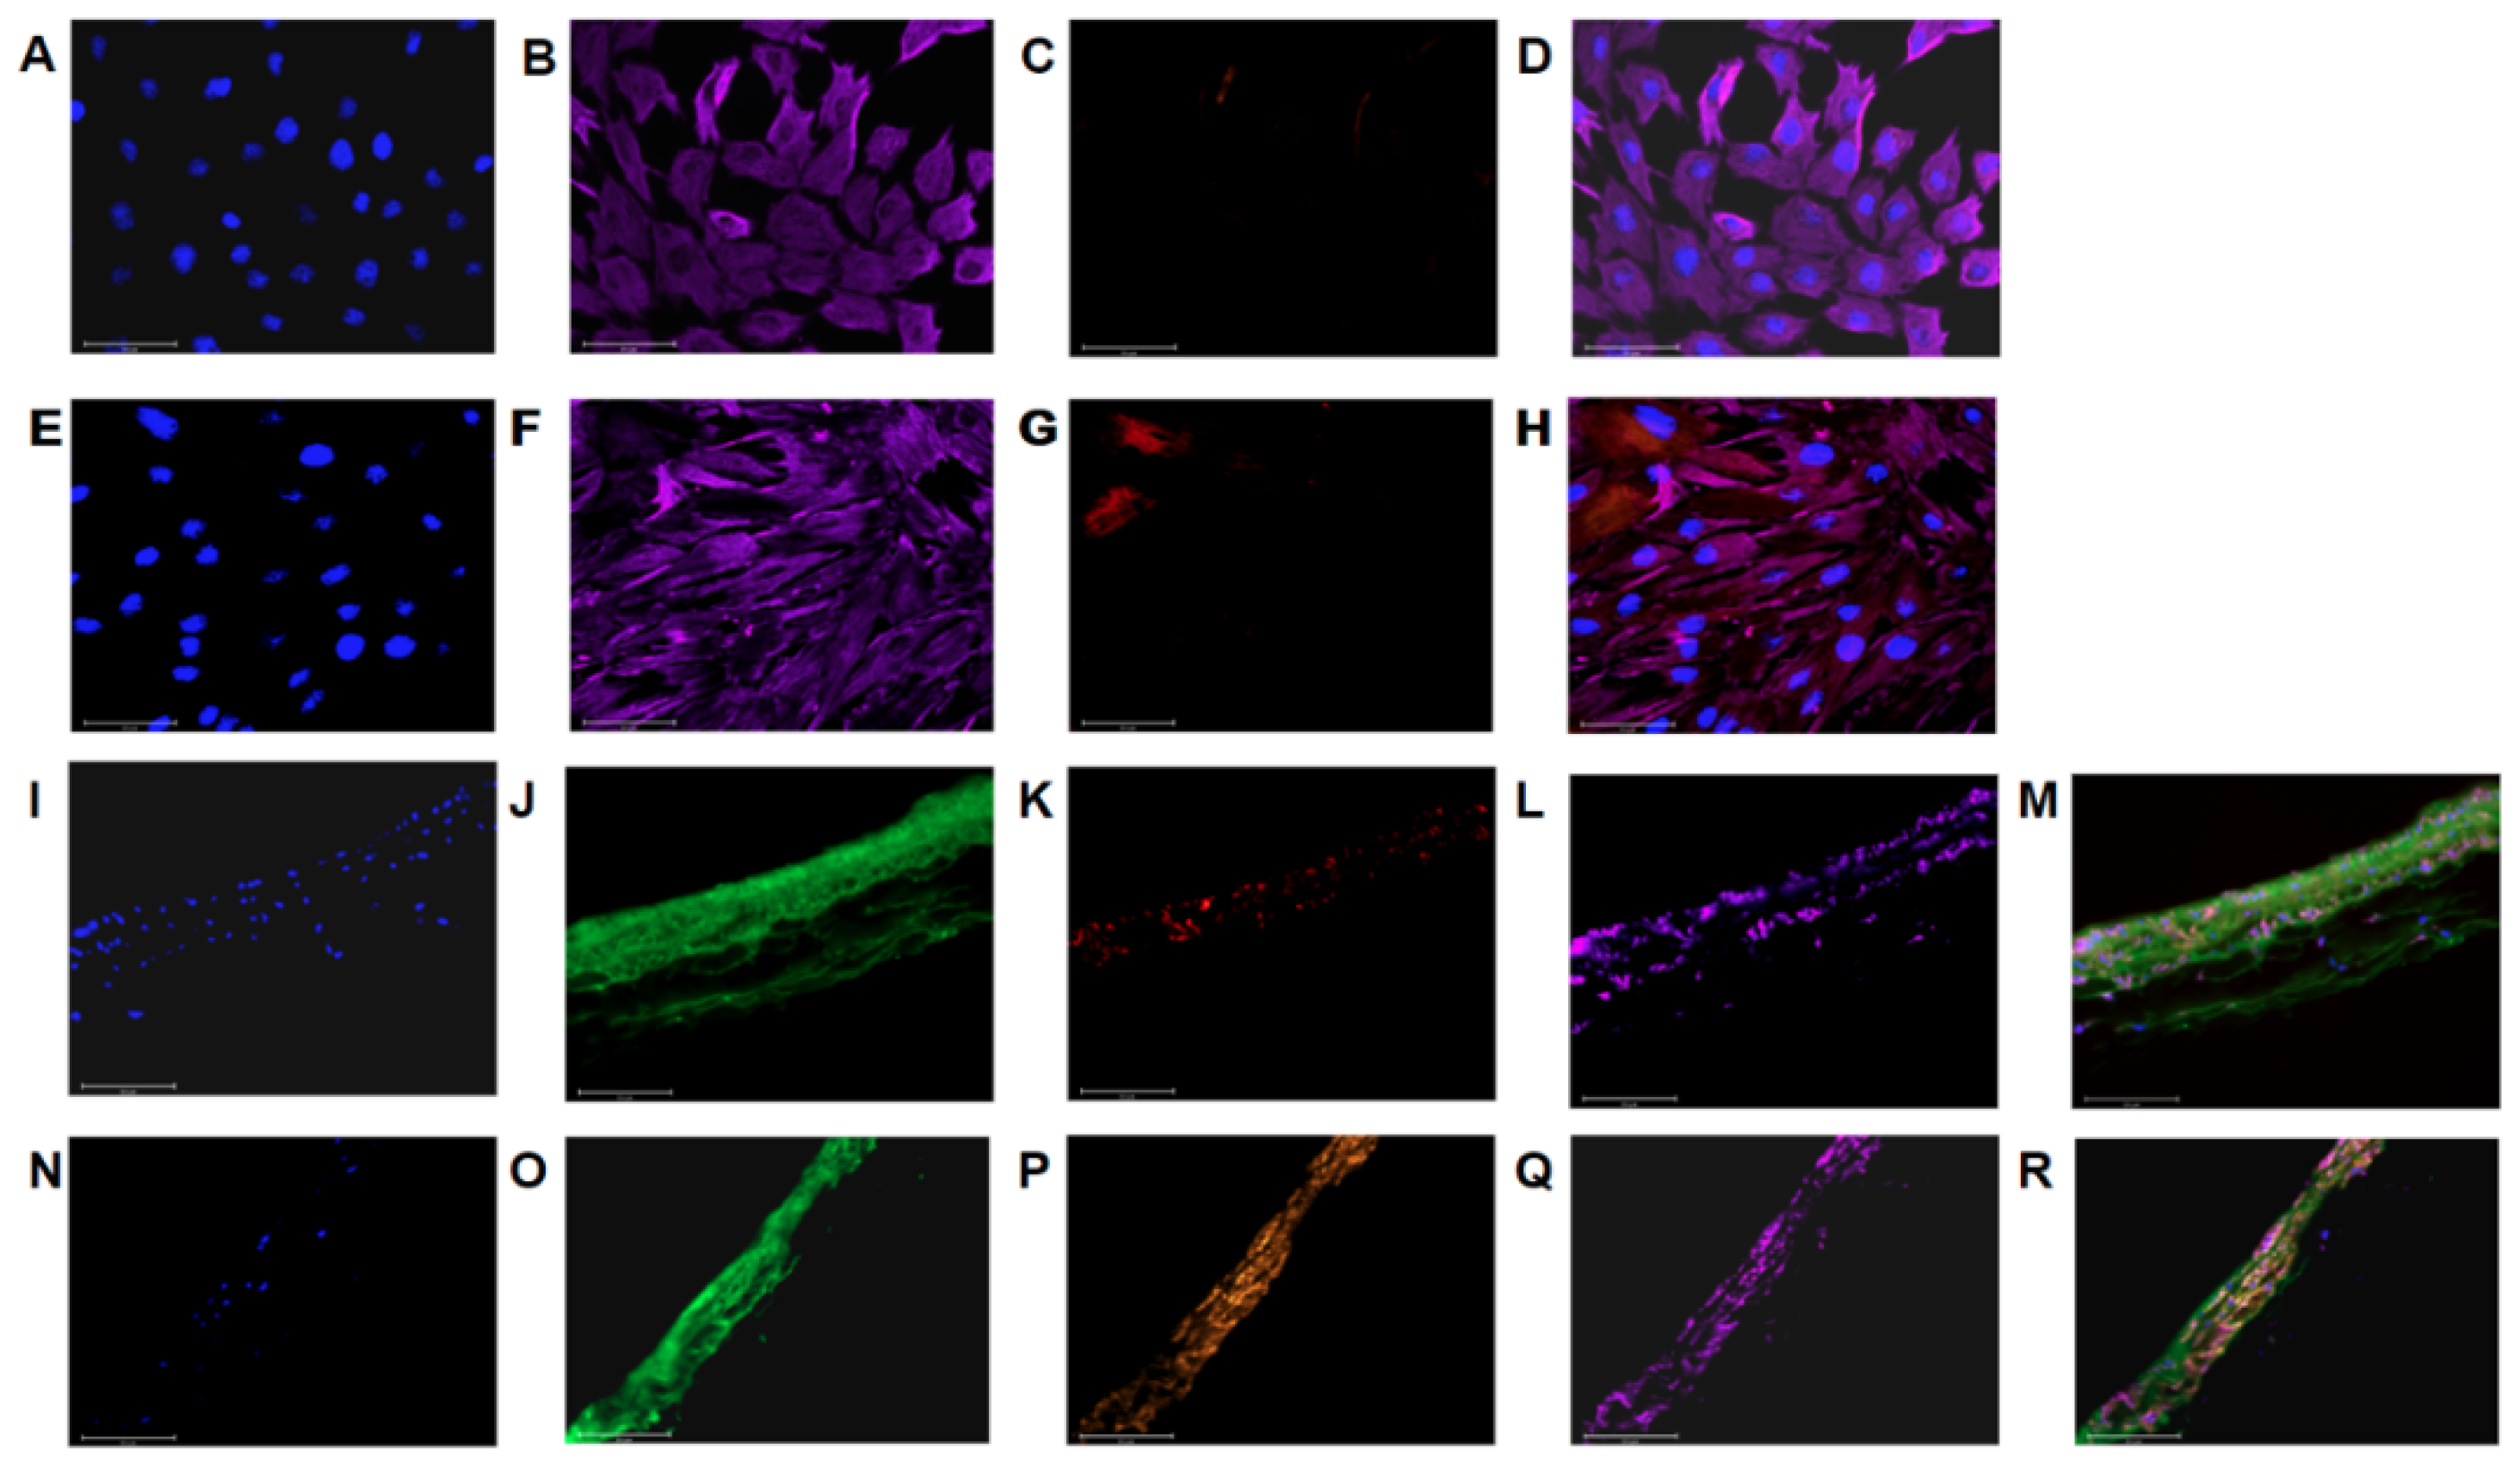
2.5. Imaging
2.6. Protein Quantification
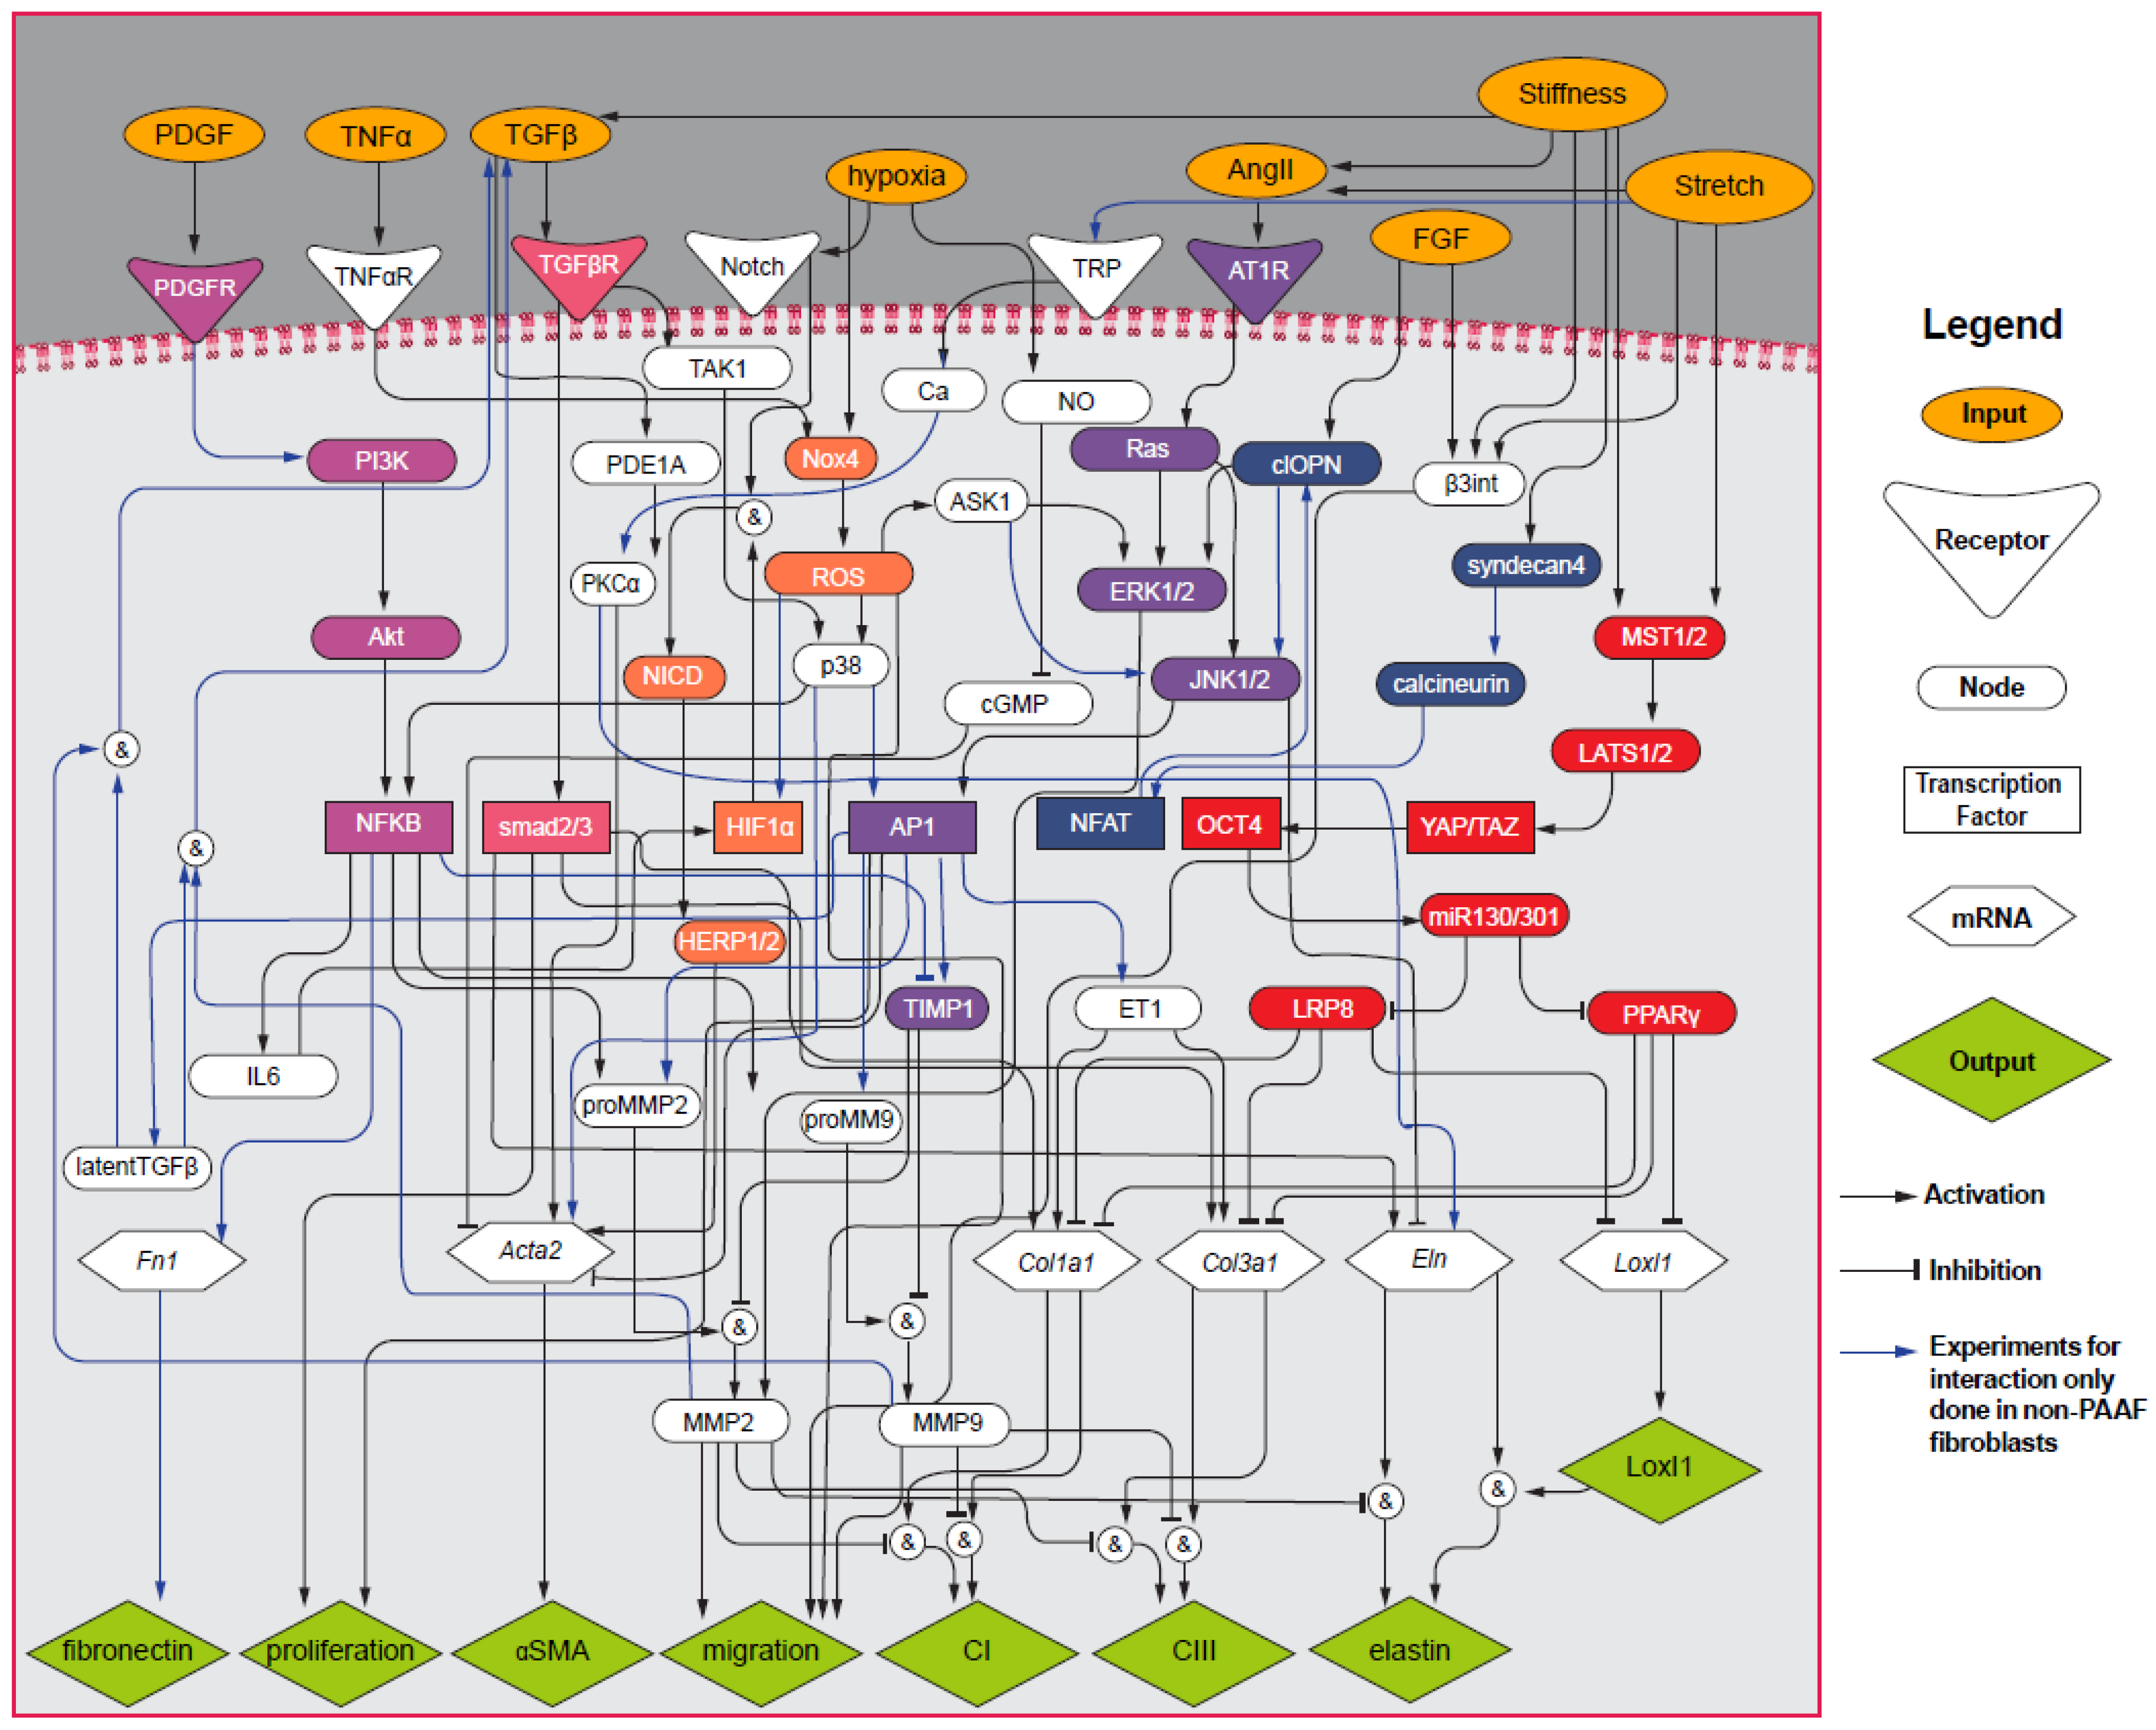
2.7. Computational PAAF Network Model
2.8. Statistics
3. Results
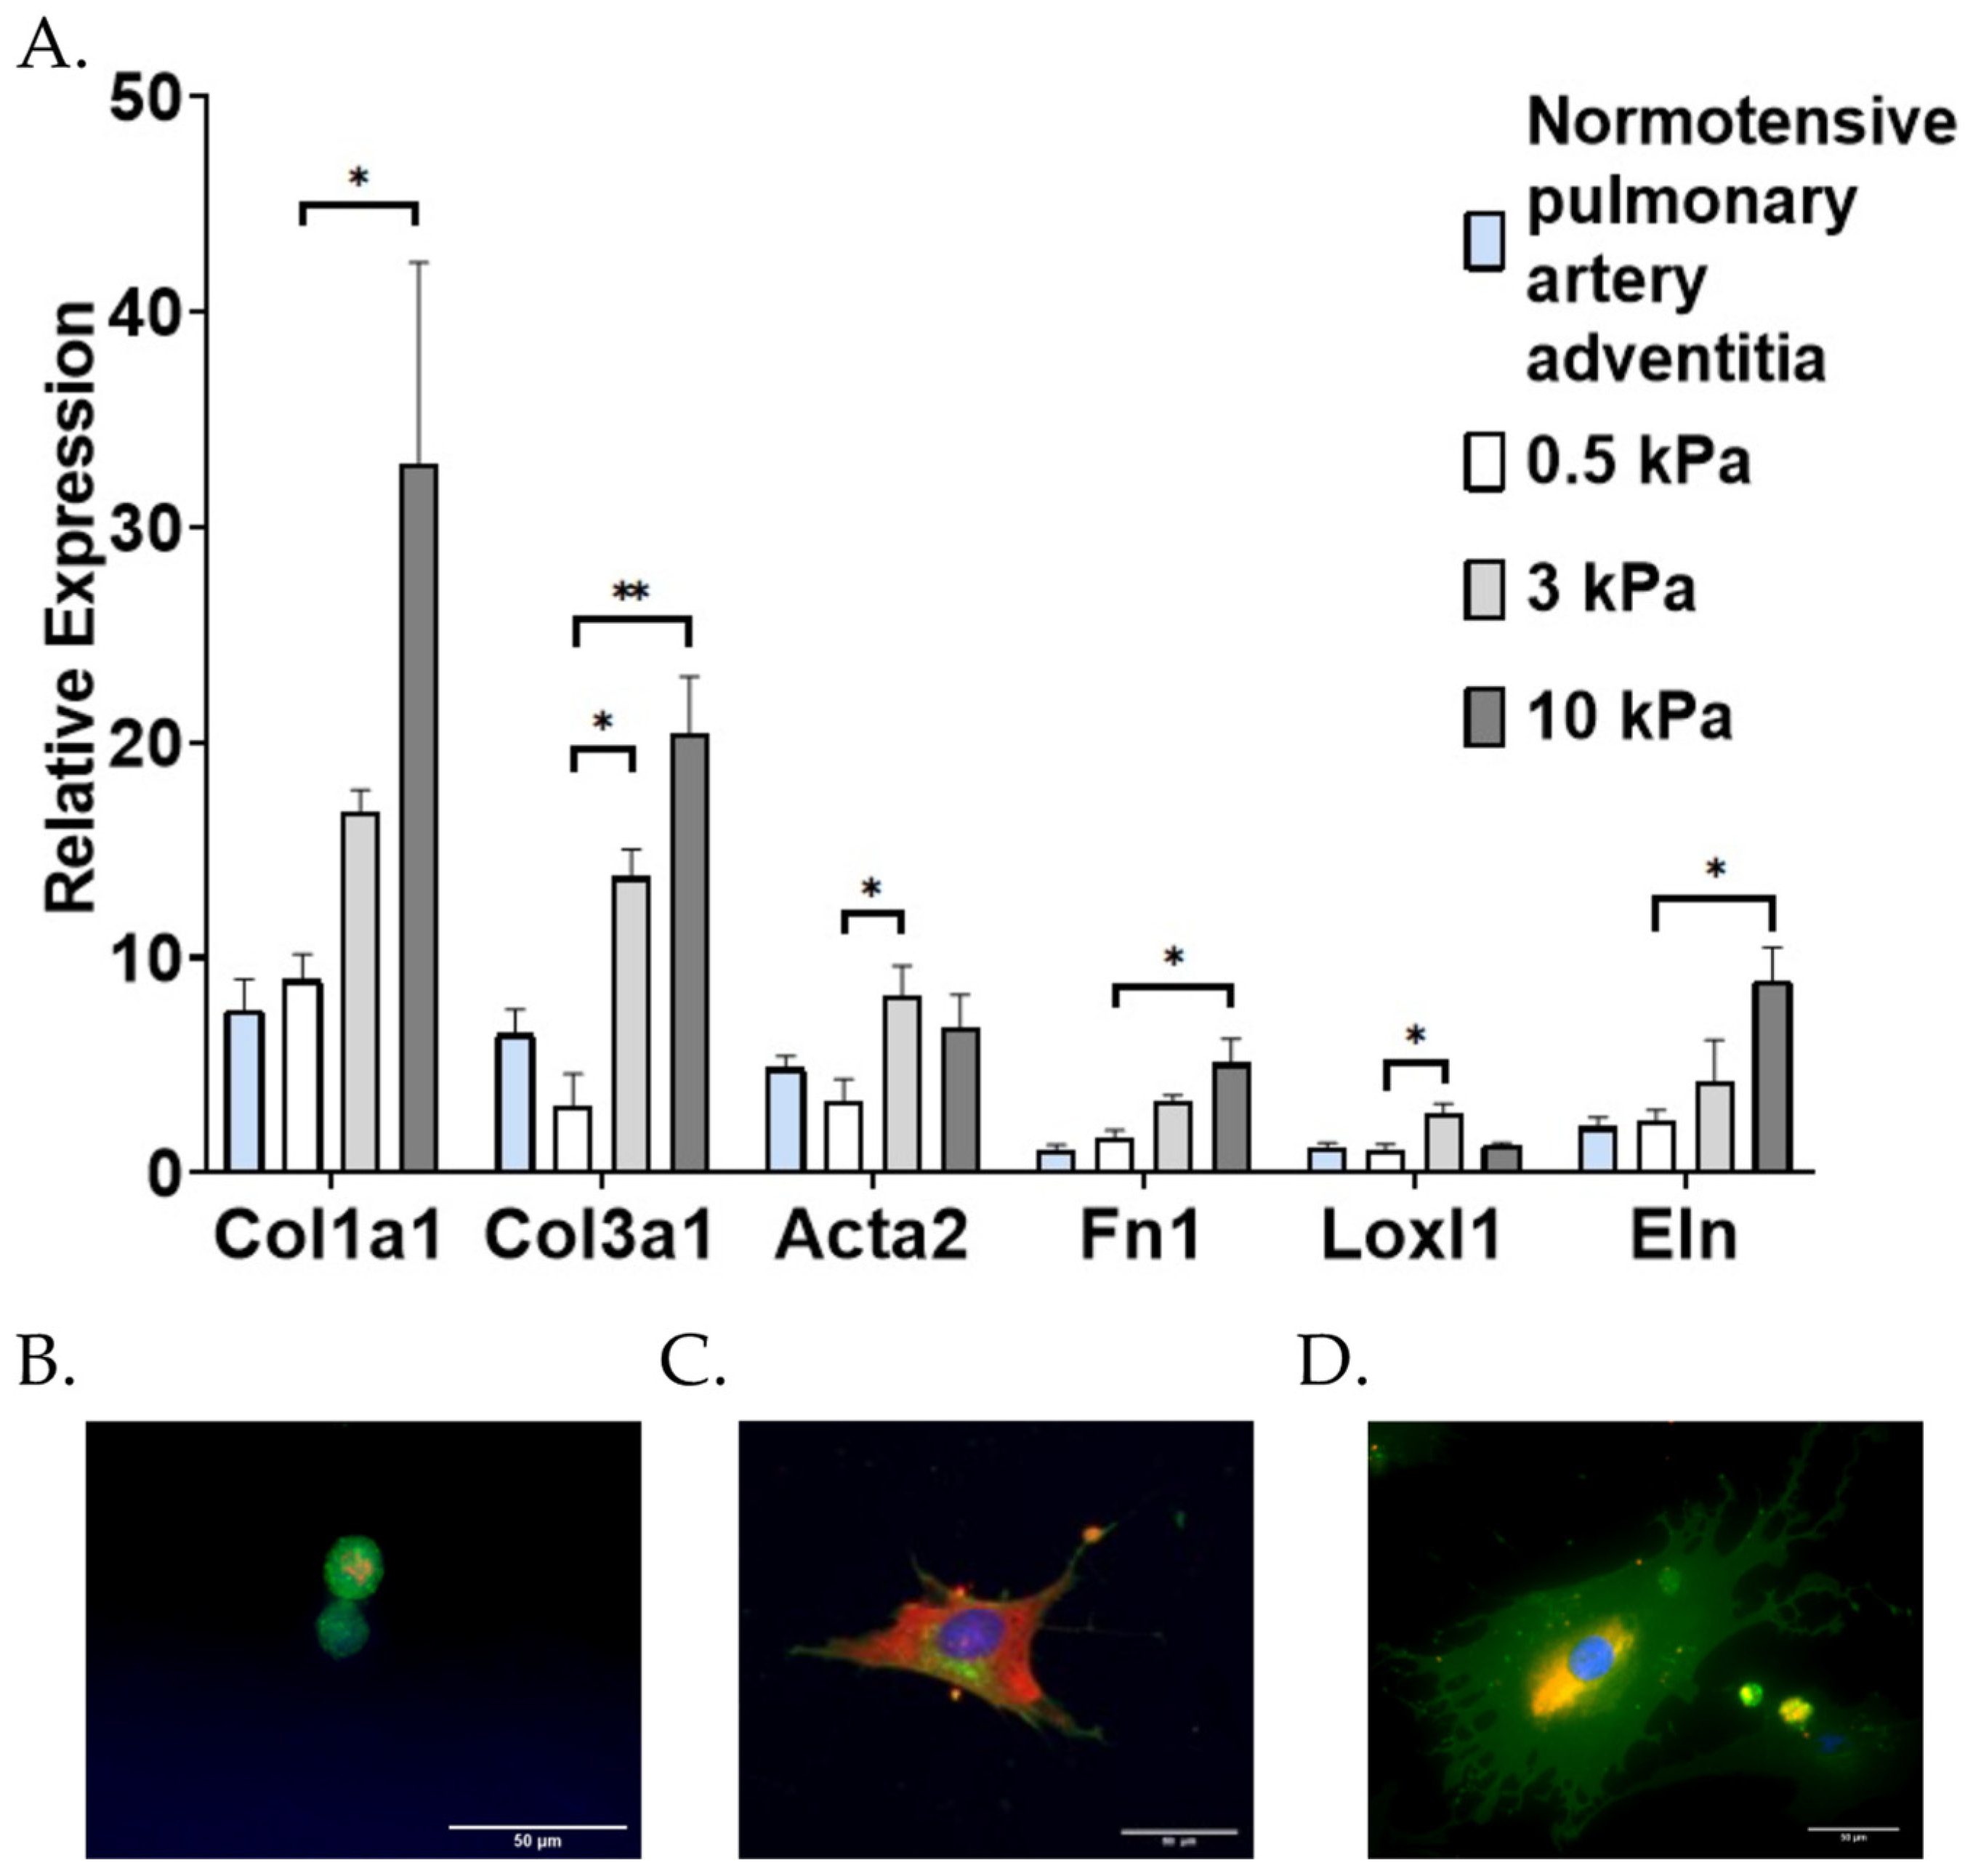
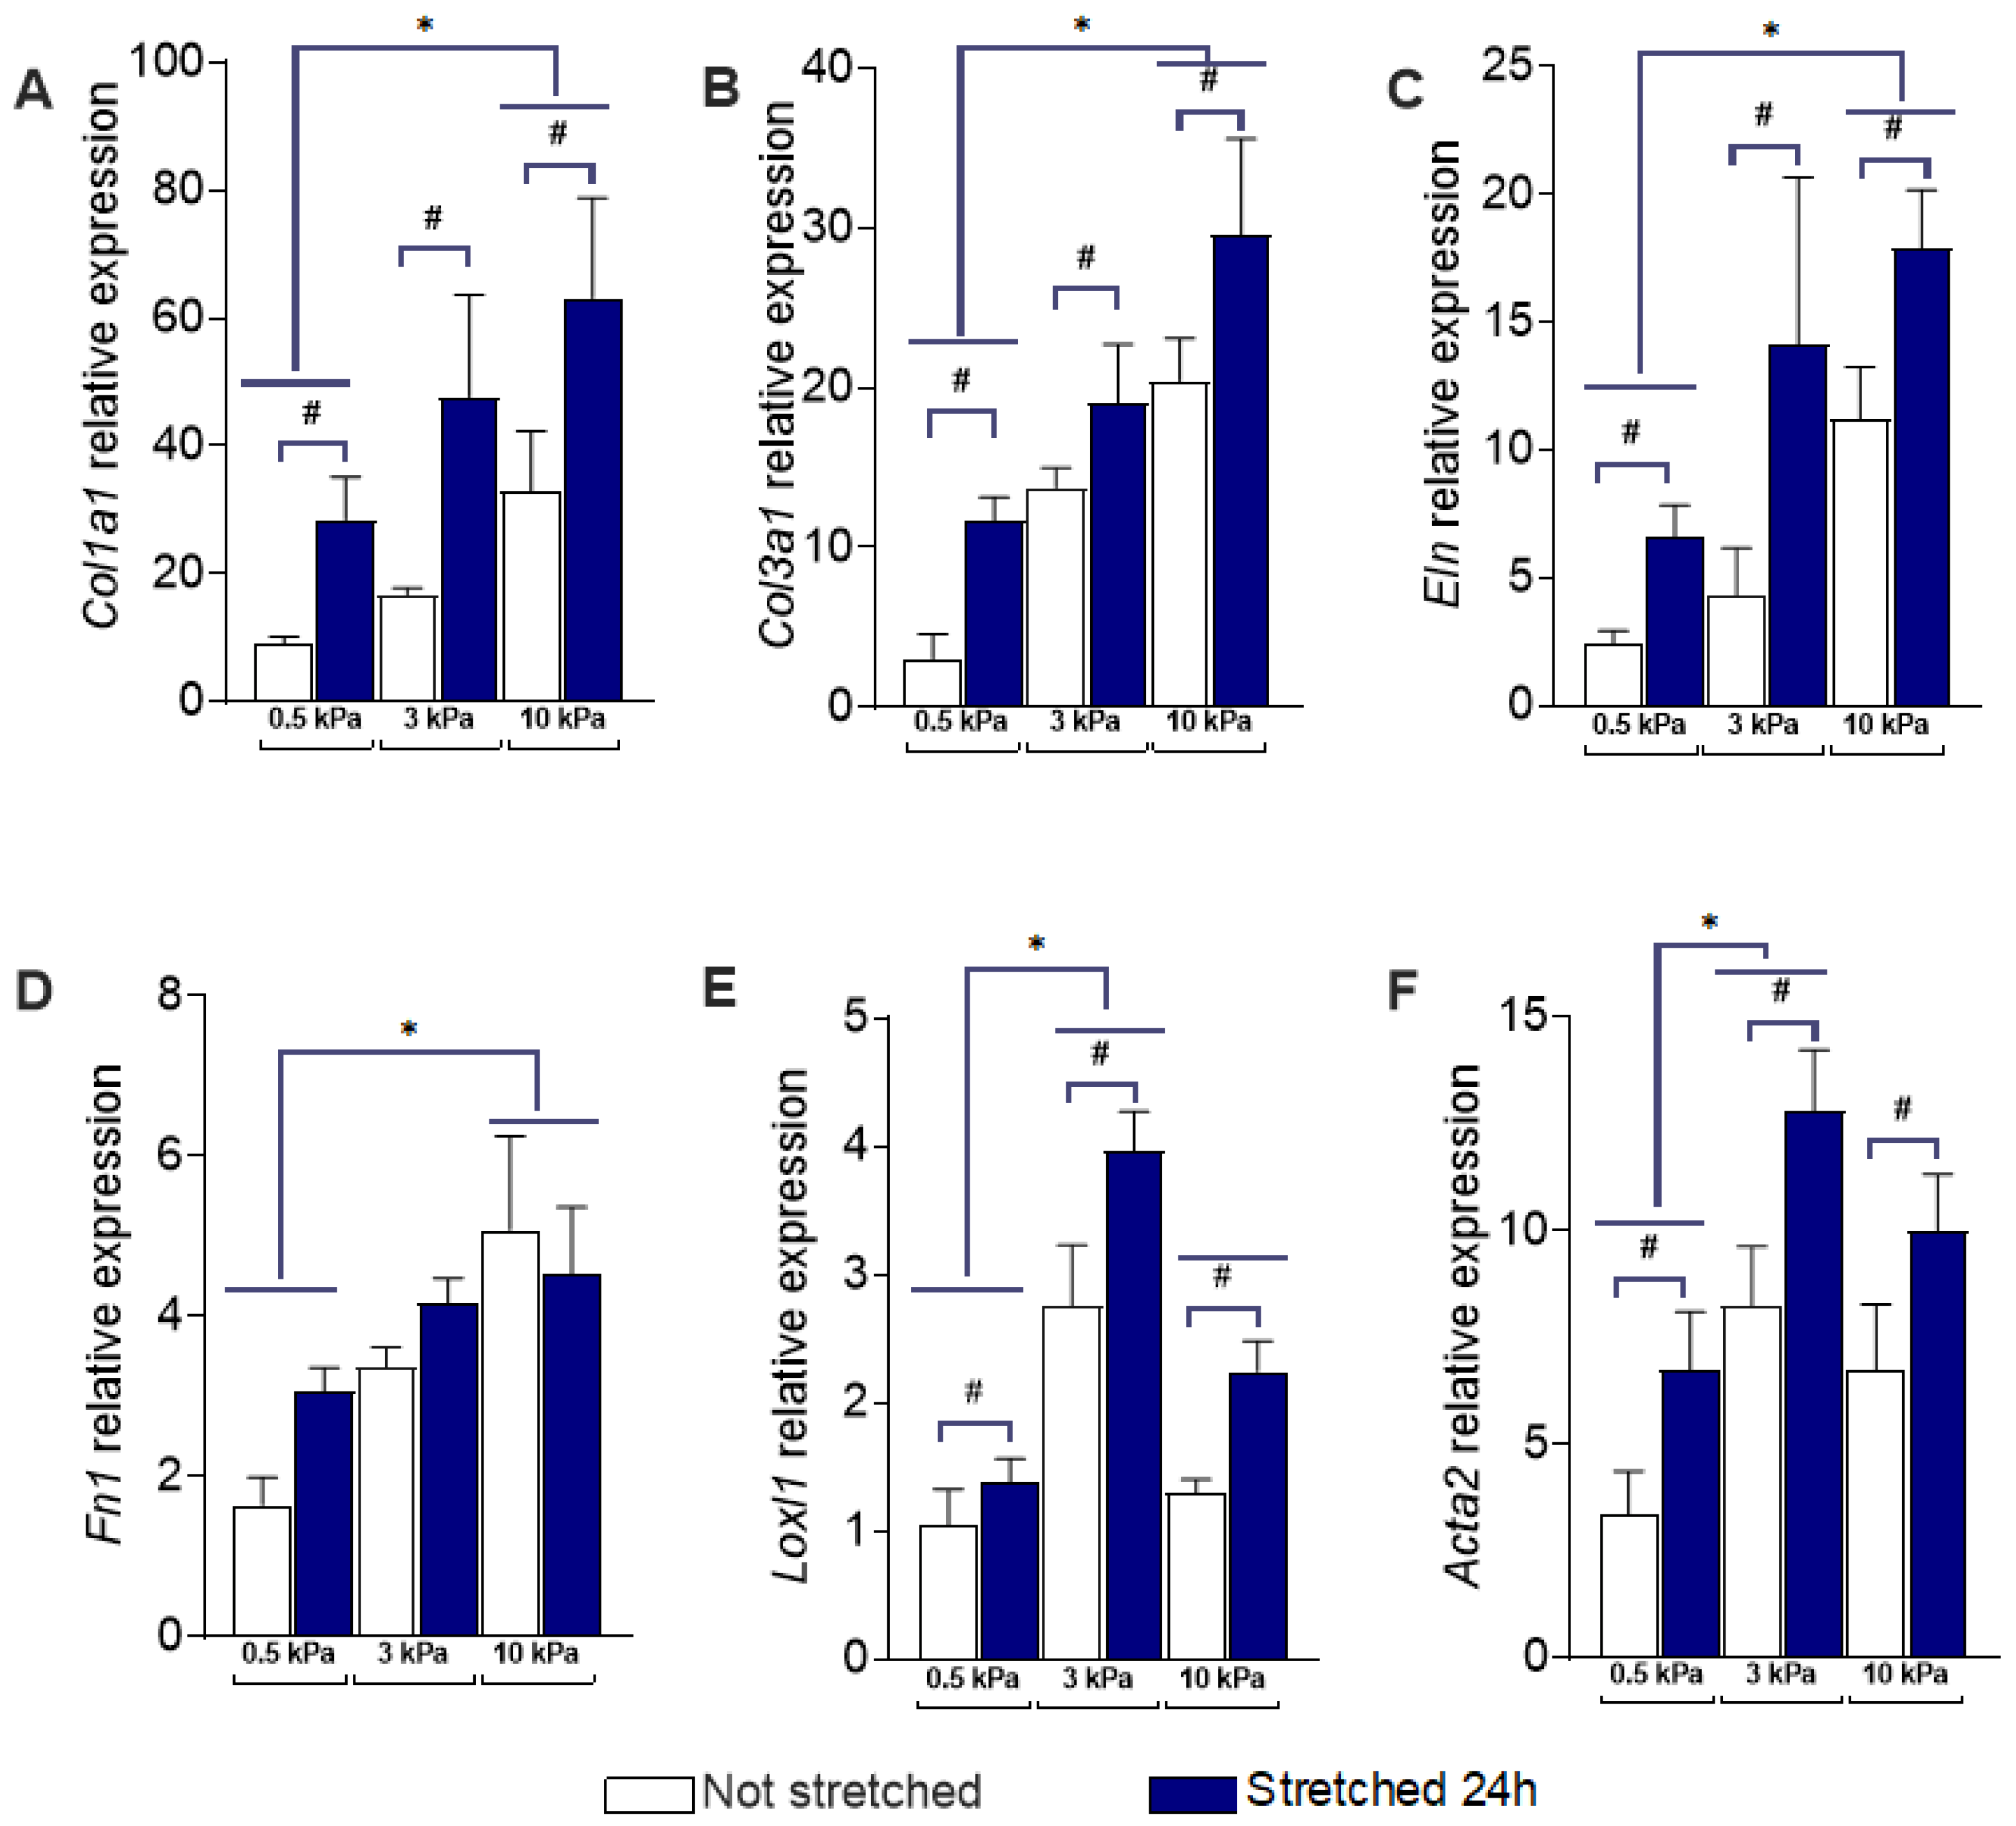
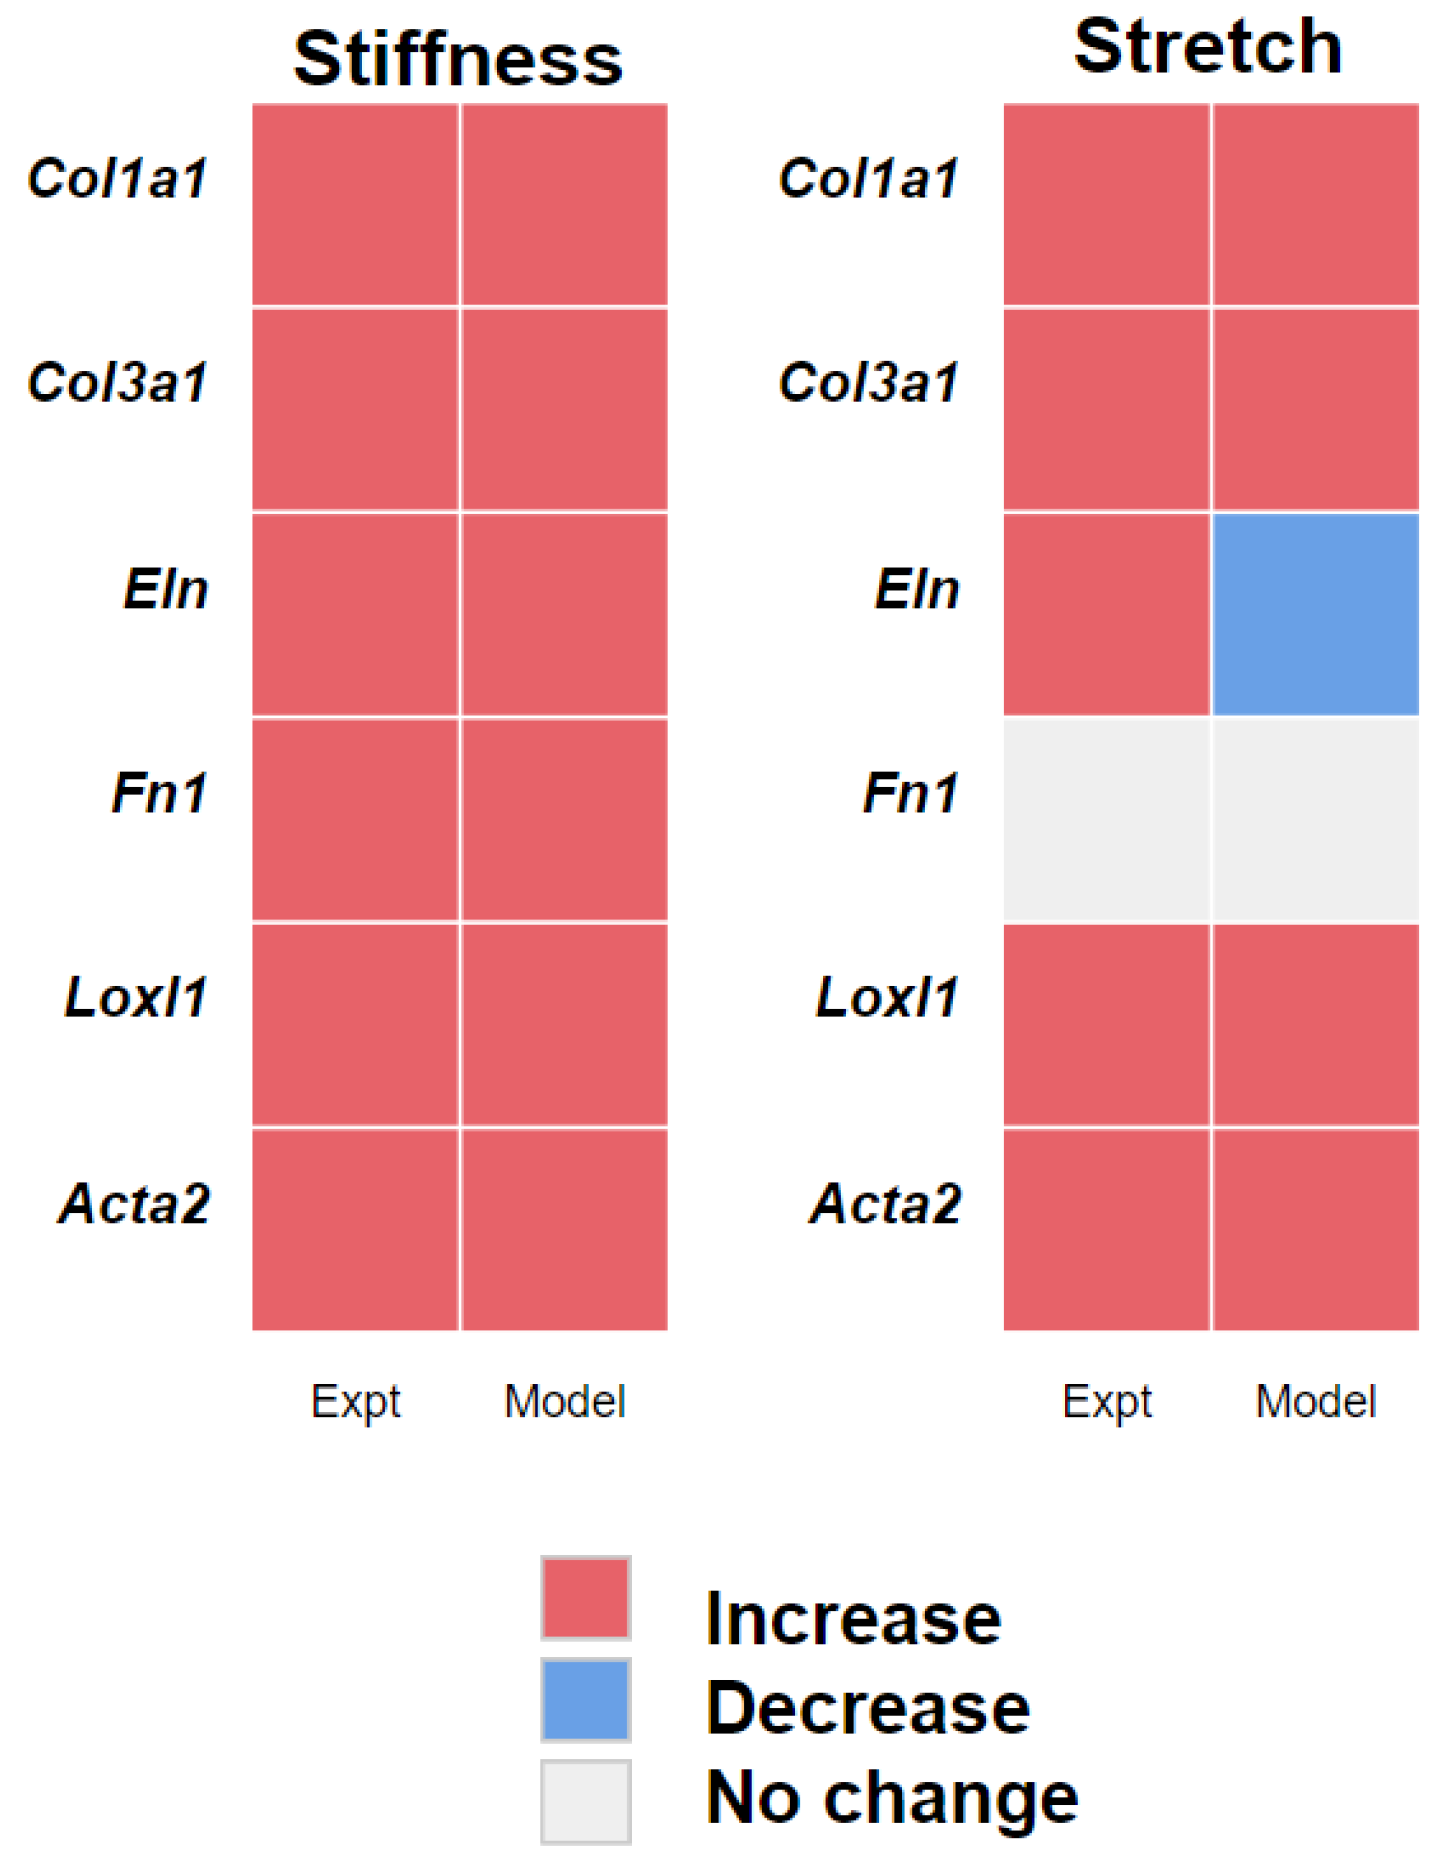
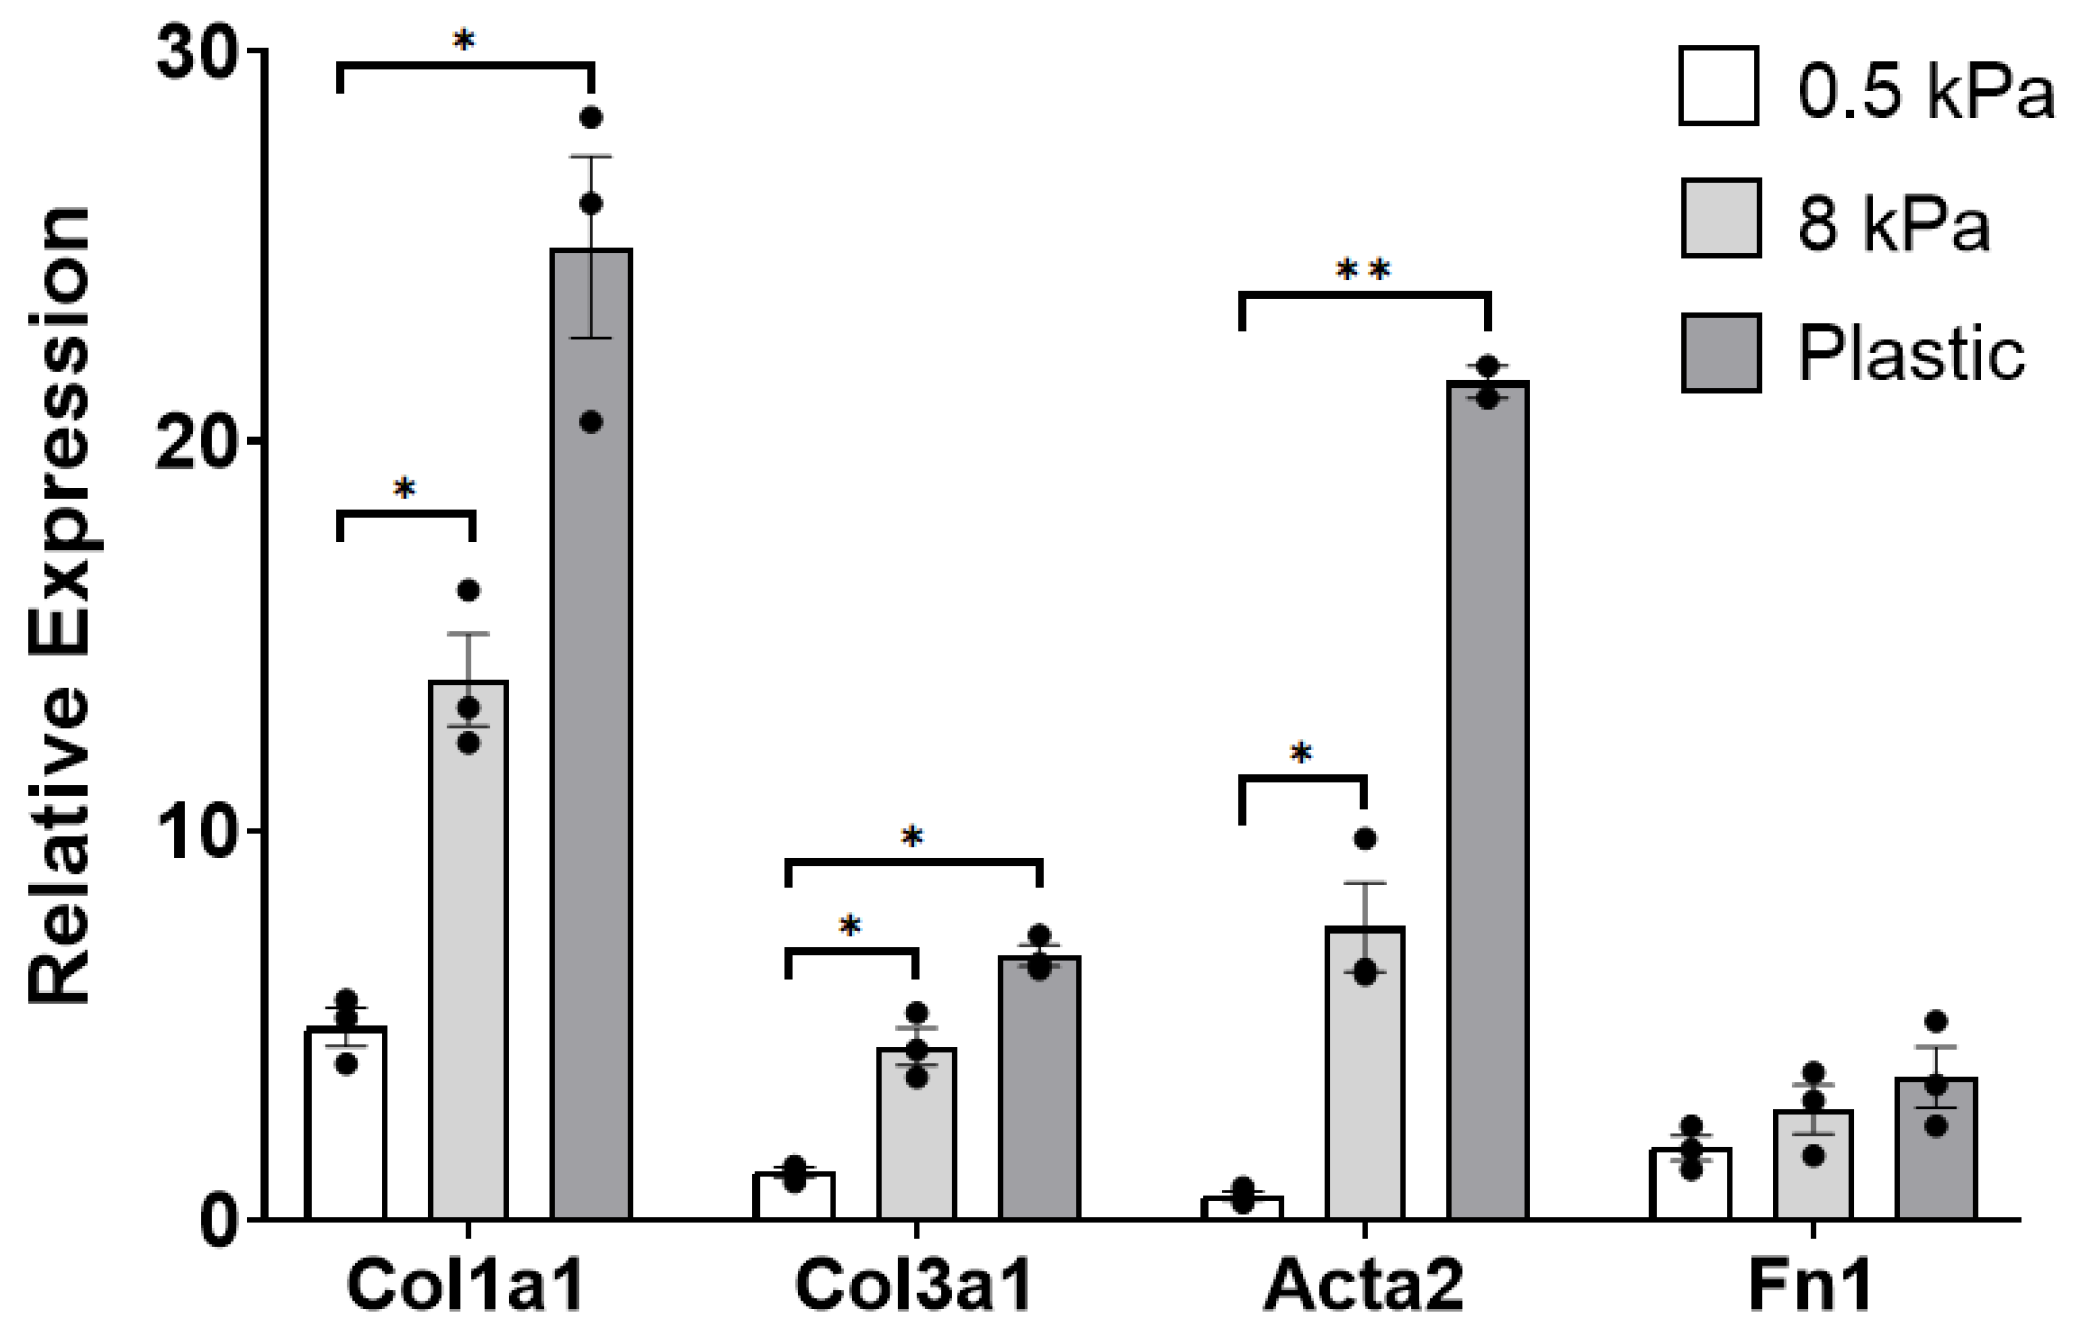
3.1. PAAFs Upregulate Profibrotic Genes in Response to Increased Substrate Stiffness and Stretch
3.2. PAAF Network Model Simulates Gene Expression Activated by Stiffness and Stretch
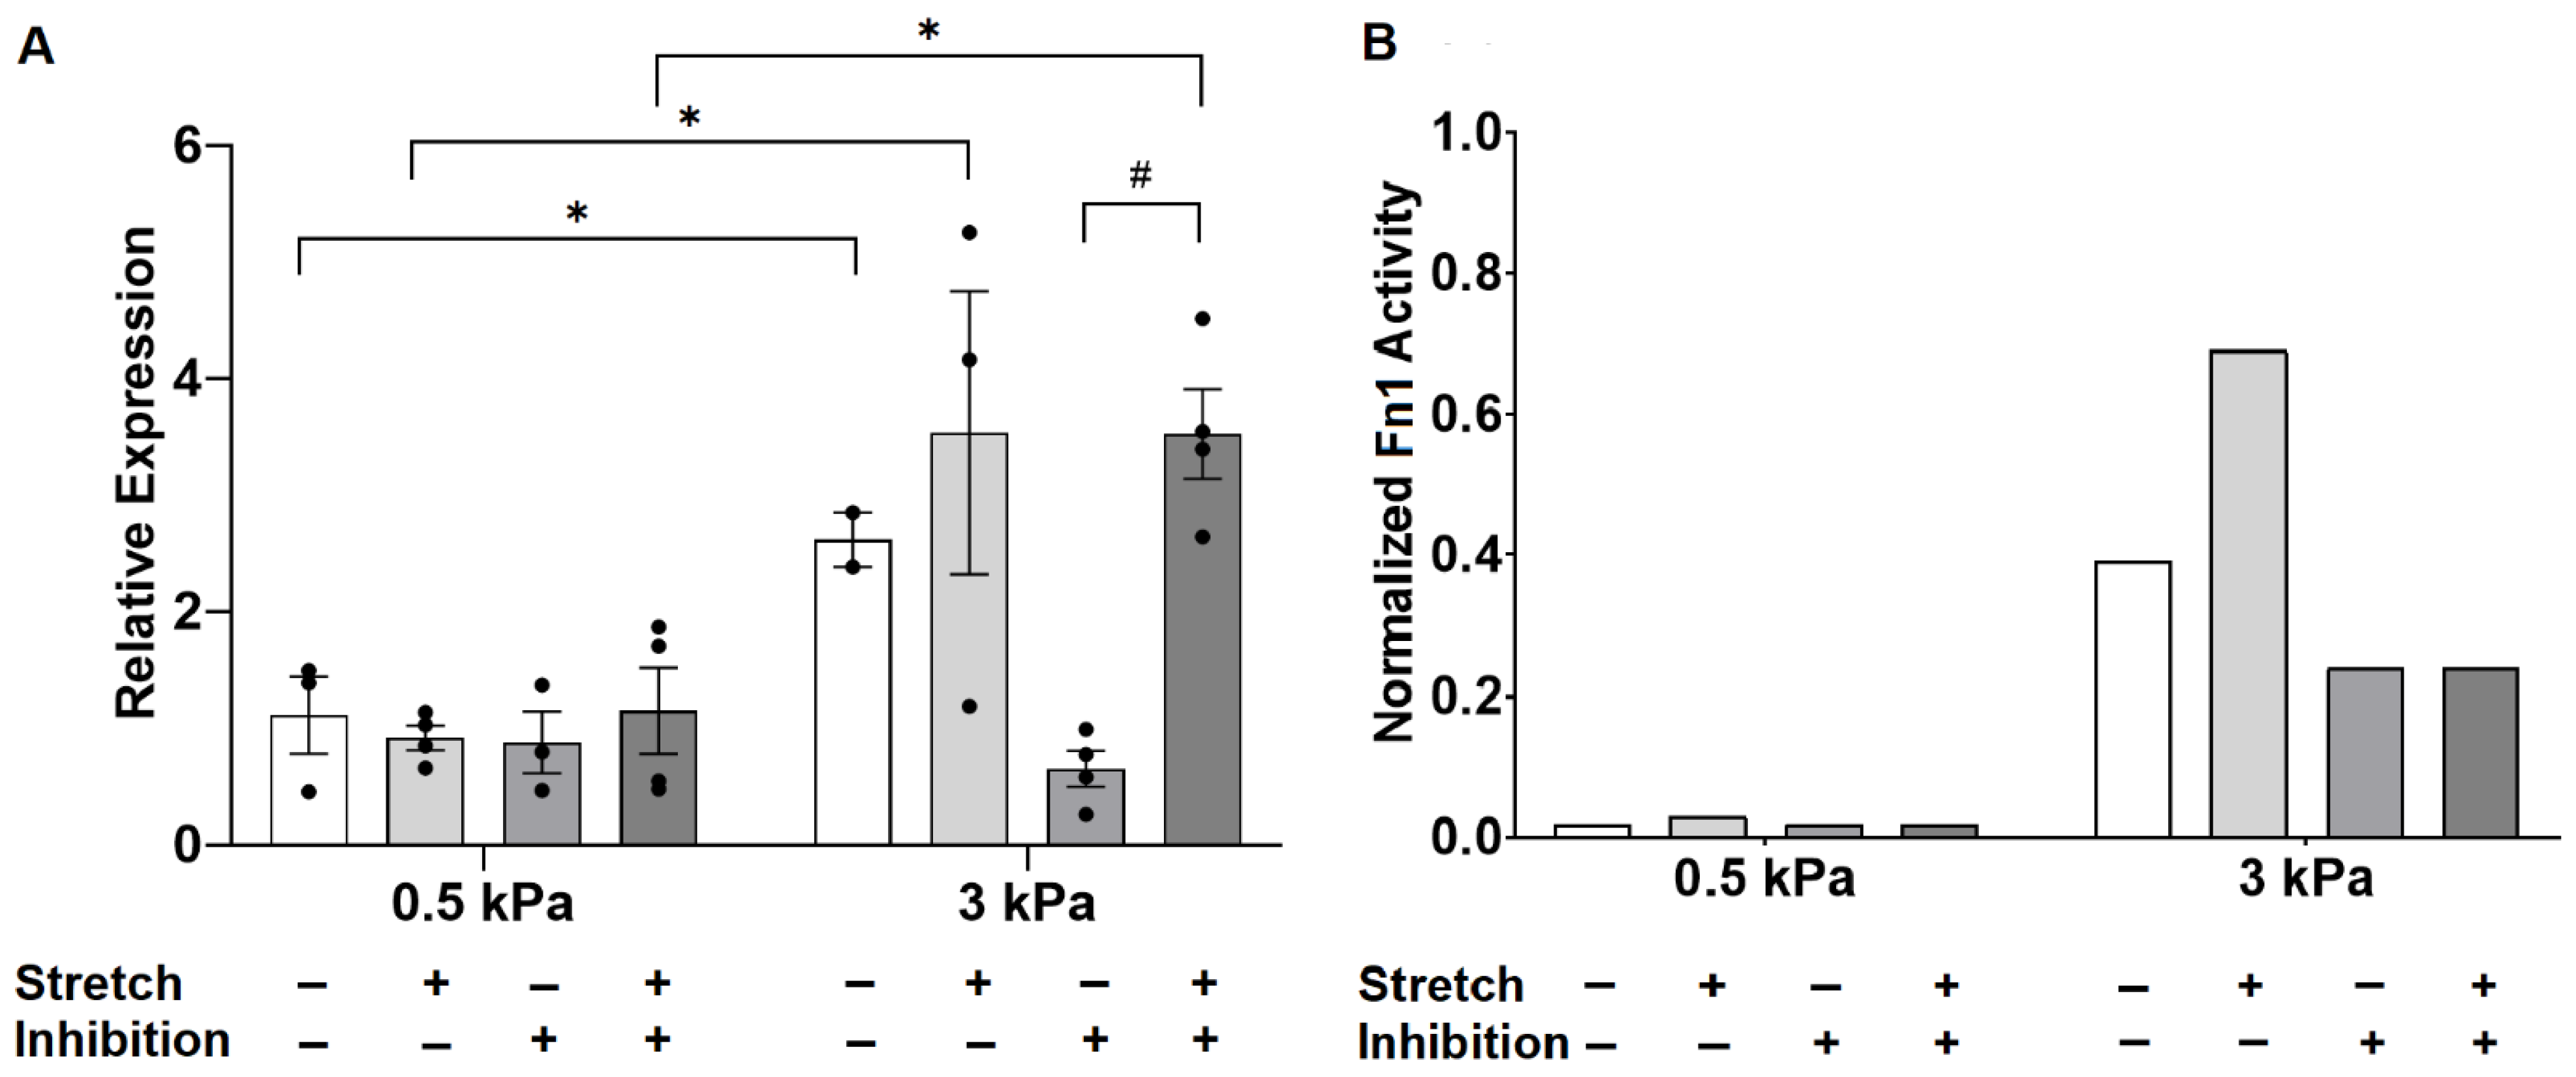
3.3. Angiotensin II Receptor Inhibition Unmasks an Interaction Between Stiffness and Stretch on Fibronectin Gene Expression
4. Discussion
4.1. Stiffness and Stretch Differentially Affect Expression of Six Profibrotic Genes
4.2. Model Modifications to Investigate Differential Regulation by Stretch and Stiffness
4.3. Crosstalk between TGF-β and Angiotensin II
4.4. Limitations
5. Conclusions
Supplementary Materials
Author Contributions
Funding
Institutional Review Board Statement
Informed Consent Statement
Data Availability Statement
Acknowledgments
Conflicts of Interest
Abbreviations
| PAH | Pulmonary Arterial Hypertension |
| PAAF | Pulmonary Arterial Adventitial Fibroblast |
| TGF-β | Transforming Growth Factor Beta |
| ECM | Extracellular Matrix |
| Ang II | Angiotensin II |
| AT1R | Angiotension II Receptor Type 1 |
| MST1/2 | Macrophage Stimulating 1 or 2 |
| TRP | Transient Receptor Potential Ion Channel |
| Col | Collagen mRNA |
| Acta2 | Alpha Smooth Muscle Actin mRNA |
| Loxl1 | Lysyl oxidase-like 1 mRNA |
| Eln | Elastin mRNA |
| Fn1 | Fibronectin mRNA |
| ANOVA | Analysis of variance |
| JNK1/2 | c-Jun N-terminal Kinases |
| PKCα | Protein Kinase C Alpha |
| ROS | Reactive Oxygen Species |
| ASK1 | Apoptosis Signal-regulating Kinase 1 |
| TAK1 | TGF-β–Activated Kinase 1 |
Appendix A

References
- Stenmark, K.R.; Davie, N.; Frid, M.; Gerasimovskaya, G.; Das, M. Role of the Adventitia in Pulmonary Vascular Remodeling. Physiology 2006, 21, 134–145. [Google Scholar] [CrossRef]
- Thenappan, T.; Chan, S.Y.; Weir, E.K. Role of extracellular matrix in the pathogenesis of pulmonary arterial hypertension. Am. J. Physiol. Heart Circ. Physiol. 2018, 315, 1322–1331. [Google Scholar] [CrossRef]
- Sun, W.; Chan, S.Y. Pulmonary arterial stiffness: An early and pervasive driver of pulmonary arterial hypertension. Front. Med. 2018, 5. [Google Scholar] [CrossRef]
- Dieffenbach, P.B.; Maracle, M.; Tschumperlin, D.J.; Fredenburgh, L.E. Mechanobiological feedback in pulmonary vascular disease. Front. Physiol. 2018, 9. [Google Scholar] [CrossRef] [PubMed]
- Dieffenbach, P.B.; Haeger, C.M.; Coronata, A.M.F.; Choi, K.M.; Varelas, X.; Tschumperlin, D.J.; Fredenburgh, L.E. Arterial stiffness induces remodeling phenotypes in pulmonary artery smooth muscle cells via YAP/TAZ-mediated repression of cyclooxygenase-2. Am. J. Physiol. Lung Cell Mol. Physiol. 2017, 313, 628–647. [Google Scholar] [CrossRef] [PubMed]
- Kolpakov, V.; Rekhter, M.D.; Gordon, D.; Wang, W.H.; Kulik, T.J. Effect of mechanical forces on growth and matrix protein synthesis in the in vitro pulmonary artery: Analysis of the role of individual cell types. Circ. Res. 1995, 77, 823–831. [Google Scholar] [CrossRef]
- Bishop, J.E.; Butt, R.; Dawes, K.; Laurent, G. Mechanical load enhances the stimulatory effect of PDGF on pulmonary artery fibroblast procollagen synthesis. Chest 1998, 114, S25. [Google Scholar] [CrossRef]
- Scott, N.A.; Cipolla, G.D.; Ross, C.E.; Dunn, B.; Martin, F.H.; Simonet, L.; Wilcox, J.N. Identification of a potential role for the adventitia in vascular lesion formation after balloon overstretch injury of porcine coronary arteries. Circulation 1996, 93, 2178–2187. [Google Scholar] [CrossRef]
- Mallawaarachchi, C.M.; Weissberg, P.L.; Siow, R.C.M. Antagonism of platelet-derived growth factor by perivascular gene transfer attenuates adventitial cell migration after vascular injury: New tricks for old dogs? FASEB J. 2006, 20, 1686–1688. [Google Scholar] [CrossRef] [PubMed]
- Herum, K.M.; Choppe, J.; Kumar, A.; Engler, A.J.; McCulloch, A.D. Mechanical regulation of cardiac fibroblast profibrotic phenotypes. Mol. Biol. Cell 2017, 28, 1871–1882. [Google Scholar] [CrossRef]
- Bertero, T.; Handen, A.L.; Chan, S.Y. Factors associated with heritable pulmonary arterial hypertension exert convergent actions on the miR-130/301-vascular matrix feedback loop. Int. J. Mol. Sci. 2018, 19, 2289. [Google Scholar] [CrossRef]
- Wang, A.; Cao, S.; Aboelkassem, Y.; Valdez-Jasso, D. Quantification of uncertainty in a new network model of pulmonary arterial adventitial fibroblast pro-fibrotic signalling. Phil. Trans. R. Soc. A 2020, 378, 20190338. [Google Scholar] [CrossRef]
- Liu, G.; Eskin, S.G.; Mikos, A.G. Integrin v3 is involved in stimulated migration of vascular adventitial fibroblasts by basic fibroblast growth factor but not platelet-derived growth factor. J. Cell Biochem. 2001, 83, 129–135. [Google Scholar] [CrossRef] [PubMed]
- Liu, F.; Haeger, C.M.; Dieffenbach, P.B.; Sicard, D.; Chrobak, I.; Coronata, A.M.; Suárez Velandia, M.M.; Vitali, S.; Colas, R.A.; Norris, P.C.; et al. Distal vessel stiffening is an early and pivotal mechanobiological regulator of vascular remodeling and pulmonary hypertension. JCI Insight 2016, 1, 86987. [Google Scholar] [CrossRef]
- Tse, J.R.; Engler, A.J. Preparation of hydrogel substrates with tunable mechanical properties. Curr. Protoc. Cell Biol. 2010, 10. [Google Scholar] [CrossRef]
- Camelliti, P.; Gallagher, J.O.; Kohl, P.; McCulloch, A.D. Micropatterned cell cultures on elastic membranes as an in vitro model of myocardium. Nat. Protoc. 2006, 1, 1379–1391. [Google Scholar] [CrossRef]
- Simmons, C.S.; Ribeiro, A.J.S.; Pruitt, B.L. Formation of composite polyacrylamide and silicone substrates for independent control of stiffness and strain. Lab Chip 2013, 13, 646–649. [Google Scholar] [CrossRef]
- Kim, D.K.; Huh, J.E.; Lee, S.H.; Hong, K.P.; Park, J.E.; Seo, J.D.; Lee, W.R. Angiotensin II stimulates proliferation of adventitial fibroblasts cultured from rat aortic explants. J. Korean Med. Sci. 1999, 14, 487–496. [Google Scholar] [CrossRef]
- Anwar, A.; Li, M.; Frid, M.G.; Kumar, B.; Gerasimovskaya, E.V.; Riddle, S.R.; McKeon, B.A.; Thukaram, R.; Meyrick, B.O.; Fini, M.A.; et al. Osteopontin is an endogenous modulator of the constitutively activated phenotype of pulmonary adventitial fibroblasts in hypoxic pulmonary hypertension. Am. J. Physiol. Lung Cell Mol. Physiol. 2012, 303, 1–11. [Google Scholar] [CrossRef]
- Rakugi, H.; Jacob, H.J.; Krieger, J.E.; Ingelfinger, J.R.; Pratt, R.E. Vascular injury induces angiotensinogen gene expression in the media and neointima. Circulation 1993, 87, 283–290. [Google Scholar] [CrossRef]
- Dupont, S.; Morsut, L.; Aragona, M.; Enzo, E.; Giulitti, S.; Cordenonsi, M.; Zanconato, F.; Le Digabel, J.; Forcato, M.; Bicciato, S.; et al. Role of YAP/TAZ in mechanotransduction. Nature 2011, 474, 179–183. [Google Scholar] [CrossRef]
- Bertero, T.; Cottrill, K.A.; Lu, Y.; Haeger, C.M.; Dieffenbach, P.; Annis, S.; Hale, A.; Bhat, B.; Kaimal, V.; Zhang, Y.Y.; et al. Matrix Remodeling Promotes Pulmonary Hypertension through Feedback Mechanoactivation of the YAP/TAZ-miR-130/301 Circuit. Cell Rep. 2015, 13, 1016–1032. [Google Scholar] [CrossRef]
- Zhou, H.Y.; Chen, W.D.; Zhu, D.L.; Wu, L.Y.; Zhang, J.; Han, W.Q.; Li, J.D.; Yan, C.; Gao, P.J. The PDE1A-PKCalpha signaling pathway is involved in the upregulation of alpha-smooth muscle actin by TGF-beta1 in adventitial fibroblasts. J. Vasc. Res. 2010, 47, 9–15. [Google Scholar] [CrossRef] [PubMed]
- Lin, S.; Ma, S.; Lu, P.; Cai, W.; Chen, Y.; Sheng, J. Effect of CTRP3 on activation of adventitial fibroblasts induced by TGF-β1 from rat aorta in vitro. Int. J. Clin. Exp. Pathol. 2014, 7, 2199–2208. [Google Scholar] [PubMed]
- Herum, K.M.; Lunde, I.G.; Skrbic, B.; Florholmen, G.; Behmen, D.; Sjaastad, I.; Carlson, C.R.; Gomez, M.F.; Christensen, G. Syndecan-4 signaling via NFAT regulates extracellular matrix production and cardiac myofibroblast differentiation in response to mechanical stress. J. Mol. Cell Cardiol. 2013, 54, 73–81. [Google Scholar] [CrossRef] [PubMed]
- Tobiume, K.; Matsuzawa, A.; Takahashi, T.; Nishitoh, H.; Morita, K.; Takeda, K.; Minowa, O.; Miyazono, K.; Noda, T.; Ichijo, H. ASK1 is required for sustained activations of JNK/p38 MAP kinases and apoptosis. EMBO Rep. 2001, 2, 222–228. [Google Scholar] [CrossRef]
- Yu, C.C.; Hsu, M.J.; Kuo, M.L.; Chen, R.F.; Chen, M.C.; Bai, K.J.; Yu, M.C.; Chen, B.C.; Lin, C.H. Thrombin-induced connective tissue growth factor expression in human lung fibroblasts requires the ASK1/JNK/AP-1 pathway. J. Immunol. 2009, 182, 7916–7927. [Google Scholar] [CrossRef]
- Gana-Weisz, M.; Haklai, R.; Marciano, D.; Egozi, Y.; Ben-Baruch, G.; Kloog, Y. The Ras antagonist S-farnesylthiosalicylic acid induces inhibition of MAPK activation. Biochem. Biophys. Res. Commun. 1997, 239, 900–904. [Google Scholar] [CrossRef]
- Lang, Y.D.; Hung, C.L.; Wu, T.Y.; Wang, L.F.; Chen, C.M. The renin-angiotensin system mediates hyperoxia-induced collagen production in human lung fibroblasts. Free Radic. Biol. Med. 2010, 49, 88–95. [Google Scholar] [CrossRef]
- Xie, Z.; Singh, M.; Singh, K. ERK1/2 and JNKs, but not p38 kinase, are involved in reactive oxygen species-mediated induction of osteopontin gene expression by angiotensin II and interleukin-1beta in adult rat cardiac fibroblasts. J. Cell Physiol. 2004, 198, 399–407. [Google Scholar] [CrossRef]
- Kucich, U.; Rosenbloom, J.C.; Abrams, W.R.; Rosenbloom, J. Transforming growth factor-β stabilizes elastin mRNA by a pathway requiring active Smads, protein kinase C-δ, and p38. Am. J. Respir. Cell Mol. Biol. 2002, 26, 183–188. [Google Scholar] [CrossRef]
- Zeigler, A.C.; Richardson, W.J.; Holmes, J.W.; Saucerman, J.J. A computational model of cardiac fibroblast signaling predicts context-dependent drivers of myofibroblast differentiation. J. Mol. Cell Cardiol. 2016, 94, 72–81. [Google Scholar] [CrossRef] [PubMed]
- Sano, M.; Fukuda, K.; Sato, T.; Kawaguchi, H.; Suematsu, M.; Matsuda, S.; Koyasu, S.; Matsui, H.; Yamauchi-Takihara, K.; Harada, M.; et al. ERK and p38 MAPK, but not NF-κB, are critically involved in reactive oxygen species–mediated induction of IL-6 by angiotensin II in cardiac fibroblasts. Circ. Res. 2001, 89, 661–669. [Google Scholar] [CrossRef] [PubMed]
- Lu, H.; Tian, A.; Wu, J.; Yang, C.; Xing, R.; Jia, P.; Yang, L.; Zhang, Y.; Zheng, X.; Li, Z. Danshensu inhibits β-adrenergic receptors-mediated cardiac fibrosis by ROS/p38 MAPK axis. Biol. Pharm. Bull. 2014, 37, 961–967. [Google Scholar] [CrossRef]
- Tojais, N.F.; Cao, A.; Lai, Y.J.; Wang, L.; Chen, P.I.; Alcazar, M.A.A.; de Jesus Perez, V.A.; Hopper, R.K.; Rhodes, C.J.; Bill, M.A.; et al. Codependence of Bone Morphogenetic Protein Receptor 2 and Transforming Growth Factor-β in Elastic Fiber Assembly and Its Perturbation in Pulmonary Arterial Hypertension. Arterioscler. Thromb. Vasc. Biol. 2017, 37, 1559–1569. [Google Scholar] [CrossRef] [PubMed]
- Cao, S.; Aboelkassem, Y.; Wang, A.; Valdez-Jasso, D.; Saucerman, J.J.; Omens, J.H.; McCulloch, A.D. Quantification of model and data uncertainty in a network analysis of cardiac myocyte mechanosignalling. Philos. Trans. A Math. Phys. Eng. Sci. 2020, 12, 2173. [Google Scholar] [CrossRef] [PubMed]
- Yue, Z.; Xie, J.; Yu, A.S.; Stock, J.; Du, J.; Yue, L. Role of TRP channels in the cardiovascular system. Am. J. Physiol. Heart Circ. Physiol. 2015, 308, 157–182. [Google Scholar] [CrossRef] [PubMed]
- Suzuma, I.; Suzuma, K.; Ueki, K.; Hata, Y.; Feener, E.P.; King, G.L.; Aiello, L.P. Stretch-induced retinal vascular endothelial growth factor expression is mediated by phosphatidylinositol 3-kinase and protein kinase C (PKC)-zeta but not by stretch-induced ERK1/2, Akt, Ras, or classical/novel PKC pathways. J. Biol. Chem. 2002, 277, 1047–1057. [Google Scholar] [CrossRef] [PubMed]
- Tan, P.M.; Buchholz, K.S.; Omens, J.H.; McCulloch, A.D.; Saucerman, J.J. Predictive model identifies key network regulators of cardiomyocyte mechano-signaling. PLoS Comput. Biol. 2017, 13, 1005854. [Google Scholar] [CrossRef]
- Blatti, S.P.; Foster, D.N.; Ranganathan, G.; Moses, H.L.; Getz, M.J. Induction of fibronectin gene transcription and mRNA is a primary response to growth-factor stimulation of AKR-2B cells. Proc. Natl. Acad. Sci. USA 1988, 85, 1119–1123. [Google Scholar] [CrossRef]
- Liu, S.; Parameswaran, H.; Young, S.M.; Varisco, B.M. JNK suppresses pulmonary fibroblast elastogenesis during alveolar development. Resp. Res. 2014, 15, 34. [Google Scholar] [CrossRef] [PubMed]
- Layland, J.; Young, I.S.; Altringham, J.D. The effect of cycle frequency on the power output of rat papillary muscles in vitro. J. Exp. Biol. 1995, 198, 1035–1043. [Google Scholar] [CrossRef]
- Wu, J.; Thabet, S.R.; Kirabo, A.; Trott, D.W.; Saleh, M.A.; Xiao, L.; Madhur, M.S.; Chen, W.; Harrison, D.G. Inflammation and mechanical stretch promote aortic stiffening in hypertension through activation of p38 mitogen-activated protein kinase. Circ. Res. 2014, 114, 616–625. [Google Scholar] [CrossRef] [PubMed]
- Froese, A.R.; Shimbori, C.; Bellaye, P.S.; Inman, M.; Obex, S.; Fatima, S.; Jenkins, G.; Gauldie, J.; Ask, K.; Kolb, M. Stretch-induced Activation of Transforming Growth Factor-β1 in Pulmonary Fibrosis. Am. J. Respir. Crit. Care Med. 2016, 194, 84–96. [Google Scholar] [CrossRef]
- Lee, A.A.; Dillmann, W.H.; McCulloch, A.D.; Villarreal, F.J. Angiotensin II stimulates the autocrine production of transforming growth factor-beta 1 in adult rat cardiac fibroblasts. J. Mol. Cell Cardiol. 1995, 27, 2347–2357. [Google Scholar] [CrossRef]
- Fisher, S.A.; Absher, M. Norepinephrine and ANG II stimulate secretion of TGF-beta by neonatal rat cardiac fibroblasts in vitro. Am. J. Physiol. 1995, 268, 910–917. [Google Scholar] [CrossRef]
- Galie, P.A.; Russell, M.W.; Westfall, M.V.; Stegemann, J.P. Interstitial fluid flow and cyclic strain differentially regulate cardiac fibroblast activation via AT1R and TGF-β1. Exp. Cell Res. 2012, 318, 75–84. [Google Scholar] [CrossRef]
- Hamzeh, M.T.; Sridhara, R.; Alexander, L.D. Cyclic stretch-induced TGF-β1 and fibronectin expression is mediated by β1-integrin through c-Src- and STAT3-dependent pathways in renal epithelial cells. Am. J. Physiol. Renal Physiol. 2015, 308, 425–436. [Google Scholar] [CrossRef]


| Genes | Effects of Stiffness | Effect of Stretch | Interaction Term |
|---|---|---|---|
| Col1a1 | 0.046 | 0.006 | 0.86 |
| Col3a1 | <0.0001 | 0.012 | 0.69 |
| Eln | 0.009 | 0.009 | 0.66 |
| Fn1 | 0.001 | 0.27 | 0.28 |
| Loxl1 | <0.0001 | 0.0007 | 0.30 |
| Acta2 | 0.0007 | 0.002 | 0.88 |
| Effect of Stiffness on 3 kPa | Effect of Stretch on 0.5 kPa | |||||
|---|---|---|---|---|---|---|
| Genes | AT1 | TGF-β | MST1/2 | AT1 | TGF-β | MST1/2 |
| Col1a1 | −0.16 | −0.24 | −0.10 | −0.14 | −0.06 | −0.26 |
| Col3a1 | −0.16 | −0.24 | −0.10 | −0.14 | −0.06 | −0.26 |
| Eln | −0.04 | −0.46 | 0 | 0.20 | −0.08 | 0 |
| Fn1 | −0.15 | −0.39 | 0 | −0.01 | −0.03 | 0 |
| Loxl1 | 0 | 0 | −0.37 | 0 | 0 | −0.37 |
| Acta2 | −0.14 | −0.70 | 0 | −0.04 | −0.14 | 0 |
Publisher’s Note: MDPI stays neutral with regard to jurisdictional claims in published maps and institutional affiliations. |
© 2021 by the authors. Licensee MDPI, Basel, Switzerland. This article is an open access article distributed under the terms and conditions of the Creative Commons Attribution (CC BY) license (https://creativecommons.org/licenses/by/4.0/).
Share and Cite
Wang, A.; Cao, S.; Stowe, J.C.; Valdez-Jasso, D. Substrate Stiffness and Stretch Regulate Profibrotic Mechanosignaling in Pulmonary Arterial Adventitial Fibroblasts. Cells 2021, 10, 1000. https://doi.org/10.3390/cells10051000
Wang A, Cao S, Stowe JC, Valdez-Jasso D. Substrate Stiffness and Stretch Regulate Profibrotic Mechanosignaling in Pulmonary Arterial Adventitial Fibroblasts. Cells. 2021; 10(5):1000. https://doi.org/10.3390/cells10051000
Chicago/Turabian StyleWang, Ariel, Shulin Cao, Jennifer C. Stowe, and Daniela Valdez-Jasso. 2021. "Substrate Stiffness and Stretch Regulate Profibrotic Mechanosignaling in Pulmonary Arterial Adventitial Fibroblasts" Cells 10, no. 5: 1000. https://doi.org/10.3390/cells10051000
APA StyleWang, A., Cao, S., Stowe, J. C., & Valdez-Jasso, D. (2021). Substrate Stiffness and Stretch Regulate Profibrotic Mechanosignaling in Pulmonary Arterial Adventitial Fibroblasts. Cells, 10(5), 1000. https://doi.org/10.3390/cells10051000