Article

Peripheral Blood from Rheumatoid Arthritis Patients Shows Decreased Treg CD25 Expression and Reduced Frequency of Effector Treg Subpopulation

1
Department of Medical Science, College of Medicine, Chungnam National University, Daejeon 35015, Korea
2
Department of Infection Biology, College of Medicine, Chungnam National University, Daejeon 35015, Korea
3
Department of Internal Medicine, College of Medicine, Chungnam National University, Daejeon 35015, Korea
4
Brain Korea 21 FOUR Project for Medical Science, Chungnam National University, Daejeon 35015, Korea
5
Laboratory of Immunology and Infectious Diseases, Graduate School of Medical Science and Engineering, Korea Advanced Institute of Science and Technology (KAIST), Daejeon 34141, Korea
6
Laboratory of Neurogenetics, National Institute on Aging, NIH, Bethesda, MD 20892, USA
7
Department of Biological Sciences, Korea Advanced Institute of Science and Technology, Daejeon 34141, Korea
8
The Center for Epidemic Preparedness, KAIST Institute, Daejeon 34141, Korea
9
Department of Medical Education, College of Medicine, Chungnam National University, Daejeon 35015, Korea
10
Translational Immunology Institute, Chungnam National University, Daejeon 35015, Korea
*
Authors to whom correspondence should be addressed.
Those authors contributed equally to this work.
Cells 2021, 10(4), 801; https://doi.org/10.3390/cells10040801
Submission received: 18 February 2021 / Revised: 26 March 2021 / Accepted: 1 April 2021 / Published: 3 April 2021

Abstract

:
Rheumatoid arthritis (RA) is a common autoimmune disease characterized by immune cell infiltration of the synovium, leading to the loss of cartilage, bone, and joint function. Although regulatory T (Treg) cells are thought to modulate the initiation and progression of RA, a consensus has yet to be reached regarding the function and composition of Treg cells in RA patients. To address these discrepancies, we analyzed not only the total Treg frequency but also that of Treg subpopulations in the peripheral blood of RA patients and healthy controls by flow cytometry. We found that the total Treg population was not significantly different between RA and control subjects. However, the effector Treg cell subgroup, defined as CD45RACD25hi, showed markedly decreased frequency in RA patients. In addition, the total Treg population from RA patients showed a significant decline in the expression of CD25. Both the naïve and effector Treg subgroups also showed marked reduction of CD25 expression in RA patients compared to controls. These data suggest that the decreased frequency of effector Treg cells and overall reduction of CD25 expression in Treg cells in the peripheral blood may be evidence of altered Treg homeostasis associated with RA pathogenesis.

1. Introduction

Rheumatoid arthritis (RA) is a common autoimmune disease characterized by the accumulation of inflammatory cells in the joints, leading to chronic synovitis, cartilage and bone damage, and eventual loss of joint function [1,2,3]. Under normal conditions, forkhead box P3 (Foxp3)-positive regulatory T (Treg) cells are responsible for maintaining immune tolerance and suppressing potentially harmful autoimmune responses [4]. Depletion of Treg cells has been shown to result in severe autoimmunity in animal models [5]. Several studies have suggested that this homeostasis is similarly disrupted in RA, allowing mononuclear cells and CD4+ T cells to infiltrate the synovium unchecked [6,7]. The subsequent release of pro-inflammatory cytokines such as TNF-α can further suppress Treg cell function and exacerbate symptoms [8,9]. However, the frequency and potential dysfunction of Treg cell in RA patients is highly controversial [6,10].
Treg cells are differentiated from CD4+ T cells and classically identified by the expression of Foxp3 or IL-2 receptor α chain (CD25). Foxp3 confers suppressive activity to Treg cells, including maintaining expression of CTLA4 [11,12,13], while CD25 allows Treg cells to quickly respond to IL-2 produced by self-reactive T cells [14,15]. Several studies have also suggested using the absence of IL-7 receptor α chain CD127 to distinguish Treg cells, as it has been shown to be inversely correlated with Foxp3 function [16,17]. CD25 has been traditionally used to identify Treg cells [14,15]. The high-affinity IL-2 receptor consists of three distinct subunits designated IL-2Rα (CD25), IL-2Rβ (CD122), and common γ chain (γc; CD132). The trimeric IL-2Rαβγc is typically expressed at high levels by Treg cells, whereas the dimeric IL-2Rβγc is expressed mostly on activated CD8+ T cells and NK cells. Foxp3 is another critical marker, as it is considered a master switch gene of the Treg cell lineage and orchestrates its various cellular programs [11,12]. In addition, absent or low cell surface expression of CD127, the α chain of the interleukin-7 receptor, in combination with CD25 expression, has been shown to distinctively distinguish Treg cells from effector T cells expressing high levels of CD127 in humans [16,17]. CD127 expression has been further shown to correlate inversely with Foxp3 expression. These markers are not exclusive to Treg cells, however, as activated CD4+ T cells without suppressive activity have been also shown to be Foxp3+CD25+ and CD25+CD127 [18,19]. As such, detecting Treg cells and identifying their role in RA may be significantly more intricate than previously thought.
CD25 is a part of the high-affinity IL-2 receptor complex constitutively expressed in Treg cells and shown to play a critical role in the generation and function of Treg cells [20,21]. Peripheral survival and expansion of Treg cells may additionally require appropriate IL-2/IL-2R signaling [22,23,24]. Several genes within the IL-2/IL-2R pathway (e.g., IL2, IL2RA, IL2RB, and PTPN2) may influence an individual’s susceptibility to human autoimmune diseases, with evidence to suggest that these genes exert their effects by altering Treg cell frequency or function [25,26]. Of note, a candidate gene study identified an association between RA and IL2RA, which encodes CD25 [26,27,28]. Low CD25 expression was identified as a phenotypic characteristic of Treg cells in the peripheral blood of patients with autoimmune diseases such as type I diabetes [29] and systemic lupus erythematosus [30]. Gene polymorphisms of the proteins in the IL-2/IL-2R pathway may similarly exert their influence on RA risk via changes to the frequency or phenotype of Treg cells. Recently, low-dose IL-2 therapy was applied as a new clinical approach for autoimmune diseases that takes advantage of the selective activity of low-dose IL-2 on Treg cells [31,32]. Several studies have demonstrated that low-dose IL-2 therapy can successfully overcome Treg cell deficiency and increase the ratio of Treg to effector T cells in patients with RA and other autoimmune diseases [33,34,35].
Functional deficiency in the Treg compartment has long been considered a cause of autoimmune diseases such as RA [36,37,38]. However, previous literature has been unable to reach a consensus as to the specific role of Treg cells in peripheral immune tolerance in RA, or even the frequency of Treg cells in peripheral blood of RA patients [7,39]. Interestingly, various therapies currently approved for RA, such as methotrexate, adalimumab, and tocilizumab, have been shown to restore the frequency and function of Treg cells [40,41,42,43]. Given the inconsistent reports regarding the frequency and potential dysfunction of Treg cells in RA patients and accumulating evidence that human Treg cells are heterogeneous in phenotype and function, we sought to offer a more precise assessment of Treg cells in RA patients by examining their subpopulations. Previous studies have delineated Treg cells into naïve (Fr. I), effector (Fr. II), and non-suppressive Treg subsets (Fr. III) based on CD25, Foxp3, and CD45RA expression in CD4+ T cells [44]. In this study, we examined these Treg subgroups in the peripheral blood of RA patients and healthy control subjects. We report that the total frequency of Treg cells did not change significantly in RA patients and healthy controls. However, the frequency of effector Treg cells (Fr. II) was markedly reduced in RA patients. Furthermore, CD25 expression in Treg cells was significantly decreased in RA patients. Our observation may be instrumental in understanding the function and adaptive processes of Treg cells in RA disease progression.

2. Materials and Methods

2.1. Human Subjects

Blood samples were collected from RA patients and healthy adult volunteers under IRB approval (IRB file No. CNUH 2015-10-052, approval date 2015-10-28) from Chungnam National University Hospital (Republic of Korea). RA patients (n = 13) were diagnosed according to the 2010 American College of Rheumatology criteria. Patients were divided by RA disease activity according to the clinical parameter Disease Activity Score 28 (DAS28) [3,45]. Healthy adult volunteers (n = 13) were enrolled in this study and had no acute or chronic inflammatory or infectious disease, ongoing thrombosis, or neoplasia. Subject characteristics are provided in Table S1. All studies were performed in accordance with the Declaration of Helsinki.

2.2. PBMC Isolation

PBMC (peripheral blood mononuclear cells) were obtained from whole blood using lymphocyte separation medium (Corning) by density gradient centrifugation.

2.3. Flow Cytometric Analysis

To distinguish live and dead cells, PBMC were stained with live/dead fixable stain dye (Life technologies). After PBS washing, cells were incubated with FITC-CD3 (BD Biosciences), PerCP-Cy5.5-CD4 (BD Biosciences), BV421-CD25 (BD Biosciences), APC-CD127 (Biolegend), and PE-Cy7-CD45RA (BD Biosciences). Cells were then fixed and permeabilized with Foxp3/Transcription Factor Staining Buffer Set (eBioscience) and further stained with PE-Foxp3 (BD Biosciences). Cells were analyzed with a FACSCanto II flow cytometer (BD Biosciences), and data were processed with FlowJo software (Tree Star, OR, USA).

2.4. Statistical Analysis

Data were analyzed by Mann–Whitney test using GraphPad Prism (v7.02, GraphPad). Dot plot data in the figures were presented as median with interquartile range, and data in the tables are presented as median values with minimum to maximum range. p < 0.05 was considered statistically significant.

3. Results

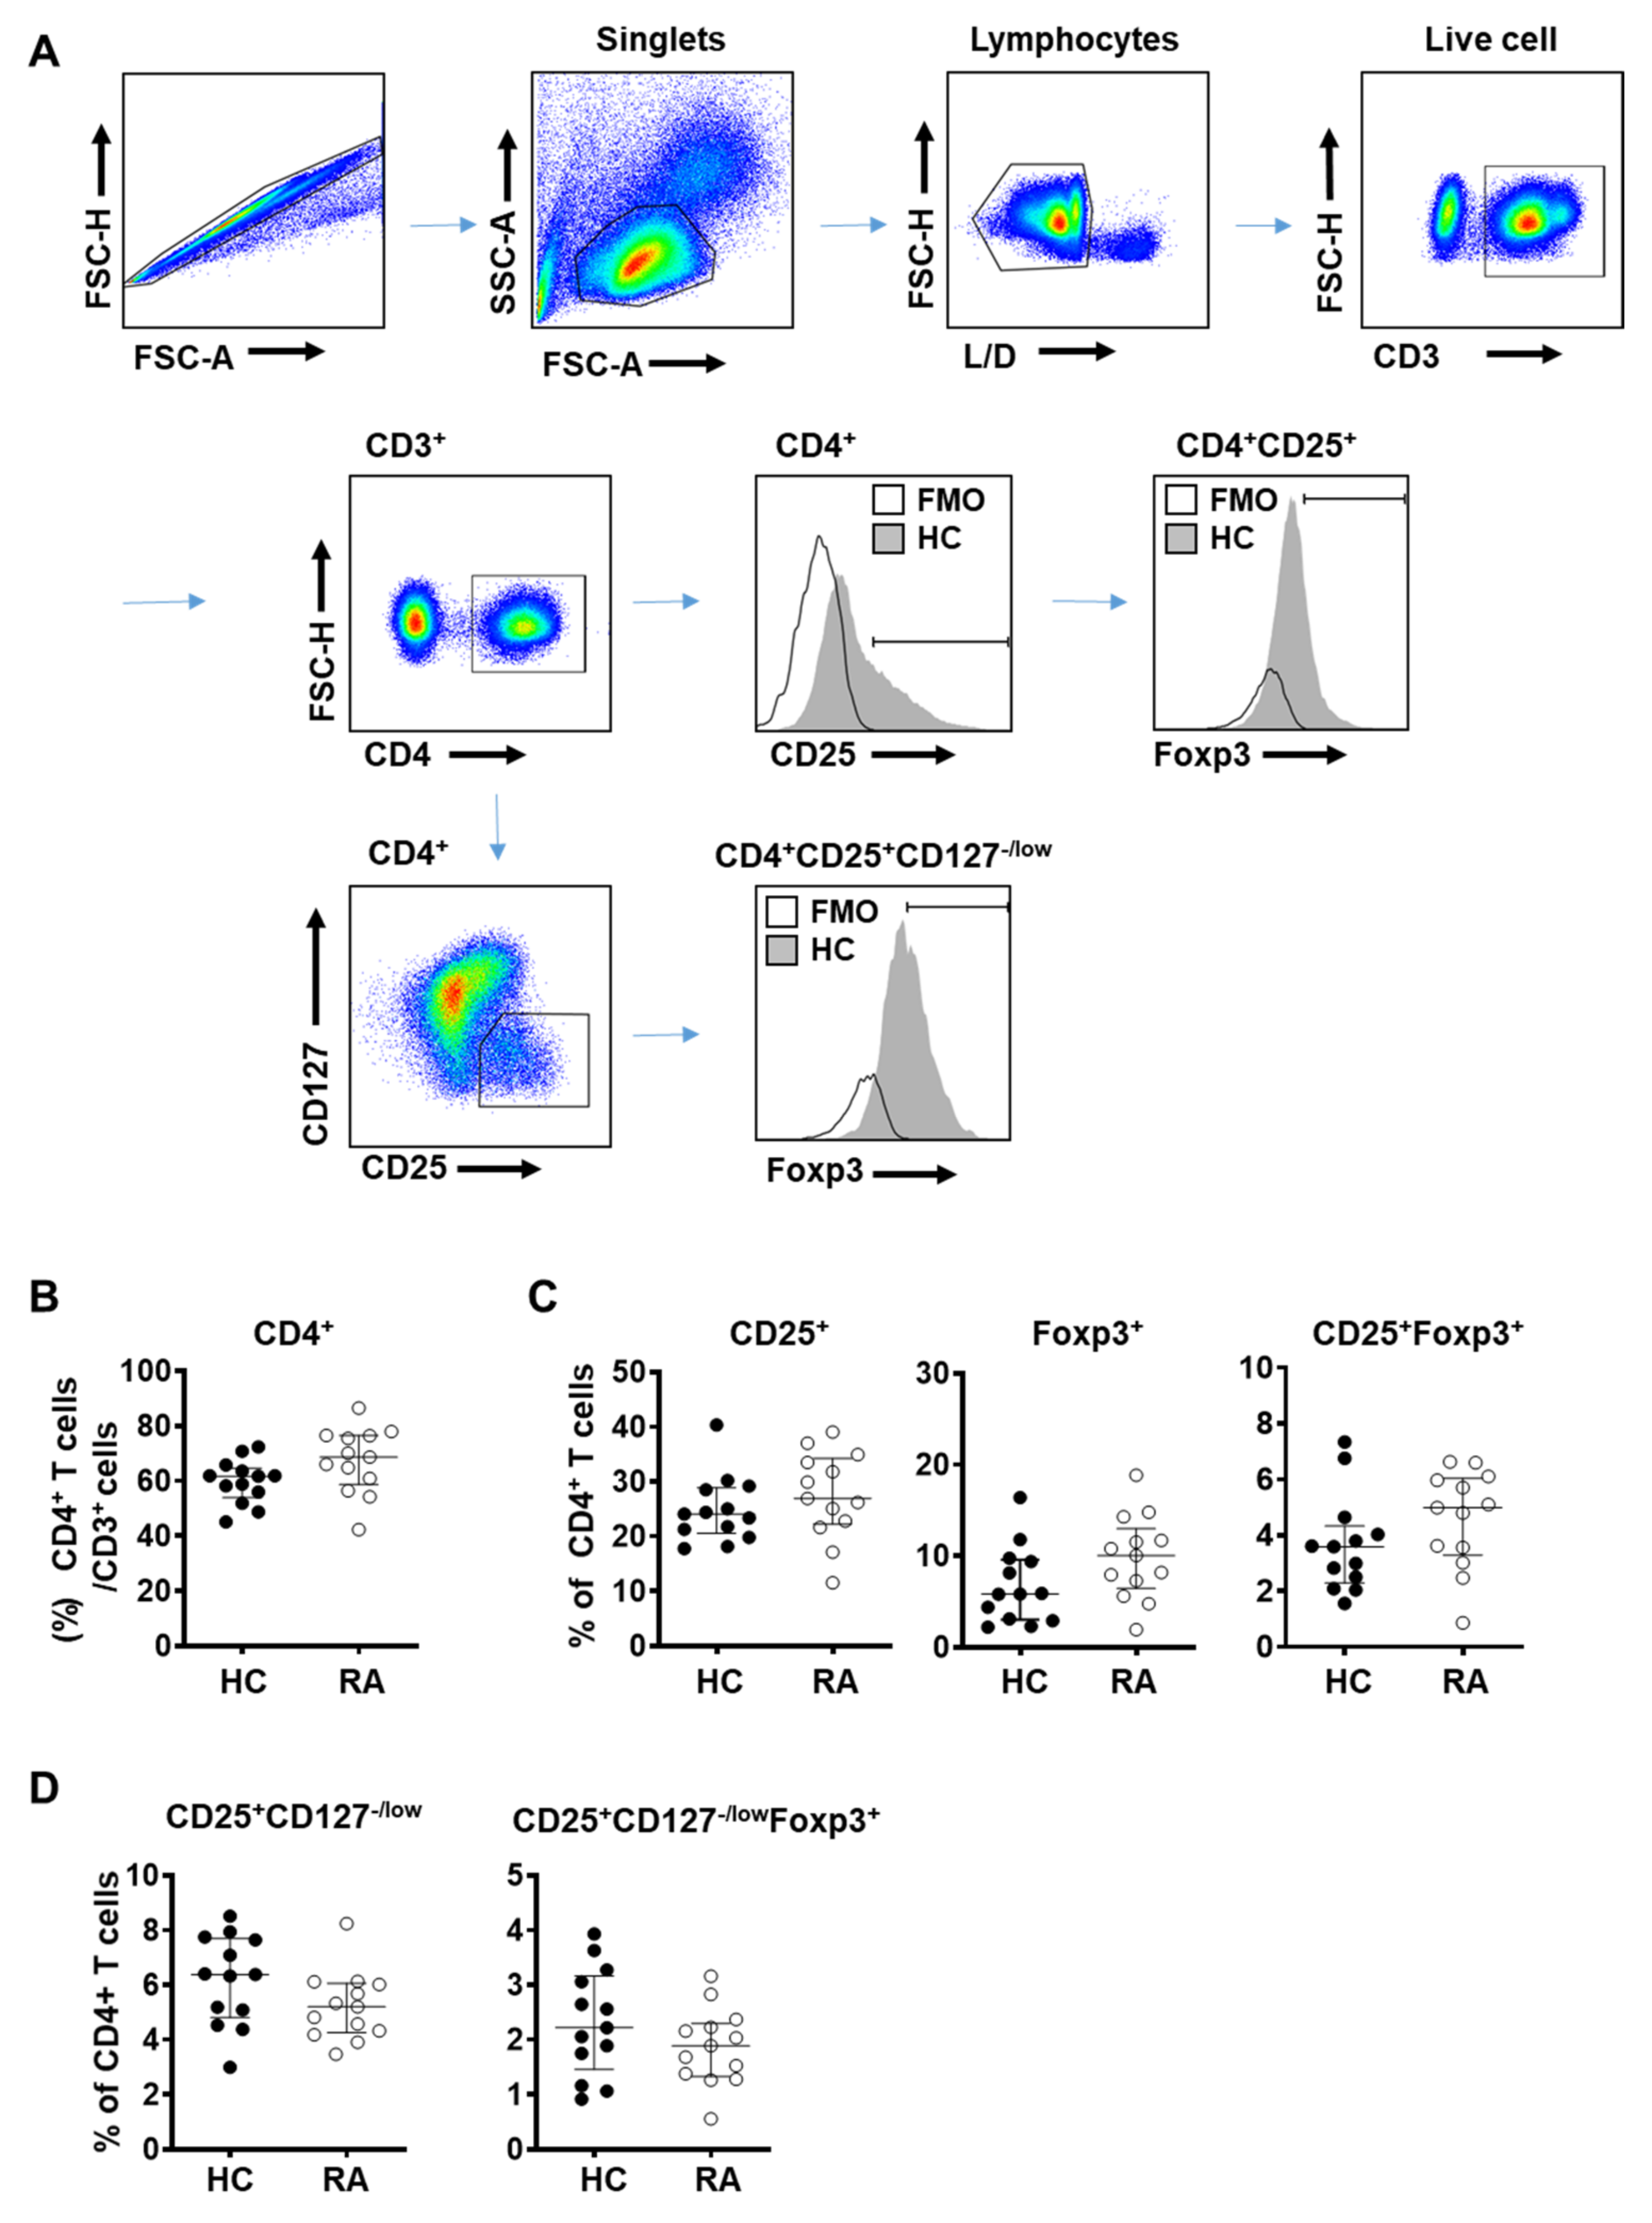
3.1. Total Frequency of Treg Cells in Peripheral Blood Did Not Show Significant Difference between RA and Control Subjects

To assess the total Treg population in RA patients, we defined Treg cells using molecular markers such as CD25, CD127, or Foxp3 and analyzed their proportion among CD4+ T cells in the peripheral blood of RA patients and healthy donors (Figure 1A) [46,47]. Disease severity of the RA subjects was in the range of remission to moderate stages, according to the clinical parameter Disease Activity Score 28 (DAS 28) (Table S1) [3]. Given the limited number of subjects (n = 13) in the study, all data were analyzed with a non-parametric test (Mann–Whitney test), although the majority displayed normal distribution.
The proportion of CD4+ T cells among CD3+ lymphocytes was similar between RA patients and control subjects (Figure 1B). Frequency of Treg cells among CD4+ T cells defined using CD25+ alone, Foxp3+ alone, and CD25+Foxp3+ was slightly elevated in RA patients compared to controls but did not reach statistical significance (Figure 1C). When Treg cells were defined as CD4+CD25+CD127−/low or CD4+CD25+CD127−/lowFoxp3+, their frequency among CD4+ T cells showed a decreasing tendency in RA patients but was not statistically different compared to controls (Figure 1D).
A proportion of early activated conventional T cells has been suggested to show a transient change in expression level of certain cell surface markers, mainly Foxp3, CD127 and CD25, which could be a hurdle to a precise identification of Treg cells. Given that RA patients may also have a greater proportion of activated conventional T cells, accurately assessing the total Treg population in RA patients may be challenging.

3.2. Frequency of Effector Treg Cells Is Decreased in the Peripheral Blood from RA Patients

Previously several reports on the frequency of Treg cells in the peripheral blood of RA patients have provided conflicting results. Our data did not show a statistically significant difference in the total Treg population between RA patients and healthy controls (Figure 1). As a way to consider heterogeneity of the Treg compartment and analyze the property of Treg subgroups, we introduced the CD45RA marker to discriminate between antigen-experienced Treg (e.g., CD45RA) and naïve Treg (e.g., CD45RA+) cells (Figure 2A).
Based on markers CD25 and CD45RA, previous studies have identified distinct T cell subgroups with differential Foxp3 expression and suppressive capacity [44,48,49]. The subgroups are as follows: CD25intCD45RA+ cells (Subgroup I, naïve/resting Treg), CD25hiCD45RA cells (Subgroup II, activated/effector Treg), CD25intCD45RA cells (Subgroup III, non-suppressive Treg), CD25lowCD45RA cells (Subgroup IV), CD25CD45RA cells (Subgroup V, effector Tconv), and CD25CD45RA+ cells (Subgroup VI, naïve Tconv). Among these, subgroups I, II, and III were Foxp3+ and the degree of Foxp3 expression was found to be proportional to CD25 expression. Specifically, CD25intCD45RA+ cells (Subgroup I) and CD25intCD45RA cells (Subgroup III) were Foxp3low, but CD25hiCD45RA cells (Subgroup II) were Foxp3hi.
Using these groupings, we found that the frequency of effector Treg cells (Subgroup II, CD25hiCD45RA) was markedly decreased in RA patients compared to healthy controls (Figure 2B). Interestingly, naïve Tconv cells (Subgroup VI, CD25CD45RA+) were decreased in RA patients compared to healthy controls, suggesting that conventional T cells are more likely to be in an activated state in RA patients given the chronic inflammatory condition (Figure 2B). The other Treg subgroups, naïve Treg (Subgroup I, CD25intCD45RA+) and non-suppressive Treg cells (Subgroup III, CD25intCD45RA cells), did not show statistically significant differences between RA patients and controls.
We performed the same analysis of CD25/CD45RA subgroups among Treg cells defined as CD25+CD127−/low (Figure S1A,B) or CD25+CD127−/lowFoxp3+ (Figure S1A,C). In both populations, the frequency of effector Treg cells (Subgroup II, CD25hiCD45RA) was markedly decreased in RA patients (Figure S1B,C). The proportion of effector Treg cells was similarly decreased among CD25+Foxp3+ Treg cells (Figure S2) in RA patients. These data suggest a significant decrease in the proportion of effector Treg cells among the total Foxp3+ Treg population in the peripheral blood of RA patients.

3.3. CD25 Expression Is Significantly Reduced in Treg Cells in the Peripheral Blood of RA Patients

The decreased frequency of effector Treg cells may be due to altered Treg homeostasis in RA patients. IL-2/IL-2R signaling has been recently shown to be critical for homeostasis of Treg cells [22,23]. Furthermore, IL2RA coding for CD25 is a known susceptibility factor for RA [26,27,28], and RA patients have been shown to have mild but significant decreases in circulating IL-2 [50,51]. Activated CD4+ T cells from RA patients are also known to produce less IL-2 [52,53]. Given that abnormalities of IL-2/IL-2R signaling pathways may lead to the breakdown of self-tolerance mechanisms in RA, we examined whether expression of IL-2Rα (CD25) in Treg cells was altered in RA patients.
Among Treg cells defined as CD25+Foxp3+, CD25+CD127−/low, or CD25+CD127−/lowFoxp3+, CD25 expression was significantly reduced in RA patients compared to healthy controls (Figure 3B,C). CD25+ and Foxp3+ Treg cells from RA patients also displayed reduced expression of CD25 (Figure 3B), although CD25 expression among total CD4+ T cells was similar between RA patients and control subjects (Figure 3A). These data suggest that the IL-2R signaling pathway in Treg cells may be impaired in RA patients.

3.4. CD25 Expression in Naïve and Effector Treg Cells Is Significantly Reduced in the Peripheral Blood of RA Patients

Given the decreased CD25 expression in the total Treg population, it was then measured in the six Treg subgroups. Expression levels of CD25 in naïve Treg (Subgroup I) or effector Treg (Subgroup II) cells were markedly decreased in RA patients (Figure 4A,B). However, naïve and effector conventional CD4+ T cells, Subgroup VI and Subgroup V, respectively, showed significantly increased CD25 expression in RA patients compared with those of heathy controls, suggesting that conventional CD4+ T cells maintain an activated status in RA patients (Figure 4E,F). In all subgroups, Foxp3 expression did not show significant differences between RA patients and controls (Figure 4A–F).
Within Treg cells defined as CD25+Foxp3+ (Figure S3A), CD25 expression was markedly decreased in naïve Treg (Subgroup I), effector Treg (Subgroup II), or non-suppressive Treg (Subgroup III) cells in RA patients. Conversely, Foxp3 expression was significantly elevated among naïve Treg and effector Treg cells in RA patients. Within CD25+CD127−/low Treg cells (Figure S3B), naïve Treg and effector Treg cells also showed a significant decrease in CD25 expression in RA patients, with increased Foxp3 expression in effector Treg cells in RA patients. In addition, within CD25+CD127−/lowFoxp3+ Treg cells (Figure S3C), CD25 expression was reduced among effector and non-suppressive Treg cells in RA patients, while Foxp3 expression was increased in Subgroups I, II, or III. A previous study had similarly shown that DMARD-exposed RA patients have higher Foxp3 expression compared to healthy controls [40]. Overall, naive and effector Treg cells displayed decreased CD25 expression in RA patients relative to controls with a concomitant increase in Foxp3. These data suggest that abnormalities in IL-2R signaling of Treg cells in RA patients may lead to a lower frequency of effector Treg cells.

4. Discussion

In this study, we analyzed the frequency of total circulating Treg cells and their subpopulations in the peripheral blood of RA patients and healthy controls. We showed that despite using well-validated markers, the proportion of the total Treg cell population, such as CD25+Foxp3+ and CD25+Foxp3+ CD127−/low, in CD4+ T cells did not show any significant change in the peripheral blood of RA patients. The frequency of total Treg cells in RA patients has been highly controversial [6,10]. However, our analysis of Treg subgroups among CD4+ T cells and the total Treg population consistently demonstrated a significant reduction of effector Treg cells (CD25hiCD45RA) in RA patients. Furthermore, expression levels of CD25, the α chain of the IL-2 receptor, constitutively expressed at the Treg cell surface membrane, was markedly decreased among Treg cells in RA patients, while Foxp3 expression in RA patients was significantly higher compared with that in healthy controls. In contrast, subpopulations of conventional CD4+ T cells showed a significant increase of CD25 expression in RA patients. These data suggest that low CD25 expression associated with abnormal IL-2/IL-2R signaling may lead to reduced frequency of effector Treg cells and serve as a phenotypic characteristic of Treg cells in peripheral blood of RA patients.
While it is generally agreed that the frequency of Treg cells is increased in the synovial fluid of RA patients, similar studies of the peripheral blood reported largely inconsistent results [6]. Some studies showed an increase in circulating Treg cells in RA patients [54,55,56] while others reported no change [18,57], and still others showed an increase [58,59]. These discrepancies have been attributed to a lack of consensus on Treg markers [6,7]. Indeed, in our study alone we observed an increasing trend of CD25+Foxp3+ Treg cells in RA patients, but a decreasing trend in CD25+CD127−/lowFoxp3+ Treg cells in RA patients (Figure 1). In addition to inconsistent detection strategies, the functional and phenotypic heterogeneity of Treg cells may further obscure their role in RA [44,48]. Here we report that certain Treg subpopulations among PBMC show a strong association with RA. The effector Treg subgroup with suppressive functions (CD25hiCD45RA) was significantly decreased in RA patients, while the frequency of naïve Treg (CD25intCD45RA+) or non-suppressive Treg (CD25int CD45RA) cells did not show a significant difference (Figure 2B).
A recent study used a robust statistical test for disease associations with single cell data, called as MASC (mixed-effects modeling of associations of single cells), to show that the frequency of two Treg subsets expressing high levels of CD25 and Foxp3 was significantly reduced among resting CD4+ memory T cells in the peripheral blood of RA patients [60]. Furthermore, increased Treg frequencies in the synovial fluid of RA patients were reported to be due to an increased number of Subgroup III Treg cells (CD25intCD45RA) with little suppressive activity and even some pro-inflammatory properties [56]. Notably, there was no observed difference in naïve and effector Treg cells between the synovial fluid and peripheral blood of RA patients. These observations suggest that the Treg compartment may be functionally impaired in RA patients. In line with our findings, this dysfunction may be at least in part attributable to the low frequency of effector Treg cells (CD25hiCD45RA) and manifest as an inability to suppress autoreactive T cells.
The effector Treg subgroup has been previously described to have strong suppressive capacity [44,48]. The functional consequences of fewer effector Treg cells in RA patients and the mechanisms responsible remain to be elucidated. Previous studies showed that IL-2 is essential for the optimal development, survival, and function of Treg cells [20,21,22,23] and RA patients were shown to have lower serum IL-2 and reduced IL-2 production upon T cell activation [50,51,52,53]. We further show that expression of CD25, the α chain of the IL-2 receptor, was markedly reduced among Treg cells in RA patients. The IL-2 receptor α chain (CD25) is essential for the high-affinity IL-2 receptor complex, allowing Treg cells to respond to very low concentrations of IL-2 [21,61]. Given that appropriate IL-2 signaling is needed for the expression of pro-survival genes such as BCL2 and BCL2L1 (coding BCL-XL) and overall survival of Treg cells [62,63,64,65,66], the degree of CD25 expression in Treg cells may be critical to their homeostasis and survival [29,30]. Highlighting its importance, several genes involved in IL-2/IL-2R signaling such as IL-2-IL21, CTLA4, IL2RA, IL2RB, CD83, PTPN2, and CCR6 were included in a list of RA risk gene loci identified to date in the transethnic genome-wide association study (GWAS) meta-analysis of RA [25,26]. In addition, CTLA4 and IL2RA were found to be down-regulated among RA patients in an integrated analysis of GWAS and eQTL data [26]. These reports suggest that the reduction of effector Treg cells in RA patients may be linked to impaired IL-2/IL-2R signaling, due to both decreased expression of IL-2Rα (CD25) in Treg cells and the limited availability of IL-2 from reduced IL-2 production by autoreactive conventional CD4+ T cells. Interestingly, several current therapies for RA have been reported to expand the Treg compartment [40,41]. Among RA patients, an increased frequency of CD4+CD25hi Treg cells has been associated with responders to anti-TNF-α therapy compared to non-responders [42]. Similarly, CD25+Foxp3+ Treg cells in RA patients were reported to be expanded by anti-IL-6R blockade. Recently, a low-dose IL-2 therapy induced the expansion of the Treg compartment in autoimmune disease patients including those with RA [33].
Our findings highlight the heterogeneity of Treg cells in the peripheral blood and suggest that the effector Treg subset in particular may be critical to RA pathogenesis. Due to limited IL-2/IL-2R signaling, effector Treg cells may be unable to apply appropriate regulatory function against the rampant inflammation seen in RA. As one way of understanding the heterogeneity of Treg cells in the peripheral blood, distinct T cell subgroups with differential Foxp3 expression and suppressive capacity were classified based on markers CD25 and CD45RA [42,44]. We can classify the T cells as CD25-positive or -negative based on flow cytometric analysis of cell surface CD25 expression. CD25CD45RA cells (Subgroup V, effector Tconv), and CD25CD45RA+ cells (Subgroup VI, naïve Tconv) were identified as CD25-negative. CD25-positive groups include CD25lowCD45RA cells (Subgroup IV), CD25intCD45RA cells (Subgroup III, non-suppressive Treg), CD25intCD45RA+ cells (Subgroup I, naïve/resting Treg), and CD25hiCD45RA cells (Subgroup II, activated/effector Treg). Among effector Tconv and naïve Tconv cells, CD25 expression was higher in RA patients than in healthy controls. In contrast, both the total population of regulatory T cells and its subgroups demonstrated significantly reduced CD25 expression in RA patients compared to controls. The generalizability of our observations is limited by the relatively small sample size. It will be important to characterize our findings in a larger group of RA patients with careful stratification. Although this study focused on assessing the variations in frequency of Treg subsets, to fully understand the role of Treg cells in RA and their potential as therapeutic targets, phenotypic characteristics and the suppressive function of Treg cells must also be elucidated. Further study is warranted on the mechanisms of impaired effector Treg function in RA pathogenesis and its potential as a biomarker for the basis of therapeutic development [49].

Supplementary Materials

The following are available online at https://www.mdpi.com/article/10.3390/cells10040801/s1. Table S1. Characteristics of controls and RA subjects; Figure S1. Frequency of effector Treg cells among the total Treg cells defined as CD25+CD127−/low or CD25+CD127−/lowFoxp3+ is decreased in PBMC of RA patients; Figure S2. Frequency of effector Treg cells among CD25+Foxp3+ Treg cells is decreased in PBMC of RA patients; Figure S3. Naïve and effector Treg cells from RA patients show decreased CD25 expression.

Author Contributions

Conceptualization, J.K. (Jaeyul Kwon), S.W.K., J.-G.K.; formal analysis, E.G., S.C., S.-J.Y., P.S., S.K., B.Y.H., Y.K.; funding acquisition, S.W.K., J.K. (Jaeyul Kwon); investigation, E.G., S.-J.Y., S.C., P.S., S.K., B.Y.H., Y.K., J.-G.K., J.K. (Jinhyun Kim), S.W.K., J.K. (Jaeyul Kwon); methodology, E.G., S.-J.Y., S.C., P.S., S.K., B.Y.H., Y.K., J.-G.K., J.K. (Jinhyun Kim), S.W.K., J.K. (Jaeyul Kwon), M.K.J., E.-C.S.; project administration, S.-J.Y., J.K. (Jaeyul Kwon); resources, S.-J.Y., S.W.K., M.K.J., E.-C.S., J.K. (Jinhyun Kim); Supervision, J.K. (Jaeyul Kwon); Validation, E.G., S.-J.Y., S.C., P.S., S.K., B.Y.H., Y.K., J.-G.K., S.W.K., J.K. (Jinhyun Kim); visualization, S.C., E.G., S.-J.Y., M.K.J., P.S., S.K., B.Y.H., Y.K., J.-G.K.; writing—original draft, J.K. (Jaeyul Kwon), S.K., S.C., J.-G.K., E.G., S.-J.Y.; writing—review & editing, S.K., J.-G.K., S.C., J.K. (Jinhyun Kim), M.K.J., E.-C.S., S.W.K., J.K. (Jaeyul Kwon). All authors have read and agreed to the published version of the manuscript.

Funding

This research was supported by research fund of Chungnam National University; by Basic Science Research Program through the National Research Foundation of Korea (NRF) funded by the Ministry of Education (NRF-2016R1D1A1B03931637).

Institutional Review Board Statement

The study was conducted according to the guidelines of the Declaration of Helsinki, and approved by the Institutional Review Board of Chungnam National University Hospital (IRB file No. CNUH 2015-10-052, approval date 2015-10-28).

Informed Consent Statement

Informed consent was obtained from all subjects involved in the study.

Data Availability Statement

The data used to support the findings of this study are available from the corresponding author upon request.

Acknowledgments

We thank members of Department of Infection Biology and Department of Internal Medicine, College of Medicine, Chungnam National University for helpful assistance during the course of this study.

Conflicts of Interest

The authors declare no conflict of interest.

References

  1. Feldmann, M.; Brennan, F.M.; Maini, R.N. Rheumatoid arthritis. Cell 1996, 85, 307–310. [Google Scholar] [CrossRef] [Green Version]
  2. Firestein, G.S. Evolving concepts of rheumatoid arthritis. Nature 2003, 423, 356–361. [Google Scholar] [CrossRef]
  3. Smolen, J.S.; Aletaha, D.; Barton, A.; Burmester, G.R.; Emery, P. Rheumatoid arthritis. Nat. Rev. Dis. Prim. 2018, 4, 18001. [Google Scholar] [CrossRef]
  4. Shevach, E.M. Regulatory T cells in autoimmmunity. Annu. Rev. Immunol. 2000, 18, 423–449. [Google Scholar] [CrossRef] [Green Version]
  5. Sakaguchi, S.; Sakaguchi, N.; Asano, M.; Itoh, M.; Toda, M. Immunologic self-tolerance maintained by activated T cells expressing IL-2 receptor alpha-chains (CD25). Breakdown of a single mechanism of self-tolerance causes various autoimmune diseases. J. Immunol. 1995, 155, 1151–1164. [Google Scholar] [PubMed]
  6. Miyara, M.; Gorochov, G.; Ehrenstein, M.; Musset, L.; Sakaguchi, S.; Amoura, Z. Human FoxP3+ regulatory T cells in systemic autoimmune diseases. Autoimmun. Rev. 2011, 10, 744–755. [Google Scholar] [CrossRef] [PubMed]
  7. Morita, T.; Shima, Y.; Wing, J.B.; Sakaguchi, S.; Ogata, A.; Kumanogoh, A. The Proportion of Regulatory T Cells in Patients with Rheumatoid Arthritis: A Meta-Analysis. PLoS ONE 2016, 11, e0162306. [Google Scholar] [CrossRef] [Green Version]
  8. Ranganathan, P. Pharmacogenomics of tumor necrosis factor antagonists in rheumatoid arthritis. Pharmacogenomics 2005, 6, 481–490. [Google Scholar] [CrossRef] [PubMed] [Green Version]
  9. Valencia, X.; Stephens, G.; Goldbach-Mansky, R.; Wilson, M.; Shevach, E.M.; Lipsky, P.E. TNF downmodulates the function of human CD4+CD25hi T-regulatory cells. Blood 2006, 108, 253–261. [Google Scholar] [CrossRef]
  10. Grant, C.R.; Liberal, R.; Mieli-Vergani, G.; Vergani, D.; Longhi, M.S. Regulatory T-cells in autoimmune diseases: Challenges, controversies and—Yet—Unanswered questions. Autoimmun. Rev. 2015, 14, 105–116. [Google Scholar] [CrossRef] [PubMed] [Green Version]
  11. Fontenot, J.D.; Gavin, M.A.; Rudensky, A.Y. Foxp3 programs the development and function of CD4+CD25+ regulatory T cells. Nat. Immunol. 2003, 4, 330–336. [Google Scholar] [CrossRef]
  12. Khattri, R.; Cox, T.; Yasayko, S.A.; Ramsdell, F. An essential role for Scurfin in CD4+CD25+ T regulatory cells. Nat. Immunol. 2003, 4, 337–342. [Google Scholar] [CrossRef] [PubMed]
  13. Colamatteo, A.; Carbone, F.; Bruzzaniti, S.; Galgani, M.; Fusco, C. Molecular Mechanisms Controlling Foxp3 Expression in Health and Autoimmunity: From Epigenetic to Post-translational Regulation. Front. Immunol. 2019, 10, 3136. [Google Scholar] [CrossRef] [PubMed]
  14. Liu, W.W.; Mazor, O.; Wilson, R.I. Thermosensory processing in the Drosophila brain. Nature 2015, 519, 353–357. [Google Scholar] [CrossRef]
  15. O’Gorman, W.E.; Dooms, H.; Thorne, S.H.; Kuswanto, W.F.; Simonds, E.F. The initial phase of an immune response functions to activate regulatory T cells. J. Immunol. 2009, 183, 332–339. [Google Scholar] [CrossRef] [Green Version]
  16. Liu, W.; Putnam, A.L.; Xu-Yu, Z.; Szot, G.L.; Lee, M.R. CD127 expression inversely correlates with FoxP3 and suppressive function of human CD4+ T reg cells. J. Exp. Med. 2006, 203, 1701–1711. [Google Scholar] [CrossRef] [Green Version]
  17. Seddiki, N.; Santner-Nanan, B.; Martinson, J.; Zaunders, J.; Sasson, S. Expression of interleukin (IL)-2 and IL-7 receptors discriminates between human regulatory and activated T cells. J. Exp. Med. 2006, 203, 1693–1700. [Google Scholar] [CrossRef] [PubMed]
  18. Aerts, N.E.; Dombrecht, E.J.; Ebo, D.G.; Bridts, C.H.; Stevens, W.J.; de Clerck, L.S. Activated T cells complicate the identification of regulatory T cells in rheumatoid arthritis. Cell Immunol. 2008, 251, 109–115. [Google Scholar] [CrossRef]
  19. Kmieciak, M.; Gowda, M.; Graham, L.; Godder, K.; Bear, H.D. Human T cells express CD25 and Foxp3 upon activation and exhibit effector/memory phenotypes without any regulatory/suppressor function. J. Transl. Med. 2009, 7, 89. [Google Scholar] [CrossRef] [Green Version]
  20. Letourneau, S.; Krieg, C.; Pantaleo, G.; Boyman, O. IL-2- and CD25-dependent immunoregulatory mechanisms in the homeostasis of T-cell subsets. J. Allergy Clin. Immunol. 2009, 123, 758–762. [Google Scholar] [CrossRef]
  21. Malek, T.R.; Castro, I. Interleukin-2 receptor signaling: At the interface between tolerance and immunity. Immunity 2010, 33, 153–165. [Google Scholar] [CrossRef] [Green Version]
  22. Permanyer, M.; Bosnjak, B.; Glage, S.; Friedrichsen, M.; Floess, S. Efficient IL-2R signaling differentially affects the stability, function, and composition of the regulatory T-cell pool. Cell Mol. Immunol. 2021, 18, 398–414. [Google Scholar] [CrossRef] [PubMed]
  23. Toomer, K.H.; Lui, J.B.; Altman, N.H.; Ban, Y.; Chen, X.; Malek, T.R. Essential and non-overlapping IL-2Ralpha-dependent processes for thymic development and peripheral homeostasis of regulatory T cells. Nat. Commun. 2019, 10, 1037. [Google Scholar] [CrossRef]
  24. Toomer, K.H.; Malek, T.R. Cytokine Signaling in the Development and Homeostasis of Regulatory T cells. Cold Spring Harb. Perspect. Biol. 2018, 10, a028597. [Google Scholar] [CrossRef] [PubMed]
  25. Marquez, A.; Kerick, M.; Zhernakova, A.; Gutierrez-Achury, J.; Chen, W.M. Meta-analysis of Immunochip data of four autoimmune diseases reveals novel single-disease and cross-phenotype associations. Genome Med. 2018, 10, 97. [Google Scholar] [CrossRef] [PubMed]
  26. Okada, Y.; Eyre, S.; Suzuki, A.; Kochi, Y.; Yamamoto, K. Genetics of rheumatoid arthritis: 2018 status. Ann. Rheum. Dis. 2019, 78, 446–453. [Google Scholar] [CrossRef] [PubMed] [Green Version]
  27. Knevel, R.; de Rooy, D.P.; Zhernakova, A.; Grondal, G.; Krabben, A. Association of variants in IL2RA with progression of joint destruction in rheumatoid arthritis. Arthritis Rheum. 2013, 65, 1684–1693. [Google Scholar] [CrossRef]
  28. Van Steenbergen, H.W.; van Nies, J.A.; Ruyssen-Witrand, A.; Huizinga, T.W.; Cantagrel, A. IL2RA is associated with persistence of rheumatoid arthritis. Arthritis Res. Ther. 2015, 17, 244. [Google Scholar] [CrossRef] [PubMed] [Green Version]
  29. Hulme, M.A.; Wasserfall, C.H.; Atkinson, M.A.; Brusko, T.M. Central role for interleukin-2 in type 1 diabetes. Diabetes 2012, 61, 14–22. [Google Scholar] [CrossRef] [PubMed] [Green Version]
  30. Golding, A.; Hasni, S.; Illei, G.; Shevach, E.M. The percentage of FoxP3+Helios+ Treg cells correlates positively with disease activity in systemic lupus erythematosus. Arthritis Rheum. 2013, 65, 2898–2906. [Google Scholar] [CrossRef] [Green Version]
  31. Abbas, A.K.; Trotta, E.; Simeonov, D.R.; Marson, A.; Bluestone, J.A. Revisiting IL-2: Biology and therapeutic prospects. Sci. Immunol. 2018, 3, eaat1482. [Google Scholar] [CrossRef] [Green Version]
  32. Klatzmann, D.; Abbas, A.K. The promise of low-dose interleukin-2 therapy for autoimmune and inflammatory diseases. Nat. Rev. Immunol. 2015, 15, 283–294. [Google Scholar] [CrossRef] [PubMed]
  33. Rosenzwajg, M.; Lorenzon, R.; Cacoub, P.; Pham, H.P.; Pitoiset, F. Immunological and clinical effects of low-dose interleukin-2 across 11 autoimmune diseases in a single, open clinical trial. Ann. Rheum. Dis. 2019, 78, 209–217. [Google Scholar] [CrossRef] [PubMed]
  34. Von Spee-Mayer, C.; Siegert, E.; Abdirama, D.; Rose, A.; Klaus, A. Low-dose interleukin-2 selectively corrects regulatory T cell defects in patients with systemic lupus erythematosus. Ann. Rheum. Dis. 2016, 75, 1407–1415. [Google Scholar] [CrossRef] [PubMed]
  35. Whitehouse, G.; Gray, E.; Mastoridis, S.; Merritt, E.; Kodela, E. IL-2 therapy restores regulatory T-cell dysfunction induced by calcineurin inhibitors. Proc. Natl. Acad. Sci. USA 2017, 114, 7083–7088. [Google Scholar] [CrossRef] [Green Version]
  36. Miao, J.; Zhu, P. Functional Defects of Treg Cells: New Targets in Rheumatic Diseases, Including Ankylosing Spondylitis. Curr. Rheumatol. Rep. 2018, 20, 30. [Google Scholar] [CrossRef]
  37. Miyara, M.; Ito, Y.; Sakaguchi, S. TREG-cell therapies for autoimmune rheumatic diseases. Nat. Rev. Rheumatol. 2014, 10, 543–551. [Google Scholar] [CrossRef]
  38. Sun, H.; Gao, W.; Pan, W.; Zhang, Q.; Wang, G. Tim3(+) Foxp3 (+) Treg Cells Are Potent Inhibitors of Effector T Cells and Are Suppressed in Rheumatoid Arthritis. Inflammation 2017, 40, 1342–1350. [Google Scholar] [CrossRef]
  39. Malemud, C.J. Defective T-Cell Apoptosis and T-Regulatory Cell Dysfunction in Rheumatoid Arthritis. Cells 2018, 7, 223. [Google Scholar] [CrossRef] [Green Version]
  40. Cribbs, A.P.; Kennedy, A.; Penn, H.; Amjadi, P.; Green, P. Methotrexate Restores Regulatory T Cell Function Through Demethylation of the FoxP3 Upstream Enhancer in Patients With Rheumatoid Arthritis. Arthritis Rheumatol. 2015, 67, 1182–1192. [Google Scholar] [CrossRef] [PubMed]
  41. Gupta, L.; Ahmed, S.; Jain, A.; Misra, R. Emerging role of metabolomics in rheumatology. Int. J. Rheum. Dis. 2018, 21, 1468–1477. [Google Scholar] [CrossRef]
  42. Nguyen, D.X.; Cotton, A.; Attipoe, L.; Ciurtin, C.; Dore, C.J.; Ehrenstein, M.R. Regulatory T cells as a biomarker for response to adalimumab in rheumatoid arthritis. J. Allergy Clin. Immunol. 2018, 142, 978–980.e9. [Google Scholar] [CrossRef]
  43. Tada, Y.; Ono, N.; Suematsu, R.; Tashiro, S.; Sadanaga, Y. The balance between Foxp3 and Ror-gammat expression in peripheral blood is altered by tocilizumab and abatacept in patients with rheumatoid arthritis. BMC Musculoskelet. Disord. 2016, 17, 290. [Google Scholar] [CrossRef] [PubMed] [Green Version]
  44. Miyara, M.; Yoshioka, Y.; Kitoh, A.; Shima, T.; Wing, K. Functional delineation and differentiation dynamics of human CD4+ T cells expressing the FoxP3 transcription factor. Immunity 2009, 30, 899–911. [Google Scholar] [CrossRef] [PubMed] [Green Version]
  45. Prevoo, M.L.; van ’t Hof, M.A.; Kuper, H.H.; van Leeuwen, M.A.; van de Putte, L.B.; van Riel, P.L. Modified disease activity scores that include twenty-eight-joint counts. Development and validation in a prospective longitudinal study of patients with rheumatoid arthritis. Arthritis Rheum. 1995, 38, 44–48. [Google Scholar] [CrossRef] [PubMed] [Green Version]
  46. Rodriguez-Perea, A.L.; Arcia, E.D.; Rueda, C.M.; Velilla, P.A. Phenotypical characterization of regulatory T cells in humans and rodents. Clin. Exp. Immunol. 2016, 185, 281–291. [Google Scholar] [CrossRef] [PubMed] [Green Version]
  47. Santegoets, S.J.; Dijkgraaf, E.M.; Battaglia, A.; Beckhove, P.; Britten, C.M. Monitoring regulatory T cells in clinical samples: Consensus on an essential marker set and gating strategy for regulatory T cell analysis by flow cytometry. Cancer Immunol. Immunother. 2015, 64, 1271–1286. [Google Scholar] [CrossRef] [PubMed] [Green Version]
  48. Cuadrado, E.; van den Biggelaar, M.; de Kivit, S.; Chen, Y.Y.; Slot, M. Proteomic Analyses of Human Regulatory T Cells Reveal Adaptations in Signaling Pathways that Protect Cellular Identity. Immunity 2018, 48, 1046–1059.e6. [Google Scholar] [CrossRef] [Green Version]
  49. Wing, J.B.; Tanaka, A.; Sakaguchi, S. Human FOXP3(+) Regulatory T Cell Heterogeneity and Function in Autoimmunity and Cancer. Immunity 2019, 50, 302–316. [Google Scholar] [CrossRef] [Green Version]
  50. Combe, B.; Pope, R.M.; Fischbach, M.; Darnell, B.; Baron, S.; Talal, N. Interleukin-2 in rheumatoid arthritis: Production of and response to interleukin-2 in rheumatoid synovial fluid, synovial tissue and peripheral blood. Clin. Exp. Immunol. 1985, 59, 520–528. [Google Scholar] [PubMed]
  51. Kitas, G.D.; Salmon, M.; Farr, M.; Gaston, J.S.; Bacon, P.A. Deficient interleukin 2 production in rheumatoid arthritis: Association with active disease and systemic complications. Clin. Exp. Immunol. 1988, 73, 242–249. [Google Scholar] [PubMed]
  52. Kitas, G.D.; Salmon, M.; Farr, M.; Young, S.P.; Bacon, P.A. T-cell functional defects in rheumatoid arthritis: Intrinsic or extrinsic? J. Autoimmun. 1988, 1, 339–351. [Google Scholar] [CrossRef]
  53. Skapenko, A.; Wendler, J.; Lipsky, P.E.; Kalden, J.R.; Schulze-Koops, H. Altered memory T cell differentiation in patients with early rheumatoid arthritis. J. Immunol. 1999, 163, 491–499. [Google Scholar] [PubMed]
  54. Cao, S.; Xiang, Z.; Ma, X. Global gene expression profiling in interleukin-12-induced activation of CD8(+) cytotoxic T lymphocytes against mouse mammary Carcinoma. Cell Mol. Immunol. 2004, 1, 357–366. [Google Scholar] [PubMed]
  55. Jiao, Z.; Wang, W.; Jia, R.; Li, J.; You, H. Accumulation of FoxP3-expressing CD4+CD25+ T cells with distinct chemokine receptors in synovial fluid of patients with active rheumatoid arthritis. Scand. J. Rheumatol. 2007, 36, 428–433. [Google Scholar] [CrossRef] [PubMed]
  56. Sempere-Ortells, J.M.; Perez-Garcia, V.; Marin-Alberca, G.; Peris-Pertusa, A.; Benito, J.M. Quantification and phenotype of regulatory T cells in rheumatoid arthritis according to disease activity score-28. Autoimmunity 2009, 42, 636–645. [Google Scholar] [CrossRef]
  57. Ehrenstein, M.R.; Evans, J.G.; Singh, A.; Moore, S.; Warnes, G. Compromised function of regulatory T cells in rheumatoid arthritis and reversal by anti-TNFalpha therapy. J. Exp. Med. 2004, 200, 277–285. [Google Scholar] [CrossRef] [PubMed]
  58. Han, G.M.; O’Neil-Andersen, N.J.; Zurier, R.B.; Lawrence, D.A. CD4+CD25high T cell numbers are enriched in the peripheral blood of patients with rheumatoid arthritis. Cell Immunol. 2008, 253, 92–101. [Google Scholar] [CrossRef] [Green Version]
  59. Van Amelsfort, J.M.; Jacobs, K.M.; Bijlsma, J.W.; Lafeber, F.P.; Taams, L.S. CD4(+)CD25(+) regulatory T cells in rheumatoid arthritis: Differences in the presence, phenotype, and function between peripheral blood and synovial fluid. Arthritis Rheum. 2004, 50, 2775–2785. [Google Scholar] [CrossRef]
  60. Fonseka, C.Y.; Rao, D.A.; Teslovich, N.C.; Korsunsky, I.; Hannes, S.K. Mixed-effects association of single cells identifies an expanded effector CD4(+) T cell subset in rheumatoid arthritis. Sci. Transl. Med. 2018, 10, eaaq0305. [Google Scholar] [CrossRef] [Green Version]
  61. Liao, W.; Lin, J.X.; Leonard, W.J. Interleukin-2 at the crossroads of effector responses, tolerance, and immunotherapy. Immunity 2013, 38, 13–25. [Google Scholar] [CrossRef] [Green Version]
  62. Haque, R.; Lei, F.; Xiong, X.; Wu, Y.; Song, J. FoxP3 and Bcl-xL cooperatively promote regulatory T cell persistence and prevention of arthritis development. Arthritis Res. Ther. 2010, 12, R66. [Google Scholar] [CrossRef] [PubMed] [Green Version]
  63. Issa, F.; Milward, K.; Goto, R.; Betts, G.; Wood, K.J.; Hester, J. Transiently Activated Human Regulatory T Cells Upregulate BCL-XL Expression and Acquire a Functional Advantage in vivo. Front. Immunol. 2019, 10, 889. [Google Scholar] [CrossRef] [Green Version]
  64. Murase, K.; Kawano, Y.; Ryan, J.; Matsuoka, K.; Gregory, B. Low-Dose IL-2 Induces Bcl2 Expression and Resistance To Apoptosis In CD4 Regulatory T Cells. Blood 2013, 122, 3475. [Google Scholar] [CrossRef]
  65. Sharabi, A.; Lapter, S.; Mozes, E. Bcl-xL is required for the development of functional regulatory CD4 cells in lupus-afflicted mice following treatment with a tolerogenic peptide. J. Autoimmun. 2010, 34, 87–95. [Google Scholar] [CrossRef] [PubMed]
  66. Tischner, D.; Gaggl, I.; Peschel, I.; Kaufmann, M.; Tuzlak, S. Defective cell death signalling along the Bcl-2 regulated apoptosis pathway compromises Treg cell development and limits their functionality in mice. J. Autoimmun. 2012, 38, 59–69. [Google Scholar] [CrossRef] [PubMed] [Green Version]
Figure 1. Frequency of regulatory T (Treg) cells did not change in patients with rheumatoid arthritis (RA). Blood samples were collected from healthy donor (HC, n = 13) and rheumatoid arthritis patients (RA, n = 13) and analyzed by flow cytometry. (A) Flow cytometry gating scheme of Treg subpopulations in human peripheral blood mononuclear cells (PBMC). FMO (fluorescence minus one control); HC (healthy control). Percentage of (B) CD4+ T cells among CD3+ T lymphocytes in PBMC, (C) CD25+, Foxp3+, or CD25+Foxp3+ Treg cells among CD4+ T cells, and (D) CD25+CD127−/low, or CD25+CD127−/low Foxp3+ Treg cells among CD4+ T cells. Data from individual subjects were presented with the median values. Statistical differences were calculated by Mann–Whitney test.
Cells 10 00801 g001
Figure 2. The frequency of effector Treg subpopulations is decreased in the peripheral blood from RA patients. (A) Gating strategy to identify six subgroups of CD4+ T cells based on the expression levels of CD25 and CD45RA: CD25intCD45RA+ cells (Subgroup I, naïve Treg), CD25hiCD45RA cells (Subgroup II, effector Treg), CD25intCD45RA cells (Subgroup III, non-suppressive Treg), CD25lowCD45RA cells (Subgroup IV), CD25CD45RA cells (Subgroup V, effector Tconv), and CD25CD45RA+ cells (Subgroup VI, naïve Tconv). (B) Frequency of each subgroup among CD4+ T cells of PBMC from healthy controls (HC, n = 13) and RA patients (n = 13). Statistical differences between HC and RA were calculated by Mann–Whitney test and presented as p-value.
Cells 10 00801 g002
Figure 3. Treg cells from RA patients show decreased CD25 expression. CD25 expression level was measured by flow cytometry in (A) CD4+ T cells, (B) CD4+CD25+, CD4+Foxp3+, or CD4+CD25+Foxp3+ Treg cells, and (C) CD4+CD25+CD127−/low, CD4+CD25+CD127−/lowFoxp3+ Treg cells in PBMC from healthy controls (HC, n = 13) and RA patients (RA, n = 13). Statistical differences were calculated by Mann–Whitney test.
Cells 10 00801 g003
Figure 4. Naïve and effector Treg subpopulations from RA patients showed significantly reduced CD25 expression. Expression of CD25 and Foxp3 was measured by flow cytometry in each CD4+ T cell subgroup from healthy controls (HC, n = 13) and RA patients (RA, n = 13). Subgroups were as follows: (A) I (CD25intCD45RA+ cells), (B) II (CD25hiCD45RA cells), (C) III (CD25intCD45RA cells), (D) IV (CD25lowCD45RA cells), (E) V (CD25CD45RA cells), and (F) VI (CD25CD45RA cells). Statistical differences were calculated by Mann–Whitney test.
Cells 10 00801 g004
Publisher’s Note: MDPI stays neutral with regard to jurisdictional claims in published maps and institutional affiliations.

