
Avian Reovirus P17 Suppresses Angiogenesis by Promoting DPP4 Secretion

 , , , ,
  ,
,  and
and 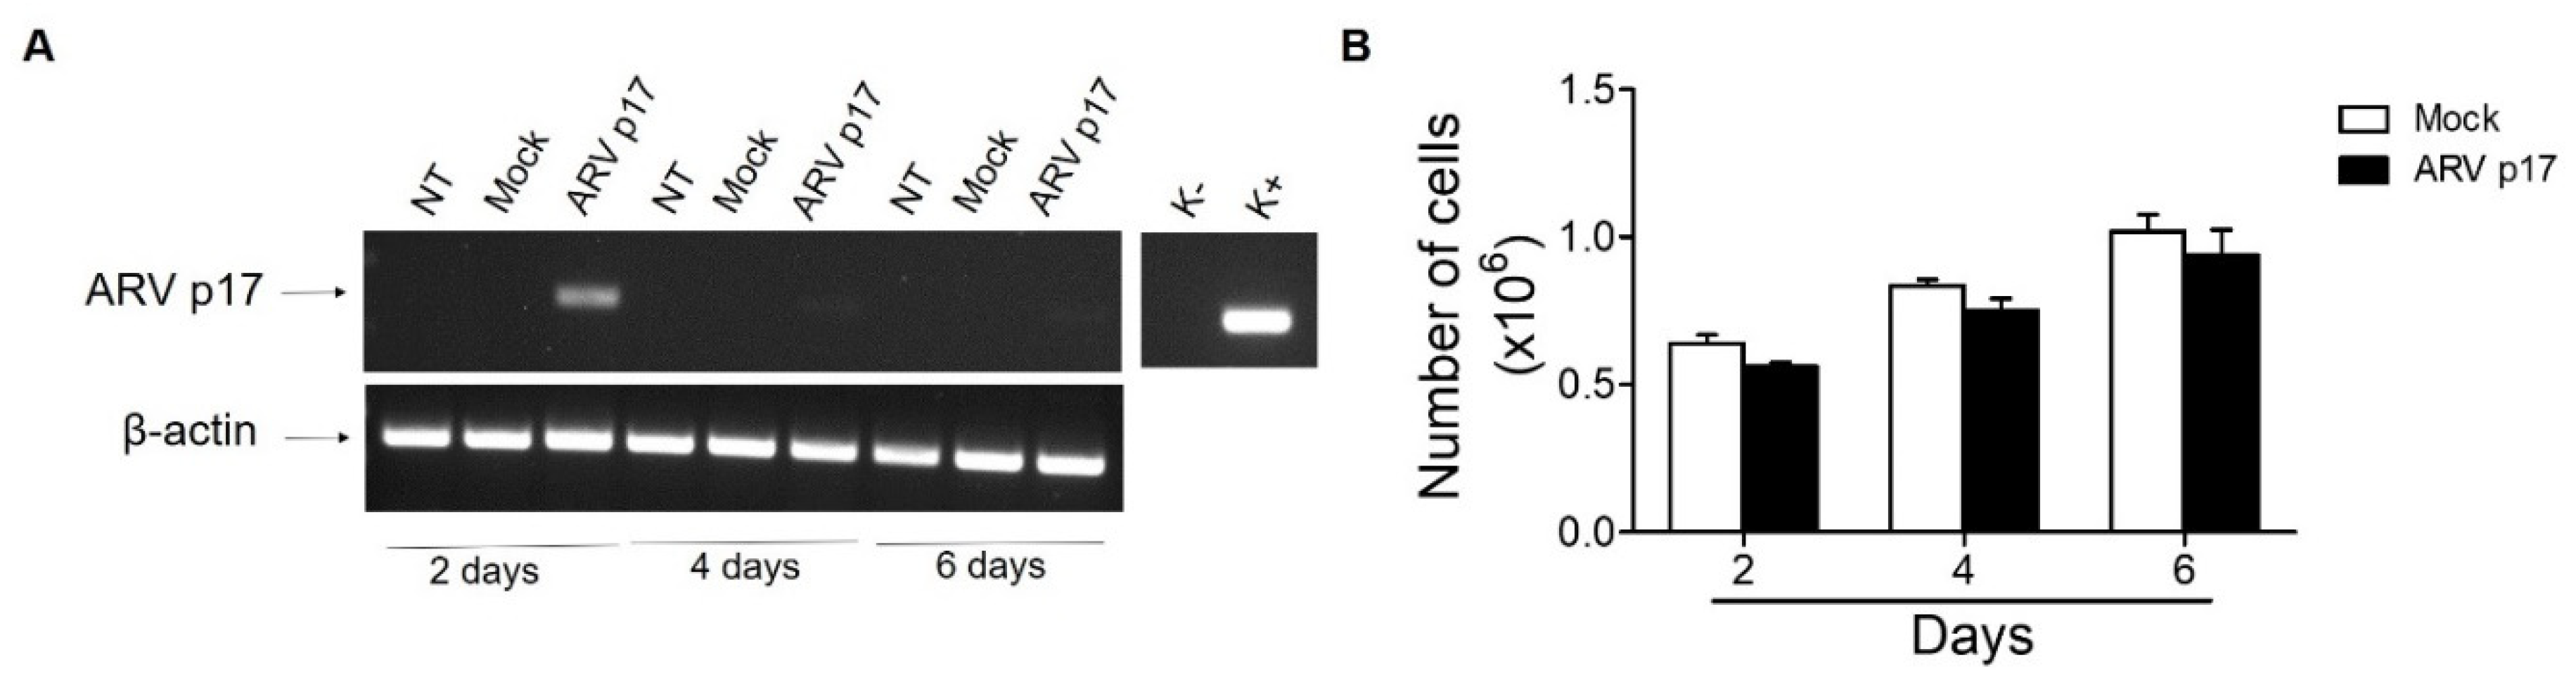
Abstract
1. Introduction
2. Materials and Methods
2.1. Cell Cultures
2.2. Cloning, Production and Purification of Recombinant GST-ARV p17
2.3. Nucleofection
2.4. Cell Proliferation Assay
2.5. RNA Extraction, PCR and Quantitative Real-Time PCR Analysis
2.6. Wound Healing Assay
2.7. Cell Motility Assay
2.8. Tube Formation Assay
2.9. Matrigel Assay
2.10. Spheroids Assay
2.11. Immunofluorescence
2.12. Aortic Ring Assay
2.13. Chick Chorioallantoic Membrane (CAM) Assay
2.14. Angiogenesis Microarray Analysis
2.15. Human DPP4/CD26 Enzyme-Linked Immunosorbent Assay (ELISA)
2.16. Statistical Analysis
3. Results
3.1. ARV p17 Transduction in HUVECs
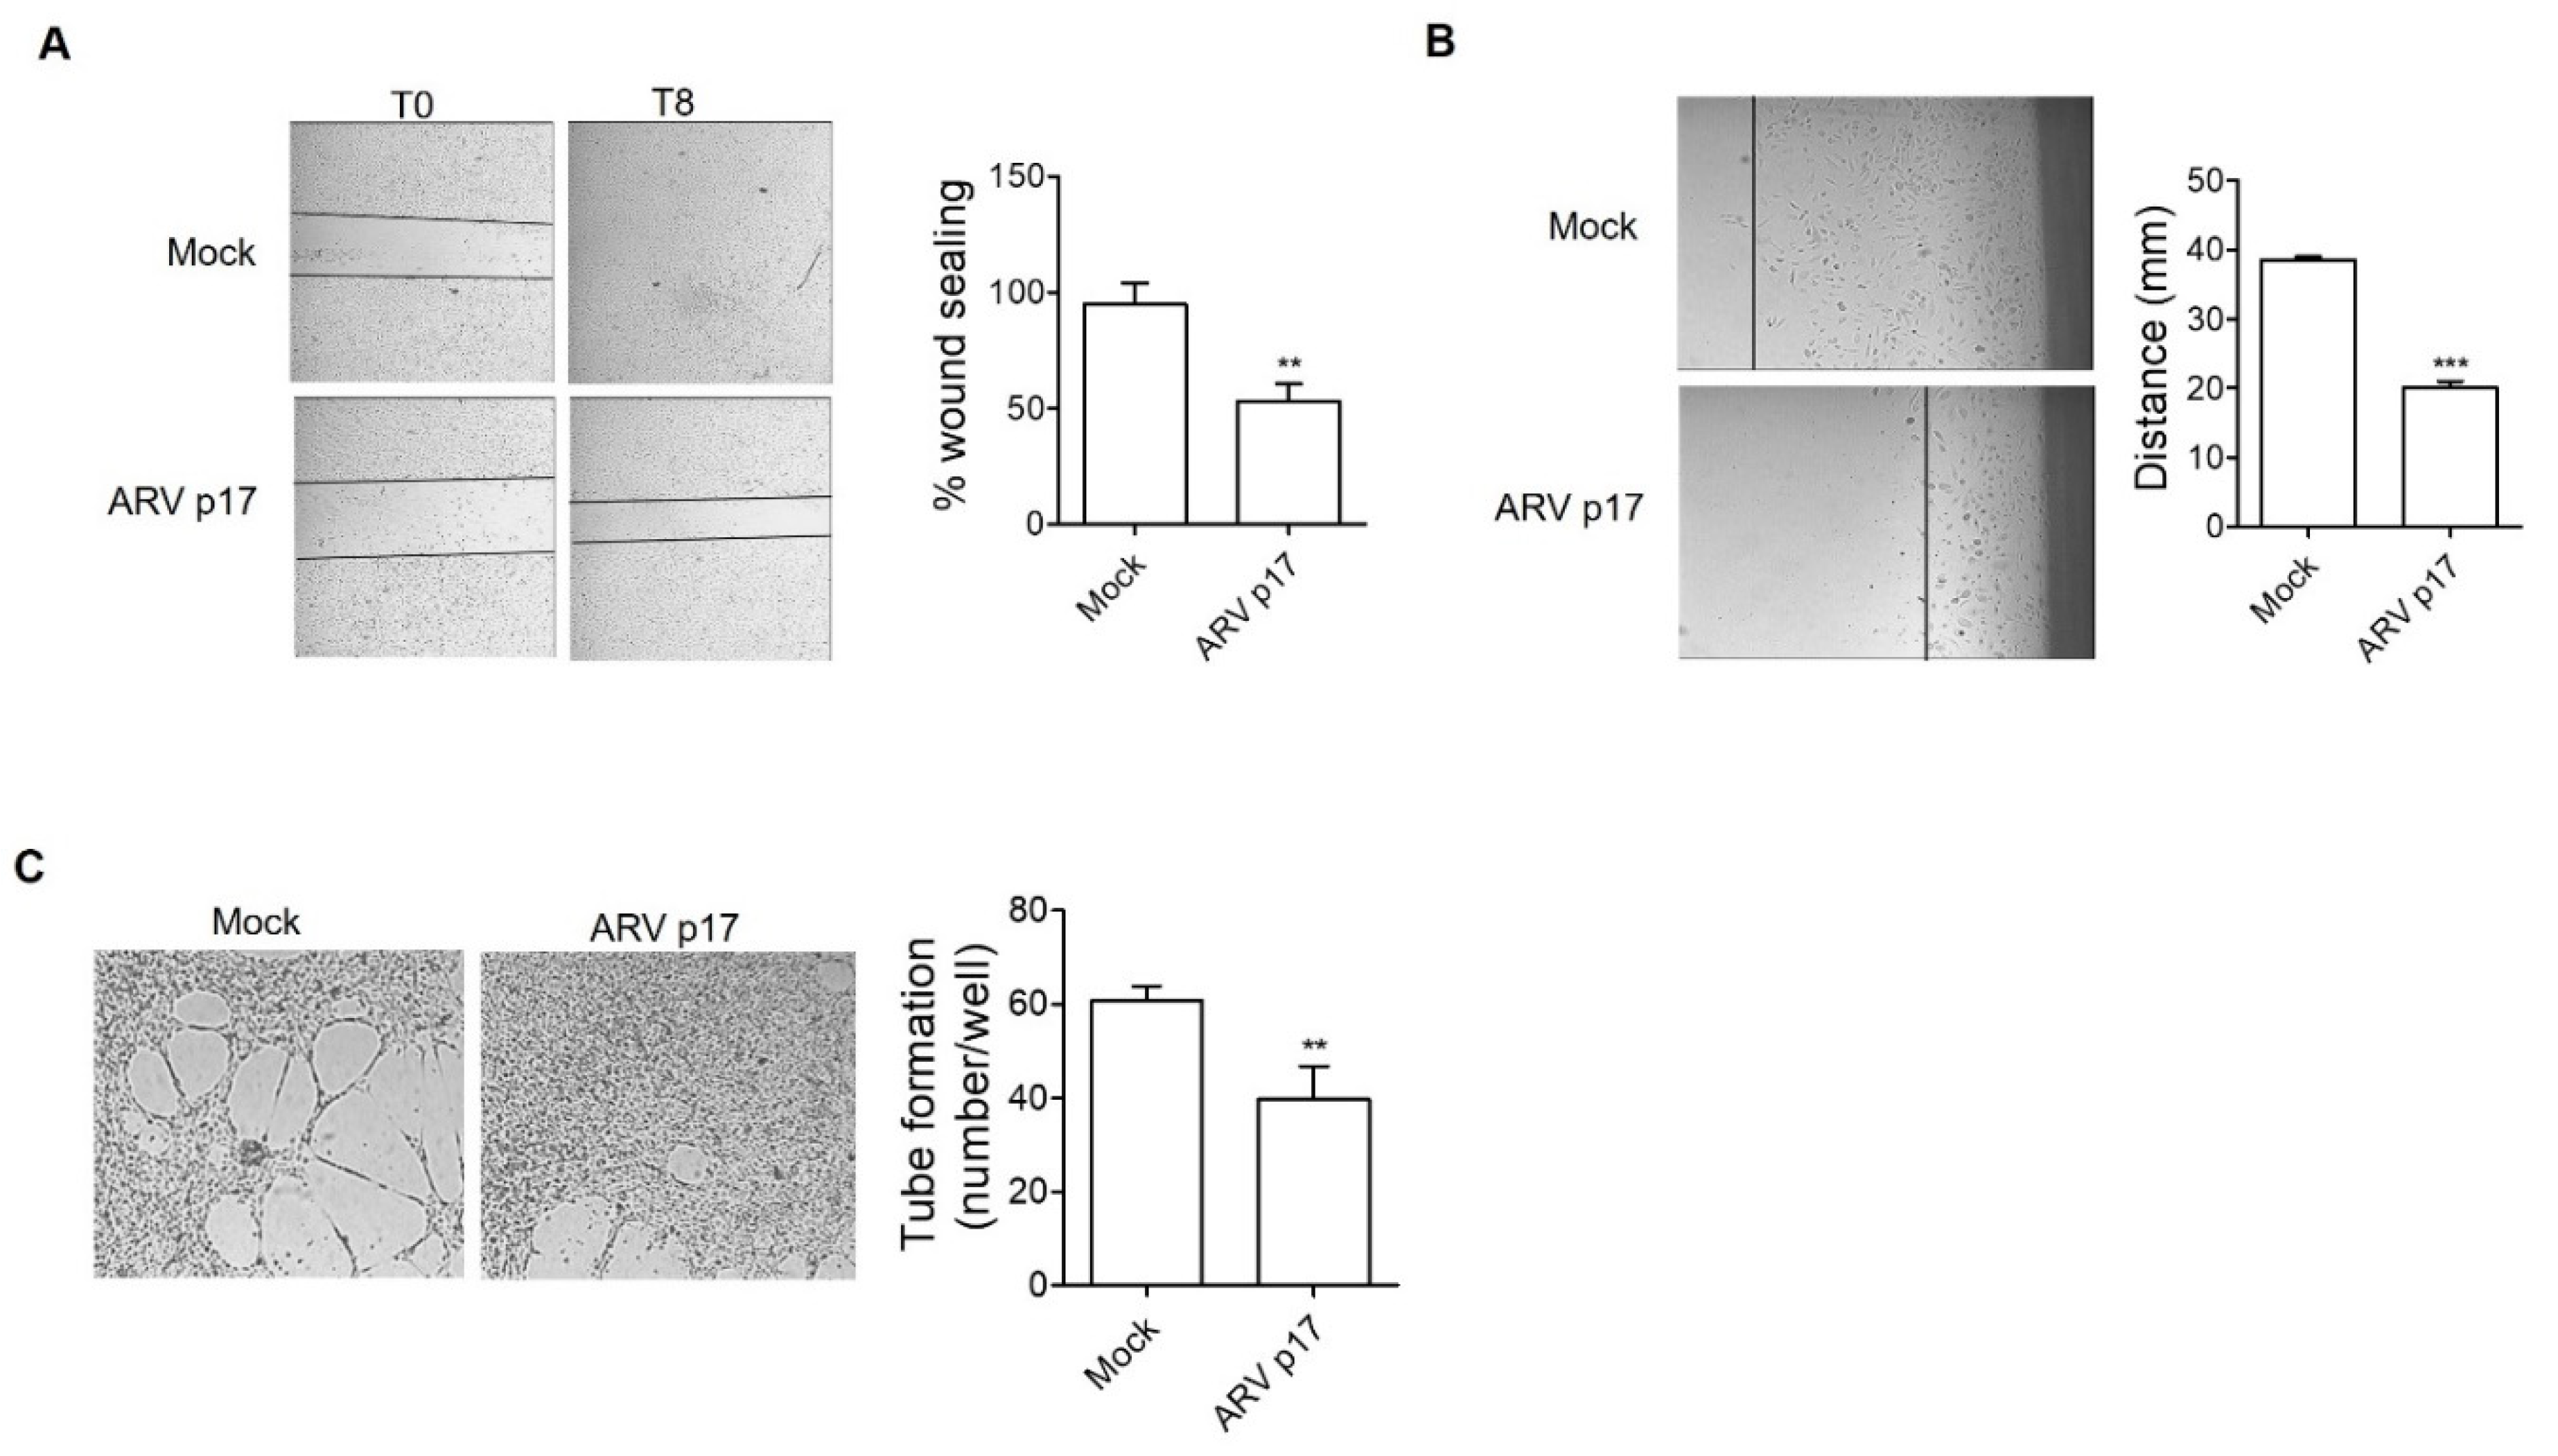
3.2. ARV p17 Expression Inhibits HUVEC Migration and Morphogenesis
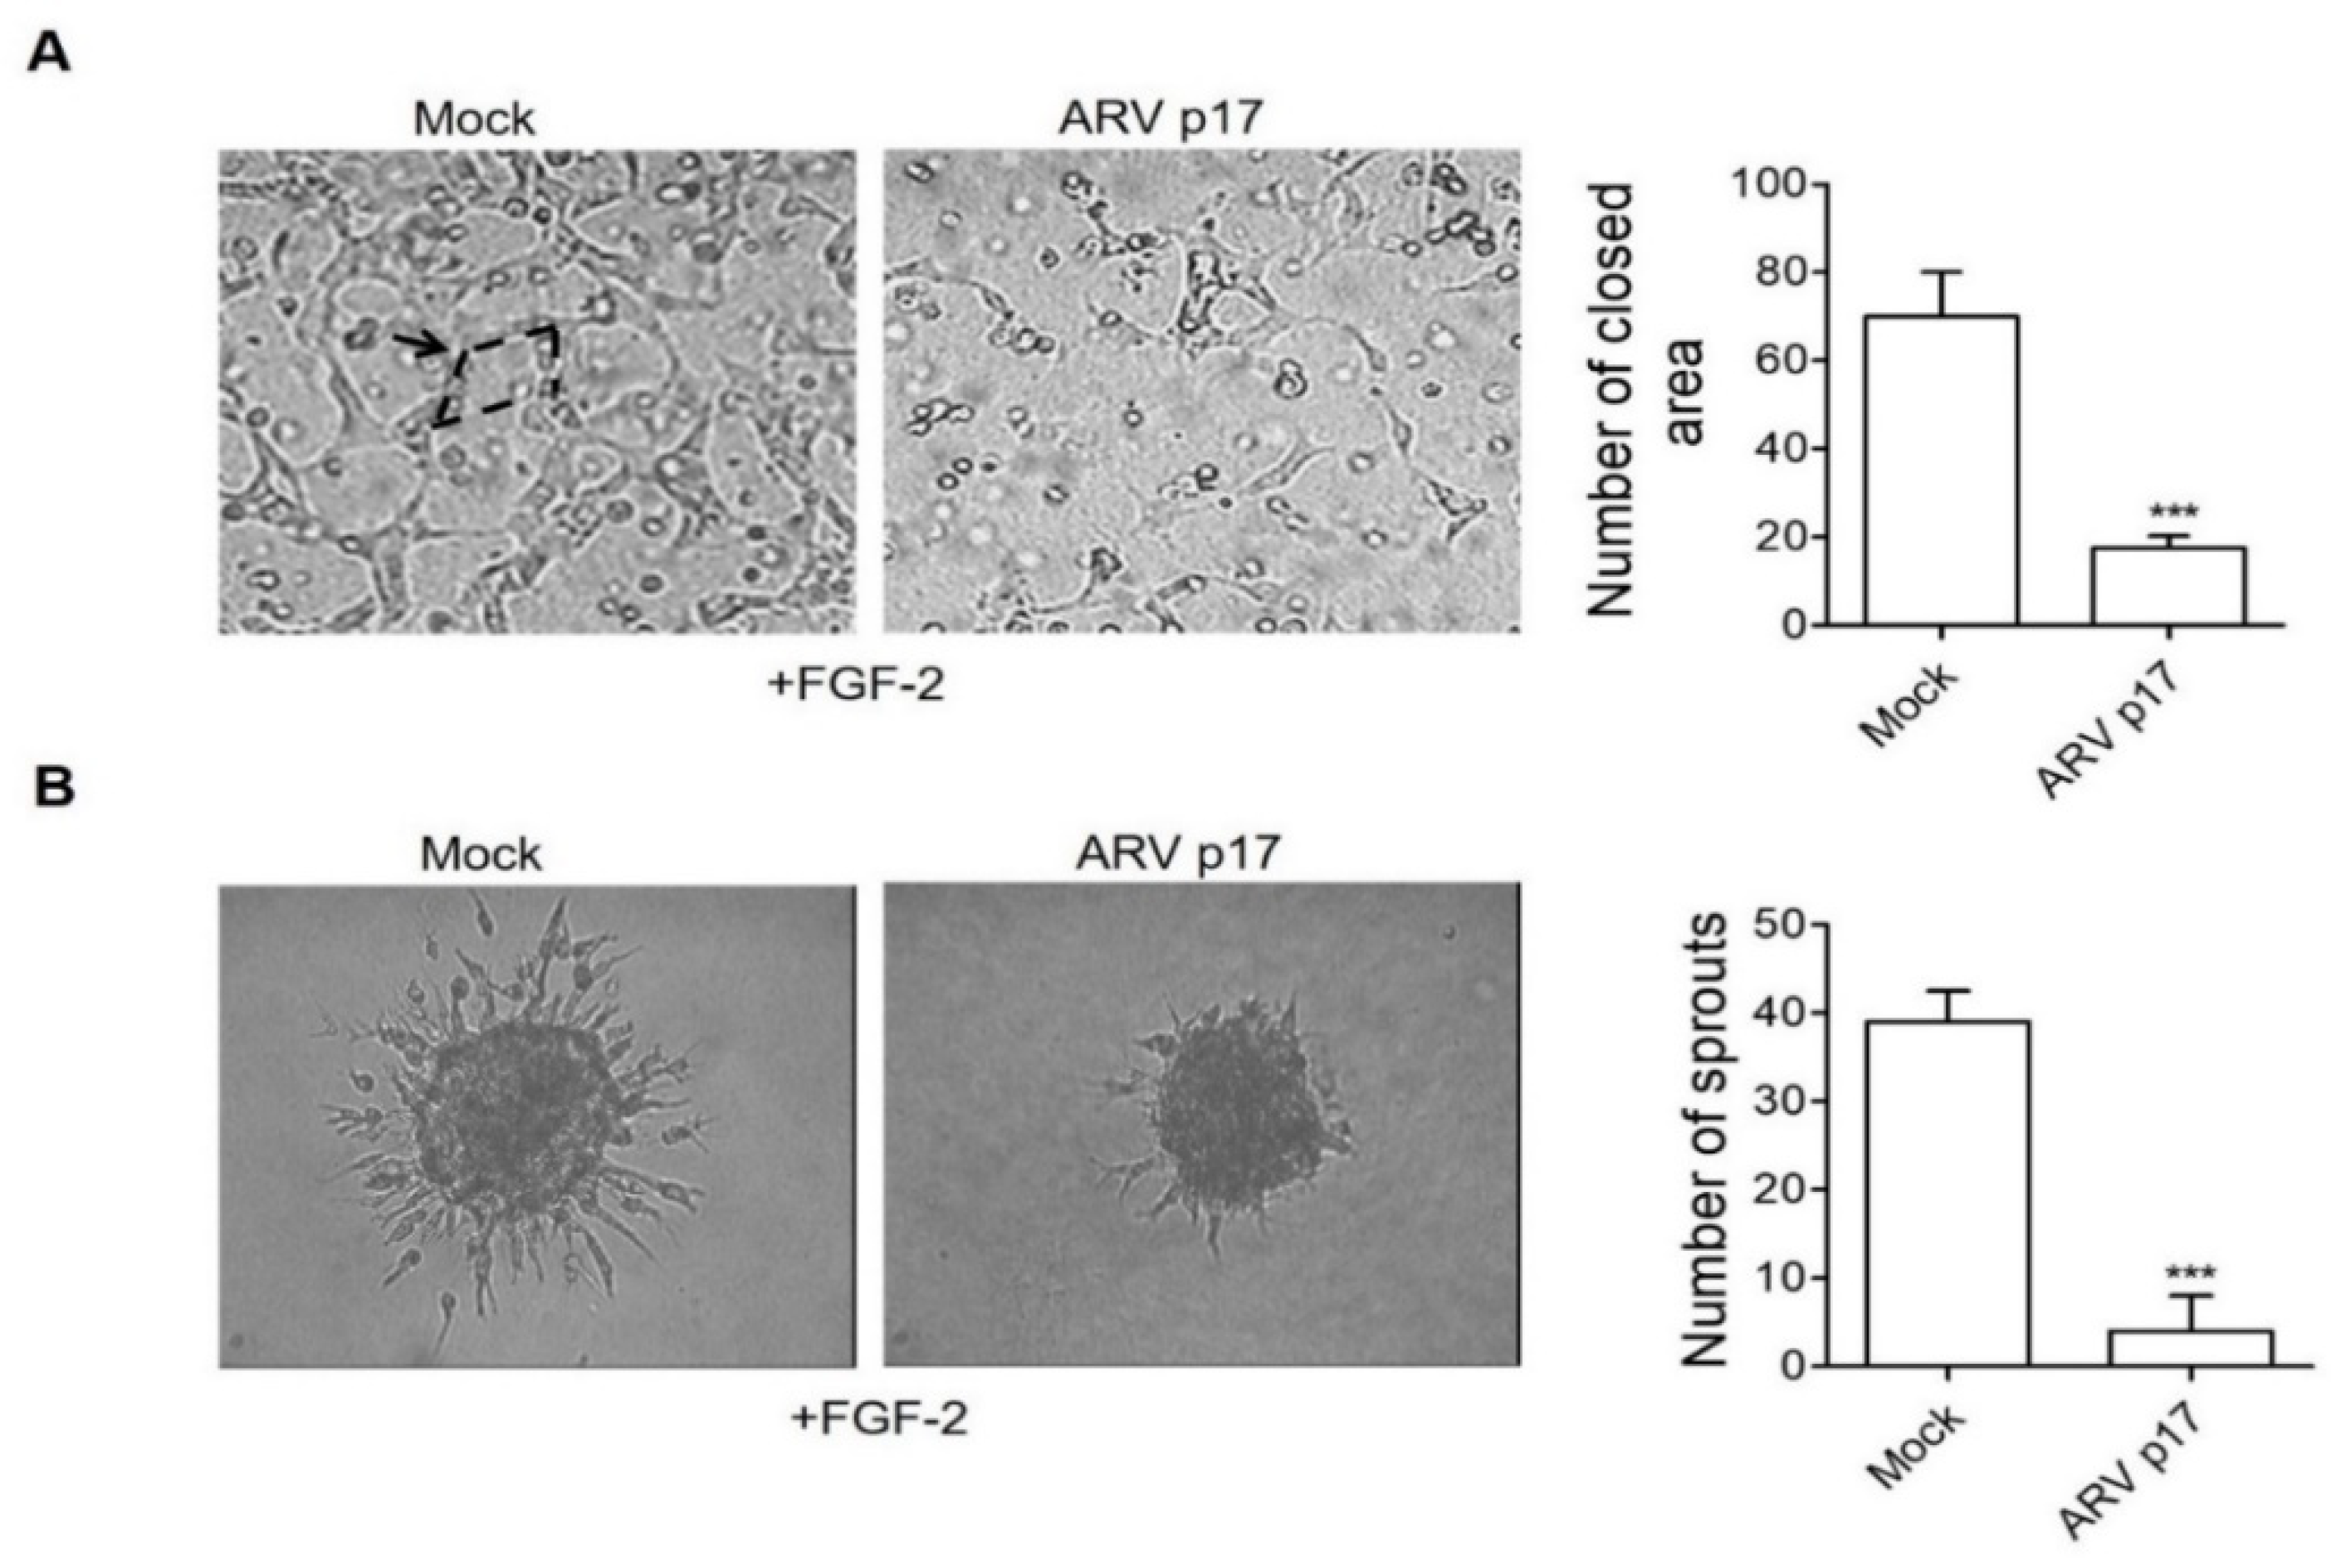
3.3. ARV p17 Expression Inhibits FGF-2-Induced Angiogenic Responses in HUVECs
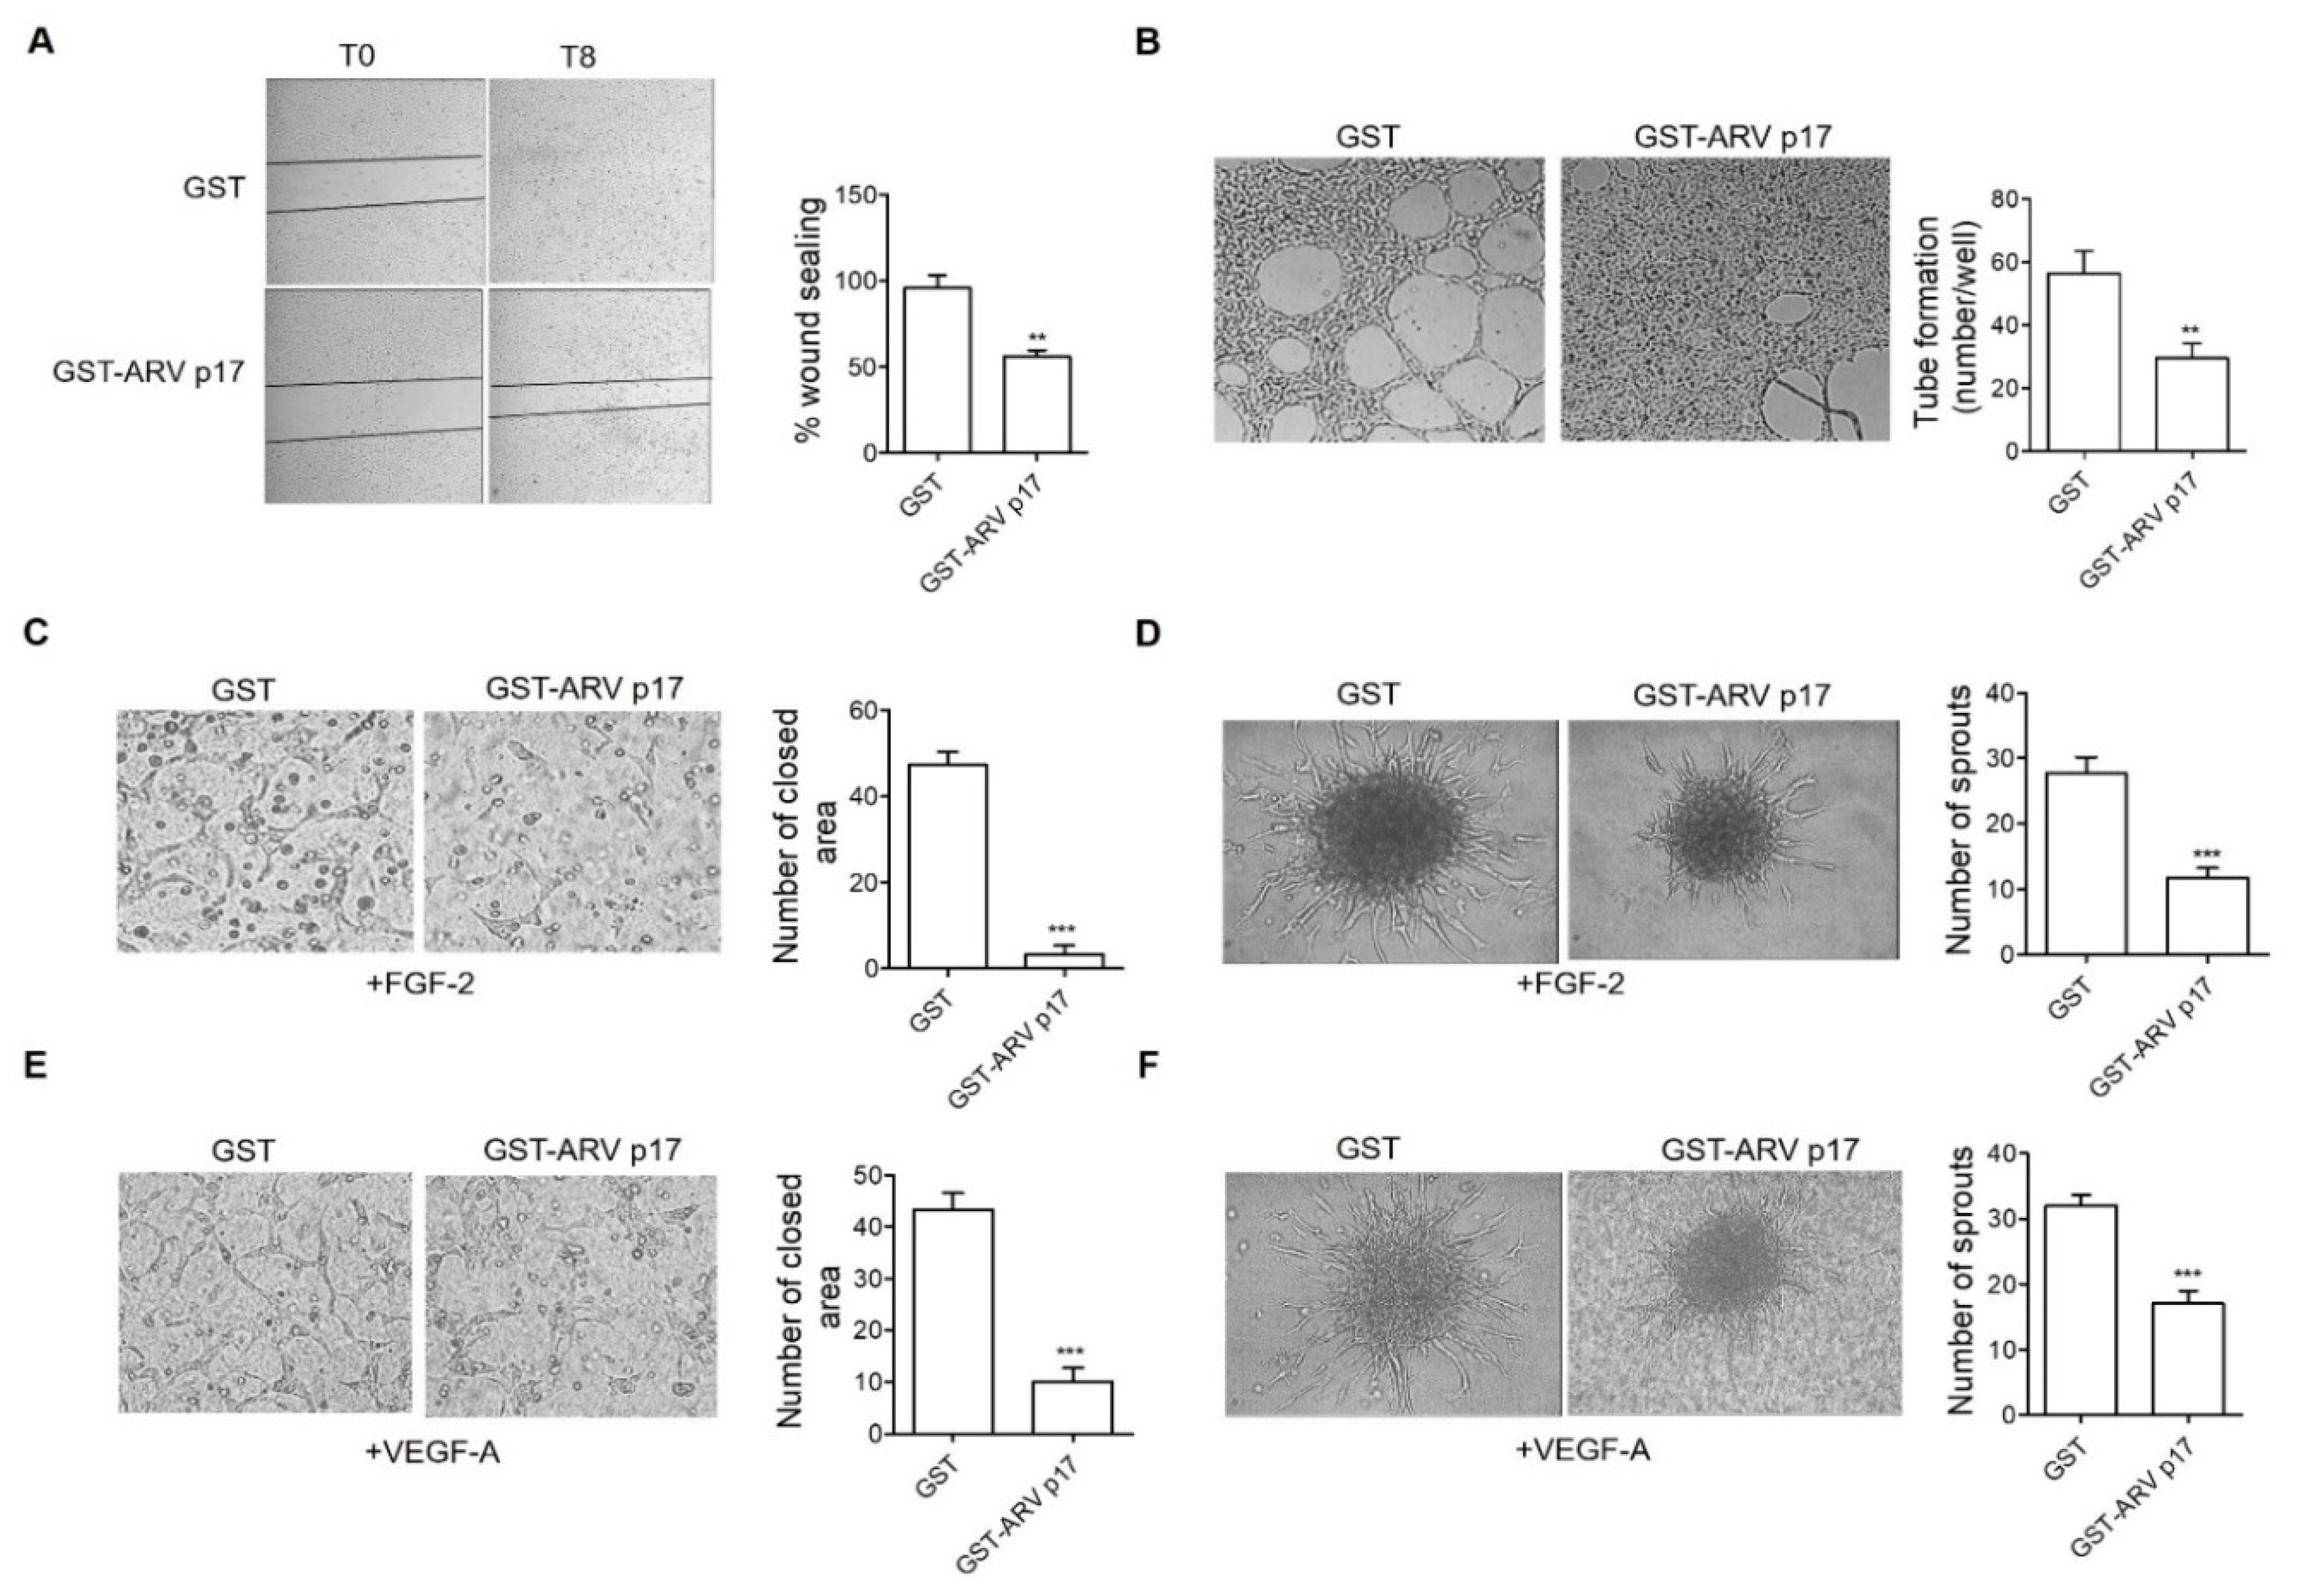
3.4. Recombinant GST-ARV p17 Inhibits Angiogenesis In Vitro, Ex Vivo and In Vivo
3.5. ARV p17 Upregulates the Antiangiogenic Factor DPP4 in HUVECs
3.6. DPP4 Mediates the Antiangiogenic Activity of ARV p17
4. Discussion
5. Conclusions
Supplementary Materials
Author Contributions
Funding
Institutional Review Board Statement
Informed Consent Statement
Conflicts of Interest
References
- Lu, H.; Tang, Y.; Dunn, P.A.; Wallner-Pendleton, E.A.; Lin, L.; Knoll, E.A. Isolation and molecular characterization of newly emerging avian reovirus variants and novel strains in Pennsylvania, USA, 2011–2014. Sci. Rep. 2015, 5, 14727. [Google Scholar] [CrossRef] [PubMed]
- Spandidos, D.A.; Graham, A.F. Physical and chemical characterization of an avian reovirus. J. Virol. 1976, 19, 968–976. [Google Scholar] [CrossRef] [PubMed]
- Bodelón, G.; Labrada, L.; Martínez-Costas, J.; Benavente, J. The Avian Reovirus Genome Segment S1 Is a Functionally Tricistronic Gene That Expresses One Structural and Two Nonstructural Proteins in Infected Cells. Virology 2001, 290, 181–191. [Google Scholar] [CrossRef]
- Costas, C.; Martínez-Costas, J.; Bodelón, G.; Benavente, J. The Second Open Reading Frame of the Avian Reovirus S1 Gene Encodes a Transcription-Dependent and CRM1-Independent Nucleocytoplasmic Shuttling Protein. J. Virol. 2005, 79, 2141–2150. [Google Scholar] [CrossRef][Green Version]
- Liu, H.-J.; Lin, P.-Y.; Lee, J.-W.; Hsu, H.-Y.; Shih, W.-L. Retardation of cell growth by avian reovirus p17 through the activation of p53 pathway. Biochem. Biophys. Res. Commun. 2005, 336, 709–715. [Google Scholar] [CrossRef]
- Huang, W.-R.; Chi, P.-I.; Chiu, H.-C.; Hsu, J.-L.; Nielsen, B.L.; Liao, T.-L.; Liu, H.J. Avian reovirus p17 and σA act cooperatively to downregulate Akt by suppressing mTORC2 and CDK2/cyclin A2 and upregulating proteasome PSMB6. Sci. Rep. 2017, 7, 1–19. [Google Scholar] [CrossRef]
- Li, C.; Wei, H.; Yu, L.; Duan, S.; Cheng, J.; Yan, W.; Zhang, X.; Wu, Y. Nuclear localization of the p17 protein of avian reovirus is correlated with autophagy induction and an increase in viral replication. Arch. Virol. 2015, 160, 3001–3010. [Google Scholar] [CrossRef]
- Chi, P.I.; Huang, W.R.; Lai, I.; Cheng, C.Y.; Liu, H.J. The p17 Nonstructural Protein of Avian Reovirus Triggers Autophagy Enhancing Virus Replication via Activation of Phosphatase and Tensin Deleted on Chromosome 10 (PTEN) and AMP-activated Protein Kinase (AMPK), as well as dsRNA-dependent Protein Kinase (PKR)/eIF2α Signaling Pathways. J. Biol. Chem. 2013, 288, 3571–3584. [Google Scholar] [CrossRef]
- Huang, W.R.; Chiu, H.C.; Liao, T.L.; Chuang, K.P.; Shih, W.L.; Liu, H.J. Avian reovirus protein p17 functions as a nucleoporin Tpr suppressor leading to activation of p53, p21 and PTEN and inactivation of PI3K/AKT/mTOR and ERK signaling pathways. PLoS ONE 2015, 10, e0133699. [Google Scholar] [CrossRef]
- Chiu, H.-C.; Huang, W.-R.; Liao, T.-L.; Chi, P.-I.; Nielsen, B.L.; Liu, J.-H.; Liu, H.-J. Mechanistic insights into avian reovirus p17-modulated suppression of cell cycle CDK–cyclin complexes and enhancement of p53 and cyclin H interaction. J. Biol. Chem. 2018, 293, 12542–12562. [Google Scholar] [CrossRef]
- Malumbres, M.; Barbacid, M. Cell cycle kinases in cancer. Curr. Opin. Genet. Dev. 2007, 17, 60–65. [Google Scholar] [CrossRef] [PubMed]
- Chiu, H.-C.; Huang, W.-R.; Liao, T.-L.; Wu, H.-Y.; Munir, M.; Shih, W.-L.; Liu, H.J. Suppression of Vimentin Phosphorylation by the Avian Reovirus p17 through Inhibition of CDK1 and Plk1 Impacting the G2/M Phase of the Cell Cycle. PLoS ONE 2016, 11, e0162356. [Google Scholar] [CrossRef] [PubMed]
- Sherwood, L.M.; Parris, E.E.; Folkman, J. Tumor Angiogenesis: Therapeutic Implications. N. Engl. J. Med. 1971, 285, 1182–1186. [Google Scholar] [CrossRef] [PubMed]
- Caccuri, F.; Ronca, R.; Laimbacher, A.S.; Berenzi, A.; Steimberg, N.; Campilongo, F.; Mazzuca, P.; Giacomini, A.; Mazzoleni, G.; Benetti, A.; et al. U94 of human herpesvirus 6 down-modulates Src, promotes a partial mesenchymal-to-epithelial transition and inhibits tumor cell growth, invasion and metastasis. Oncotarget 2017, 8, 44533–44549. [Google Scholar] [CrossRef] [PubMed][Green Version]
- Saudan, P.; Vlach, J.; Beard, P. Inhibition of S-phase progression by adeno-associated virus Rep78 protein is mediated by hypophosphorylated pRb. EMBO J. 2000, 19, 4351–4361. [Google Scholar] [CrossRef] [PubMed]
- Heilman, D.W.; Teodoro, J.G.; Green, M.R. Apoptin Nucleocytoplasmic Shuttling Is Required for Cell Type-Specific Localization, Apoptosis, and Recruitment of the Anaphase-Promoting Complex/Cyclosome to PML Bodies. J. Virol. 2006, 80, 7535–7545. [Google Scholar] [CrossRef] [PubMed]
- Wang, Q.; Yuan, X.; Chen, Y.; Zheng, Q.; Xu, L.; Wu, Y. Endoplasmic Reticulum Stress Mediated MDRV p10.8 Protein-Induced Cell Cycle Arrest and Apoptosis Through the PERK/eIF2α Pathway. Front. Microbiol. 2018, 9, 1327. [Google Scholar] [CrossRef]
- Li, M.-L.; Stollar, V. ALPHAVIRUSES AND APOPTOSIS. Int. Rev. Immunol. 2004, 23, 7–24. [Google Scholar] [CrossRef]
- Caruso, A.; Caselli, E.; Fiorentini, S.; Rotola, A.; Prandini, A.; Garrafa, E.; Saba, E.; Alessandri, G.; Cassai, E.; Di Luca, D. U94 of human herpesvirus 6 inhibits in vitro angiogenesis and lymphangiogenesis. Proc. Natl. Acad. Sci. USA 2009, 106, 20446–20451. [Google Scholar] [CrossRef]
- Wang, J.; Wang, J.; Dai, J.; Jung, Y.; Wei, C.-L.; Wang, Y.; Havens, A.M.; Hogg, P.J.; Keller, E.T.; Pienta, K.J.; et al. A Glycolytic Mechanism Regulating an Angiogenic Switch in Prostate Cancer. Cancer Res. 2007, 67, 149–159. [Google Scholar] [CrossRef]
- Liang, Z.; Brooks, J.; Willard, M.; Liang, K.; Yoon, Y.; Kang, S.; Shim, H. CXCR4/CXCL12 axis promotes VEGF-mediated tumor angiogenesis through Akt signaling pathway. Biochem. Biophys. Res. Commun. 2007, 359, 716–722. [Google Scholar] [CrossRef] [PubMed]
- Shi, Y.; Riese II, D.J.; Shen, J. The role of the CXCL12/CXCR4/CXCR7 chemokine axis in cancer. Front. Pharmacol. 2020, 11, 574667. [Google Scholar] [CrossRef] [PubMed]
- Caruso, A.; Favilli, F.; Rotola, A.; Comar, M.; Horejsh, D.; Alessandri, G.; Grassi, M.; Di Luca, D.; Fiorentini, S. Human herpesvirus-6 modulates RANTES production in primary human endothelial cell cultures. J. Med Virol. 2003, 70, 451–458. [Google Scholar] [CrossRef] [PubMed]
- Caccuri, F.; Giagulli, C.; Bugatti, A.; Benetti, A.; Alessandri, G.; Ribatti, D.; Marsico, S.; Apostoli, P.; Slevin, M.A.; Rusnati, M.; et al. HIV-1 matrix protein p17 promotes angiogenesis via chemokine receptors CXCR1 and CXCR2. Proc. Natl. Acad. Sci. USA 2012, 109, 14580–14585. [Google Scholar] [CrossRef]
- Ronca, R.; Benzoni, P.; Leali, D.; Urbinati, C.; Belleri, M.; Corsini, M.; Alessi, P.; Coltrini, D.; Calza, S.; Presta, M.; et al. Antiangiogenic Activity of a Neutralizing Human Single-Chain Antibody Fragment against Fibroblast Growth Factor Receptor 1. Mol. Cancer Ther. 2010, 9, 3244–3253. [Google Scholar] [CrossRef]
- Mitola, S.; Moroni, E.; Ravelli, C.; Andrés, G.; Belleri, M.; Presta, M. Angiopoietin-1 mediates the proangiogenic activity of the bone morphogenic protein antagonist Drm. Blood 2008, 112, 1154–1157. [Google Scholar] [CrossRef]
- Laib, A.M.; Bartol, A.; Alajati, A.; Korff, T.; Weber, H.; Augustin, H.G. Spheroid-based human endothelial cell microvessel formation in vivo. Nat. Protoc. 2009, 4, 1202–1215. [Google Scholar] [CrossRef]
- Arscott, W.T.; LaBauve, A.E.; May, V.; Wesley, U.V. Suppression of neuroblastoma growth by dipeptidyl peptidase IV: Relevance of chemokine regulation and caspase activation. Oncogene 2008, 28, 479–491. [Google Scholar] [CrossRef]
- Dempke, W.C.; Heinemann, V. Resistance to EGF-R (erbB-1) and VEGF-R modulating agents. Eur. J. Cancer 2009, 45, 1117–1128. [Google Scholar] [CrossRef]
- Ferrara, N. VEGF and the quest for tumour angiogenesis factors. Nat. Rev. Cancer 2002, 2, 795–803. [Google Scholar] [CrossRef]
- Huang, J.; Frischer, J.S.; Serur, A.; Kadenhe, A.; Yokoi, A.; McCrudden, K.W.; New, T.; O’Toole, K.; Zabski, S.; Rudge, J.S.; et al. Regression of established tumors and metastases by potent vascular endothelial growth factor blockade. Proc. Natl. Acad. Sci. USA 2003, 100, 7785–7790. [Google Scholar] [CrossRef] [PubMed]
- De Bock, K.; Mazzone, M.; Carmeliet, P. Antiangiogenic therapy, hypoxia, and metastasis: Risky liaisons, or not? Nat. Rev. Clin. Oncol. 2011, 8, 393–404. [Google Scholar] [CrossRef] [PubMed]
- Zubilewicz, A.; Hecquet, C.; Jeanny, J.-C.; Soubrane, G.; Courtois, Y.; Mascarelli, F. Two distinct signalling pathways are involved in FGF2-stimulated proliferation of choriocapillary endothelial cells: A comparative study with VEGF. Oncogene 2001, 20, 1403–1413. [Google Scholar] [CrossRef]
- Casanovas, O.; Hicklin, D.J.; Bergers, G.; Hanahan, D. Drug resistance by evasion of antiangiogenic targeting of VEGF signaling in late-stage pancreatic islet tumors. Cancer Cell 2005, 8, 299–309. [Google Scholar] [CrossRef] [PubMed]
- Gacche, R.N. Compensatory angiogenesis and tumor refractoriness. Oncogenesis 2015, 4, e153. [Google Scholar] [CrossRef]
- Babina, I.S.; Turner, N.C. Advances and challenges in targeting FGFR signalling in cancer. Nat. Rev. Cancer 2017, 5, 318–332. [Google Scholar] [CrossRef]
- Garber, K. Angiogenesis inhibitors suffer new setback. Nat. Biotechnol. 2002, 20, 1067–1068. [Google Scholar] [CrossRef]
- Pamela, N.H.D.; Havre, A.; Abe, M.; Urasaki, Y.; Ohnuma, K.; Morimoto, C. The role of CD26/dipeptidyl peptidase IV in cancer. Front. Biosci. 2008, 13, 1634–1645. [Google Scholar]
- Cordero, O.J.; Salgado, F.J.; Nogueira, M. On the origin of serum CD26 and its altered concentration in cancer patients. Cancer Immunol. Immunother. 2009, 58, 1723–1747. [Google Scholar] [CrossRef]
- Erić-Nikolić, A.; Matić, I.Z.; Dordević, M.; Milovanović, Z.; Marković, I.; Džodić, R.; Inić, M.; Srdić-Rajić, T.; Jevrić, M.; Gavrilović, D.; et al. Serum DPPIV activity and CD26 expression on lymphocytes in patients with benign or malignant breast tumors. Immunobiology 2011, 216, 942–946. [Google Scholar] [CrossRef]
- Beckenkamp, A.; Willig, J.B.; Santana, D.B.; Nascimento, J.; Paccez, J.D.; Zerbini, L.F.; Bruno, A.N.; Pilger, D.A.; Wink, M.R.; Buffon, A. Differential Expression and Enzymatic Activity of DPPIV/CD26 Affects Migration Ability of Cervical Carcinoma Cells. PLoS ONE 2015, 10, e0134305. [Google Scholar] [CrossRef] [PubMed]
- Nargis, T.; Kumar, K.; Ghosh, A.R.; Sharma, A.; Rudra, D.; Sen, D.; Chakrabarti, S.; Mukhopadhyay, S.; Ganguly, D.; Chakrabarti, P. KLK5 induces shedding of DPP4 from circulatory Th17 cells in type 2 diabetes. Mol. Metab. 2017, 6, 1529–1539. [Google Scholar] [CrossRef] [PubMed]
- Röhrborn, D.; Eckel, J.; Sell, H. Shedding of dipeptidyl peptidase 4 is mediated by metalloproteases and up-regulated by hypoxia in human adipocytes and smooth muscle cells. FEBS Lett. 2014, 588, 3870–3877. [Google Scholar] [CrossRef] [PubMed]
- Lambeir, A.-M.; Durinx, C.; Scharpé, S.; De Meester, I. Dipeptidyl-Peptidase IV from Bench to Bedside: An Update on Structural Properties, Functions, and Clinical Aspects of the Enzyme DPP IV. Crit. Rev. Clin. Lab. Sci. 2003, 40, 209–294. [Google Scholar] [CrossRef]
- Lambeir, A.-M.; Proost, P.; Durinx, C.; Bal, G.; Senten, K.; Augustyns, K.; Scharpé, S.; Van Damme, J.; De Meester, I. Kinetic Investigation of Chemokine Truncation by CD26/Dipeptidyl Peptidase IV Reveals a Striking Selectivity within the Chemokine Family. J. Biol. Chem. 2001, 276, 29839–29845. [Google Scholar] [CrossRef]
- Beckenkamp, A.; Davies, S.; Willig, J.B.; Buffon, A. DPPIV/CD26: A tumor suppressor or a marker of malignancy? Tumor Biol. 2016, 37, 7059–7073. [Google Scholar] [CrossRef]
- Sun, Y.X.; Pedersen, E.A.; Shiozawa, Y.; Havens, A.M.; Jung, Y.; Wang, J.; Pienta, K.J.; Taichman, R.S. CD26/dipeptidyl peptidase IV regulates prostate cancer metastasis by degrading SDF-1/CXCL12. Clin. Exp. Metastasis 2008, 25, 765–776. [Google Scholar] [CrossRef]
- Wesley, U.V.; Tiwari, S.; Houghton, A.N. Role for dipeptidyl peptidase IV in tumor suppression of human non small cell lung carcinoma cells. Int. J. Cancer 2004, 109, 855–866. [Google Scholar] [CrossRef]
- Kajiyama, H.; Shibata, K.; Terauchi, M.; Ino, K.; Nawa, A.; Kikkawa, F. Involvement of DPPIV/CD26 in Epithelial Morphology and Suppressed Invasive Ability in Ovarian Carcinoma Cells. Ann. N. Y. Acad. Sci. 2006, 1086, 233–240. [Google Scholar] [CrossRef]
- Yang, F.; Takagaki, Y.; Yoshitomi, Y.; Ikeda, T.; Li, J.; Kitada, M.; Kumagai, A.; Kawakita, E.; Shi, S.; Kanasaki, K.; et al. Inhibition of dipeptidyl peptidase-4 accelerates epithelial–mesenchymal transition and breast cancer metastasis via the CXCL12/CXCR4/mTOR axis. Cancer Res. 2019, 79, 735–746. [Google Scholar] [CrossRef]
- Narducci, M.G.; Scala, E.; Bresin, A.; Caprini, E.; Picchio, M.C.; Remotti, D.; Ragone, G.; Nasorri, F.; Frontani, M.; Arcelli, D.; et al. Skin homing of Sézary cells involves SDF-1-CXCR4 signaling and down-regulation of CD26/dipeptidylpeptidase IV. Blood 2006, 107, 1108–1115. [Google Scholar] [CrossRef] [PubMed]
- Lefort, É.C.; Blay, J. The dietary flavonoid apigenin enhances the activities of the anti-metastatic protein CD26 on human colon carcinoma cells. Clin. Exp. Metastasis 2011, 28, 337–349. [Google Scholar] [CrossRef] [PubMed]
- Proost, P.; Struyf, S.; Schols, D.; Durinx, C.; Wuyts, A.; Lenaerts, J.-P.; De Clercq, E.; De Meester, I.; Van Damme, J. Processing by CD26/dipeptidyl-peptidase IV reduces the chemotactic and anti-HIV-1 activity of stromal-cell-derived factor-1α. FEBS Lett. 1998, 432, 73–76. [Google Scholar] [CrossRef]
- Shioda, T.; Kato, H.; Ohnishi, Y.; Tashiro, K.; Ikegawa, M.; Nakayama, E.E.; Hu, H.; Kato, A.; Sakai, Y.; Liu, H.; et al. Anti-HIV-1 and chemotactic activities of human stromal cell-derived factor 1 (SDF-1 ) and SDF-1 are abolished by CD26/dipeptidyl peptidase IV-mediated cleavage. Proc. Natl. Acad. Sci. USA 1998, 95, 6331–6336. [Google Scholar] [CrossRef]
- Bušek, P.; Stremenová, J.; Sromova, L.; Hilser, M.; Balaziova, E.; Kosek, D.; Trylcova, J.; Strnad, H.; Krepela, E.; Šedo, A. Dipeptidyl peptidase-IV inhibits glioma cell growth independent of its enzymatic activity. Int. J. Biochem. Cell Biol. 2012, 44, 738–747. [Google Scholar] [CrossRef]
- Mizokami, Y.; Kajiyama, H.; Shibata, K.; Ino, K.; Kikkawa, F.; Mizutani, S. Stromal cell-derived factor-1?-induced cell proliferation and its possible regulation by CD26/dipeptidyl peptidase IV in endometrial adenocarcinoma. Int. J. Cancer 2004, 110, 652–659. [Google Scholar] [CrossRef]
- Kikkawa, F.; Kajiyama, H.; Shibata, K.; Ino, K.; Nomura, S.; Mizutani, S. Dipeptidyl peptidase IV in tumor progression. Biochim. Biophys. Acta BBA Proteins Proteom. 2005, 1751, 45–51. [Google Scholar] [CrossRef]
- Wesley, U.V.; McGroarty, M.; Homoyouni, A. Dipeptidyl peptides inhibits malignant phenotype of prostate cancer cells by blocking basic fibroblast growth factor signaling pathway. Cancer Res. 2005, 65, 1325–1334. [Google Scholar] [CrossRef]


Publisher’s Note: MDPI stays neutral with regard to jurisdictional claims in published maps and institutional affiliations. |
© 2021 by the authors. Licensee MDPI, Basel, Switzerland. This article is an open access article distributed under the terms and conditions of the Creative Commons Attribution (CC BY) license (http://creativecommons.org/licenses/by/4.0/).
Share and Cite
Manocha, E.; Bugatti, A.; Belleri, M.; Zani, A.; Marsico, S.; Caccuri, F.; Presta, M.; Caruso, A. Avian Reovirus P17 Suppresses Angiogenesis by Promoting DPP4 Secretion. Cells 2021, 10, 259. https://doi.org/10.3390/cells10020259
Manocha E, Bugatti A, Belleri M, Zani A, Marsico S, Caccuri F, Presta M, Caruso A. Avian Reovirus P17 Suppresses Angiogenesis by Promoting DPP4 Secretion. Cells. 2021; 10(2):259. https://doi.org/10.3390/cells10020259
Chicago/Turabian StyleManocha, Ekta, Antonella Bugatti, Mirella Belleri, Alberto Zani, Stefania Marsico, Francesca Caccuri, Marco Presta, and Arnaldo Caruso. 2021. "Avian Reovirus P17 Suppresses Angiogenesis by Promoting DPP4 Secretion" Cells 10, no. 2: 259. https://doi.org/10.3390/cells10020259
APA StyleManocha, E., Bugatti, A., Belleri, M., Zani, A., Marsico, S., Caccuri, F., Presta, M., & Caruso, A. (2021). Avian Reovirus P17 Suppresses Angiogenesis by Promoting DPP4 Secretion. Cells, 10(2), 259. https://doi.org/10.3390/cells10020259