
Gene Expression Profiles of Multiple Synchronous Lesions in Lung Adenocarcinoma

 , , , and
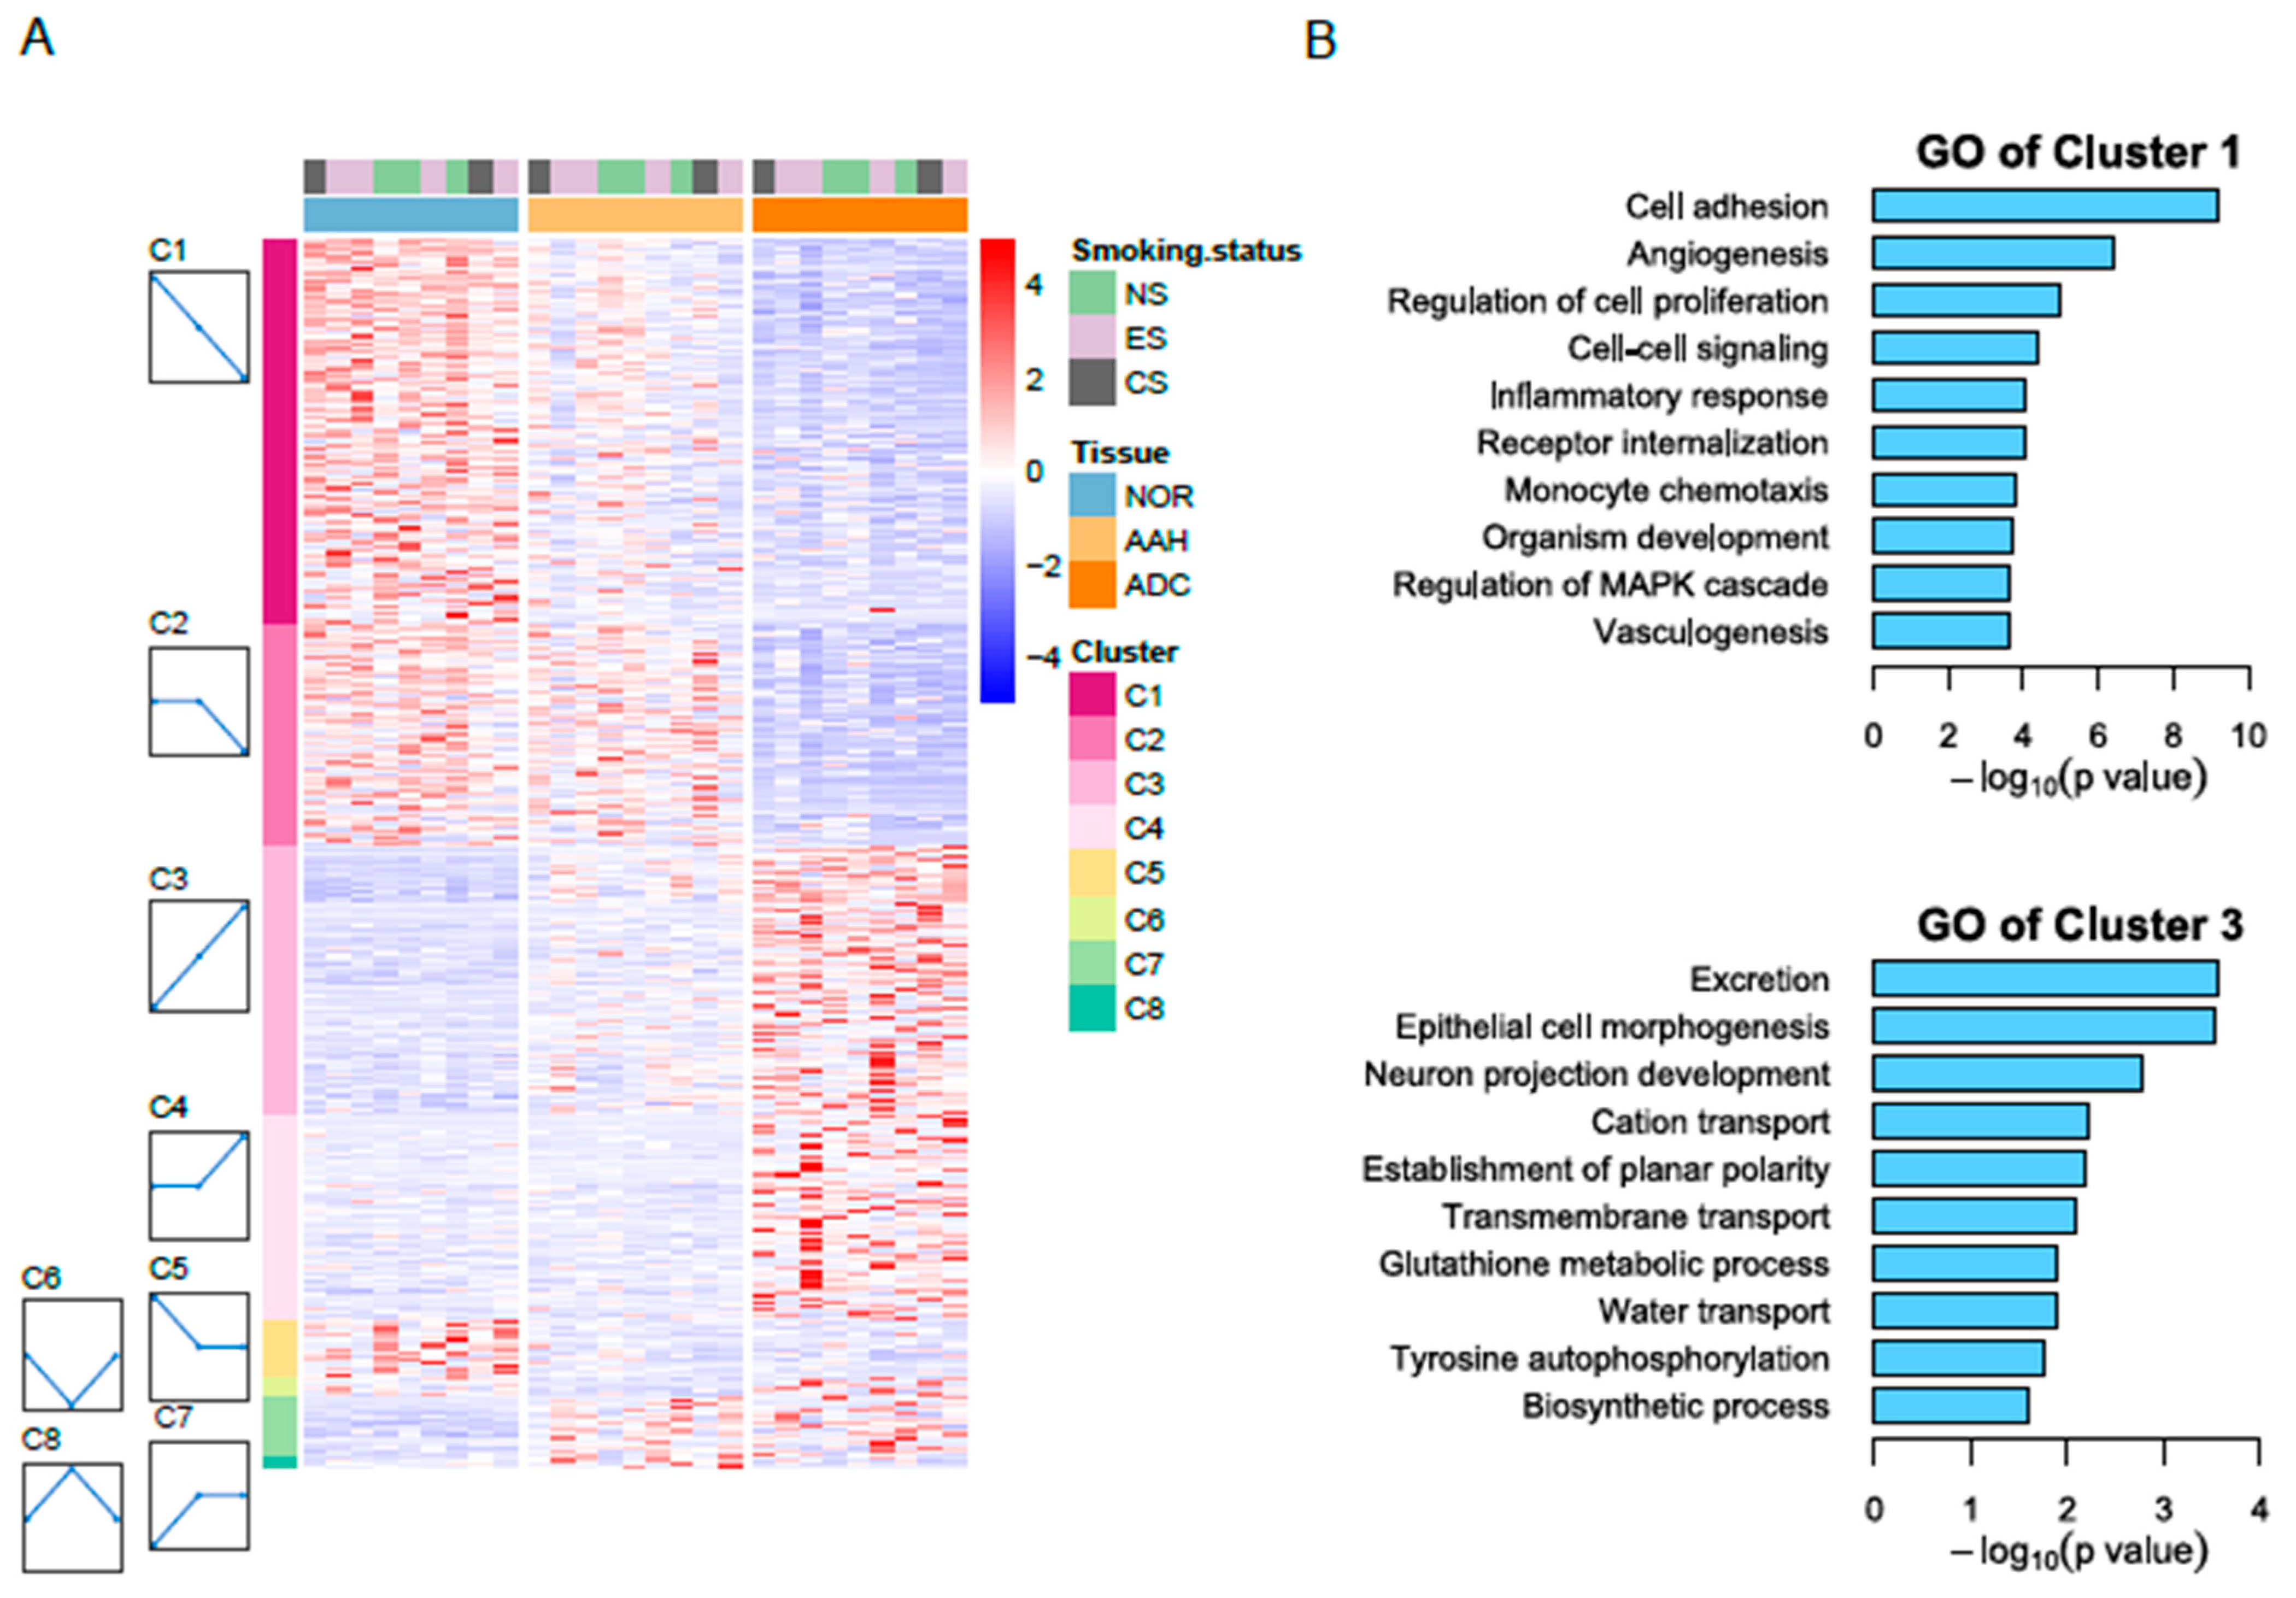
Abstract
:1. Introduction
2. Materials and Methods
2.1. Patients and Specimen Procurement
2.2. Sample Preparation
2.3. RNA-seq Processing
2.4. Statistical Analysis
2.5. Validation of RNA-seq Results with Quantitative PCR
2.6. Immunohistochemistry Analysis
2.7. Immune Signature Analysis and Immune-Related Transcriptome Profiles
3. Results
3.1. RNA-seq Analysis of Tumor Samples from Lung Adenocarcinoma Patients
3.2. Identification of Differentially Expressed Genes
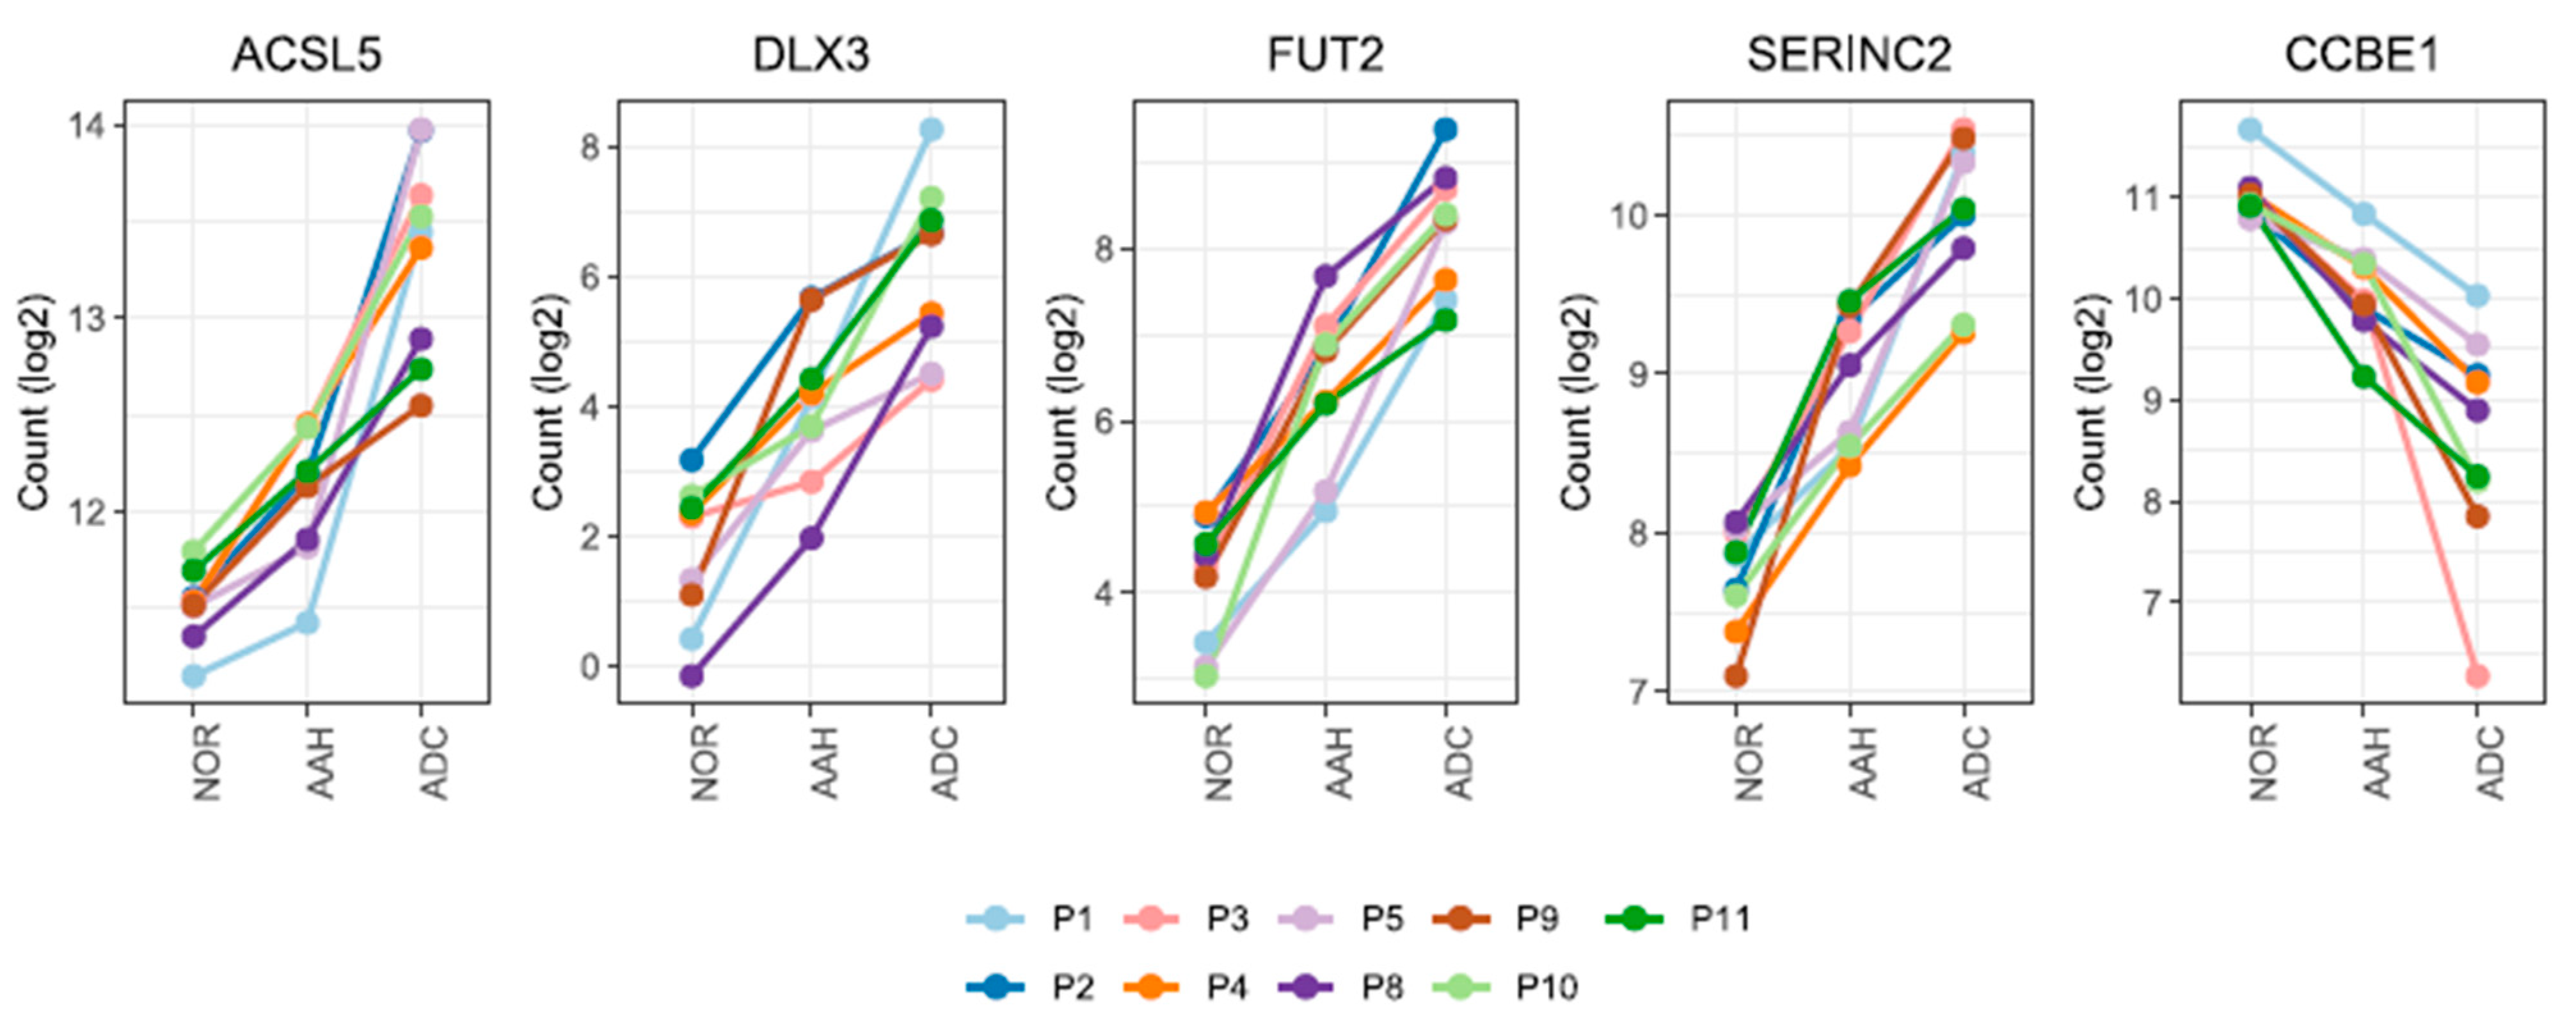
3.3. Candidate Genes with Linear Changes across Tumor Lesions and Validation of Candidate Genes by qPCR and Immunohistochemistry
3.4. Gene Expression Profiles of BRAF and KRAS Genomic Mutations in AAH
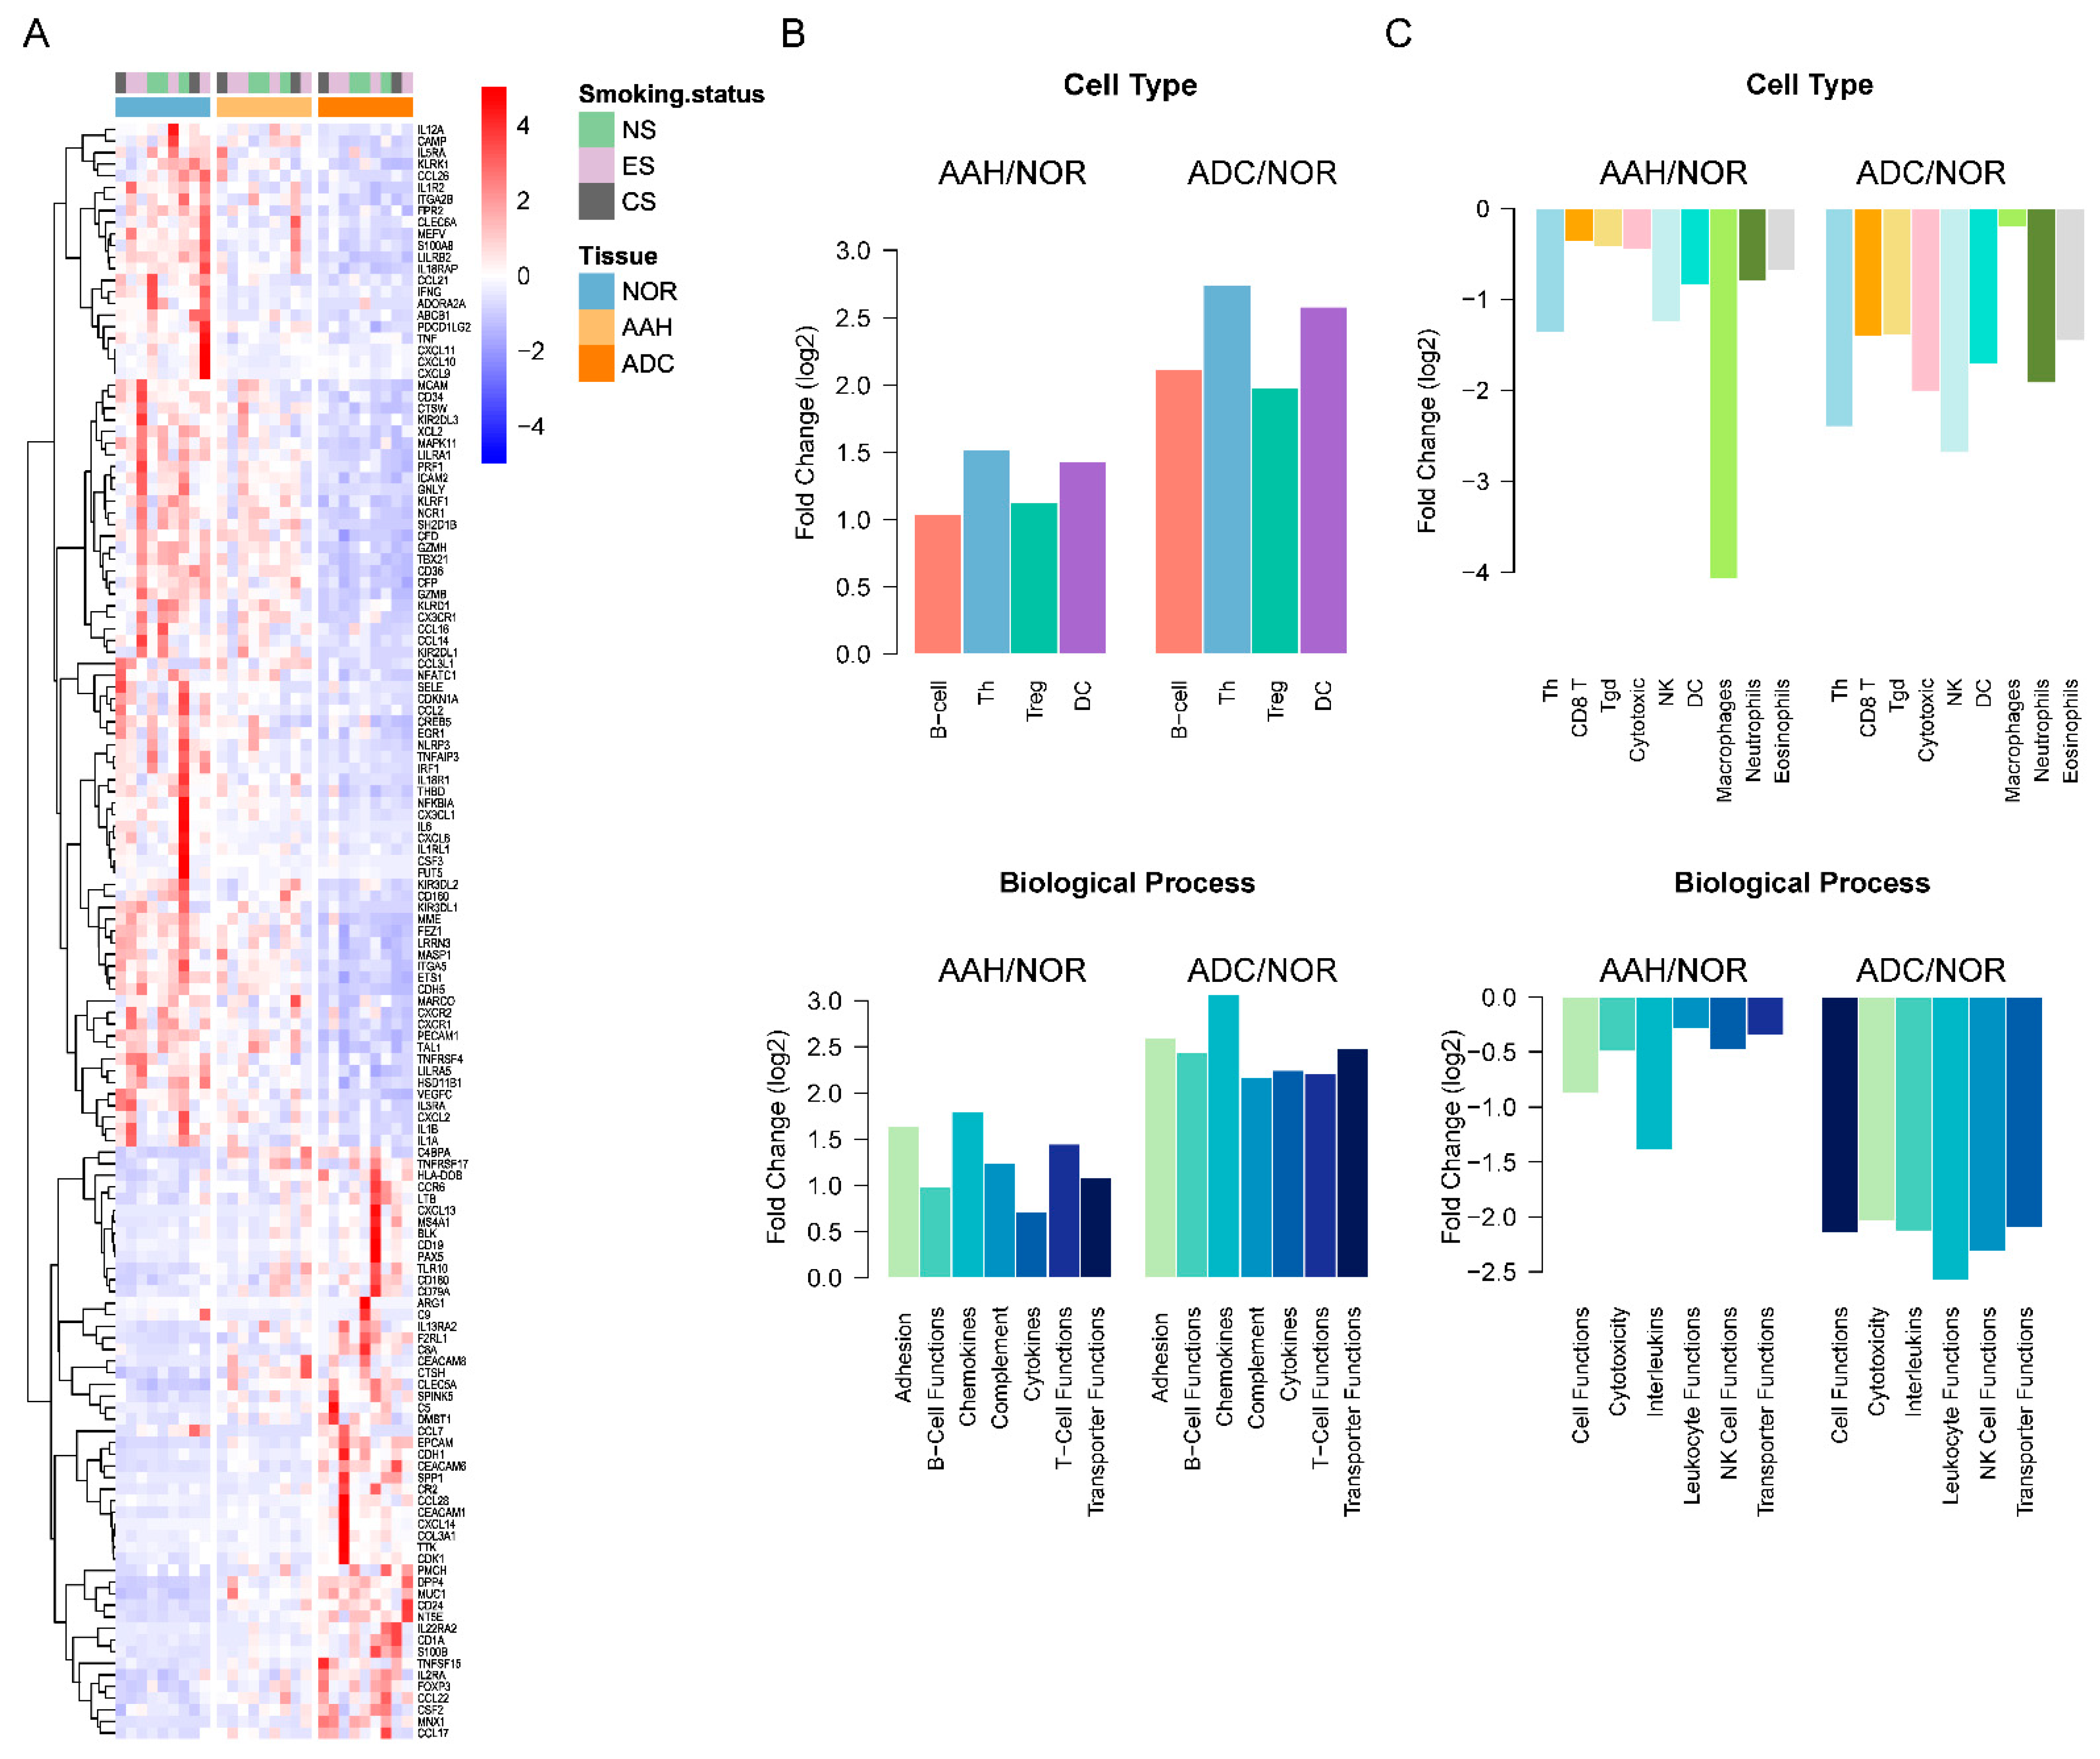
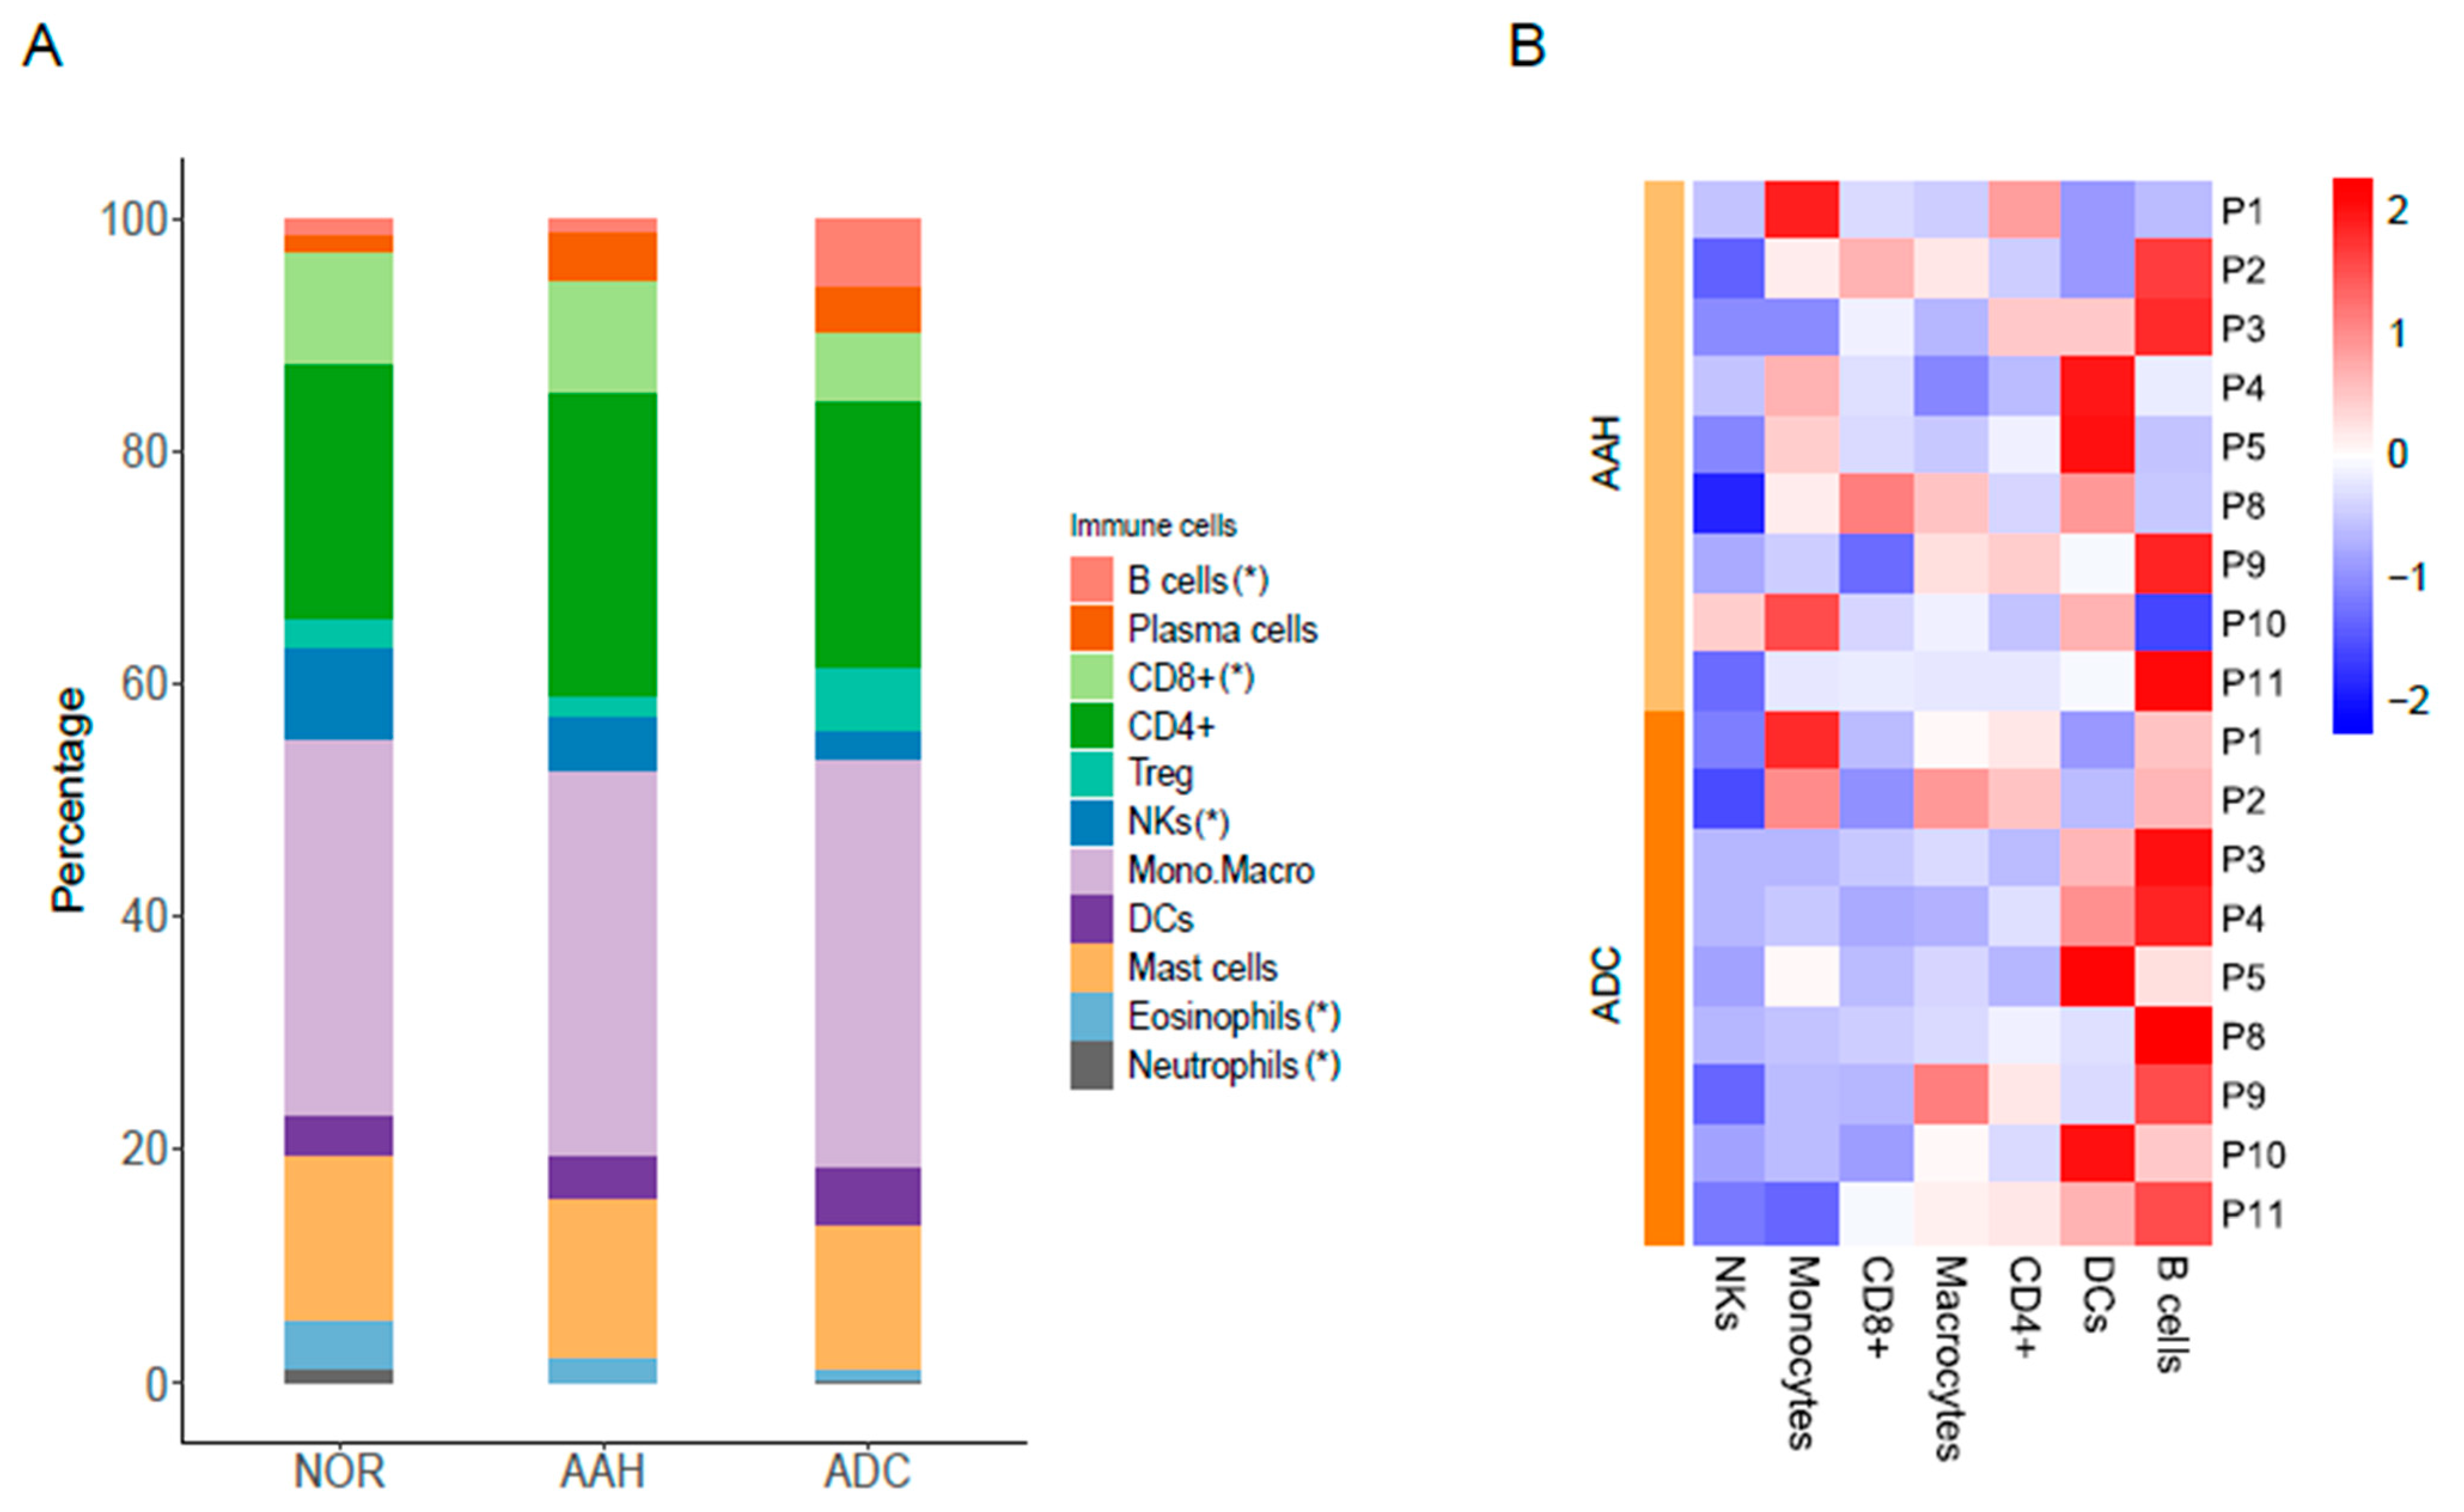
3.5. Estimated Immune Response in Multiple Lesions
4. Discussion
Supplementary Materials
Author Contributions
Funding
Institutional Review Board Statement
Informed Consent Statement
Data Availability Statement
Conflicts of Interest
References
- Vogelstein, B.; Papadopoulos, N.; Velculescu, V.E.; Zhou, S.; Diaz, L.A., Jr.; Kinzler, K.W. Cancer genome landscapes. Science 2013, 339, 1546–1558. [Google Scholar] [CrossRef]
- Herbst, R.S.; Morgensztern, D.; Boshoff, C. The biology and management of non-small cell lung cancer. Nature 2018, 553, 446–454. [Google Scholar] [CrossRef]
- Yatabe, Y.; Borczuk, A.C.; Powell, C.A. Do all lung adenocarcinomas follow a stepwise progression? Lung Cancer 2011, 74, 7–11. [Google Scholar] [CrossRef] [Green Version]
- Lantuejoul, S.; Salameire, D.; Salon, C.; Brambilla, E. Pulmonary preneoplasia—Sequential molecular carcinogenetic events. Histopathology 2009, 54, 43–54. [Google Scholar] [CrossRef] [PubMed]
- Noguchi, M. Stepwise progression of pulmonary adenocarcinoma—Clinical and molecular implications. Cancer Metastasis Rev. 2010, 29, 15–21. [Google Scholar] [CrossRef] [PubMed]
- Chapman, A.; Kerr, K. The association between atypical adenomatous hyperplasia and primary lung cancer. Br. J. Cancer 2000, 83, 632–636. [Google Scholar] [CrossRef] [Green Version]
- Chung, J.H.; Choe, G.; Jheon, S.; Sung, S.-W.; Kim, T.J.; Lee, K.W.; Lee, J.H.; Lee, C.T. Epidermal growth factor receptor mutation and pathologic-radiologic correlation between multiple lung nodules with ground-glass opacity differentiates multicentric origin from intrapulmonary spread. J. Thorac. Oncol. 2009, 4, 1490–1495. [Google Scholar] [CrossRef] [PubMed] [Green Version]
- Park, E.; Ahn, S.; Kim, H.; Park, S.Y.; Lim, J.; Kwon, H.J.; Han, Y.B.; Lee, C.-T.; Cho, S.; Chung, J.-H. Targeted sequencing analysis of pulmonary adenocarcinoma with multiple synchronous ground-glass/lepidic nodules. J. Thorac. Oncol. 2018, 13, 1776–1783. [Google Scholar] [CrossRef] [Green Version]
- Izumchenko, E.; Chang, X.; Brait, M.; Fertig, E.; Kagohara, L.T.; Bedi, A.; Marchionni, L.; Agrawal, N.; Ravi, R.; Jones, S.; et al. Targeted sequencing reveals clonal genetic changes in the progression of early lung neoplasms and paired circulating DNA. Nat. Commun. 2015, 6, 8258. [Google Scholar] [CrossRef]
- Sivakumar, S.; Lucas, F.A.S.; McDowell, T.L.; Lang, W.; Xu, L.; Fujimoto, J.; Zhang, J.; Futreal, P.A.; Fukuoka, J.; Yatabe, Y.; et al. Genomic landscape of atypical adenomatous hyperplasia reveals divergent modes to lung adenocarcinoma. Cancer Res. 2017, 77, 6119–6130. [Google Scholar] [CrossRef] [Green Version]
- Xu, X.; Li, N.; Zhao, R.; Zhu, L.; Shao, J.; Zhang, J. Targeted next-generation sequencing for analyzing the genetic alterations in atypical adenomatous hyperplasia and adenocarcinoma in situ. J. Cancer Res. Clin. Oncol. 2017, 143, 2447–2453. [Google Scholar] [CrossRef]
- Lu, Y.; Lemon, W.; Liu, P.Y.; Yi, Y.; Morrison, C.; Yang, P.; Sun, Z.; Szoke, J.; Gerald, W.L.; Watson, M.; et al. A gene expression signature predicts survival of patients with stage I non-small cell lung cancer. PLoS Med. 2006, 3, e467. [Google Scholar] [CrossRef] [PubMed]
- Seo, J.S.; Ju, Y.S.; Lee, W.C.; Shin, J.-Y.; Lee, J.K.; Yu, S.-B.; Kim, J.; Lee, E.-R.; Kang, C.-H.; Park, I.-K.; et al. The transcriptional landscape and mutational profile of lung adenocarcinoma. Genome Res. 2012, 22, 2109–2119. [Google Scholar] [CrossRef] [Green Version]
- Navab, R.; Strumpf, D.; Bandarchi, B.; Zhu, C.-Q.; Pintilie, M.; Ramnarine, V.R.; Ibrahimov, E.; Radulovich, N.; Leung, L.; Barczyk, M.; et al. Prognostic gene-expression signature of carcinoma-associated fibroblasts in non-small cell lung cancer. Proc. Natl. Acad. Sci. USA 2011, 108, 7160–7165. [Google Scholar] [CrossRef] [PubMed] [Green Version]
- Lavin, Y.; Kobayashi, S.; Leader, A.; Amir, E.A.D.; Elefant, N.; Bigenwald, C.; Remark, R.; Sweeney, R.; Becker, C.D.; Levine, J.H.; et al. Innate immune landscape in early lung adenocarcinoma by paired single-cell analyses. Cell 2017, 169, 750–765.e17. [Google Scholar] [CrossRef] [Green Version]
- Dejima, H.; Hu, X.; Chen, R.; Zhang, J.; Fujimoto, J.; Parra, E.R.; Haymaker, C.; Hubert, S.M.; Duose, D.; Solis, L.M.; et al. Immune evolution from preneoplasia to invasive lung adenocarcinomas and underlying molecular feature. Nat. Commun. 2021, 12, 2722. [Google Scholar] [CrossRef] [PubMed]
- Ahn, S.; Lim, J.; Park, S.Y.; Kim, H.; Kwon, H.J.; Han, Y.B.; Lee, C.-T.; Cho, S.; Chung, J.-H. Genetic alterations in preinvasive lung synchronous lesions. Cancer Res. Treat. 2020, 52, 1120–1134. [Google Scholar] [CrossRef]
- Anders, S.; Pyl, P.T.; Huber, W. HTSeq—A Python framework to work with high-throughput sequencing data. Bioinformatics 2015, 31, 166–169. [Google Scholar] [CrossRef]
- Love, M.I.; Huber, W.; Anders, S. Moderated estimation of fold change and dispersion for RNA-seq data with DESeq2. Genome Biol. 2014, 15, 550. [Google Scholar] [CrossRef] [Green Version]
- Ernst, J.; Bar-Joseph, Z. STEM: A tool for the analysis of short time series gene expression data. BMC Bioinform. 2006, 7, 191. [Google Scholar] [CrossRef] [Green Version]
- Kim, H.; Kwon, H.J.; Park, S.Y.; Park, Y.; Park, E.; Chung, J.-H. Clinicopathological analysis and prognostic significance of programmed cell death-ligand 1 protein and mRNA expression in non-small cell lung cancer. PLoS ONE 2018, 13, e0198634. [Google Scholar] [CrossRef] [PubMed]
- Gentles, A.J.; Newman, A.M.; Liu, C.L.; Bratman, S.V.; Feng, W.; Kim, D.; Nair, V.S.; Xu, Y.; Khuong, A.; Hoang, C.D.; et al. The prognostic landscape of genes and infiltrating immune cells across human cancers. Nat. Med. 2015, 21, 938–945. [Google Scholar] [CrossRef]
- Finotello, F.; Trajanoski, Z. Quantifying tumor-infiltrating immune cells from transcriptomics data. Cancer Immunol. Immunother. 2018, 67, 1031–1040. [Google Scholar] [CrossRef]
- Cesano, A. nCounter((R)) PanCancer immune profiling panel (NanoString Technologies, Inc., Seattle, WA). J. Immunother. Cancer 2015, 3, 42. [Google Scholar] [CrossRef] [PubMed] [Green Version]
- Pal, S.; Amin, P.J.; Sainis, K.B.; Shankar, B.S. Potential role of TRAIL in metastasis of mutant KRAS expressing lung adenocarcinoma. Cancer Microenviron. 2016, 9, 77–84. [Google Scholar] [CrossRef] [PubMed] [Green Version]
- Aran, D.; Camarda, R.; Odegaard, J.; Paik, H.; Oskotsky, B.; Krings, G.; Goga, A.; Sirota, M.; Butte, A.J. Comprehensive analysis of normal adjacent to tumor transcriptomes. Nat. Commun. 2017, 8, 1077. [Google Scholar] [CrossRef] [Green Version]
- Tang, Y.; Zhou, J.; Hooi, S.C.; Jiang, Y.-M.; Lu, G.-D. Fatty acid activation in carcinogenesis and cancer development: Essential roles of long-chain acyl-CoA synthetases. Oncol. Lett. 2018, 16, 1390–1396. [Google Scholar] [CrossRef] [PubMed] [Green Version]
- Chen, W.-C.; Wang, C.-Y.; Hung, Y.-H.; Weng, T.-Y.; Yen, M.-C.; Lai, M.-D. Systematic analysis of gene expression alterations and clinical outcomes for long-chain acyl-coenzyme A synthetase family in cancer. PLoS ONE 2016, 11, e0155660. [Google Scholar] [CrossRef] [Green Version]
- Zhou, W.; Ma, H.; Deng, G.; Tang, L.; Lu, J.; Chen, X. Clinical significance and biological function of fucosyltransferase 2 in lung adenocarcinoma. Oncotarget 2017, 8, 97246–97259. [Google Scholar] [CrossRef] [PubMed] [Green Version]
- Chen, C.Y.; Jan, Y.H.; Juan, Y.H.; Yang, C.J.; Huang, M.S.; Yu, C.J.; Yang, P.C.; Hsiao, M.; Hsu, T.L.; Wong, C.H. Fucosyltransferase 8 as a functional regulator of nonsmall cell lung cancer. Proc. Natl. Acad. Sci. USA 2013, 110, 630–635. [Google Scholar] [CrossRef] [Green Version]
- Tokuda, N.; Zhang, Q.; Yoshida, S.; Kusunoki, S.; Urano, T.; Furukawa, K.; Furukawa, K. Genetic mechanisms for the synthesis of fucosyl GM1 in small cell lung cancer cell lines. Glycobiology 2006, 16, 916–925. [Google Scholar] [CrossRef] [Green Version]
- Wu, K.; Zhang, X.; Li, F.; Xiao, D.; Hou, Y.; Zhu, S.; Liu, D.; Ye, X.; Ye, M.; Yang, J.; et al. Frequent alterations in cytoskeleton remodelling genes in primary and metastatic lung adenocarcinomas. Nat. Commun. 2015, 6, 10131. [Google Scholar] [CrossRef] [PubMed]
- Selamat, S.A.; Chung, B.S.; Girard, L.; Zhang, W.; Zhang, Y.; Campan, M.; Siegmund, K.D.; Koss, M.N.; Hagen, J.A.; Lam, W.L.; et al. Genome-scale analysis of DNA methylation in lung adenocarcinoma and integration with mRNA expression. Genome Res. 2012, 22, 1197–1211. [Google Scholar] [CrossRef] [PubMed] [Green Version]
- Okayama, H.; Kohno, T.; Ishii, Y.; Shimada, Y.; Shiraishi, K.; Iwakawa, R.; Furuta, K.; Tsuta, K.; Shibata, T.; Yamamoto, S.; et al. Identification of genes upregulated in ALK-positive and EGFR/KRAS/ALK-negative lung adenocarcinomas. Cancer Res. 2012, 72, 100–111. [Google Scholar] [CrossRef] [Green Version]
- Hou, J.; Aerts, J.; Den Hamer, B.; Van Ijcken, W.; Den Bakker, M.; Riegman, P.; van der Leest, C.; van der Spek, P.; Foekens, J.A.; Hoogsteden, H.C.; et al. Gene expression-based classification of non-small cell lung carcinomas and survival prediction. PLoS ONE 2010, 5, e10312. [Google Scholar] [CrossRef]
- Zeng, Y.; Xiao, D.; He, H.; He, J.; Pan, H.; Yang, W.; Chen, Y.; He, J. SERINC2-knockdown inhibits proliferation, migration and invasion in lung adenocarcinoma. Oncol. Lett. 2018, 16, 5916–5922. [Google Scholar] [CrossRef] [Green Version]
- Nie, M.; Yao, K.; Zhu, X.; Chen, N.; Xiao, N.; Wang, Y.; Peng, B.; Yao, L.; Li, P.; Zhang, P.; et al. Evolutionary metabolic landscape from preneoplasia to invasive lung adenocarcinoma. Nat. Commun. 2021, 12, 6479. [Google Scholar] [CrossRef]
- Li, D.; Wei, P.; Peng, Z.; Huang, C.; Tang, H.; Jia, Z.; Cui, J.; Le, X.; Huang, S.; Xie, K. The critical role of dysregulated FOXM1-PLAUR signaling in human colon cancer progression and metastasis. Clin. Cancer Res. 2013, 19, 62–72. [Google Scholar] [CrossRef] [Green Version]
- Cheng, B.; Xiong, S.; Li, C.; Liang, H.; Zhao, Y.; Li, J.; Shi, J.; Ou, L.; Chen, Z.; Liang, P.; et al. An annual review of the remarkable advances in lung cancer clinical research in 2019. J. Thorac. Dis. 2020, 12, 1056–1069. [Google Scholar] [CrossRef]
- Forde, P.M.; Chaft, J.E.; Smith, K.N.; Anagnostou, V.; Cottrell, T.R.; Hellmann, M.D.; Zahurak, M.; Yang, S.C.; Jones, D.R.; Broderick, S.; et al. Neoadjuvant PD-1 blockade in resectable lung cancer. N. Engl. J. Med. 2018, 378, 1976–1986. [Google Scholar] [CrossRef] [PubMed]
- Kwiatkowski, D.J.; Rusch, V.W.; Chaft, J.E.; Johnson, B.E.; Nicholas, A.; Wistuba, I.I.; Merritt, R.; Lee, J.M.; Bunn, P.A.; Tang, Y.; et al. Neoadjuvant atezolizumab in resectable non-small cell lung cancer (NSCLC): Interim analysis and biomarker data from a multicenter study (LCMC3). J. Clin. Oncol. 2019, 37 (Suppl. 15), 8503. [Google Scholar] [CrossRef]
- He, W.; Ju, D.; Jei, Z.; Zhang, A.; Xing, X.; Yang, Q. Aberrant CpG-methylation affects genes expression predicting survival in lung adenocarcinoma. Cancer Med. 2018, 7, 5716–5726. [Google Scholar] [CrossRef] [PubMed] [Green Version]
- Yu, P.; Tong, L.; Song, Y.; Qu, H.; Chen, Y. Systematic profiling of invasion-related gene signature predicts prognostic features of lung adenocarcinoma. J. Cell Mol. Med. 2021, 25, 6388–6402. [Google Scholar] [CrossRef] [PubMed]
- Chen, J.; Zhou, R. Tumor microenvironment related novel signature predict lung adenocarcinoma survival. PeerJ 2021, 9, e10628. [Google Scholar] [CrossRef]
- Wu, Y.; Yang, S.; Liu, H.; Luo, S.; Stinchcombe, T.E.; Glass, C.; Su, L.; Shen, S.; Christiani, D.C.; Wang, Q.; et al. Novel genetic variants of KIR3DL2 and PVR involved in immunoregulatory interactions are associated with non-small cell lung cancer survival. Am. J. Cancer Res. 2020, 10, 1770–1784. [Google Scholar]
- Wang, J.; Dai, Z.; Miao, Y.; Zhao, T.; Gan, J.; Zhao, C.; Ran, J.; Guan, Q. Carbon ion (12C6+) irradiation induces the expression of Klrk1 in lung cancer and optimizes the tumor microenvironment based on the NKG2D/NKG2D-Ls pathway. Cancer Lett. 2021, 521, 178–195. [Google Scholar] [CrossRef]


Publisher’s Note: MDPI stays neutral with regard to jurisdictional claims in published maps and institutional affiliations. |
© 2021 by the authors. Licensee MDPI, Basel, Switzerland. This article is an open access article distributed under the terms and conditions of the Creative Commons Attribution (CC BY) license (https://creativecommons.org/licenses/by/4.0/).
Share and Cite
Lim, J.; Han, Y.B.; Park, S.Y.; Ahn, S.; Kim, H.; Kwon, H.J.; Lee, C.-T.; Cho, S.; Chung, J.-H. Gene Expression Profiles of Multiple Synchronous Lesions in Lung Adenocarcinoma. Cells 2021, 10, 3484. https://doi.org/10.3390/cells10123484
Lim J, Han YB, Park SY, Ahn S, Kim H, Kwon HJ, Lee C-T, Cho S, Chung J-H. Gene Expression Profiles of Multiple Synchronous Lesions in Lung Adenocarcinoma. Cells. 2021; 10(12):3484. https://doi.org/10.3390/cells10123484
Chicago/Turabian StyleLim, Jisun, Yeon Bi Han, Soo Young Park, Soyeon Ahn, Hyojin Kim, Hyun Jung Kwon, Choon-Taek Lee, Sukki Cho, and Jin-Haeng Chung. 2021. "Gene Expression Profiles of Multiple Synchronous Lesions in Lung Adenocarcinoma" Cells 10, no. 12: 3484. https://doi.org/10.3390/cells10123484
APA StyleLim, J., Han, Y. B., Park, S. Y., Ahn, S., Kim, H., Kwon, H. J., Lee, C.-T., Cho, S., & Chung, J.-H. (2021). Gene Expression Profiles of Multiple Synchronous Lesions in Lung Adenocarcinoma. Cells, 10(12), 3484. https://doi.org/10.3390/cells10123484