
Different Ability of Multidrug-Resistant and -Sensitive Counterpart Cells to Release and Capture Extracellular Vesicles


 , ,
, ,  , and
, and 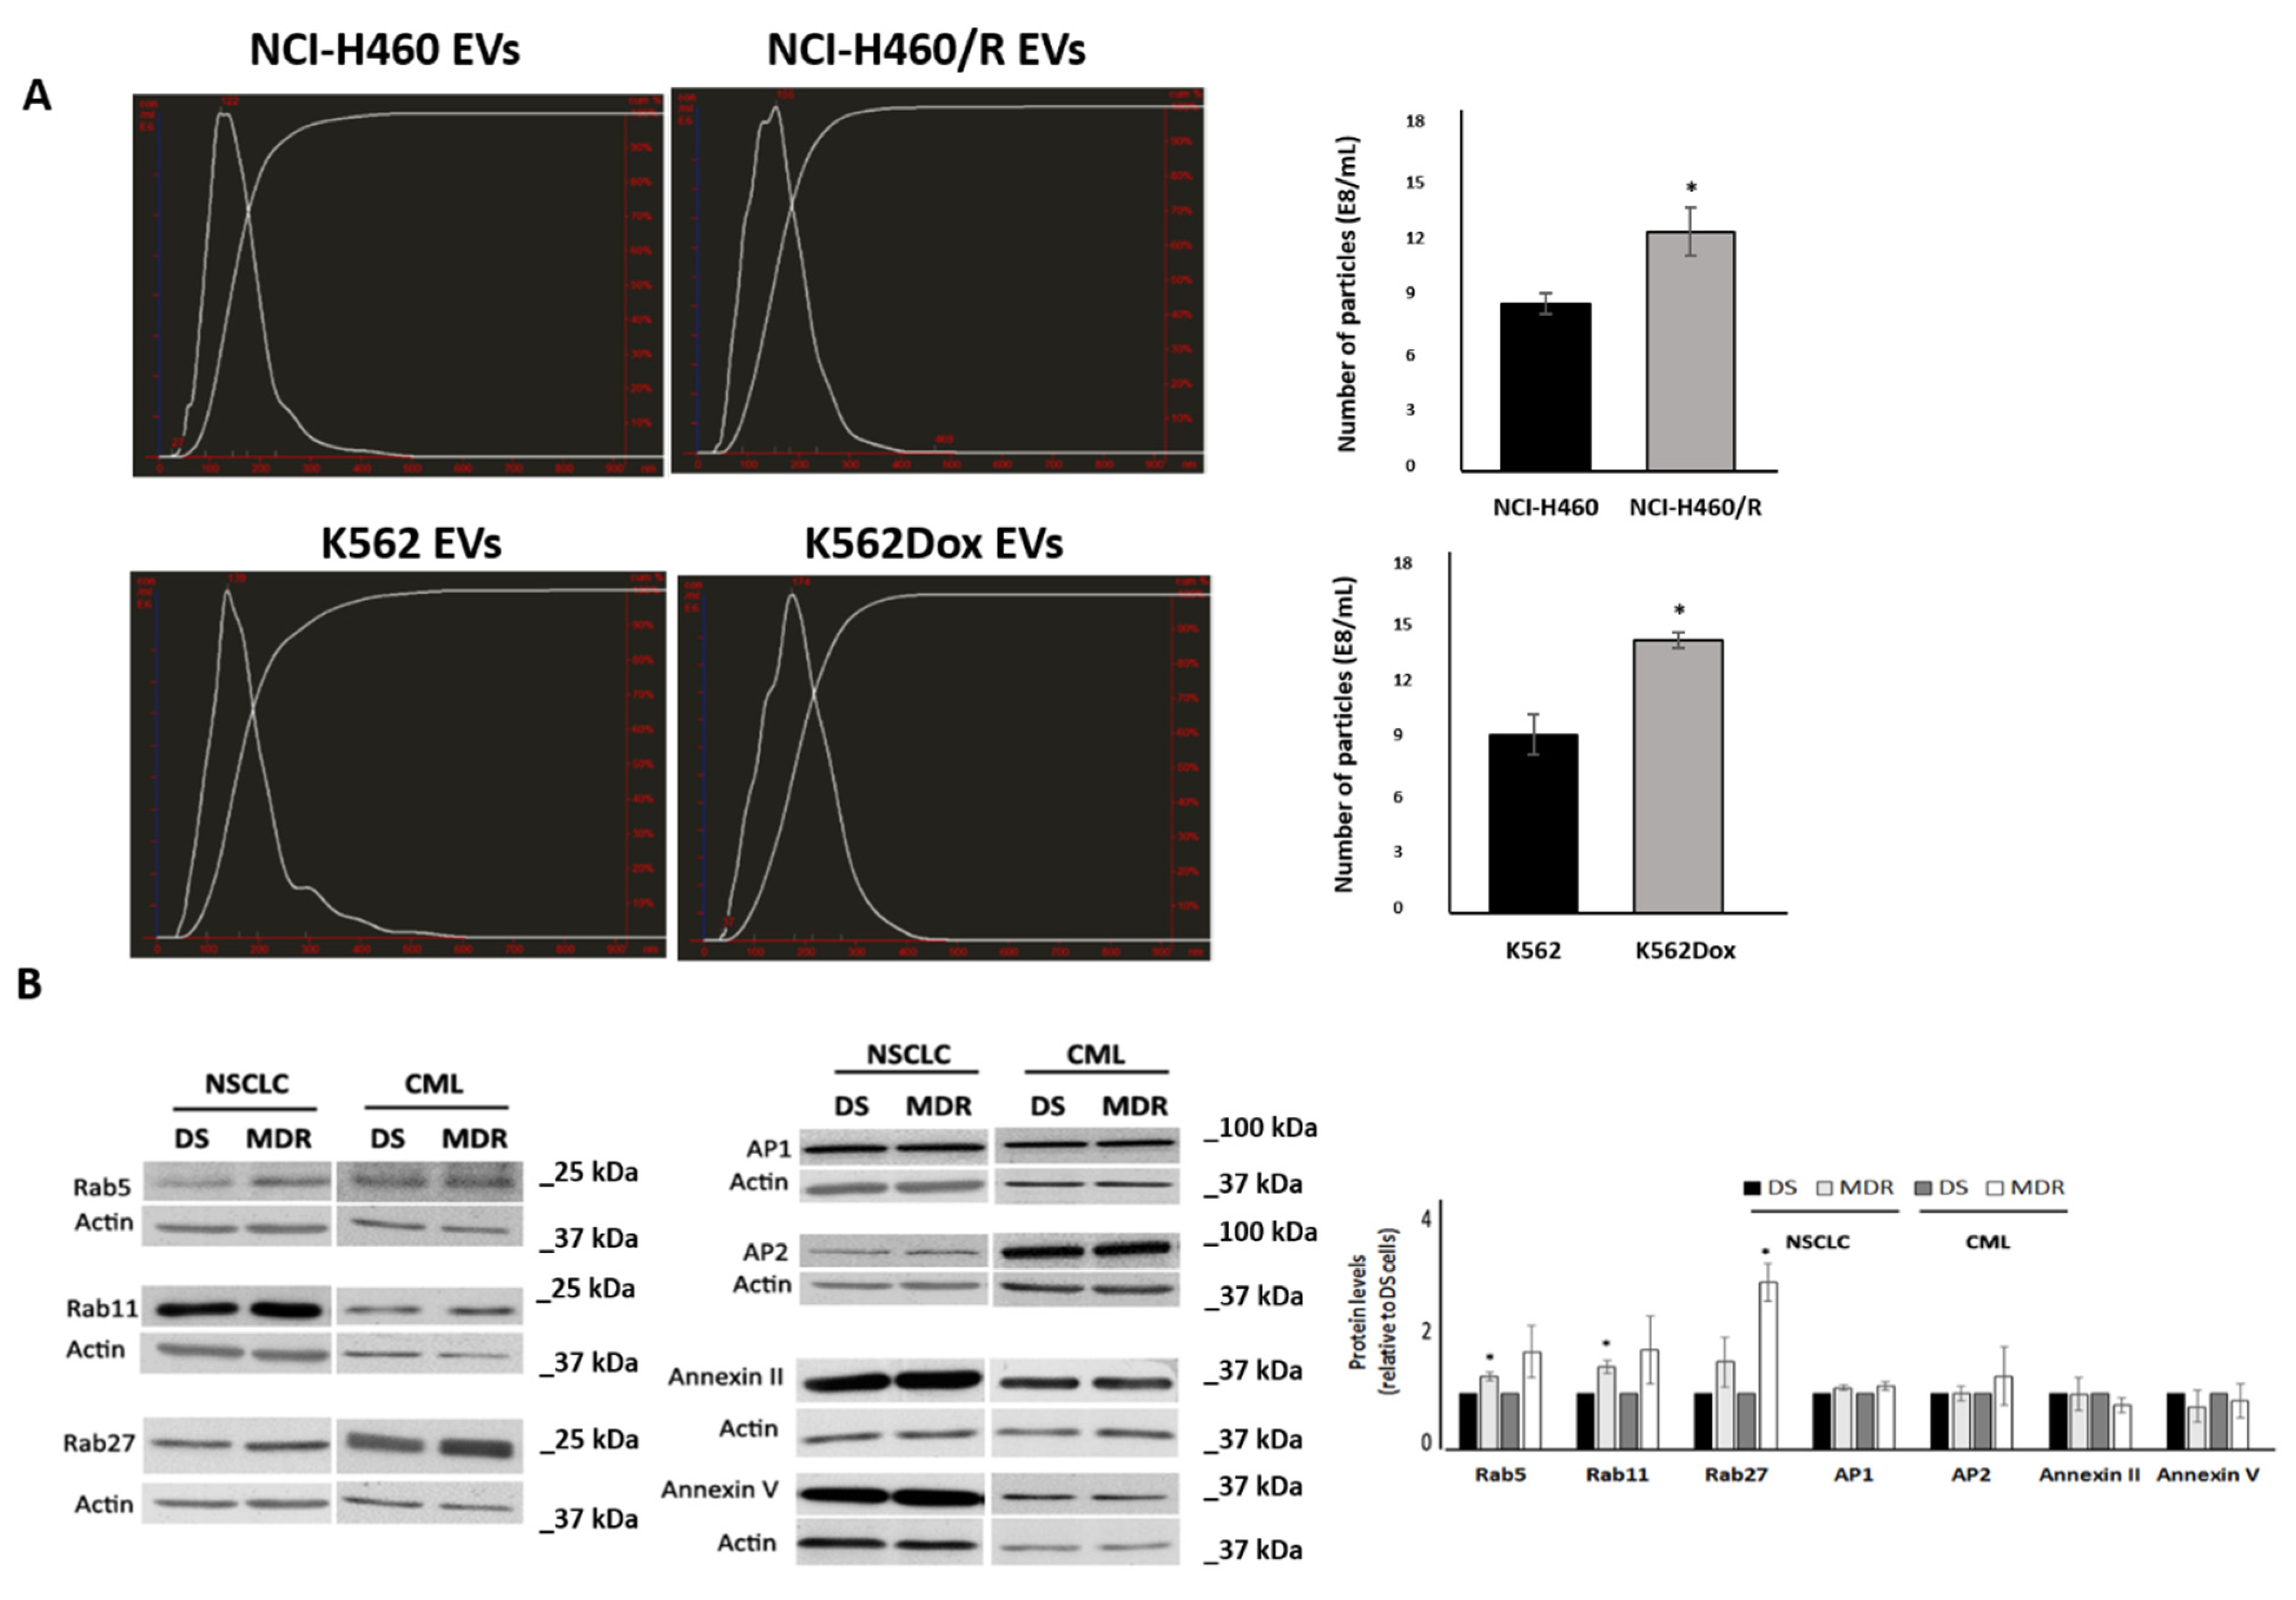
Abstract
1. Introduction
2. Results
2.1. MDR Cells Released More EVs Than Their Drug-Sensitive Counterparts and Showed Higher Levels of Rabs
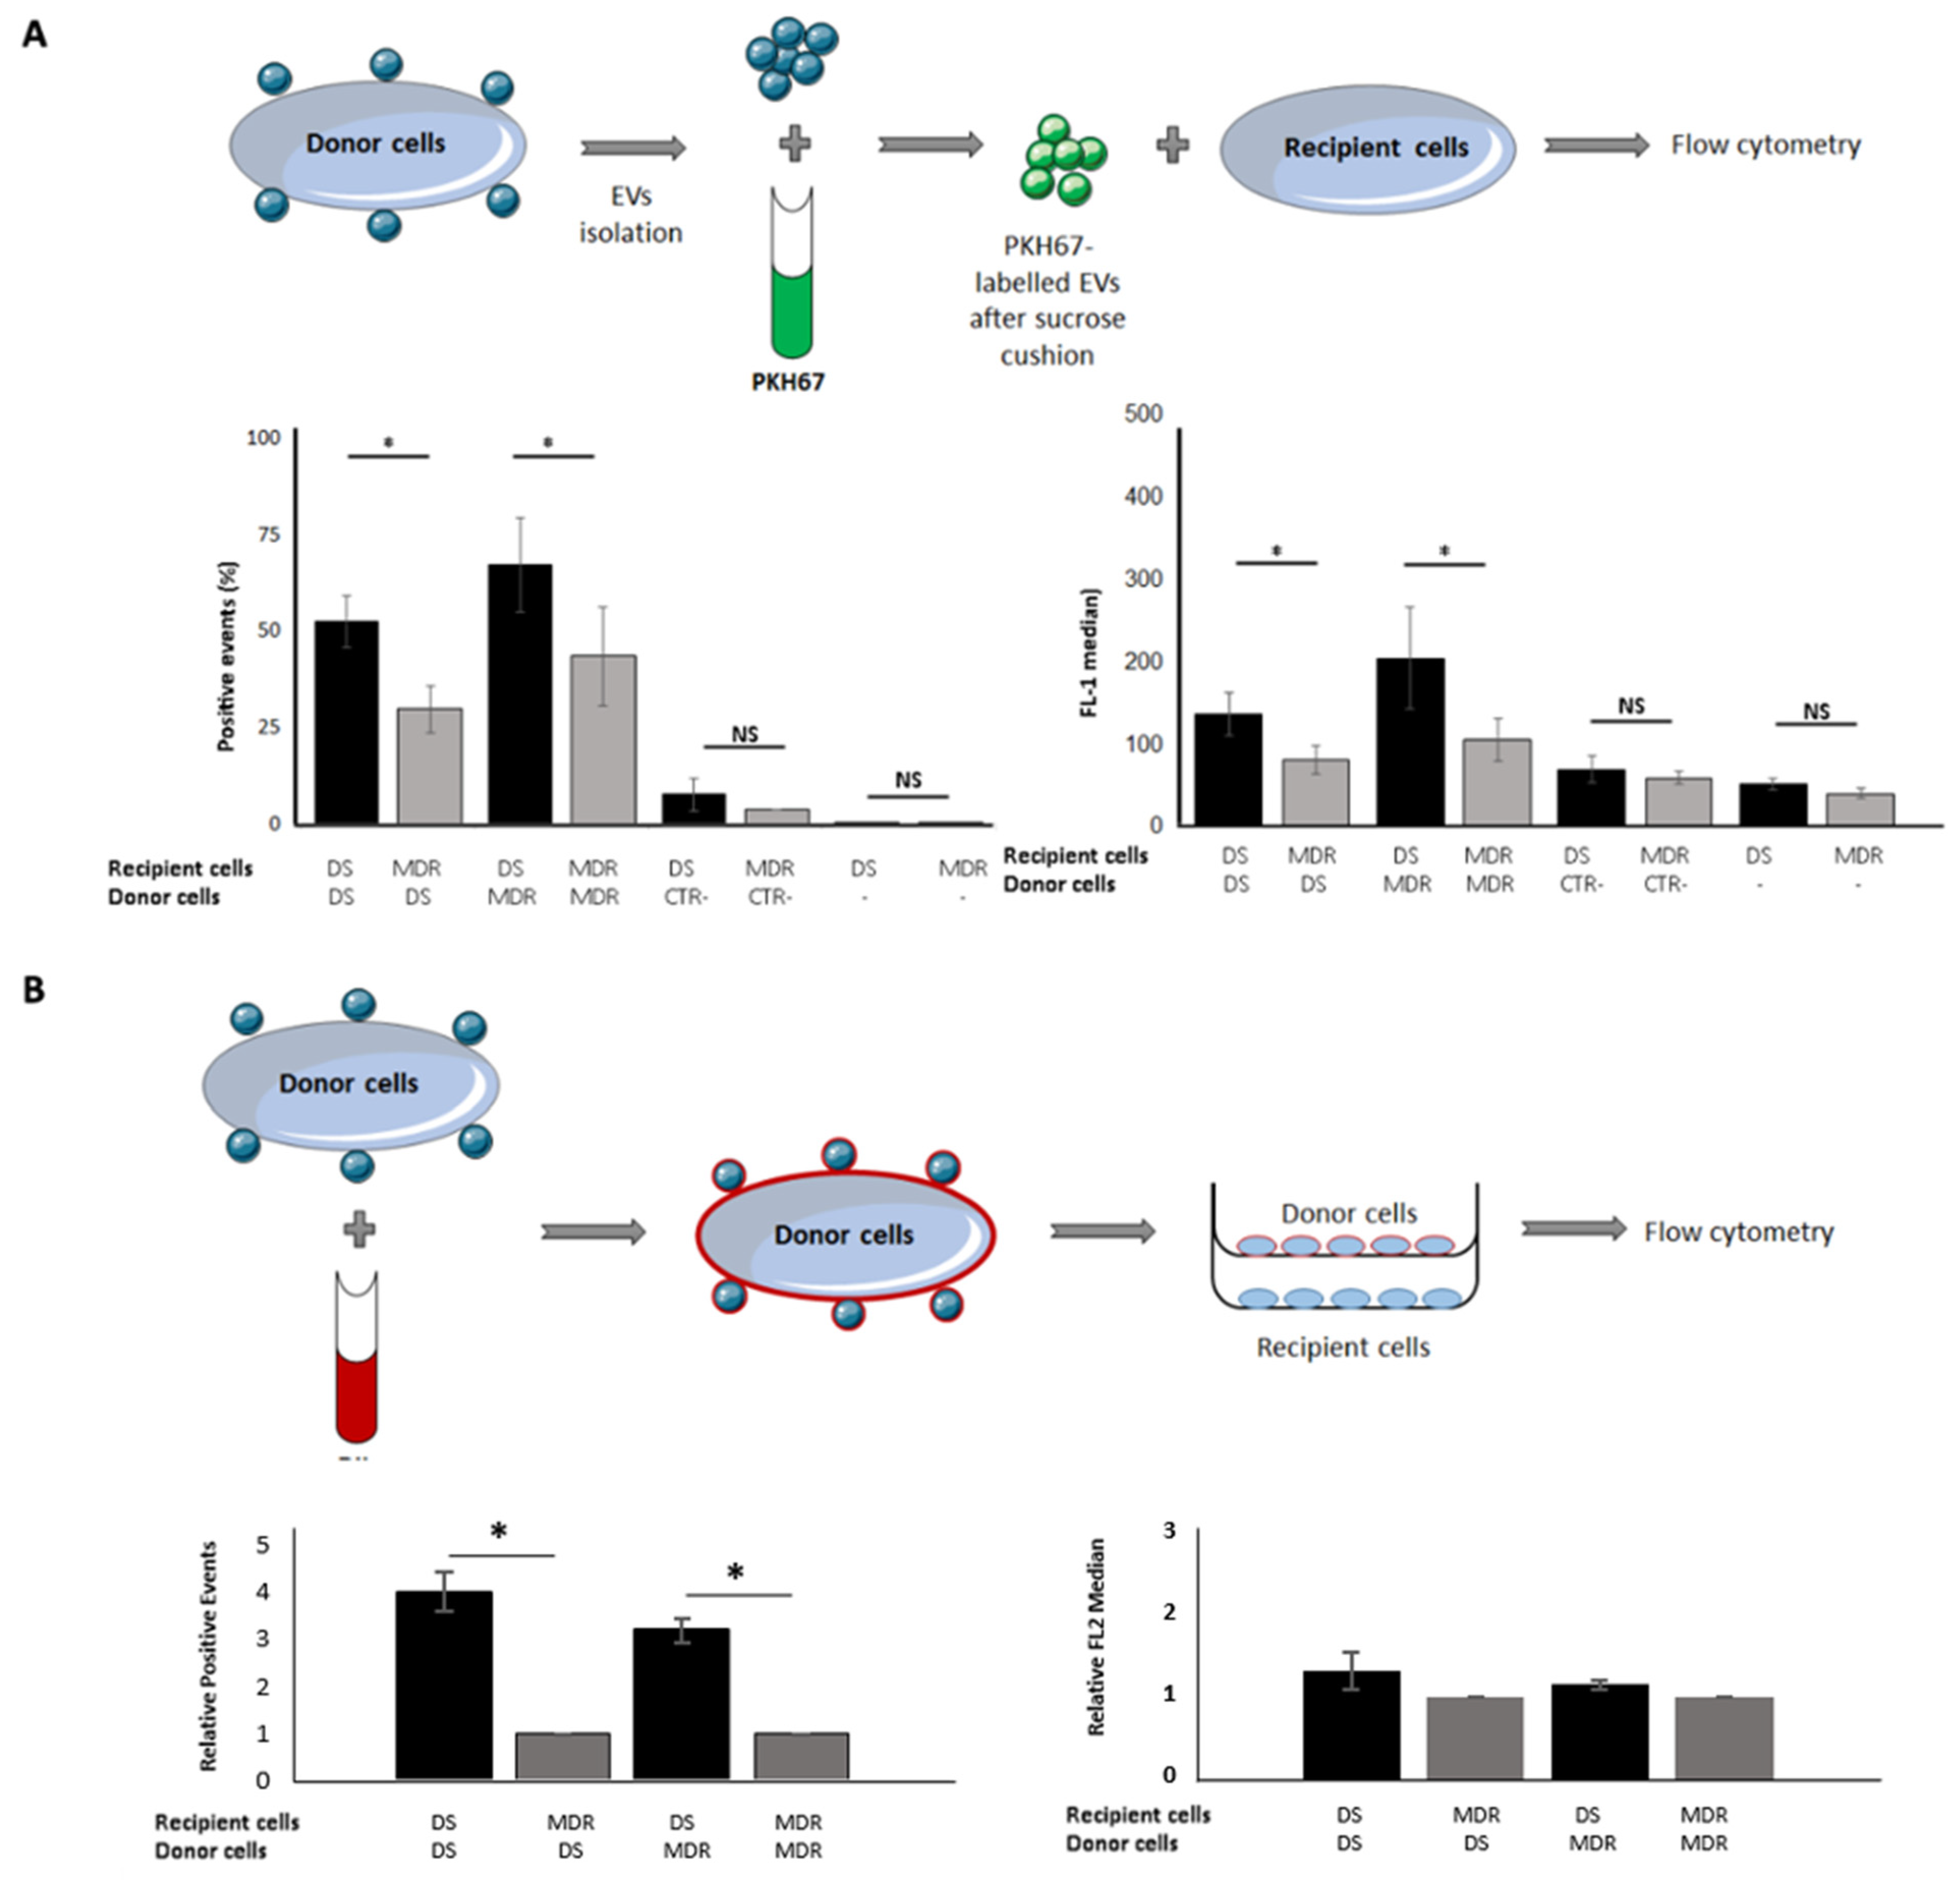
2.2. Drug-Sensitive Cells Captured More EVs Than Their MDR Counterparts
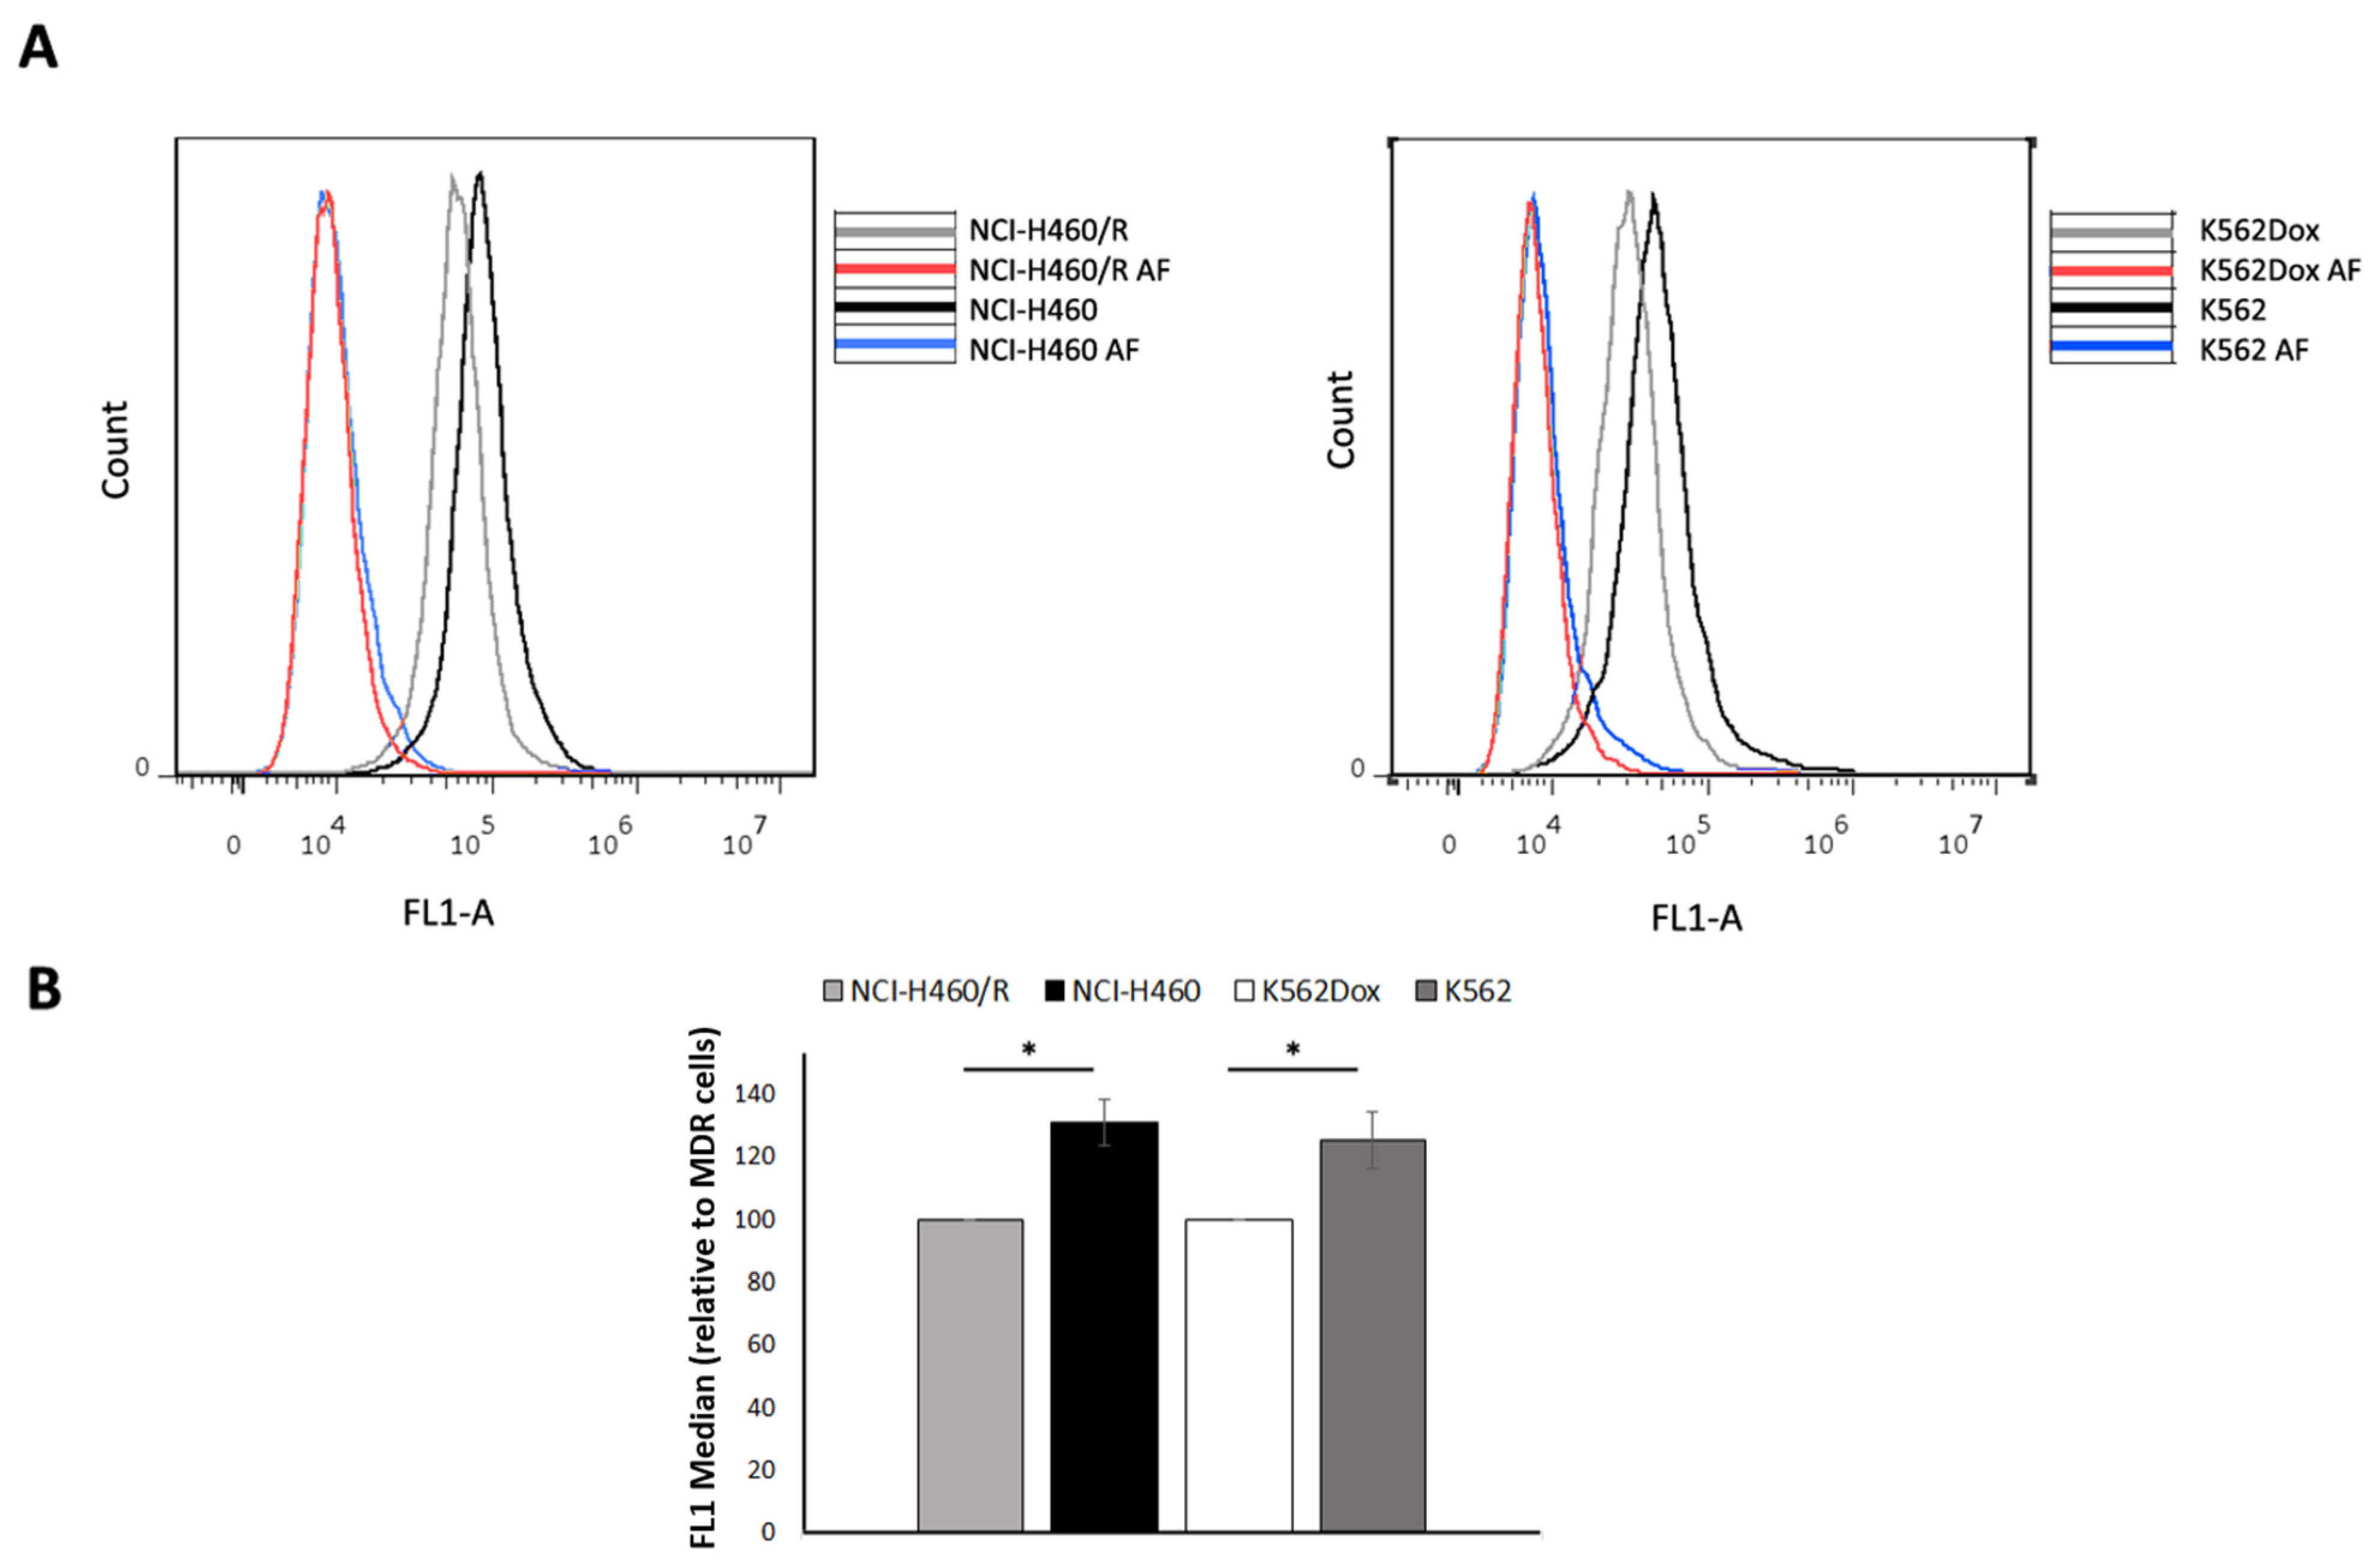
2.3. Fluid-Phase Endocytosis Was Higher in Drug-Sensitive Cells
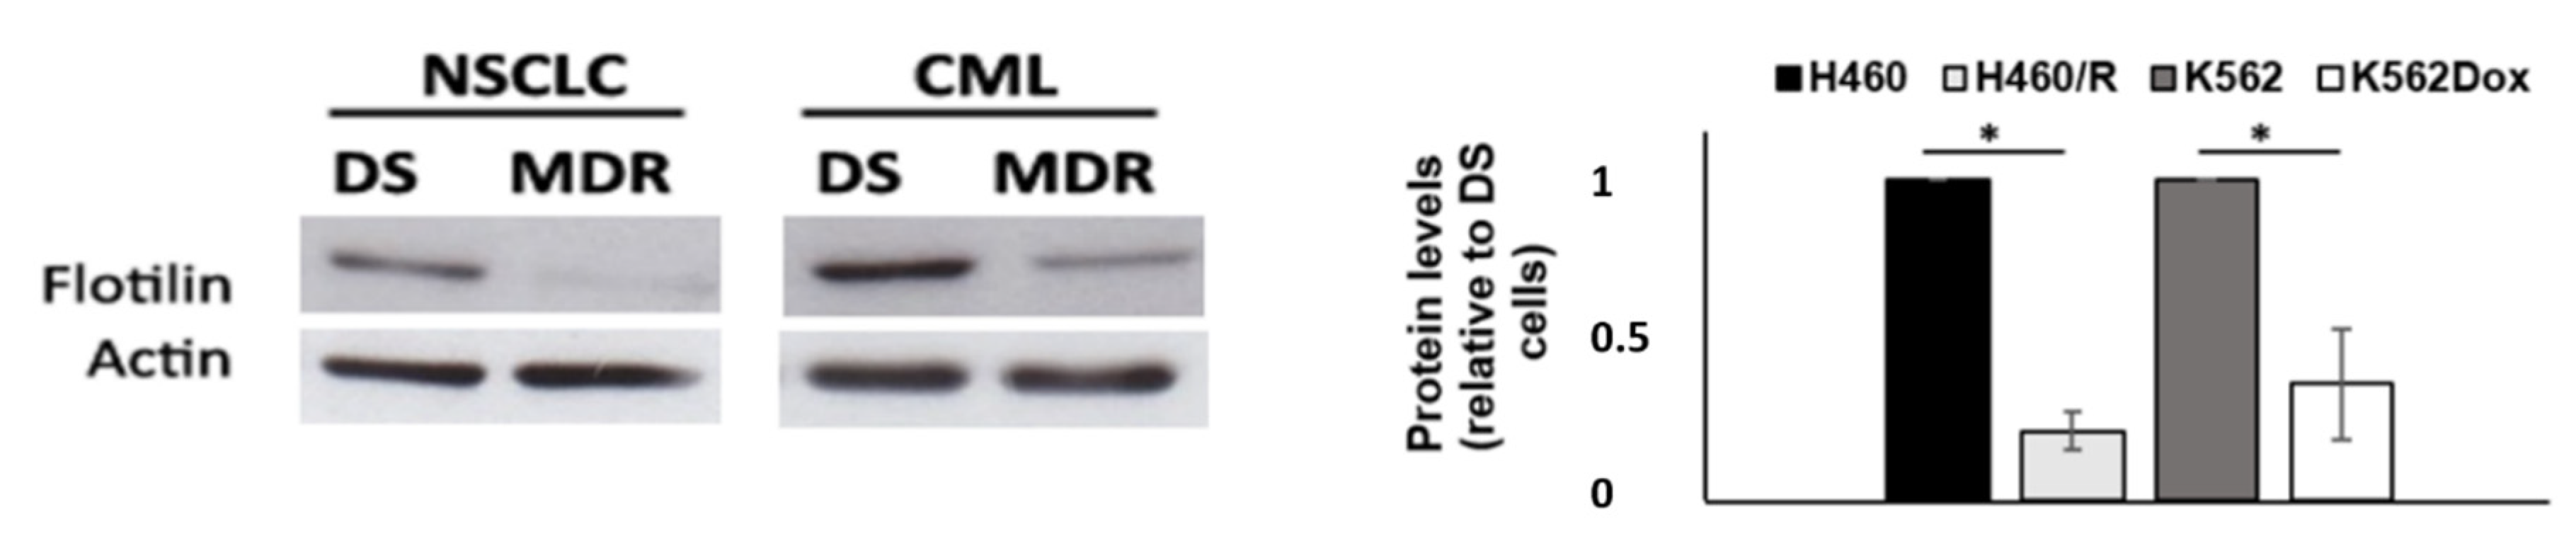
2.4. Drug-Sensitive Cells Showed Increased Expression of Flotillin-1
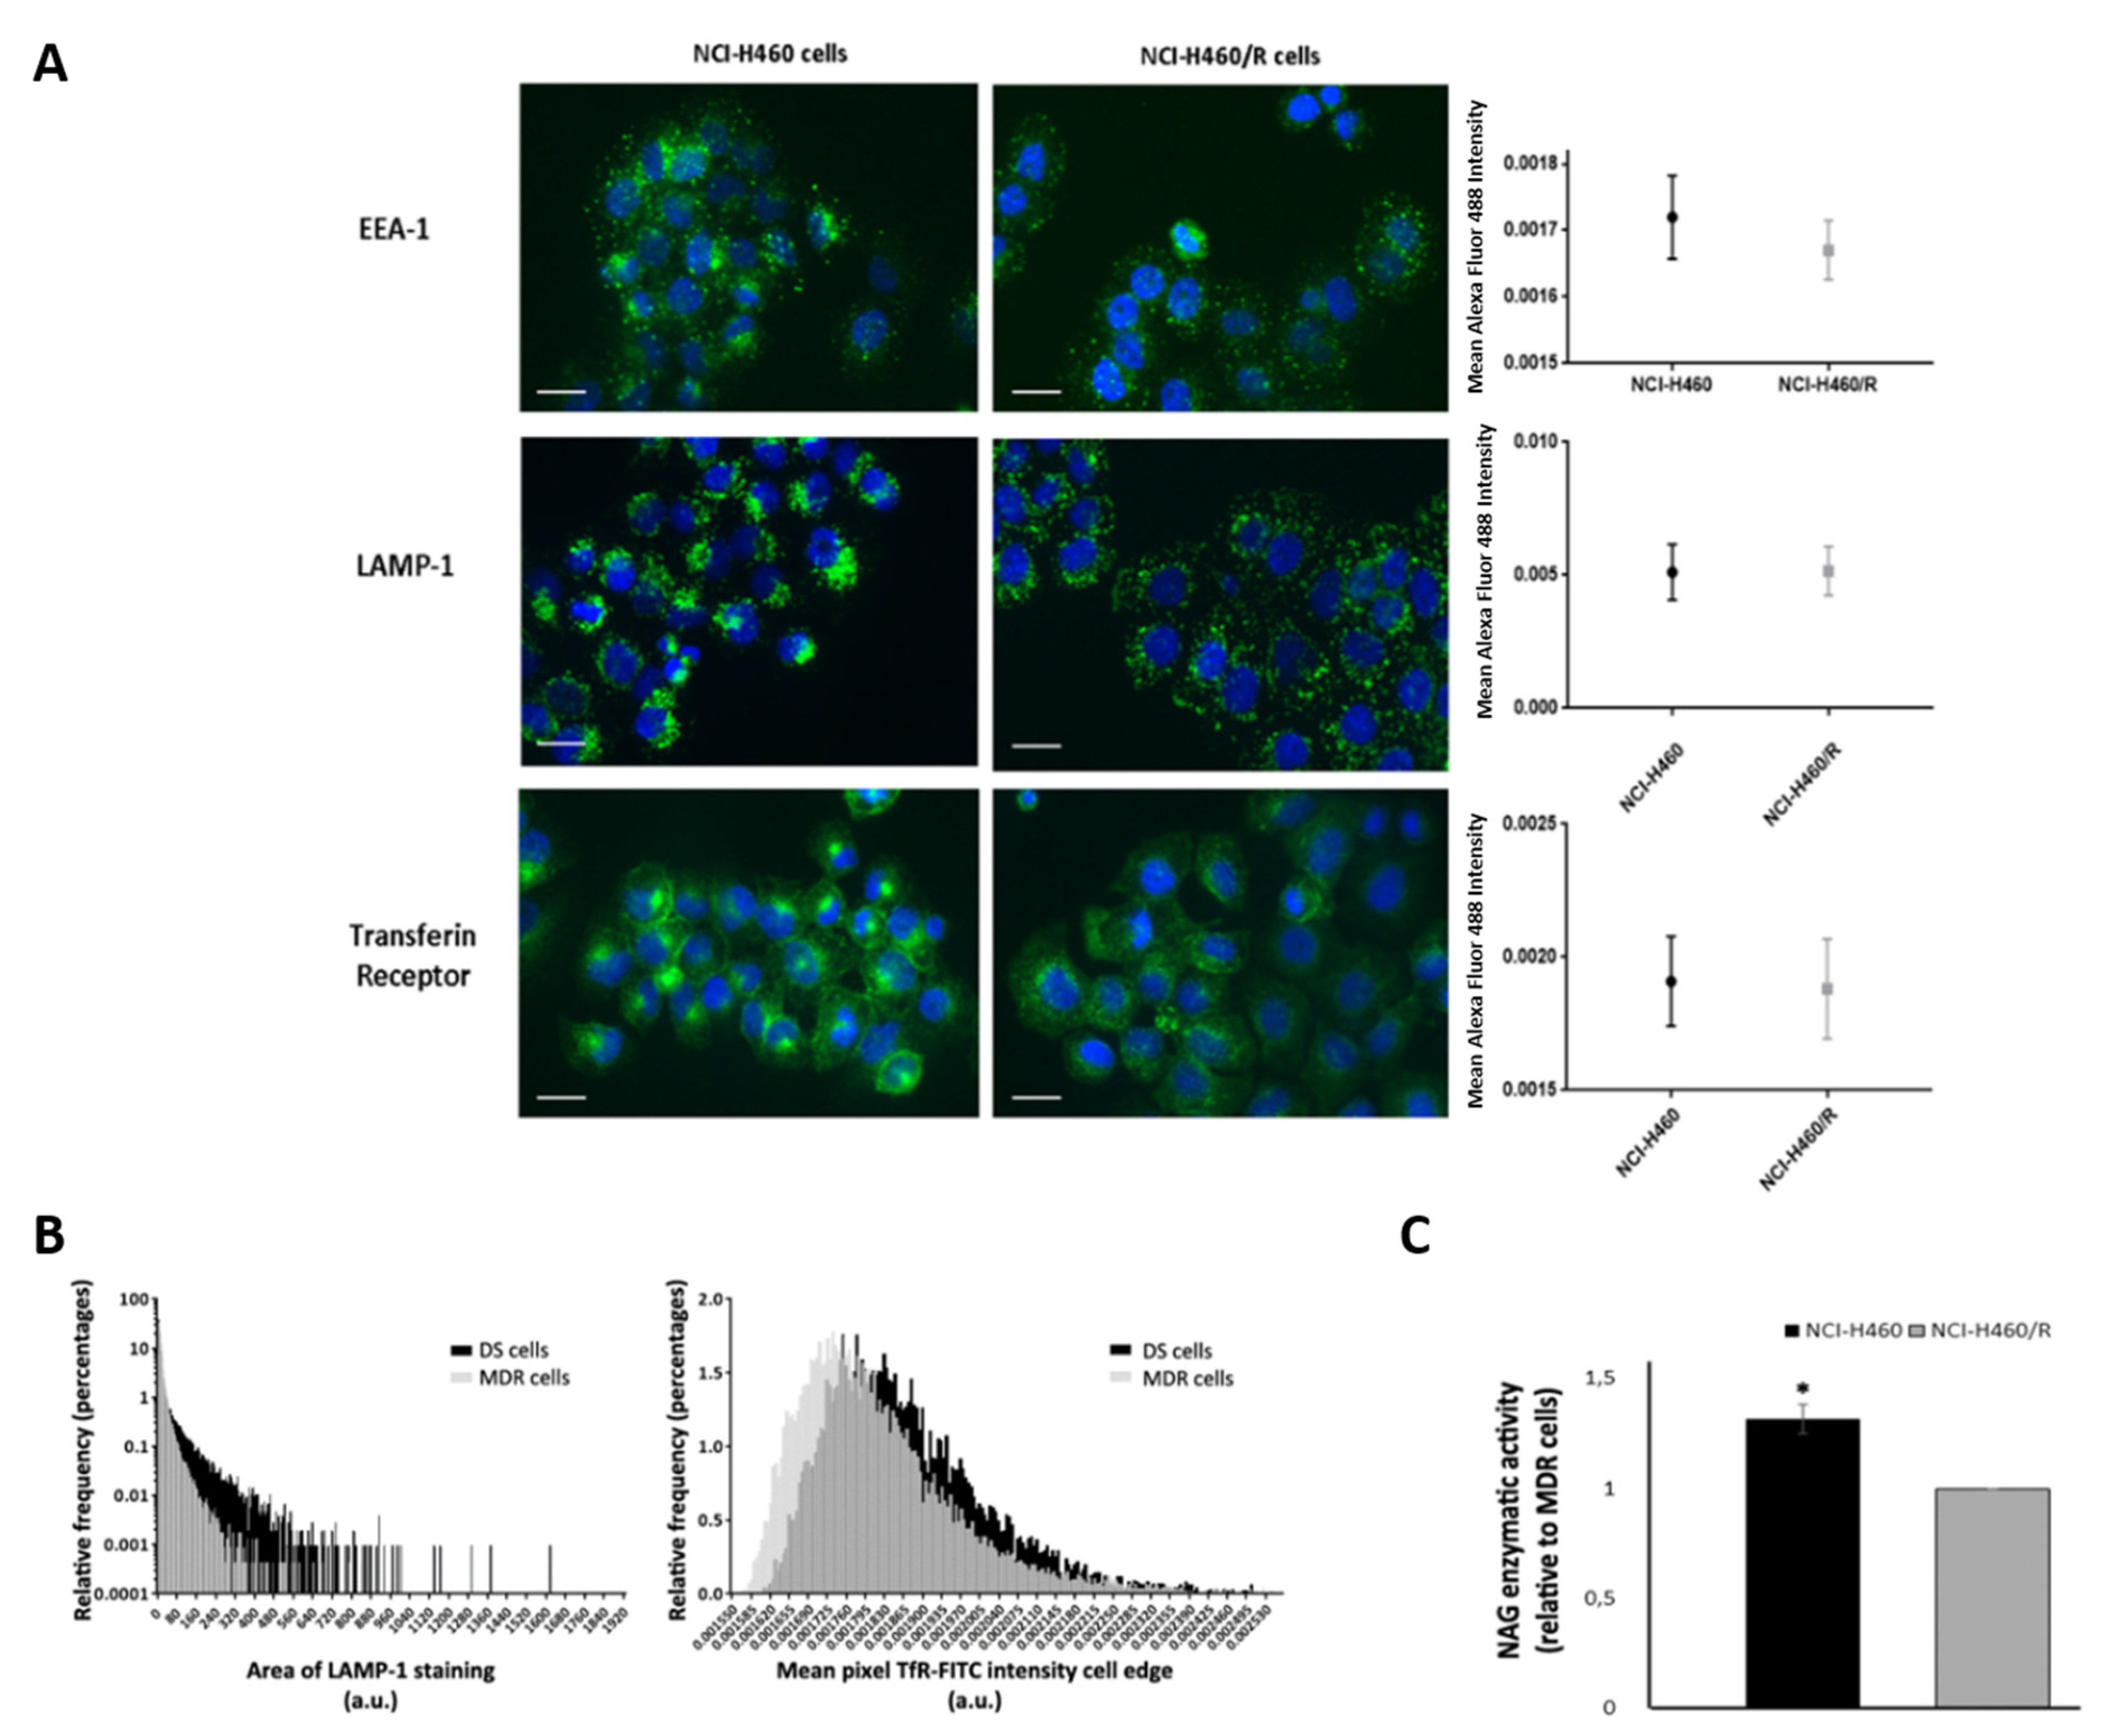
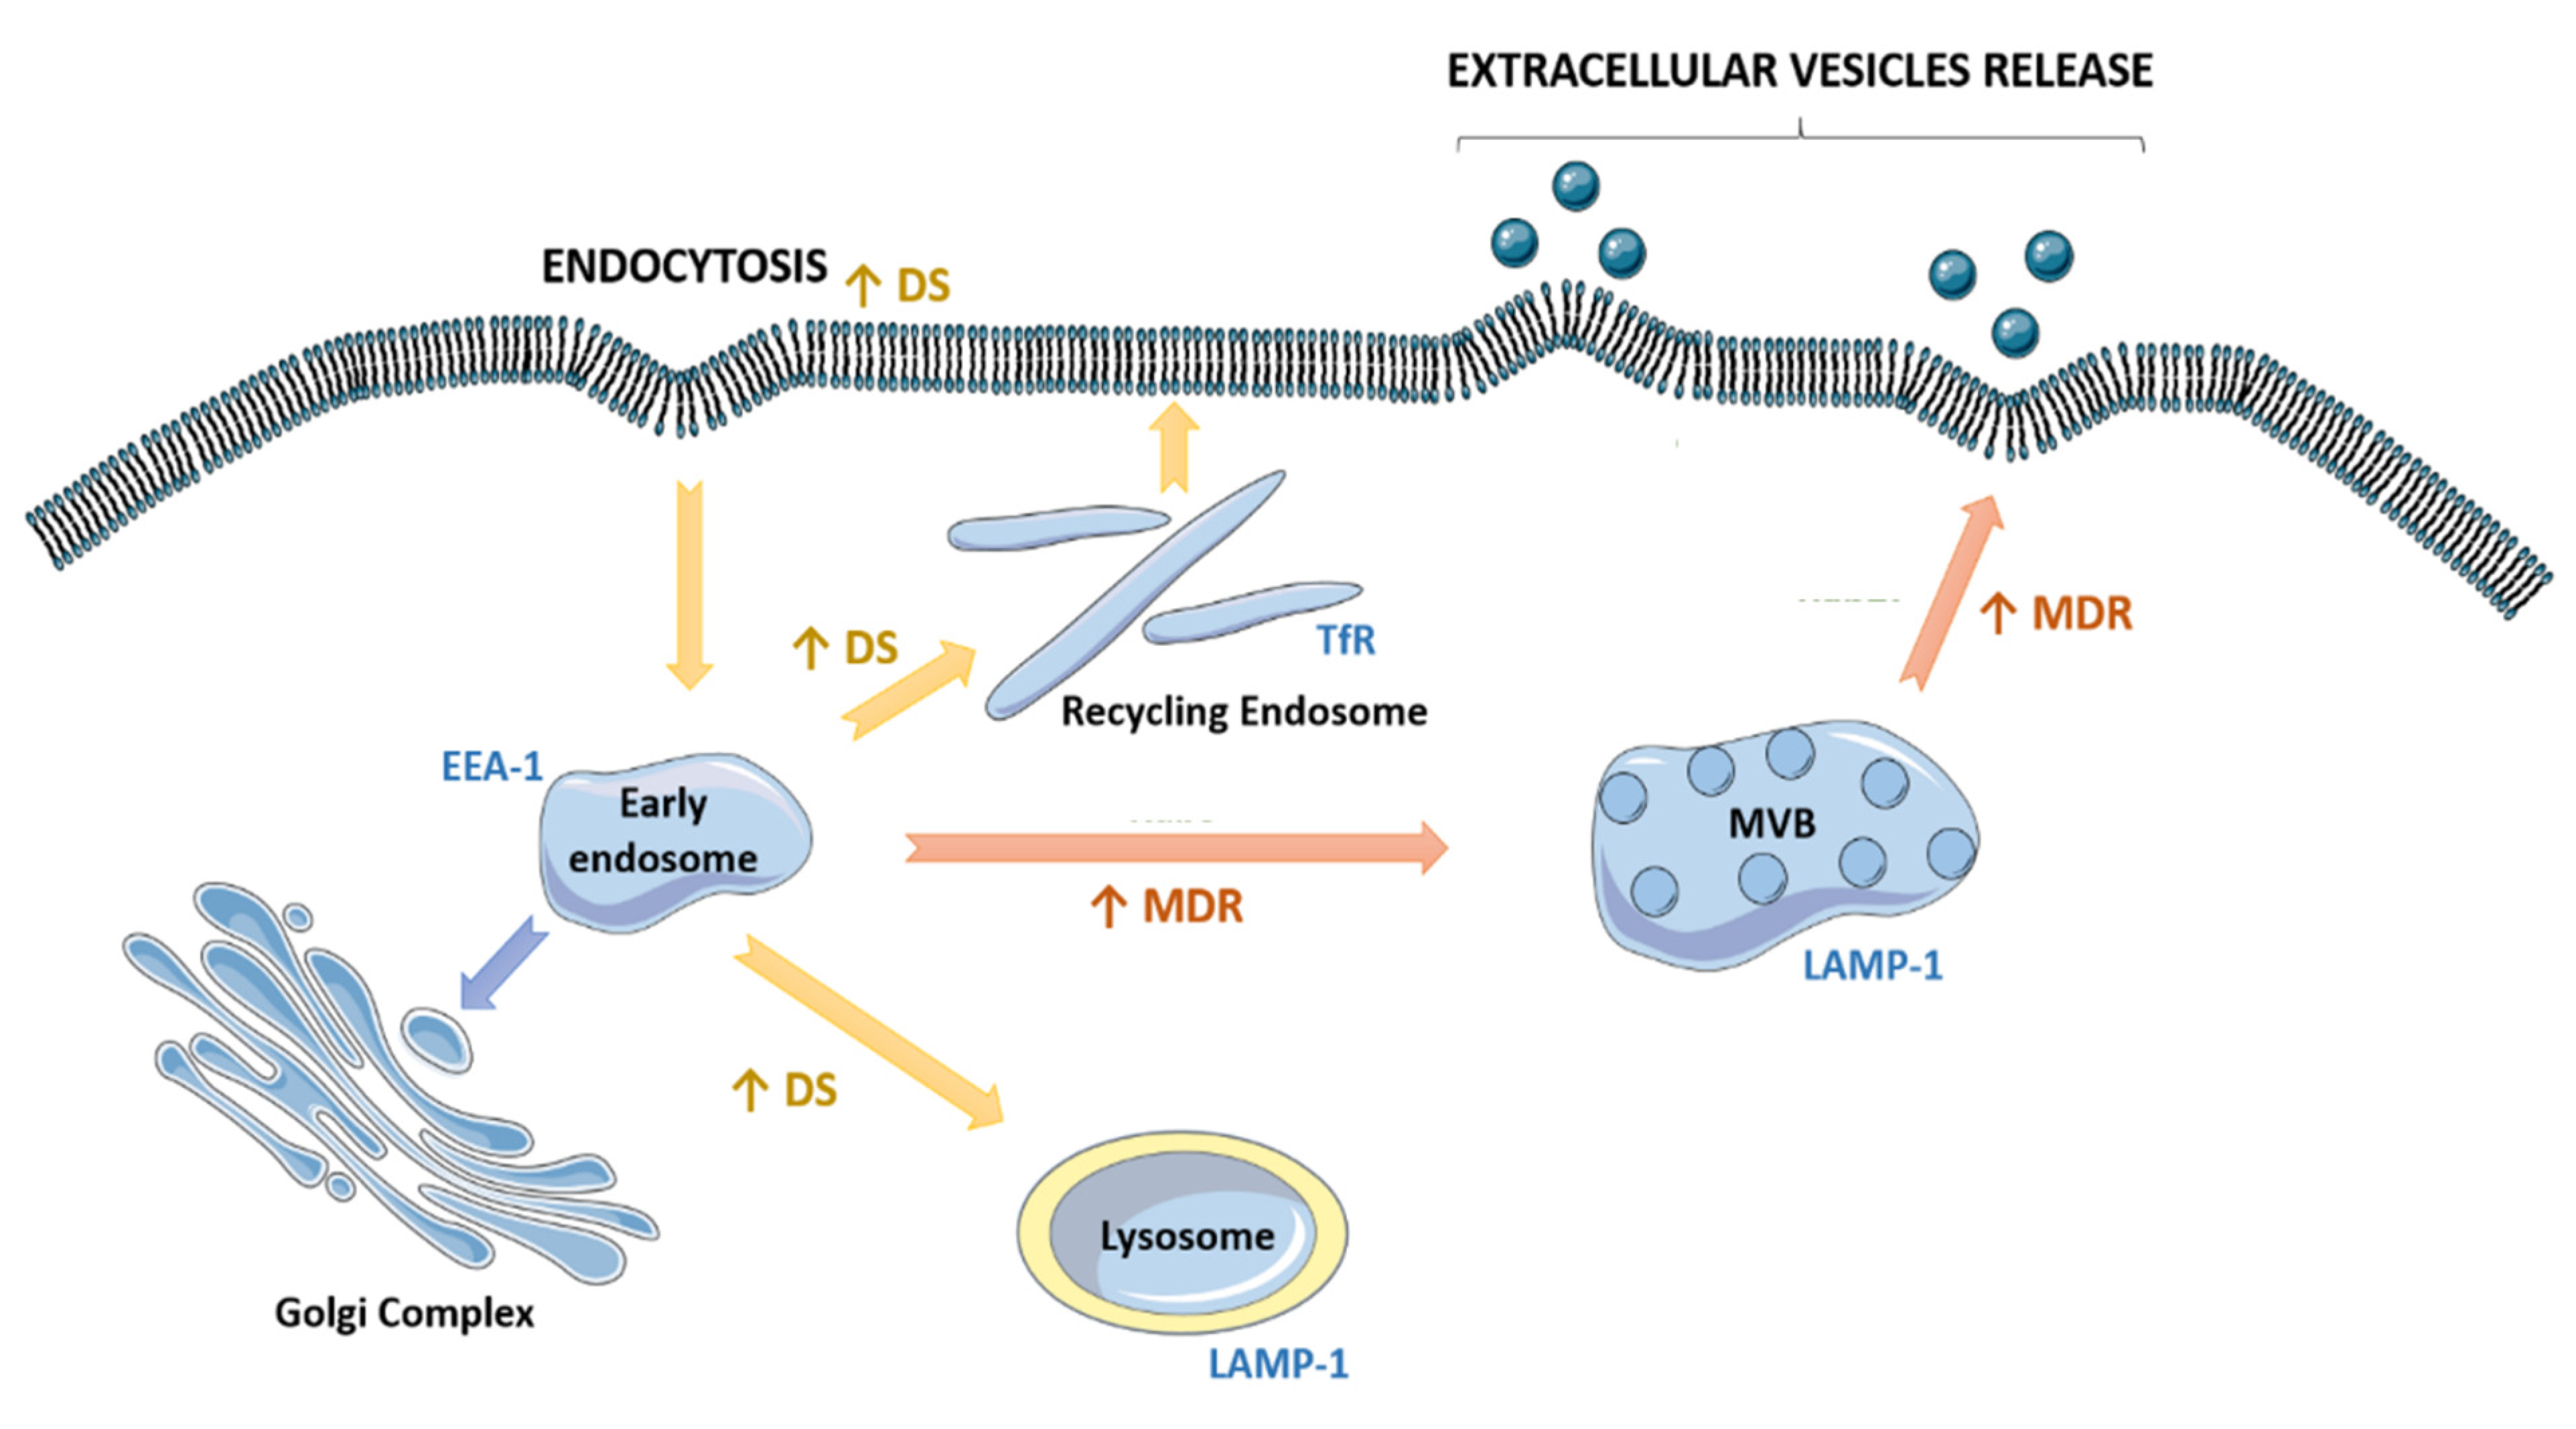
2.5. Drug-Sensitive and Their MDR Counterparts Presented Different a Fate of the Endocytic Pathway
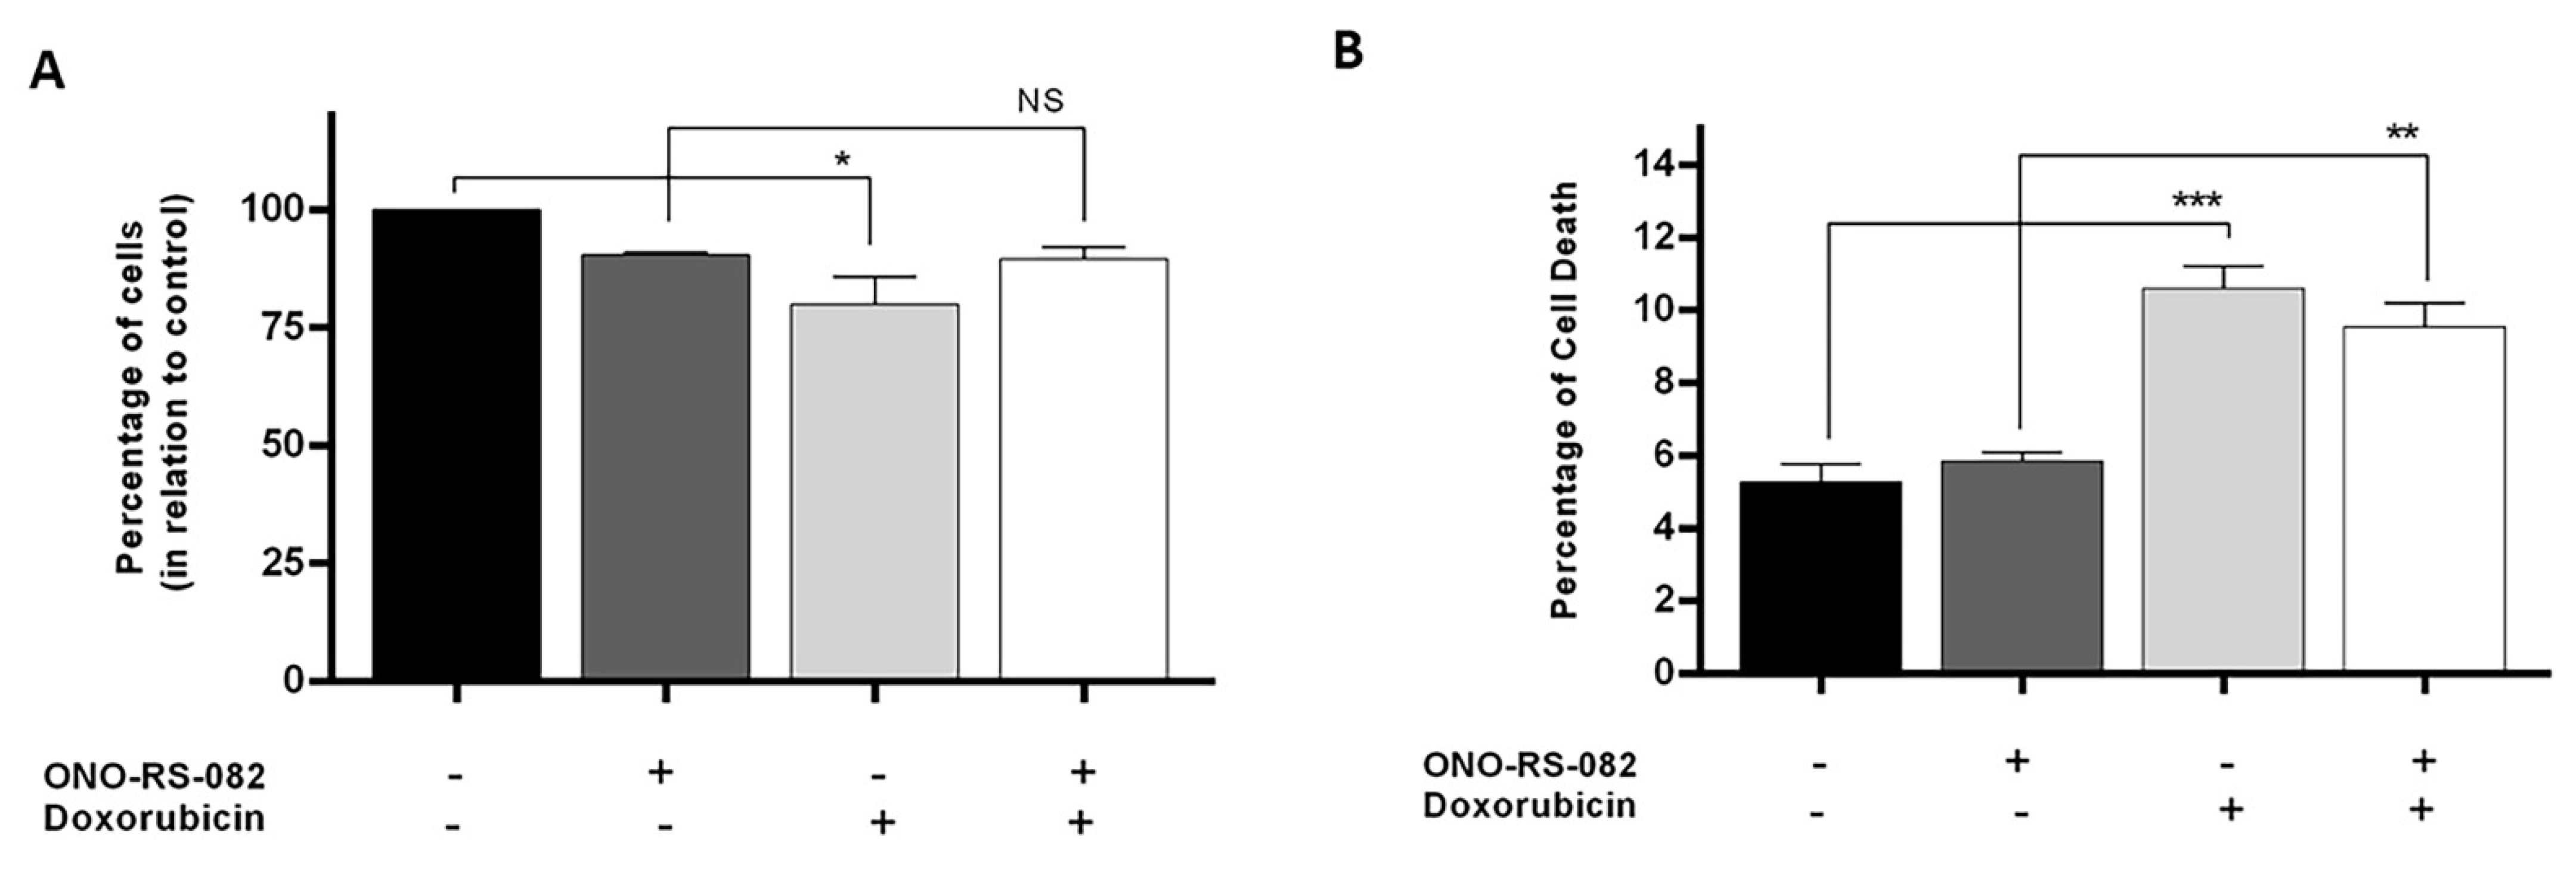
2.6. The Recycling Pathway Inhibitor, ONO-RS-082, Reduces the Growth Inhibition of Drug-Sensitive Cells following Treatment with Doxorubicin
3. Discussion
4. Materials and Methods
4.1. Cell Culture
4.2. Extracellular Vesicles Isolation
4.3. Nanoparticle Tracking Analysis (NTA)
4.4. PKH67 EVs Labelling
4.5. DiI Staining
4.6. Fluid-Phase Endocytosis Assay
4.7. Protein Expression Analysis
4.8. Immunofluorescence
4.9. Fluorescence Quantification
4.10. N-Acetyl-d-glucosaminidase (NAG) Activity
4.11. Sulforhodamine B Assay
4.12. Annexin V-FITC Flow Cytometry
4.13. Statistical Analysis
5. Conclusions
Supplementary Materials
Author Contributions
Funding
Institutional Review Board Statement
Informed Consent Statement
Data Availability Statement
Acknowledgments
Conflicts of Interest
References
- Xavier, C.P.; Pesic, M.; Vasconcelos, M.H. Understanding Cancer Drug Resistance by Developing and Studying Resistant Cell Line Models. Curr. Cancer Drug Targets 2016, 16, 226–237. [Google Scholar] [CrossRef] [PubMed]
- Gillet, J.P.; Gottesman, M.M. Mechanisms of multidrug resistance in cancer. Methods Mol. Biol. 2010, 596, 47–76. [Google Scholar] [CrossRef] [PubMed]
- Assaraf, Y.G.; Brozovic, A.; Gonçalves, A.C.; Jurkovicova, D.; Linē, A.; Machuqueiro, M.; Saponara, S.; Sarmento-Ribeiro, A.B.; Xavier, C.P.; Vasconcelos, M.H. The multi-factorial nature of clinical multidrug resistance in cancer. Drug Resist. Updat. 2019, 46, 100645. [Google Scholar] [CrossRef] [PubMed]
- Levchenko, A.; Mehta, B.M.; Niu, X.; Kang, G.; Villafania, L.; Way, D.; Polycarpe, D.; Sadelain, M.; Larson, S.M. Intercellular transfer of P-glycoprotein mediates acquired multidrug resistance in tumor cells. Proc. Natl. Acad. Sci. USA 2005, 102, 1933–1938. [Google Scholar] [CrossRef] [PubMed]
- Bebawy, M.; Combes, V.; Lee, E.; Jaiswal, R.; Gong, J.; Bonhoure, A.; Grau, G.E.R. Membrane microparticles mediate transfer of P-glycoprotein to drug sensitive cancer cells. Leukemia 2009, 23, 1643–1649. [Google Scholar] [CrossRef] [PubMed]
- Corcoran, C.; Rani, S.; O’Driscoll, L. miR-34a is an intracellular and exosomal predictive biomarker for response to docetaxel with clinical relevance to prostate cancer progression. Prostate 2014, 74, 1320–1334. [Google Scholar] [CrossRef]
- Takahashi, K.; Yan, I.K.; Wood, J.; Haga, H.; Patel, T. Involvement of Extracellular Vesicle Long Noncoding RNA (linc-VLDLR) in Tumor Cell Responses to Chemotherapy. Mol. Cancer Res. 2014, 12, 1377–1387. [Google Scholar] [CrossRef] [PubMed]
- Lu, J.F.; Luk, F.; Gong, J.; Jaiswal, R.; Grau, G.; Bebawy, M. Microparticles mediate MRP1 intercellular transfer and the re-templating of intrinsic resistance pathways. Pharmacol. Res. 2013, 76, 77–83. [Google Scholar] [CrossRef] [PubMed]
- Lv, M.-M.; Zhu, X.-Y.; Chen, W.-X.; Zhong, S.; Hu, Q.; Ma, T.-F.; Zhang, J.; Chen, L.; Tang, J.-H.; Zhao, J.-H. Exosomes mediate drug resistance transfer in MCF-7 breast cancer cells and a probable mechanism is delivery of P-glycoprotein. Tumor Biol. 2014, 35, 10773–10779. [Google Scholar] [CrossRef] [PubMed]
- Zhang, F.-F.; Zhu, Y.-F.; Zhao, Q.-N.; Yang, D.-T.; Dong, Y.-P.; Jiang, L.; Xing, W.-X.; Li, X.-Y.; Xing, H.; Shi, M.; et al. Microvesicles mediate transfer of P-glycoprotein to paclitaxel-sensitive A2780 human ovarian cancer cells, conferring paclitaxel-resistance. Eur. J. Pharmacol. 2014, 738, 83–90. [Google Scholar] [CrossRef] [PubMed]
- Fontana, F.; Carollo, E.; Melling, G.; Carter, D. Extracellular Vesicles: Emerging Modulators of Cancer Drug Resistance. Cancers 2021, 13, 749. [Google Scholar] [CrossRef] [PubMed]
- Li, S.; Yi, M.; Dong, B.; Jiao, Y.; Luo, S.; Wu, K. The roles of exosomes in cancer drug resistance and its therapeutic application. Clin. Transl. Med. 2020, 10, e257. [Google Scholar] [CrossRef]
- Milman, N.; Ginini, L.; Gil, Z. Exosomes and their role in tumorigenesis and anticancer drug resistance. Drug Resist. Updat. 2019, 45, 1–12. [Google Scholar] [CrossRef] [PubMed]
- Colombo, M.; Raposo, G.; Théry, C. Biogenesis, secretion, and intercellular interactions of exosomes and other extracellular vesicles. Annu. Rev. Cell Dev. Biol. 2014, 30, 255–289. [Google Scholar] [CrossRef]
- Yáñez-Mó, M.; Siljander, P.R.-M.; Andreu, Z.; Zavec, A.B.; Borràs, F.E.; Buzas, E.I.; Buzas, K.; Casal, E.; Cappello, F.; Carvalho, J.; et al. Biological properties of extracellular vesicles and their physiological functions. J. Extracell. Vesicles 2015, 4, 27066. [Google Scholar] [CrossRef]
- Tkach, M.; Kowal, J.; Théry, C. Why the need and how to approach the functional diversity of extracellular vesicles. Philos. Trans. R. Soc. B Biol. Sci. 2018, 373, 20160479. [Google Scholar] [CrossRef]
- Ghossoub, R.; Lembo, F.; Rubio, A.; Gaillard, C.B.; Bouchet, J.; Vitale, N.; Slavík, J.; Machala, M.; Zimmermann, P. Syntenin-ALIX exosome biogenesis and budding into multivesicular bodies are controlled by ARF6 and PLD2. Nat. Commun. 2014, 5, 3477. [Google Scholar] [CrossRef]
- Naslavsky, N.; Caplan, S. The enigmatic endosome—Sorting the ins and outs of endocytic trafficking. J. Cell Sci. 2018, 131, jcs216499. [Google Scholar] [CrossRef]
- Klumperman, J.; Raposo, G. The Complex Ultrastructure of the Endolysosomal System. Cold Spring Harb. Perspect. Biol. 2014, 6, a016857. [Google Scholar] [CrossRef]
- Scott, C.; Vacca, F.; Gruenberg, J. Endosome maturation, transport and functions. Semin. Cell Dev. Biol. 2014, 31, 2–10. [Google Scholar] [CrossRef]
- Sousa, D.; Matthiesen, R.; Lima, R.T.; Vasconcelos, M.H. Deep Sequencing Analysis Reveals Distinctive Non-Coding RNAs When Comparing Tumor Multidrug-Resistant Cells and Extracellular Vesicles with Drug-Sensitive Counterparts. Cancers 2020, 12, 200. [Google Scholar] [CrossRef]
- Lopes-Rodrigues, V.; Di Luca, A.; Sousa, D.; Seca, H.; Meleady, P.; Henry, M.; Lima, R.T.; O’Connor, R.; Vasconcelos, M.H. Multidrug resistant tumour cells shed more microvesicle-like EVs and less exosomes than their drug-sensitive counterpart cells. Biochim. Biophys. Acta (BBA)-Gen. Subj. 2016, 1860, 618–627. [Google Scholar] [CrossRef]
- Chiba, M.; Kimura, M.; Asari, S. Exosomes secreted from human colorectal cancer cell lines contain mRNAs, microRNAs and natural antisense RNAs, that can transfer into the human hepatoma HepG2 and lung cancer A549 cell lines. Oncol. Rep. 2012, 28, 1551–1558. [Google Scholar] [CrossRef]
- Plank, C.; Oberhauser, B.; Mechtler, K.; Koch, C.; Wagner, E. The influence of endosome-disruptive peptides on gene transfer using synthetic virus-like gene transfer systems. J. Biol. Chem. 1994, 269, 12918–12924. [Google Scholar] [CrossRef]
- Falcon-Perez, J.M.; Nazarian, R.; Sabatti, C.; Dell’Angelica, E.C. Distribution and dynamics of Lamp1-containing endocytic organelles in fibroblasts deficient in BLOC-3. J. Cell Sci. 2005, 118, 5243–5255. [Google Scholar] [CrossRef]
- Cullen, P.J.; Steinberg, F. To degrade or not to degrade: Mechanisms and significance of endocytic recycling. Nat. Rev. Mol. Cell Biol. 2018, 19, 679–696. [Google Scholar] [CrossRef]
- Doody, A.M.; Antosh, A.L.; Brown, W.J. Cytoplasmic phospholipase A2 antagonists inhibit multiple endocytic membrane trafficking pathways. Biochem. Biophys. Res. Commun. 2009, 388, 695–699. [Google Scholar] [CrossRef]
- Sousa, D.; Lima, R.T.; Vasconcelos, M.H. Intercellular Transfer of Cancer Drug Resistance Traits by Extracellular Vesicles. Trends Mol. Med. 2015, 21, 595–608. [Google Scholar] [CrossRef]
- Xiao, X.; Yu, S.; Li, S.; Wu, J.; Ma, R.; Cao, H.; Zhu, Y.; Feng, J. Exosomes: Decreased sensitivity of lung cancer A549 cells to cisplatin. PLoS ONE 2014, 9, e89534. [Google Scholar] [CrossRef]
- King, H.W.; Michael, M.Z.; Gleadle, J.M. Hypoxic enhancement of exosome release by breast cancer cells. BMC Cancer 2012, 12, 1–10. [Google Scholar] [CrossRef]
- Kanemoto, S.; Nitani, R.; Murakami, T.; Kaneko, M.; Asada, R.; Matsuhisa, K.; Saito, A.; Imaizumi, K. Multivesicular body formation enhancement and exosome release during endoplasmic reticulum stress. Biochem. Biophys. Res. Commun. 2016, 480, 166–172. [Google Scholar] [CrossRef]
- Lopes-Rodrigues, V.; Di Luca, A.; Sousa, D.; Seca, H.; Meleady, P.; Henry, M.; Lima, R.T.; O’Connor, R.; Vasconcelos, M.H. Data supporting the shedding of larger extracellular vesicles by multidrug resistant tumour cells. Data Brief 2016, 6, 1023–1027. [Google Scholar] [CrossRef]
- Roseblade, A.; Luk, F.; Ung, A.; Bebawy, M. Targeting Microparticle Biogenesis: A Novel Approach to the Circumvention of Cancer Multidrug Resistance. Curr. Cancer Drug Targets 2015, 15, 205–214. [Google Scholar] [CrossRef] [PubMed]
- Goler-Baron, V.; Sladkevich, I.; Assaraf, Y.G. Inhibition of the PI3K-Akt signaling pathway disrupts ABCG2-rich extracellular vesicles and overcomes multidrug resistance in breast cancer cells. Biochem. Pharmacol. 2012, 83, 1340–1348. [Google Scholar] [CrossRef]
- Yin, J.; Yan, X.; Yao, X.; Zhang, Y.; Shan, Y.; Mao, N.; Yang, Y.; Pan, L. Secretion of annexin A3 from ovarian cancer cells and its association with platinum resistance in ovarian cancer patients. J. Cell. Mol. Med. 2012, 16, 337–348. [Google Scholar] [CrossRef]
- Aung, T.; Chapuy, B.; Vogel, D.; Wenzel, D.; Oppermann, M.; Lahmann, M.; Weinhage, T.; Menck, K.; Hupfeld, T.; Koch, R.; et al. Exosomal evasion of humoral immunotherapy in aggressive B-cell lymphoma modulated by ATP-binding cassette transporter A3. Proc. Natl. Acad. Sci. USA 2011, 108, 15336–15341. [Google Scholar] [CrossRef] [PubMed]
- Homma, Y.; Kinoshita, R.; Kuchitsu, Y.; Wawro, P.S.; Marubashi, S.; Oguchi, M.E.; Ishida, M.; Fujita, N.; Fukuda, M. Comprehensive knockout analysis of the Rab family GTPases in epithelial cells. J. Cell Biol. 2019, 218, 2035–2050. [Google Scholar] [CrossRef]
- Savina, A.; Vidal, M.; Colombo, M.I. The exosome pathway in K562 cells is regulated by Rab11. J. Cell Sci. 2002, 115, 2505–2515. [Google Scholar] [CrossRef]
- Drücker, P.; Pejic, M.; Galla, H.-J.; Gerke, V. Lipid Segregation and Membrane Budding Induced by the Peripheral Membrane Binding Protein Annexin A2*. J. Biol. Chem. 2013, 288, 24764–24776. [Google Scholar] [CrossRef] [PubMed]
- Beer, K.B.; Wehman, A.M. Mechanisms and functions of extracellular vesicle release in vivo—What we can learn from flies and worms. Cell Adhes. Migr. 2017, 11, 135–150. [Google Scholar] [CrossRef] [PubMed]
- Camus, G.; Morales, C.S.; Molle, D.; Lopez-Vergès, S.; Begon-Pescia, C.; Cazevieille, C.; Schu, P.; Bertrand, E.; Berlioz-Torrent, C.; Basyuk, E. The Clathrin Adaptor Complex AP-1 Binds HIV-1 and MLV Gag and Facilitates Their Budding. Mol. Biol. Cell 2007, 18, 3193–3203. [Google Scholar] [CrossRef] [PubMed]
- Mori, Y.; Koike, M.; Moriishi, E.; Kawabata, A.; Tang, H.; Oyaizu, H.; Uchiyama, Y.; Yamanishi, K. Human Herpesvirus-6 Induces MVB Formation, and Virus Egress Occurs by an Exosomal Release Pathway. Traffic 2008, 9, 1728–1742. [Google Scholar] [CrossRef]
- Park, S.W.; Schonhoff, C.M.; Webster, C.R.L.; Anwer, M.S. Rab11, but not Rab4, facilitates cyclic AMP- and tauroursodeoxycholate-induced MRP2 translocation to the plasma membrane. Am. J. Physiol. Liver Physiol. 2014, 307, G863–G870. [Google Scholar] [CrossRef]
- Li, J.; Jin, Q.; Huang, F.; Tang, Z.; Huang, J. Effects of Rab27A and Rab27B on Invasion, Proliferation, Apoptosis, and Chemoresistance in Human Pancreatic Cancer Cells. Pancreas 2017, 46, 1173–1179. [Google Scholar] [CrossRef]
- Yousaf, M.; Ali, M. Modulation of ABCG2 surface expression by Rab5 and Rab21 to overcome multidrug resistance in cancer cells. Xenobiotica 2020, 50, 988–996. [Google Scholar] [CrossRef]
- Lai, C.P.-K.; Kim, E.Y.; Badr, C.E.; Weissleder, R.; Mempel, T.R.; Tannous, B.A.; Breakefield, X.O. Visualization and tracking of tumour extracellular vesicle delivery and RNA translation using multiplexed reporters. Nat. Commun. 2015, 6, 1–12. [Google Scholar] [CrossRef]
- Rana, S.; Yue, S.; Stadel, D.; Zöller, M. Toward tailored exosomes: The exosomal tetraspanin web contributes to target cell selection. Int. J. Biochem. Cell Biol. 2012, 44, 1574–1584. [Google Scholar] [CrossRef]
- Zech, D.; Rana, S.; Büchler, M.W.; Zöller, M. Tumor-exosomes and leukocyte activation: An ambivalent crosstalk. Cell Commun. Signal. 2012, 10, 1–7. [Google Scholar] [CrossRef]
- Mulcahy, L.A.; Pink, R.C.; Carter, D.R.F. Routes and mechanisms of extracellular vesicle uptake. J. Extracell. Vesicles 2014, 3, 24641. [Google Scholar] [CrossRef]
- Abels, E.R.; Breakefield, X.O. Introduction to Extracellular Vesicles: Biogenesis, RNA Cargo Selection, Content, Release, and Uptake. Cell. Mol. Neurobiol. 2016, 36, 301–312. [Google Scholar] [CrossRef]
- Meister, M.; Tikkanen, R. Endocytic Trafficking of Membrane-Bound Cargo: A Flotillin Point of View. Membranes 2014, 4, 356–371. [Google Scholar] [CrossRef] [PubMed]
- Otto, G.; Nichols, B.J. The roles of flotillin microdomains—Endocytosis and beyond. J. Cell Sci. 2011, 124, 3933–3940. [Google Scholar] [CrossRef]
- Lopes-Rodrigues, V.; Di Luca, A.; Mleczko, J.; Meleady, P.; Henry, M.; Pesic, M.; Cabrera, D.; van Liempd, S.; Lima, R.T.; O’Connor, R.; et al. Identification of the metabolic alterations associated with the multidrug resistant phenotype in cancer and their intercellular transfer mediated by extracellular vesicles. Sci. Rep. 2017, 7, srep44541. [Google Scholar] [CrossRef]
- Lavie, Y.; Fiucci, G.; Liscovitch, M. Upregulation of caveolin in multidrug resistant cancer cells: Functional implications. Adv. Drug Deliv. Rev. 2001, 49, 317–323. [Google Scholar] [CrossRef]
- Huotari, J.; Helenius, A. Endosome maturation. EMBO J. 2011, 30, 3481–3500. [Google Scholar] [CrossRef]
- Liang, X.-J.; Mukherjee, S.; Shen, D.-W.; Maxfield, F.; Gottesman, M.M. Endocytic Recycling Compartments Altered in Cisplatin-Resistant Cancer Cells. Cancer Res. 2006, 66, 2346–2353. [Google Scholar] [CrossRef][Green Version]
- Liang, X.-J.; Shen, D.-W.; Garfield, S.; Gottesman, M.M. Mislocalization of membrane proteins associated with multidrug resistance in cisplatin-resistant cancer cell lines. Cancer Res. 2003, 63, 5909–5916. [Google Scholar] [PubMed]
- Chauhan, S.S.; Liang, X.J.; Su, A.W.; Pai-Panandiker, A.; Shen, D.W.; Hanover, J.A.; Gottesman, M.M. Reduced endocytosis and altered lysosome function in cisplatin-resistant cell lines. Br. J. Cancer 2003, 88, 1327–1334. [Google Scholar] [CrossRef]
- Pisco, A.O.; Jackson, D.A.; Huang, S. Reduced Intracellular Drug Accumulation in Drug-Resistant Leukemia Cells is Not Only Solely Due to MDR-Mediated Efflux but also to Decreased Uptake. Front. Oncol. 2014, 4, 306. [Google Scholar] [CrossRef]
- Guerra, F.; Paiano, A.; Migoni, D.; Girolimetti, G.; Perrone, A.M.; De Iaco, P.; Fanizzi, F.P.; Gasparre, G.; Bucci, C. Modulation of RAB7A Protein Expression Determines Resistance to Cisplatin through Late Endocytic Pathway Impairment and Extracellular Vesicular Secretion. Cancers 2019, 11, 52. [Google Scholar] [CrossRef]
- Wang, X.; Qiao, D.; Chen, L.; Xu, M.; Chen, S.; Huang, L.; Wang, F.; Chen, Z.; Cai, J.; Fu, L. Chemotherapeutic drugs stimulate the release and recycling of extracellular vesicles to assist cancer cells in developing an urgent chemoresistance. Mol. Cancer 2019, 18, 1–18. [Google Scholar] [CrossRef]
- Tu, C.; Du, Z.; Zhang, H.; Feng, Y.; Qi, Y.; Zheng, Y.; Liu, J.; Wang, J. Endocytic pathway inhibition attenuates extracellular vesicle-induced reduction of chemosensitivity to bortezomib in multiple myeloma cells. Theranostics 2021, 11, 2364–2380. [Google Scholar] [CrossRef] [PubMed]
- Pesic, M.; Markovic, J.; Jankovic, D.; Kanazir, S.; Marković, I.; Rakić, L.; Ruždijić, S. Induced Resistance in the Human Non-Small Cell Lung Carcinoma (NCI-H460) Cell Line In Vitro by Anticancer Drugs. J. Chemother. 2006, 18, 66–73. [Google Scholar] [CrossRef] [PubMed]
- Podolski-Renić, A.; Jadranin, M.; Stanković, T.; Banković, J.; Stojković, S.; Chiourea, M.; Aljancic, I.; Vajs, V.; Tesevic, V.; Ruzdijic, S.; et al. Molecular and cytogenetic changes in multi-drug resistant cancer cells and their influence on new compounds testing. Cancer Chemother. Pharmacol. 2013, 72, 683–697. [Google Scholar] [CrossRef] [PubMed]
- Marie, J.P.; Faussat-Suberville, A.M.; Zhou, D.; Zittoun, R. Daunorubicin uptake by leukemic cells: Correlations with treatment outcome and mdr1 expression. Leukemia 1993, 7, 825–831. [Google Scholar] [PubMed]
- Seca, H.; Lima, R.T.; Guimarães, J.E.; Vasconcelos, M.H. Simultaneous targeting of P-gp and XIAP with siRNAs increases sensitivity of P-gp overexpressing CML cells to imatinib. Hematology 2011, 16, 100–108. [Google Scholar] [CrossRef]
- Théry, C.; Amigorena, S.; Raposo, G.; Clayton, A. Isolation and Characterization of Exosomes from Cell Culture Supernatants and Biological Fluids. Curr. Protoc. Cell Biol. 2006, 30, 3–22. [Google Scholar] [CrossRef] [PubMed]
- Lima, M.; João, S.D.; Lima, R.T.; Carvalho, A.M.; Ferreira, I.C.F.R.; Vasconcelos, M.H. Flower extracts of Filipendula ulmaria (L.) Maxim inhibit the proliferation of the NCI-H460 tumour cell line. Indust. Crops Prod. 2014, 59, 149–153. [Google Scholar] [CrossRef]
- Sommer, C.; Strähle, C.; Köthe, U.; Hamprecht, F.A. ilastik: Interactive Learning and Segmentation Toolkit. In Proceedings of the 2011 IEEE International Symposium on Biomedical Imaging: From Nano to Macro, Chicago, IL, USA, 30 March–2 April 2011; pp. 230–233. [Google Scholar]
- McQuin, C.; Goodman, A.; Chernyshev, V.; Kamentsky, L.; Cimini, B.A.; Karhohs, K.W.; Doan, M.; Ding, L.; Rafelski, S.M.; Thirstrup, D.; et al. CellProfiler 3.0: Next-generation image processing for biology. PLoS Biol. 2018, 16, e2005970. [Google Scholar] [CrossRef] [PubMed]
- Barbosa, J.; Lima, R.T.; Sousa, D.; Gomes, A.S.; Palmeira, A.; Seca, H.; Choosang, K.; Pakkong, P.; Bousbaa, H.; Pinto, M.M.M.; et al. Screening a Small Library of Xanthones for Antitumor Activity and Identification of a Hit Compound which Induces Apoptosis. Molecules 2016, 21, 81. [Google Scholar] [CrossRef] [PubMed]


Publisher’s Note: MDPI stays neutral with regard to jurisdictional claims in published maps and institutional affiliations. |
© 2021 by the authors. Licensee MDPI, Basel, Switzerland. This article is an open access article distributed under the terms and conditions of the Creative Commons Attribution (CC BY) license (https://creativecommons.org/licenses/by/4.0/).
Share and Cite
Sousa, D.; Lima, R.T.; Lopes-Rodrigues, V.; Gonzalez, E.; Royo, F.; Xavier, C.P.R.; Falcón-Pérez, J.M.; Vasconcelos, M.H. Different Ability of Multidrug-Resistant and -Sensitive Counterpart Cells to Release and Capture Extracellular Vesicles. Cells 2021, 10, 2886. https://doi.org/10.3390/cells10112886
Sousa D, Lima RT, Lopes-Rodrigues V, Gonzalez E, Royo F, Xavier CPR, Falcón-Pérez JM, Vasconcelos MH. Different Ability of Multidrug-Resistant and -Sensitive Counterpart Cells to Release and Capture Extracellular Vesicles. Cells. 2021; 10(11):2886. https://doi.org/10.3390/cells10112886
Chicago/Turabian StyleSousa, Diana, Raquel T. Lima, Vanessa Lopes-Rodrigues, Esperanza Gonzalez, Félix Royo, Cristina P. R. Xavier, Juan M. Falcón-Pérez, and M. Helena Vasconcelos. 2021. "Different Ability of Multidrug-Resistant and -Sensitive Counterpart Cells to Release and Capture Extracellular Vesicles" Cells 10, no. 11: 2886. https://doi.org/10.3390/cells10112886
APA StyleSousa, D., Lima, R. T., Lopes-Rodrigues, V., Gonzalez, E., Royo, F., Xavier, C. P. R., Falcón-Pérez, J. M., & Vasconcelos, M. H. (2021). Different Ability of Multidrug-Resistant and -Sensitive Counterpart Cells to Release and Capture Extracellular Vesicles. Cells, 10(11), 2886. https://doi.org/10.3390/cells10112886