
CK1BP Reduces α-Synuclein Oligomerization and Aggregation Independent of Serine 129 Phosphorylation


Abstract
:1. Introduction
2. Materials and Methods
2.1. Cell Culture and Transfection
2.2. Cell Lysis and Sample Preparation
2.3. Western Blot
2.4. Fluorescence Microscopy
2.5. Flow Cytometry and FACS Analysis
2.6. Statistical Analysis
3. Results
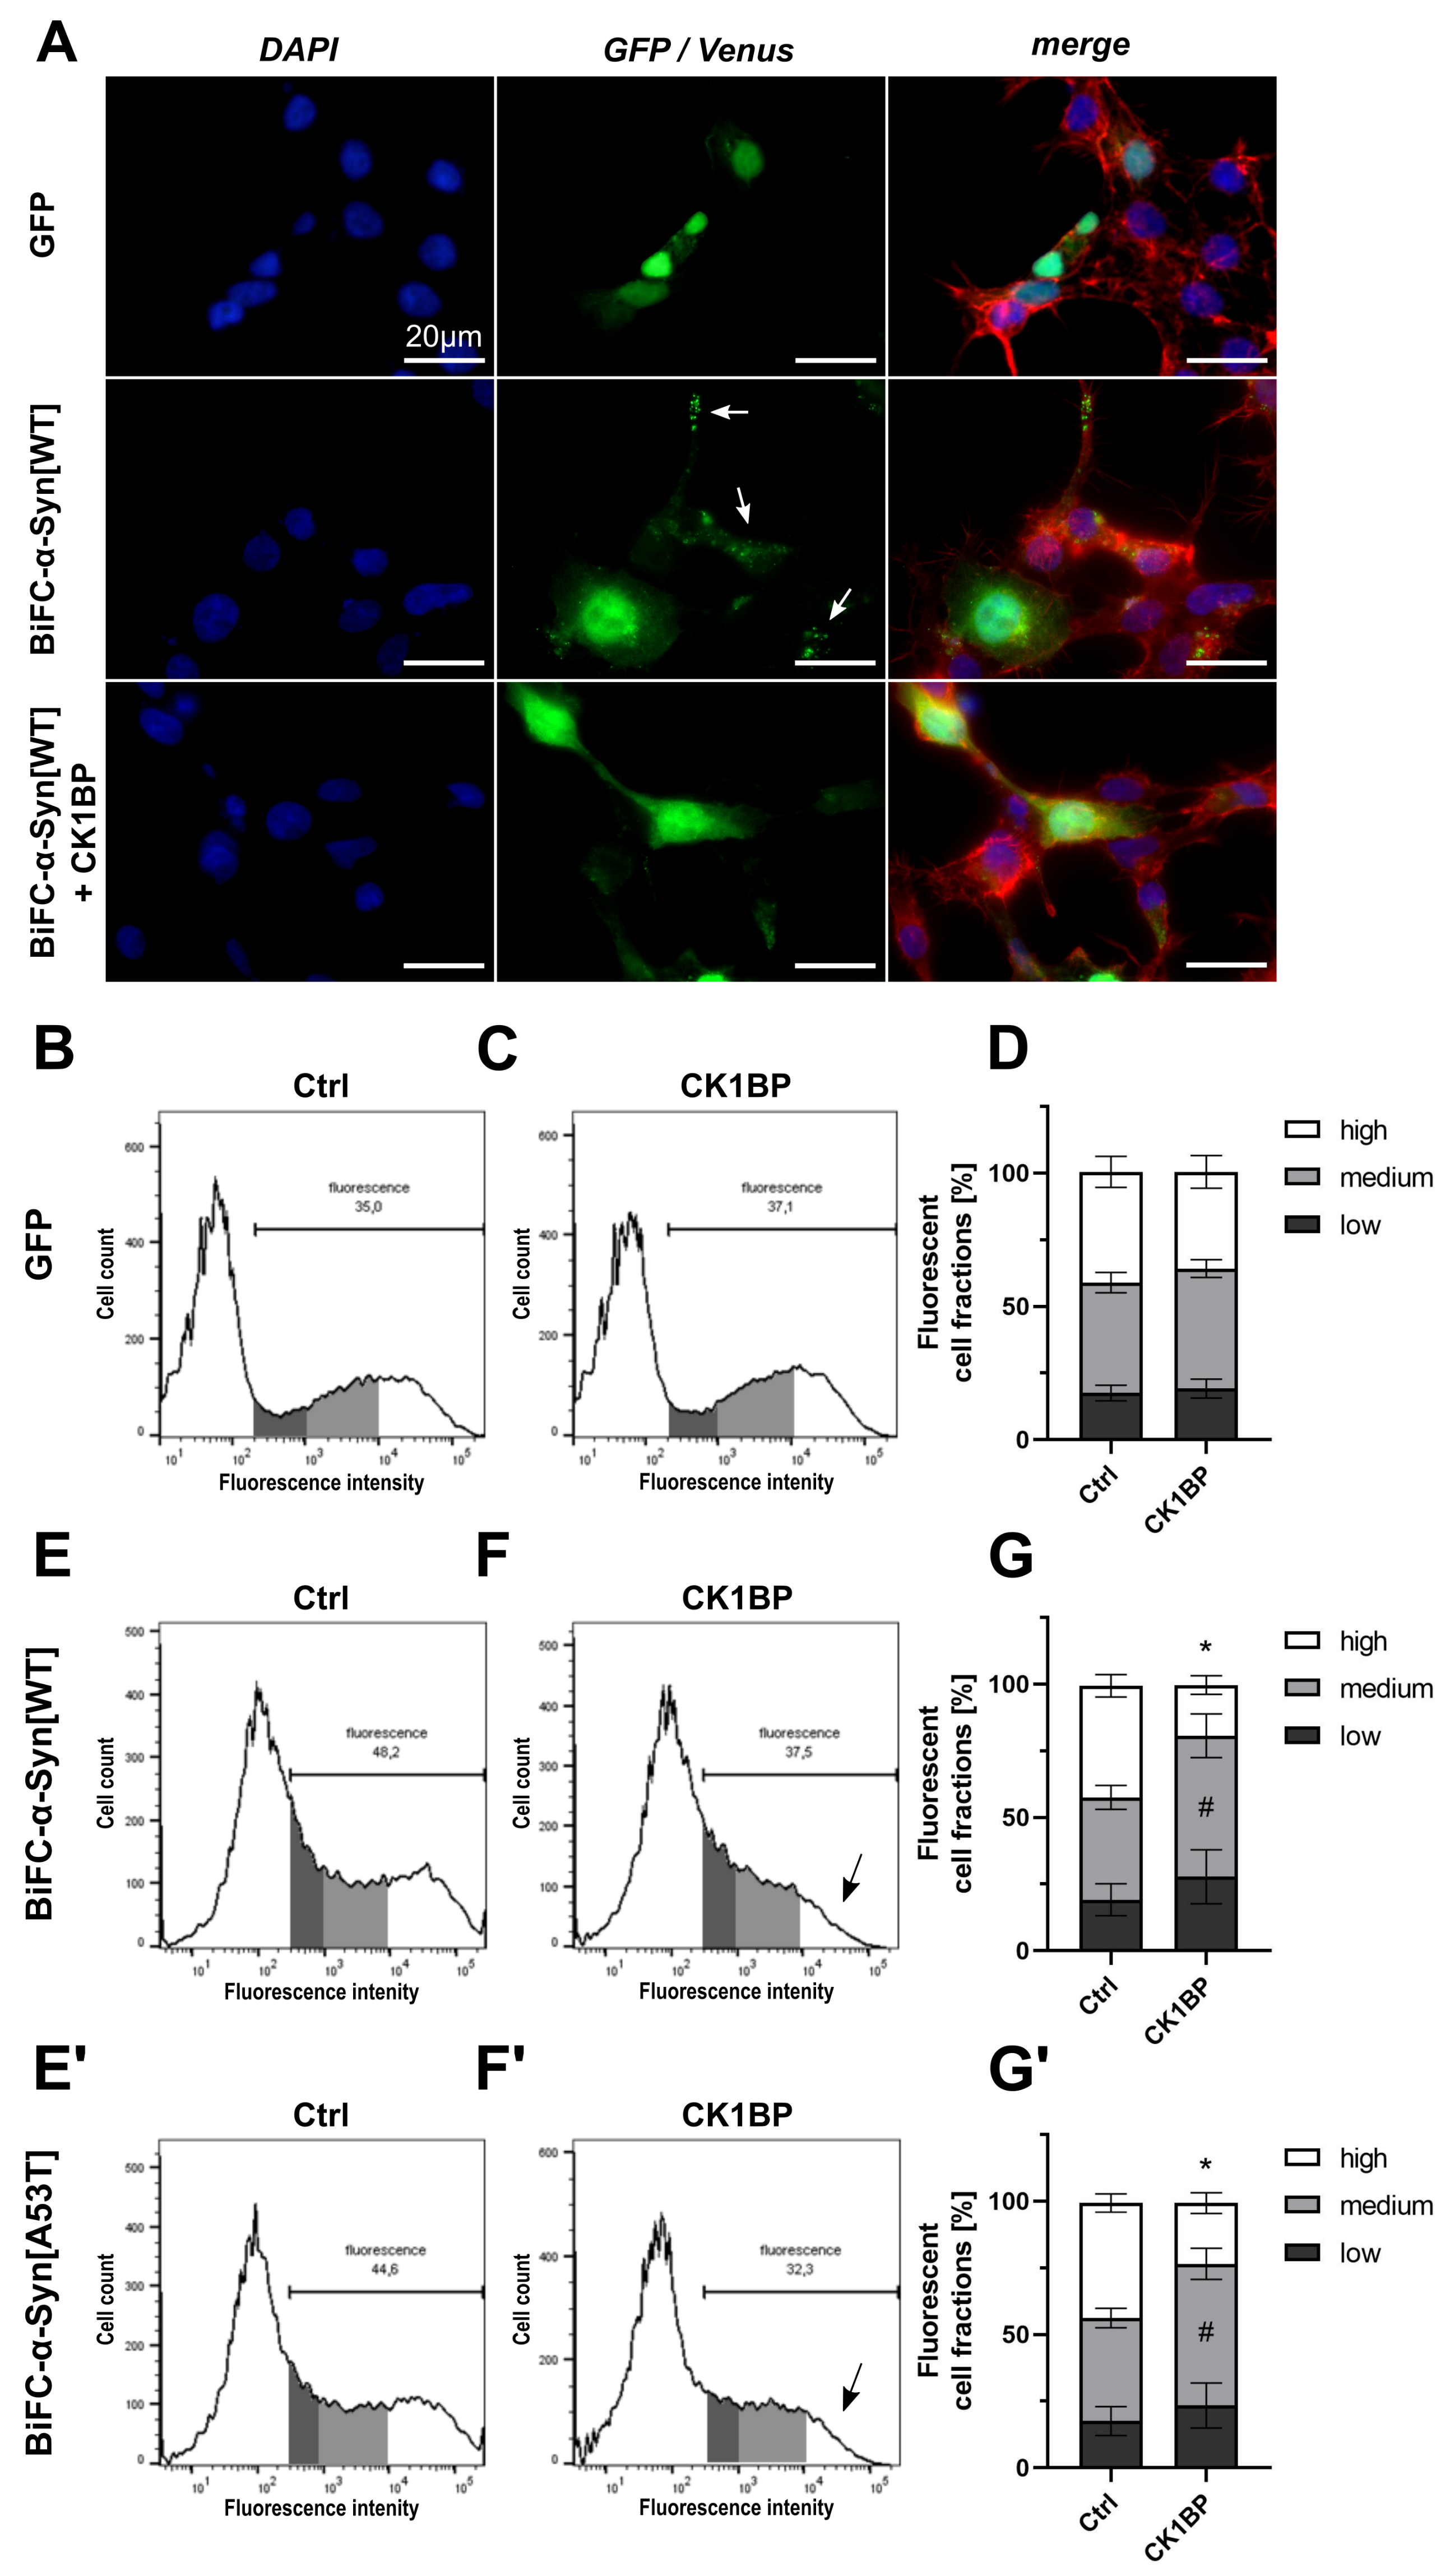
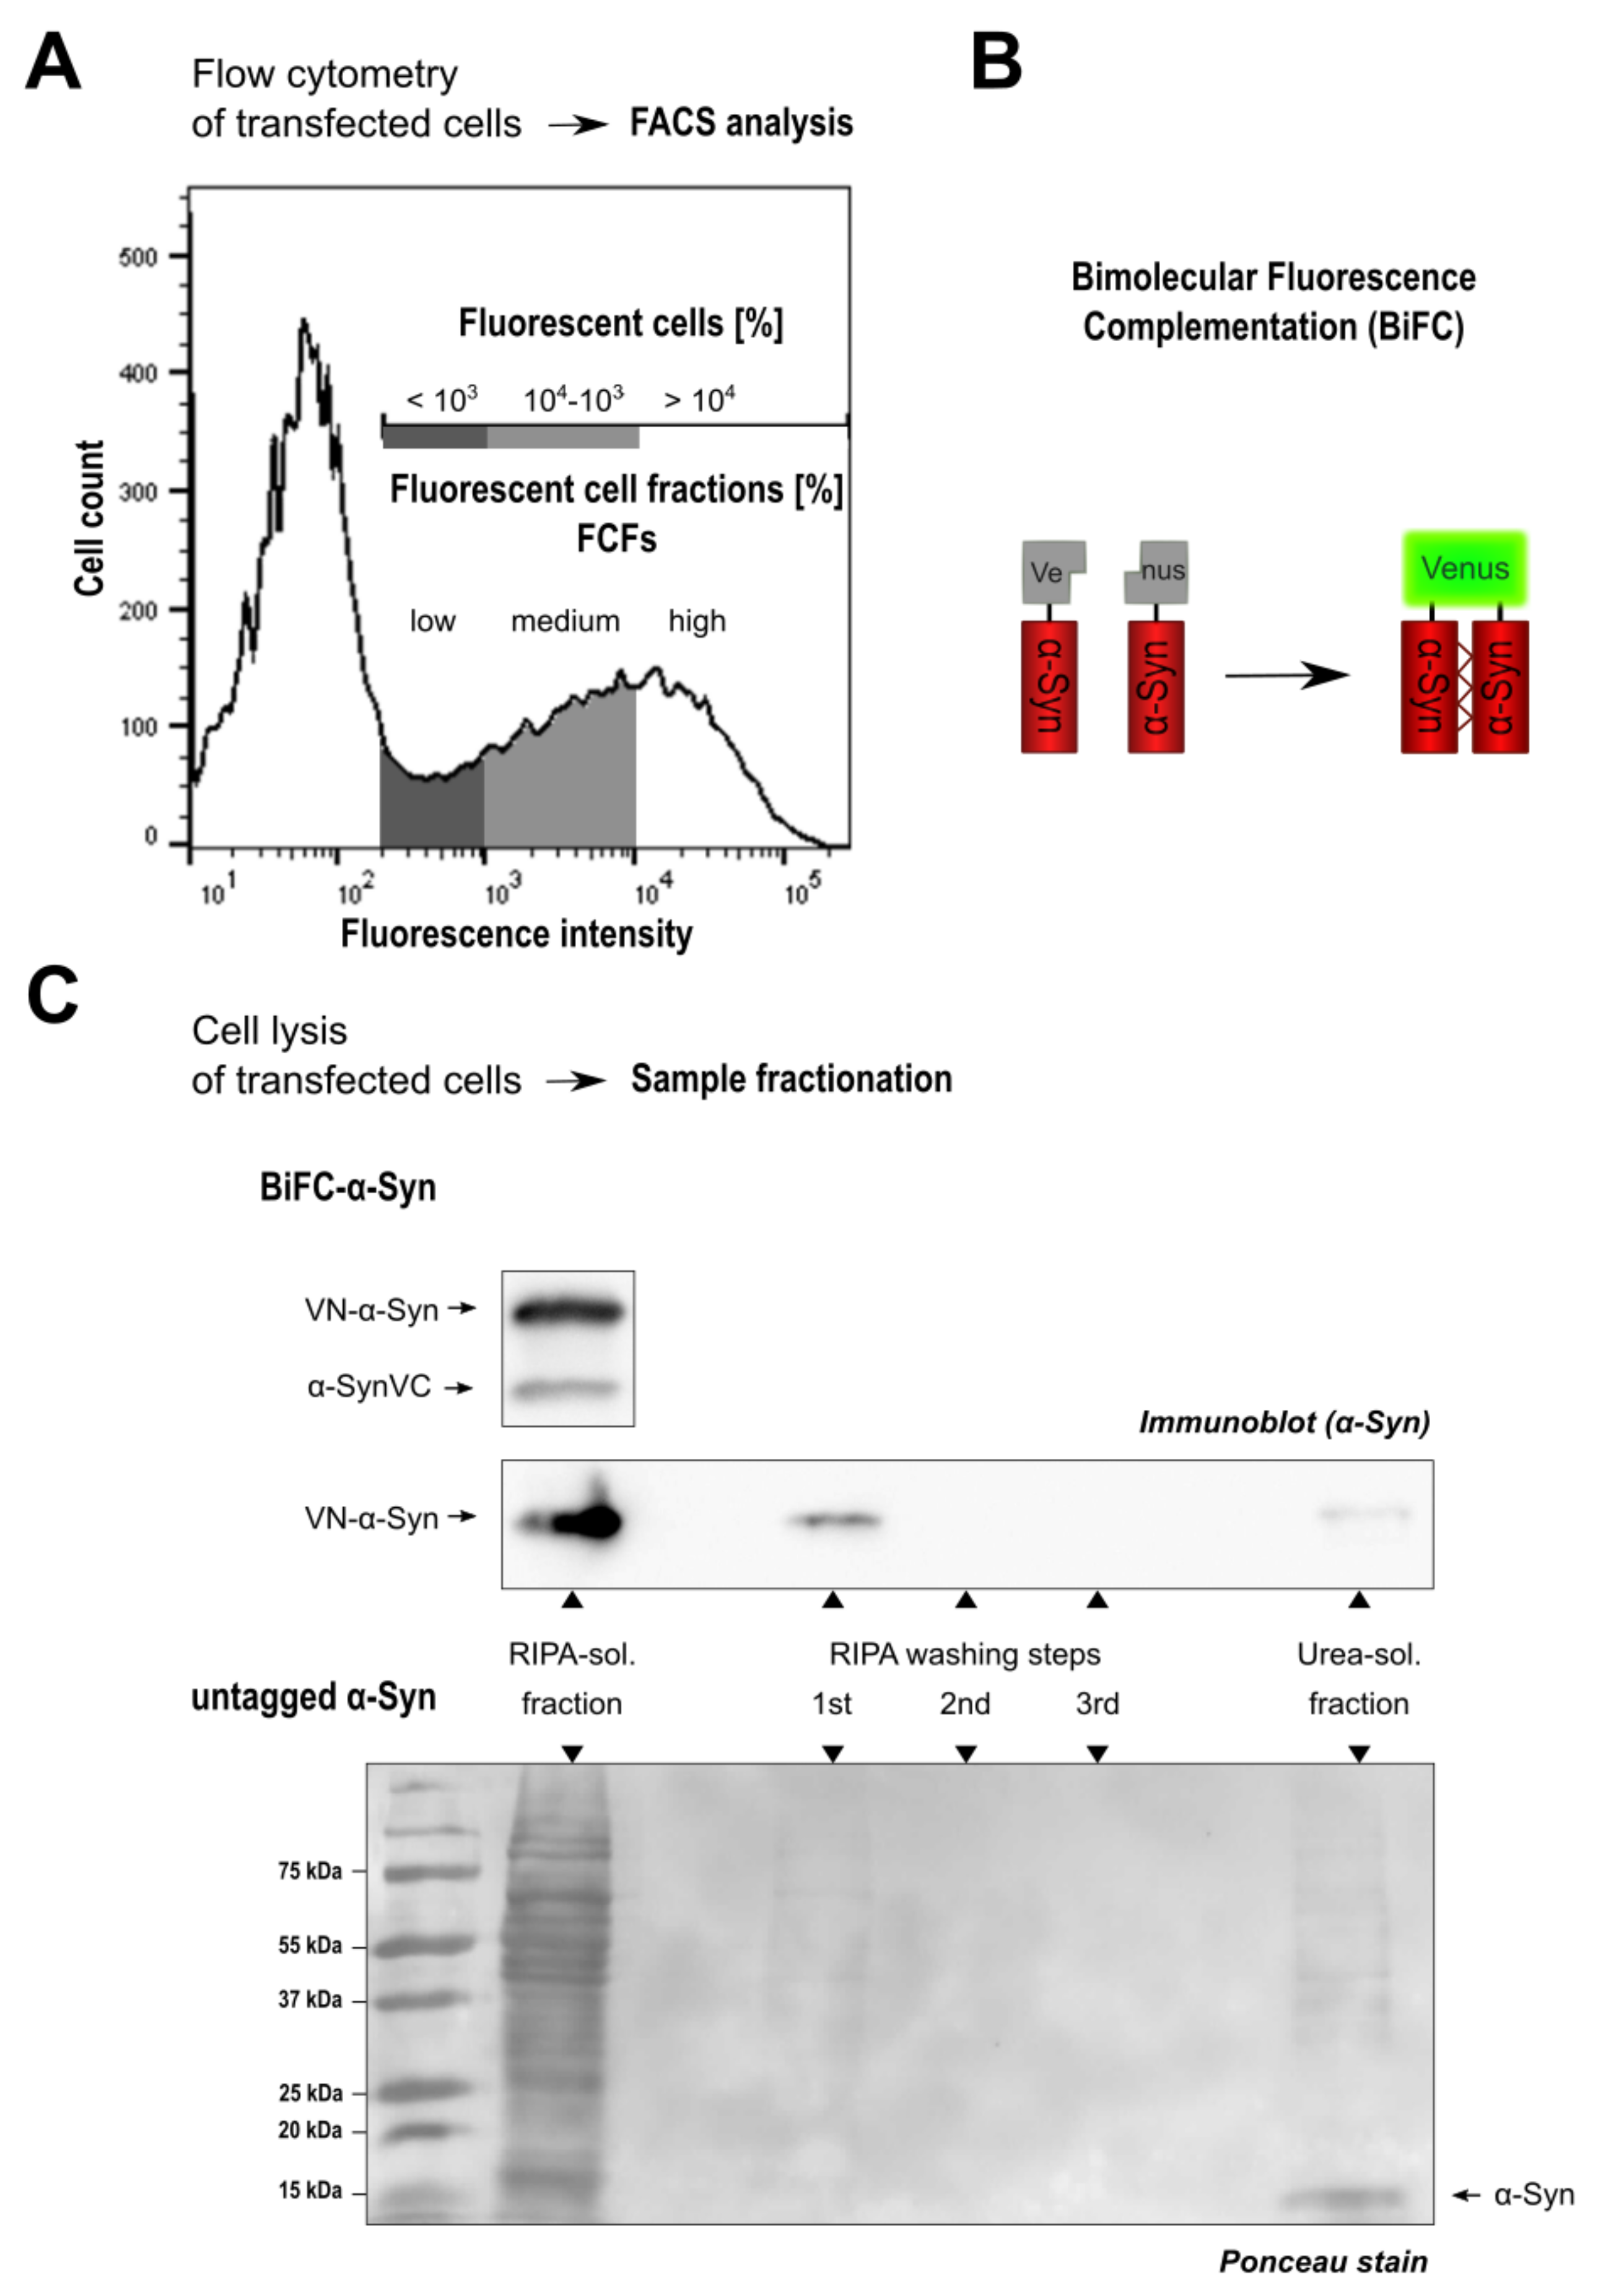
3.1. Monitoring Intracellular -Syn Oligomerization with BiFC
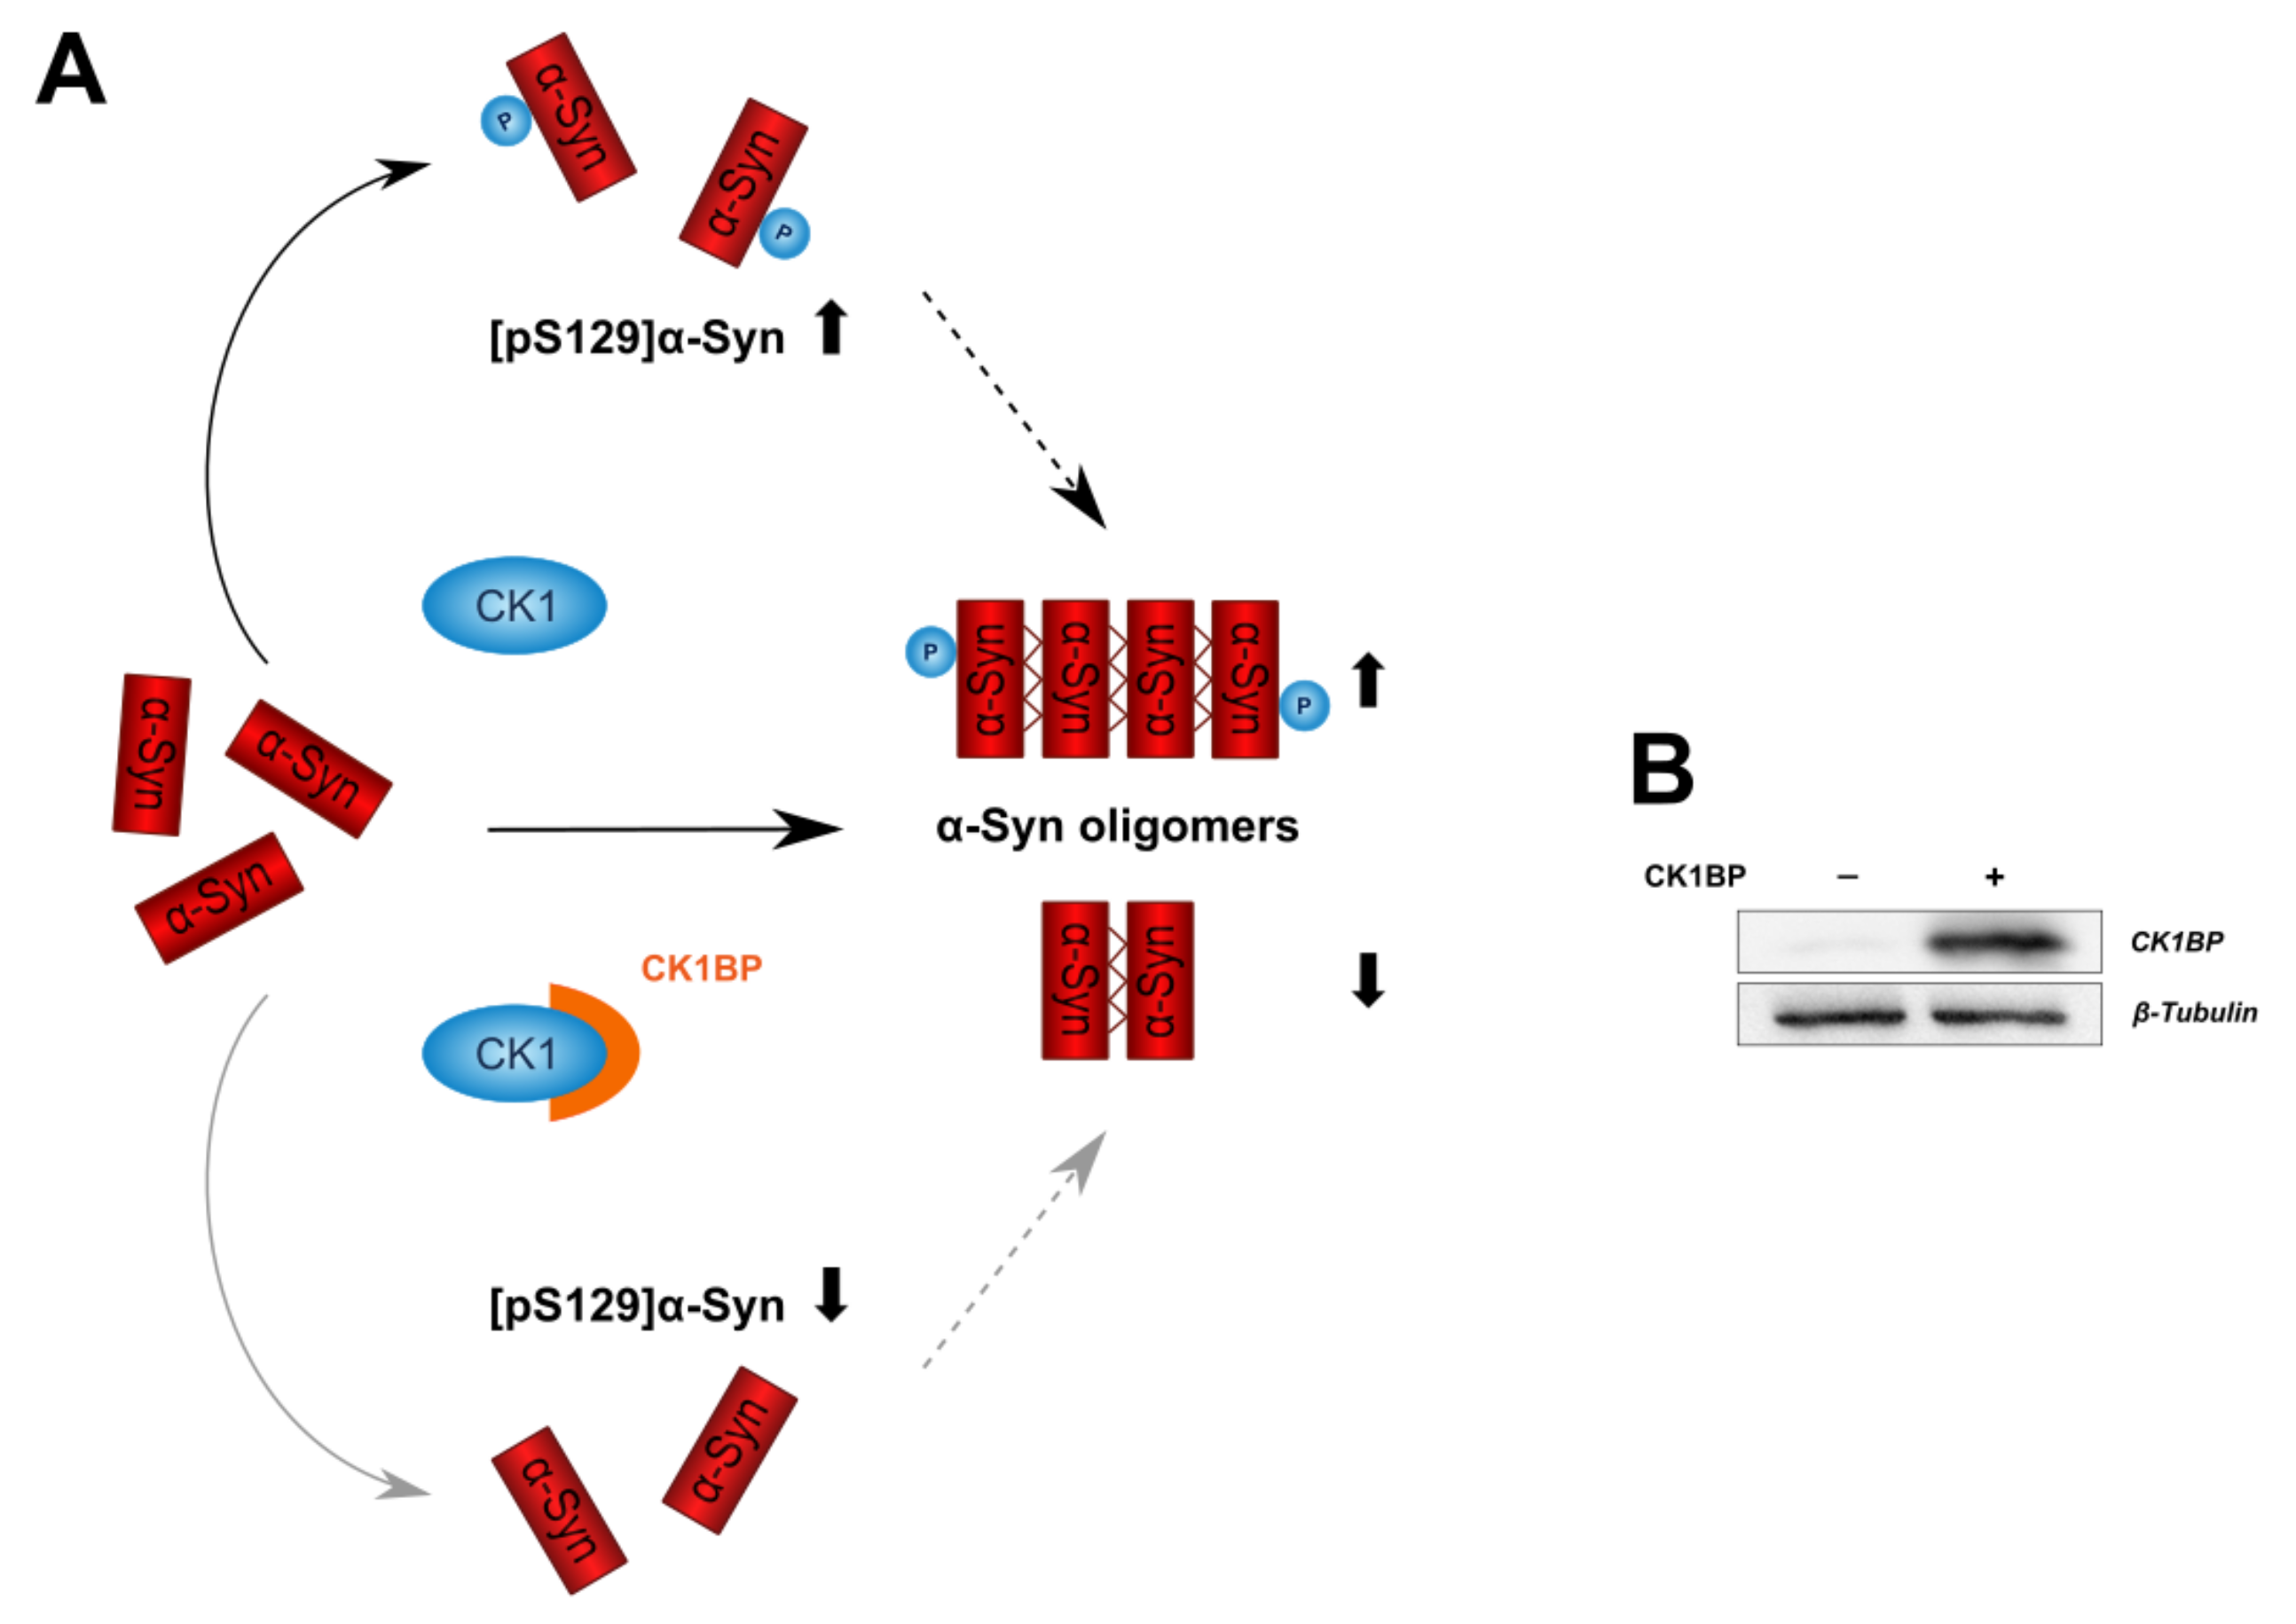
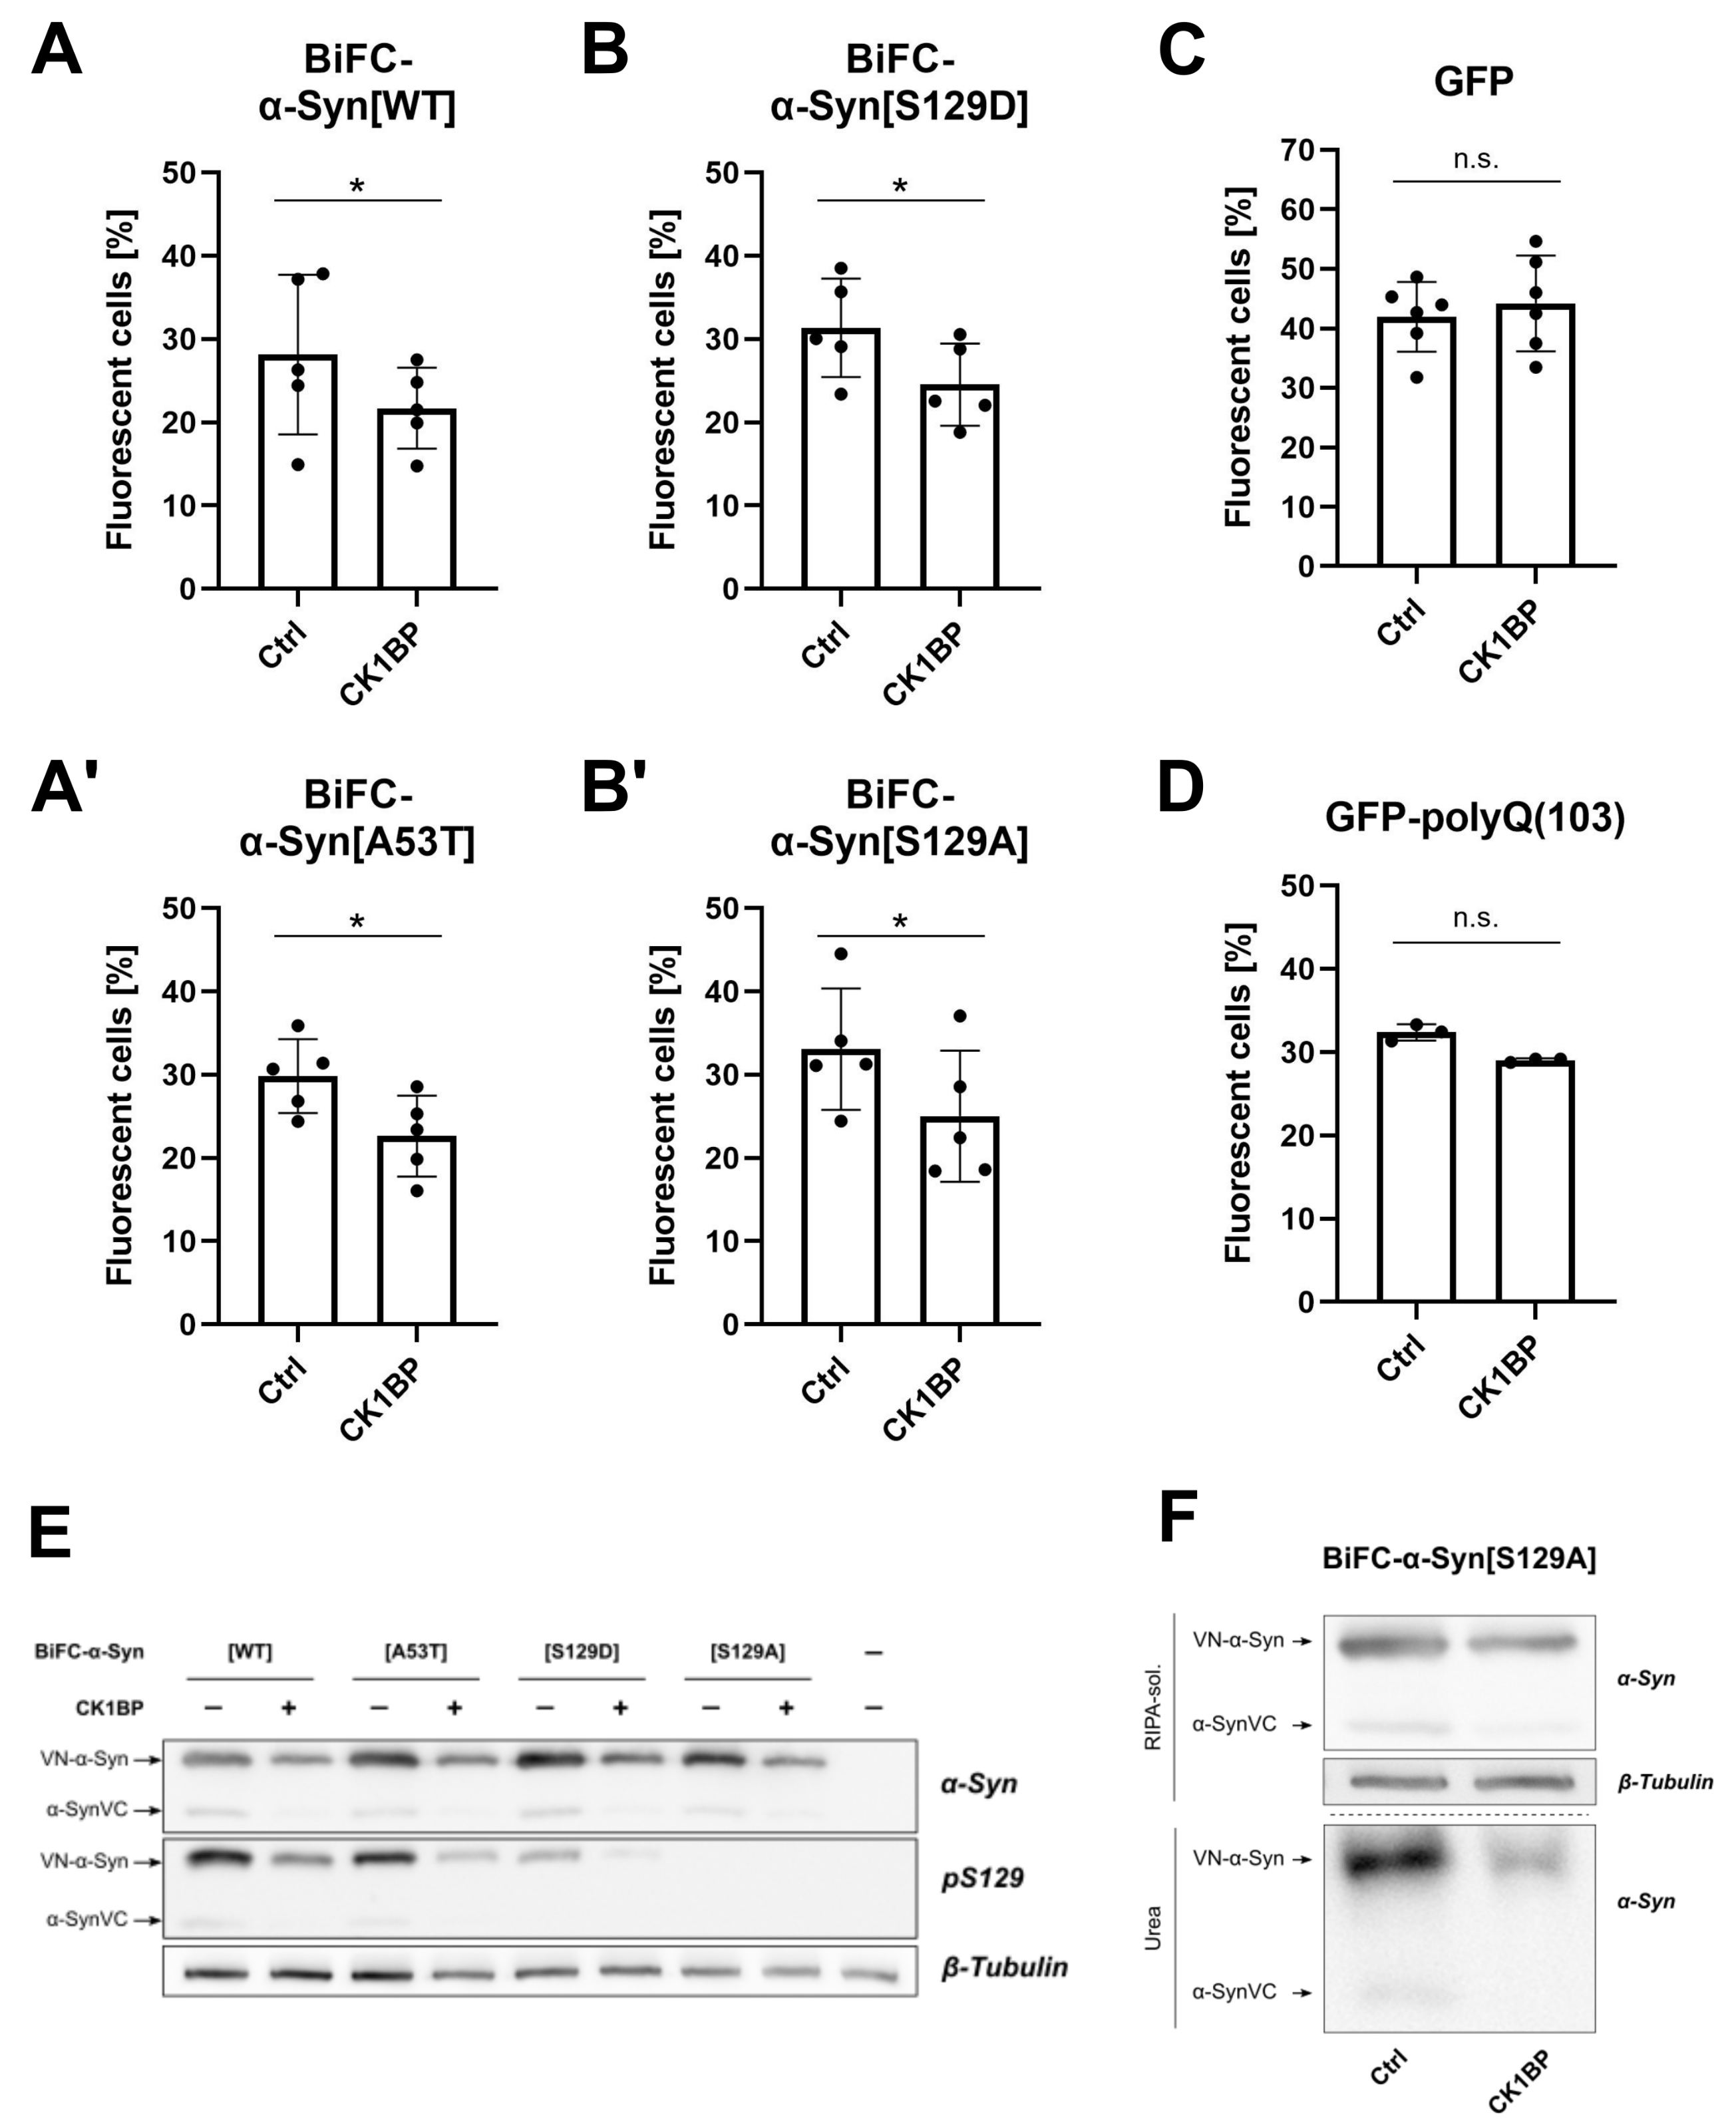
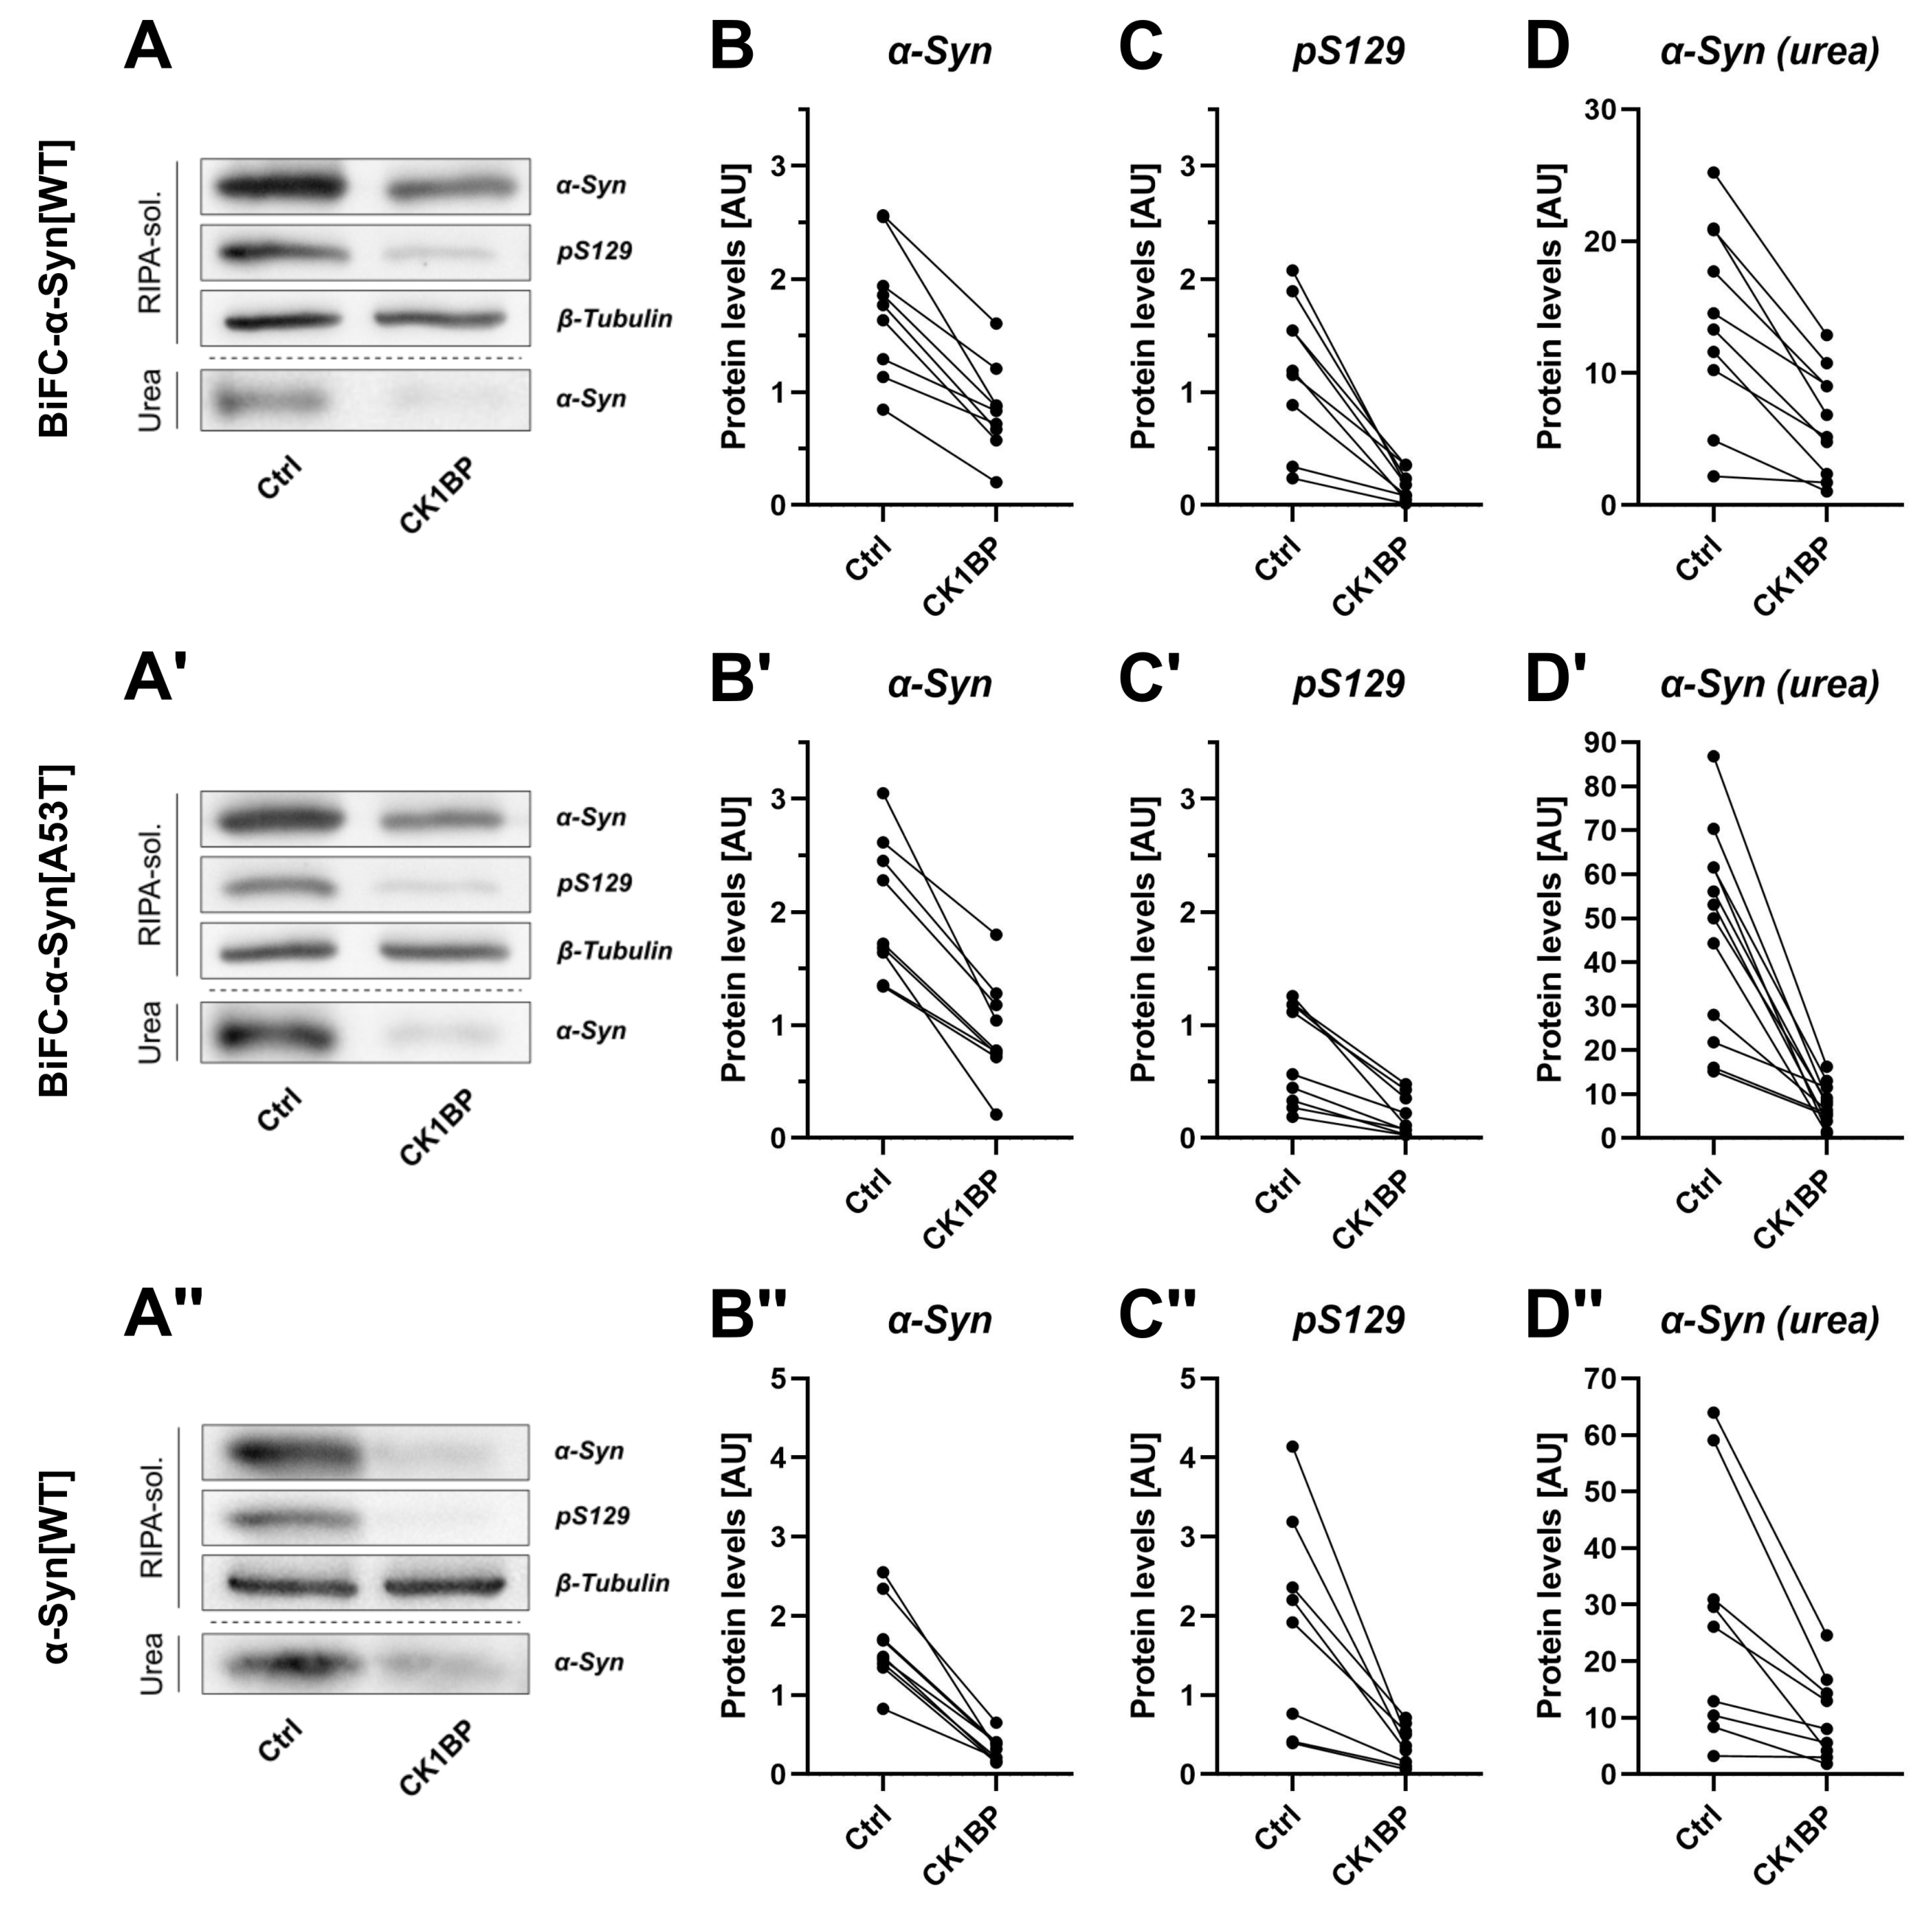
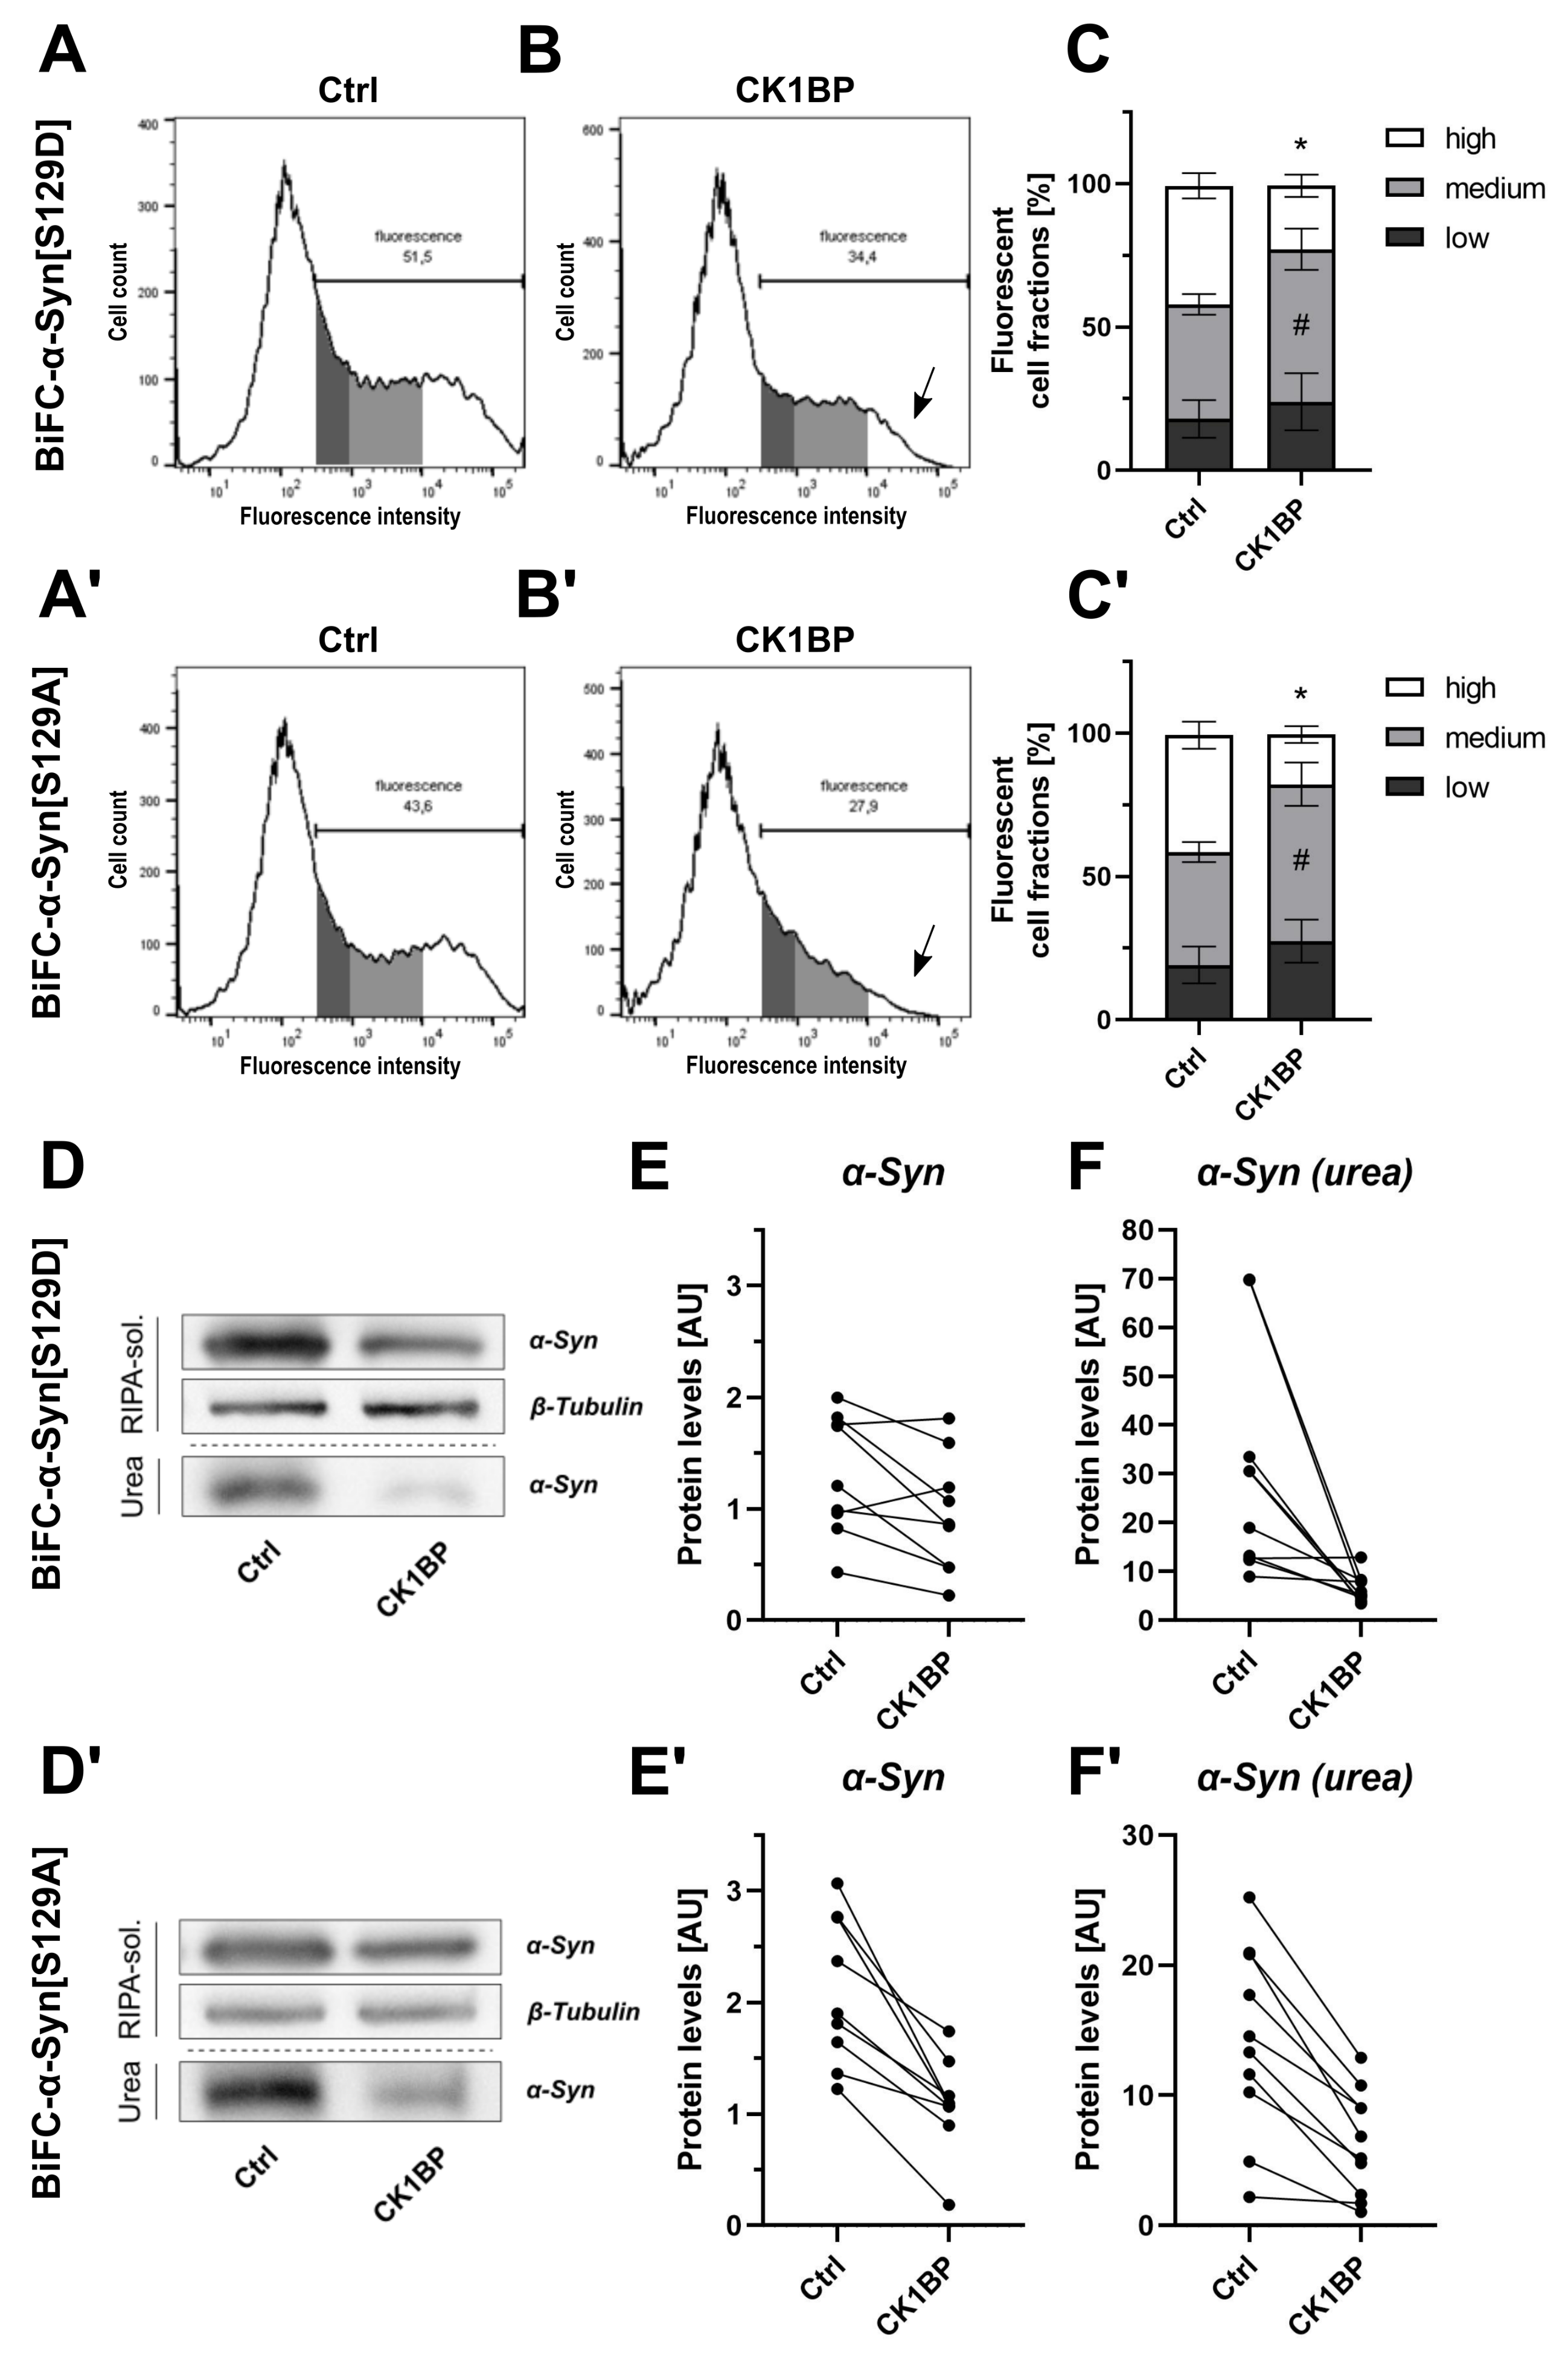
3.2. CK1BP Reduces -Syn Accumulation Independent of S129 Phosphorylation
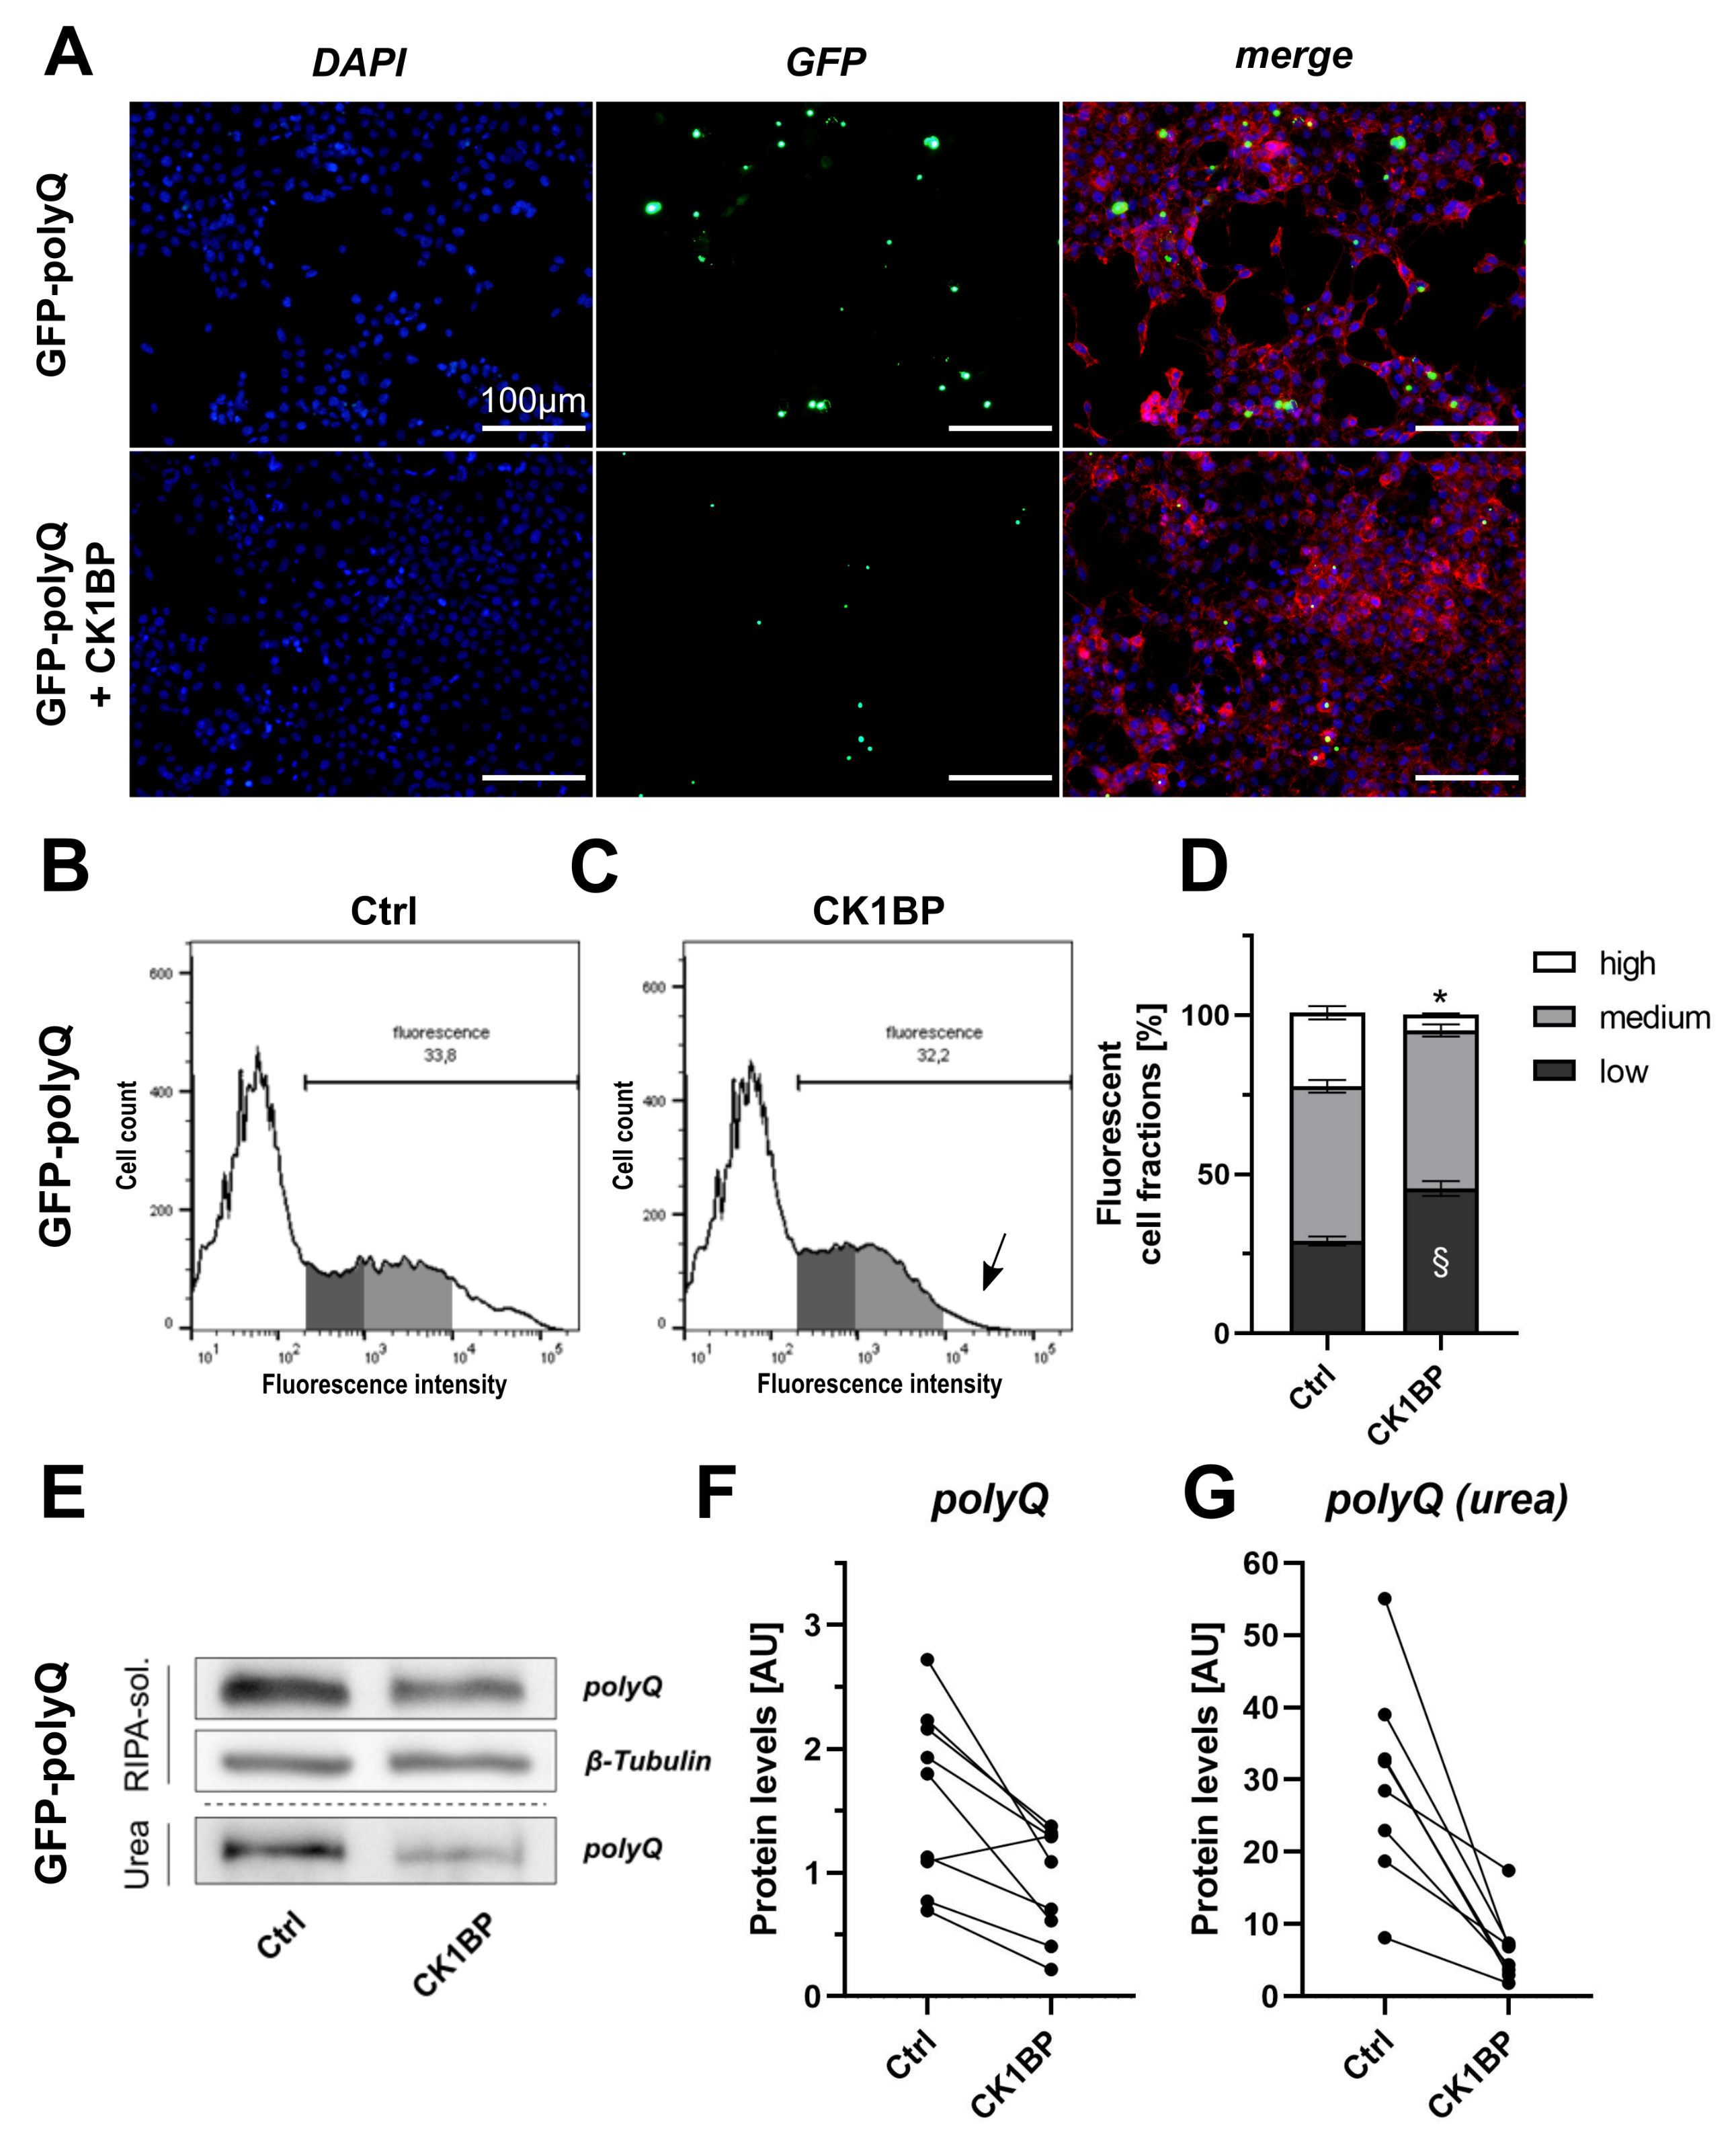
3.3. CK1BP Decreases Accumulation of a Polyglutamine Peptide
4. Discussion
Supplementary Materials
Author Contributions
Funding
Institutional Review Board Statement
Informed Consent Statement
Data Availability Statement
Acknowledgments
Conflicts of Interest
Appendix A


References
- Iwai, A.; Masliah, E.; Yoshimoto, M.; Ge, N.; Flanagan, L.; Rohan de Silva, H.; Kittel, A.; Saitoh, T. The precursor protein of non-Aβ component of Alzheimer’s disease amyloid is a presynaptic protein of the central nervous system. Neuron 1995, 14, 467–475. [Google Scholar] [CrossRef] [Green Version]
- Baba, M.; Nakajo, S.; Tu, P.H.; Tomita, T.; Nakaya, K.; Lee, V.M.; Trojanowski, J.Q.; Iwatsubo, T. Aggregation of alpha-synuclein in Lewy bodies of sporadic Parkinson’s disease and dementia with Lewy bodies. Am. J. Pathol. 1998, 152, 879–884. [Google Scholar]
- Grazia Spillantini, M.; Anthony Crowther, R.; Jakes, R.; Cairns, N.J.; Lantos, P.L.; Goedert, M. Filamentous α-synuclein inclusions link multiple system atrophy with Parkinson’s disease and dementia with Lewy bodies. Neurosci. Lett. 1998, 251, 205–208. [Google Scholar] [CrossRef]
- Chartier-Harlin, M.C.; Kachergus, J.; Roumier, C.; Mouroux, V.; Douay, X.; Lincoln, S.; Levecque, C.; Larvor, L.; Andrieux, J.; Hulihan, M.; et al. α-synuclein locus duplication as a cause of familial Parkinson’s disease. Lancet 2004, 364, 1167–1169. [Google Scholar] [CrossRef]
- Ibáñez, P.; Bonnet, A.M.; Débarges, B.; Lohmann, E.; Tison, F.; Agid, Y.; Dürr, A.; Brice, A.; Pollak, P. Causal relation between α-synuclein locus duplication as a cause of familial Parkinson’s disease. Lancet 2004, 364, 1169–1171. [Google Scholar] [CrossRef]
- Singleton, A.B.; Farrer, M.; Johnson, J.; Singleton, A.; Hague, S.; Kachergus, J.; Hulihan, M.; Peuralinna, T.; Dutra, A.; Nussbaum, R.; et al. α-Synuclein locus triplication causes Parkinson’s disease. Science 2003, 302, 841. [Google Scholar] [CrossRef] [Green Version]
- Polymeropoulos, M.H.; Lavedan, C.; Leroy, E.; Ide, S.E.; Dehejia, A.; Dutra, A.; Pike, B.; Root, H.; Rubenstein, J.; Boyer, R.; et al. Mutation in the α-synuclein gene identified in families with Parkinson’s disease. Science 1997, 276, 2045–2047. [Google Scholar] [CrossRef] [Green Version]
- Fujiwara, H.; Hasegawa, M.; Dohmae, N.; Kawashima, A.; Masliah, E.; Goldberg, M.S.; Shen, J.; Takio, K.; Iwatsubo, T. α-Synuclein is phosphorylated in synucleinopathy lesions. Nat. Cell Biol. 2002, 4, 160–164. [Google Scholar] [CrossRef]
- Zhou, J.; Broe, M.; Huang, Y.; Anderson, J.P.; Gai, W.P.; Milward, E.A.; Porritt, M.; Howells, D.; Hughes, A.J.; Wang, X.; et al. Changes in the solubility and phosphorylation of α-synuclein over the course of Parkinson’s disease. Acta Neuropathol. 2011, 121, 695–704. [Google Scholar] [CrossRef]
- Tofaris, G.K.; Razzaq, A.; Ghetti, B.; Lilley, K.S.; Spillantini, M.G. Ubiquitination of α-synuclein in Lewy bodies is a pathological event not associated with impairment of proteasome function. J. Biol. Chem. 2003, 278, 44405–44411. [Google Scholar] [CrossRef] [Green Version]
- Markesbery, W.R.; Jicha, G.A.; Liu, H.; Schmitt, F.A. Lewy body pathology in normal elderly subjects. J. Neuropathol. Exp. Neurol. 2009, 68, 816–822. [Google Scholar] [CrossRef]
- Villar-Piqué, A.; Da Lopes Fonseca, T.; Sant’Anna, R.; Szegö, É.M.; Fonseca-Ornelas, L.; Pinho, R.; Carija, A.; Gerhardt, E.; Masaracchia, C.; Abad Gonzalez, E.; et al. Environmental and genetic factors support the dissociation between α-synuclein aggregation and toxicity. Proc. Natl. Acad. Sci. USA 2016, 113, E6506–E6515. [Google Scholar] [CrossRef] [Green Version]
- Klucken, J.; Ingelsson, M.; Shin, Y.; Irizarry, M.C.; Hedley-Whyte, E.T.; Frosch, M.; Growdon, J.; McLean, P.; Hyman, B.T. Clinical and biochemical correlates of insoluble α-synuclein in dementia with Lewy bodies. Acta Neuropathol. 2006, 111, 101–108. [Google Scholar] [CrossRef]
- Opazo, F.; Krenz, A.; Heermann, S.; Schulz, J.B.; Falkenburger, B.H. Accumulation and clearance of α-synuclein aggregates demonstrated by time-lapse imaging. J. Neurochem. 2008, 106, 529–540. [Google Scholar] [CrossRef]
- Roberts, R.F.; Wade-Martins, R.; Alegre-Abarrategui, J. Direct visualization of α-synuclein oligomers reveals previously undetected pathology in Parkinson’s disease brain. Brain J. Neurol. 2015, 138, 1642–1657. [Google Scholar] [CrossRef] [Green Version]
- Cremades, N.; Cohen, S.I.A.; Deas, E.; Abramov, A.Y.; Chen, A.Y.; Orte, A.; Sandal, M.; Clarke, R.W.; Dunne, P.; Aprile, F.A.; et al. Direct observation of the interconversion of normal and toxic forms of α-synuclein. Cell 2012, 149, 1048–1059. [Google Scholar] [CrossRef] [Green Version]
- Vaikath, N.N.; Erskine, D.; Morris, C.M.; Majbour, N.K.; Vekrellis, K.; Li, J.Y.; El-Agnaf, O.M.A. Heterogeneity in α-synuclein subtypes and their expression in cortical brain tissue lysates from Lewy body diseases and Alzheimer’s disease. Neuropathol. Appl. Neurobiol. 2019, 45, 597–608. [Google Scholar] [CrossRef]
- Paleologou, K.E.; Kragh, C.L.; Mann, D.M.A.; Salem, S.A.; Al-Shami, R.; Allsop, D.; Hassan, A.H.; Jensen, P.H.; El-Agnaf, O.M.A. Detection of elevated levels of soluble α-synuclein oligomers in post-mortem brain extracts from patients with dementia with Lewy bodies. Brain J. Neurol. 2009, 132, 1093–1101. [Google Scholar] [CrossRef] [Green Version]
- Sharon, R.; Bar-Joseph, I.; Frosch, M.P.; Walsh, D.M.; Hamilton, J.A.; Selkoe, D.J. The Formation of Highly Soluble Oligomers of α-Synuclein Is Regulated by Fatty Acids and Enhanced in Parkinson’s Disease. Neuron 2003, 37, 583–595. [Google Scholar] [CrossRef] [Green Version]
- Karpinar, D.P.; Balija, M.B.G.; Kügler, S.; Opazo, F.; Rezaei-Ghaleh, N.; Wender, N.; Kim, H.Y.; Taschenberger, G.; Falkenburger, B.H.; Heise, H.; et al. Pre-fibrillar α-synuclein variants with impaired β-structure increase neurotoxicity in Parkinson’s disease models. EMBO J. 2009, 28, 3256–3268. [Google Scholar] [CrossRef] [PubMed] [Green Version]
- Roostaee, A.; Beaudoin, S.; Staskevicius, A.; Roucou, X. Aggregation and neurotoxicity of recombinant α-synuclein aggregates initiated by dimerization. Mol. Neurodegener. 2013, 8, 5. [Google Scholar] [CrossRef] [Green Version]
- Winner, B.; Jappelli, R.; Maji, S.K.; Desplats, P.A.; Boyer, L.; Aigner, S.; Hetzer, C.; Loher, T.; Vilar, M.; Campioni, S.; et al. In vivo demonstration that α-synuclein oligomers are toxic. Proc. Natl. Acad. Sci. USA 2011, 108, 4194–4199. [Google Scholar] [CrossRef] [Green Version]
- Anderson, J.P.; Walker, D.E.; Goldstein, J.M.; de Laat, R.; Banducci, K.; Caccavello, R.J.; Barbour, R.; Huang, J.; Kling, K.; Lee, M.; et al. Phosphorylation of Ser-129 is the dominant pathological modification of α-synuclein in familial and sporadic Lewy body disease. J. Biol. Chem. 2006, 281, 29739–29752. [Google Scholar] [CrossRef] [Green Version]
- Ma, M.R.; Hu, Z.W.; Zhao, Y.F.; Chen, Y.X.; Li, Y.M. Phosphorylation induces distinct α-synuclein strain formation. Sci. Rep. 2016, 6, 37130. [Google Scholar] [CrossRef] [PubMed]
- Paleologou, K.E.; Schmid, A.W.; Rospigliosi, C.C.; Kim, H.Y.; Lamberto, G.R.; Fredenburg, R.A.; Lansbury, P.T.; Fernandez, C.O.; Eliezer, D.; Zweckstetter, M.; et al. Phosphorylation at Ser-129 but not the phosphomimics S129E/D inhibits the fibrillation of α-synuclein. J. Biol. Chem. 2008, 283, 16895–16905. [Google Scholar] [CrossRef] [Green Version]
- Tanji, K.; Mori, F.; Mimura, J.; Itoh, K.; Kakita, A.; Takahashi, H.; Wakabayashi, K. Proteinase K-resistant α-synuclein is deposited in presynapses in human Lewy body disease and A53T α-synuclein transgenic mice. Acta Neuropathol. 2010, 120, 145–154. [Google Scholar] [CrossRef] [PubMed]
- Waxman, E.A.; Giasson, B.I. Specificity and Regulation of Casein Kinase-Mediated Phosphorylation of α-Synuclein. J. Neuropathol. Exp. Neurol. 2008, 67, 402–416. [Google Scholar] [CrossRef] [PubMed] [Green Version]
- Mbefo, M.K.; Paleologou, K.E.; Boucharaba, A.; Oueslati, A.; Schell, H.; Fournier, M.; Olschewski, D.; Yin, G.; Zweckstetter, M.; Masliah, E.; et al. Phosphorylation of synucleins by members of the Polo-like kinase family. J. Biol. Chem. 2010, 285, 2807–2822. [Google Scholar] [CrossRef] [Green Version]
- Pronin, A.N.; Morris, A.J.; Surguchov, A.; Benovic, J.L. Synucleins are a novel class of substrates for G protein-coupled receptor kinases. J. Biol. Chem. 2000, 275, 26515–26522. [Google Scholar] [CrossRef] [Green Version]
- Dahmene, M.; Bérard, M.; Oueslati, A. Dissecting the Molecular Pathway Involved in PLK2 Kinase-mediated α-Synuclein-selective Autophagic Degradation. J. Biol. Chem. 2017, 292, 3919–3928. [Google Scholar] [CrossRef] [Green Version]
- Knippschild, U.; Krüger, M.; Richter, J.; Xu, P.; García-Reyes, B.; Peifer, C.; Halekotte, J.; Bakulev, V.; Bischof, J. The CK1 Family: Contribution to Cellular Stress Response and Its Role in Carcinogenesis. Front. Oncol. 2014, 4, 96. [Google Scholar] [CrossRef] [PubMed] [Green Version]
- Li, G.; Yin, H.; Kuret, J. Casein kinase 1 delta phosphorylates tau and disrupts its binding to microtubules. J. Biol. Chem. 2004, 279, 15938–15945. [Google Scholar] [CrossRef] [Green Version]
- Yasojima, K.; Kuret, J.; DeMaggio, A.J.; McGeer, E.; McGeer, P.L. Casein kinase 1 delta mRNA is upregulated in Alzheimer disease brain. Brain Res. 2000, 865, 116–120. [Google Scholar] [CrossRef]
- Prasad, V.; Wasser, Y.; Hans, F.; Goswami, A.; Katona, I.; Outeiro, T.F.; Kahle, P.J.; Schulz, J.B.; Voigt, A. Monitoring α-synuclein multimerization in vivo. Faseb J. Off. Publ. Fed. Am. Soc. Exp. Biol. 2019, 33, 2116–2131. [Google Scholar] [CrossRef] [Green Version]
- McFarland, M.A.; Ellis, C.E.; Markey, S.P.; Nussbaum, R.L. Proteomics analysis identifies phosphorylation-dependent α-synuclein protein interactions. Mol. Cell. Proteom. MCP 2008, 7, 2123–2137. [Google Scholar] [CrossRef] [Green Version]
- Yin, H.; Laguna, K.A.; Li, G.; Kuret, J. Dysbindin structural homologue CK1BP is an isoform-selective binding partner of human casein kinase-1. Biochemistry 2006, 45, 5297–5308. [Google Scholar] [CrossRef]
- Arroyo, R.; Duran-Frigola, M.; Berenguer, C.; Soler-López, M.; Aloy, P. Charting the molecular links between driver and susceptibility genes in colorectal cancer. Biochem. Biophys. Res. Commun. 2014, 445, 734–738. [Google Scholar] [CrossRef] [PubMed]
- Zhu, H.; Wu, T.C.; Chen, W.Q.; Zhou, L.J.; Wu, Y.; Zeng, L.; Pei, H.P. Screening for differentially expressed genes between left- and right-sided colon carcinoma by microarray analysis. Oncol. Lett. 2013, 6, 353–358. [Google Scholar] [CrossRef] [PubMed] [Green Version]
- Lucas, T.; Pratscher, B.; Fink, D.; Wolschek, M.; Samorapoompichit, P.; Schöfer, C.; Pehamberger, H.; Müller, M.; Sorensen, P.; Jansen, B. The human orthologue of a novel apoptosis response gene induced during rat myelomonocytic stem cell apoptosis maps to 20q13.12. Stem Cells Dev. 2005, 14, 556–563. [Google Scholar] [CrossRef]
- Tissue Expression of DBNDD2—Summary—The Human Protein Atlas. Available online: https://www.proteinatlas.org/ENSG00000244274-DBNDD2/tissue (accessed on 4 July 2021).
- Outeiro, T.F.; Putcha, P.; Tetzlaff, J.E.; Spoelgen, R.; Koker, M.; Carvalho, F.; Hyman, B.T.; McLean, P.J. Formation of toxic oligomeric α-synuclein species in living cells. PLoS ONE 2008, 3, e1867. [Google Scholar] [CrossRef]
- Frey, B.; AlOkda, A.; Jackson, M.P.; Riguet, N.; Duce, J.A.; Lashuel, H.A. Monitoring α-synuclein oligomerization and aggregation using bimolecular fluorescence complementation assays: What you see is not always what you get. J. Neurochem. 2021, 157, 872–888. [Google Scholar] [CrossRef]
- Lee, B.R.; Kamitani, T. Improved immunodetection of endogenous α-synuclein. PLoS ONE 2011, 6, e23939. [Google Scholar] [CrossRef] [Green Version]
- Kiechle, M.; von Einem, B.; Höfs, L.; Voehringer, P.; Grozdanov, V.; Markx, D.; Parlato, R.; Wiesner, D.; Mayer, B.; Sakk, O.; et al. In Vivo Protein Complementation Demonstrates Presynaptic α-Synuclein Oligomerization and Age-Dependent Accumulation of 8-16-mer Oligomer Species. Cell Rep. 2019, 29, 2862–2874.e9. [Google Scholar] [CrossRef] [Green Version]
- Lázaro, D.F.; Rodrigues, E.F.; Langohr, R.; Shahpasandzadeh, H.; Ribeiro, T.; Guerreiro, P.; Gerhardt, E.; Kröhnert, K.; Klucken, J.; Pereira, M.D.; et al. Systematic Comparison of the Effects of α-synuclein Mutations on Its Oligomerization and Aggregation. PLoS Genet. 2014, 10, e1004741. [Google Scholar] [CrossRef]
- Lee, M.K.; Stirling, W.; Xu, Y.; Xu, X.; Qui, D.; Mandir, A.S.; Dawson, T.M.; Copeland, N.G.; Jenkins, N.A.; Price, D.L. Human α-synuclein-harboring familial Parkinson’s disease-linked Ala-53—Thr mutation causes neurodegenerative disease with α-synuclein aggregation in transgenic mice. Proc. Natl. Acad. Sci. USA 2002, 99, 8968–8973. [Google Scholar] [CrossRef] [Green Version]
- Stoyas, C.A.; La Spada, A.R. Chapter 11—The CAG—polyglutamine repeat diseases: A clinical, molecular, genetic, and pathophysiologic nosology. In Handbook of Clinical Neurology: Neurogenetics, Part I; Geschwind, D.H., Paulson, H.L., Klein, C., Eds.; Elsevier: Amsterdam, The Netherlands, 2018; Volume 147, pp. 143–170. [Google Scholar] [CrossRef]
- Hu, C.D.; Chinenov, Y.; Kerppola, T.K. Visualization of Interactions among bZIP and Rel Family Proteins in Living Cells Using Bimolecular Fluorescence Complementation. Mol. Cell 2002, 9, 789–798. [Google Scholar] [CrossRef]
- Dettmer, U.; Newman, A.J.; Soldner, F.; Luth, E.S.; Kim, N.C.; von Saucken, V.E.; Sanderson, J.B.; Jaenisch, R.; Bartels, T.; Selkoe, D. Parkinson-causing α-synuclein missense mutations shift native tetramers to monomers as a mechanism for disease initiation. Nat. Commun. 2015, 6, 7314. [Google Scholar] [CrossRef] [Green Version]
- Cai, W.; Feng, D.; Schwarzschild, M.A.; McLean, P.J.; Chen, X. Bimolecular Fluorescence Complementation of α-synuclein Demonstrates its Oligomerization with Dopaminergic Phenotype in Mice. EBioMedicine 2018, 29, 13–22. [Google Scholar] [CrossRef] [Green Version]
- Dimant, H.; Kalia, S.K.; Kalia, L.V.; Zhu, L.N.; Kibuuka, L.; Ebrahimi-Fakhari, D.; McFarland, N.R.; Fan, Z.; Hyman, B.T.; McLean, P.J. Direct detection of alpha synuclein oligomers in vivo. Acta Neuropathol. Commun. 2013, 1, 6. [Google Scholar] [CrossRef] [Green Version]
- Moussaud, S.; Malany, S.; Mehta, A.; Vasile, S.; Smith, L.H.; McLean, P.J. Targeting α-synuclein oligomers by protein-fragment complementation for drug discovery in synucleinopathies. Expert Opin. Ther. Targets 2015, 19, 589–603. [Google Scholar] [CrossRef] [Green Version]
- Eckermann, K.; Kügler, S.; Bähr, M. Dimerization propensities of Synucleins are not predictive for Synuclein aggregation. Biochim. Biophys. Acta 2015, 1852, 1658–1664. [Google Scholar] [CrossRef] [Green Version]
- Kosten, J.; Binolfi, A.; Stuiver, M.; Verzini, S.; Theillet, F.X.; Bekei, B.; van Rossum, M.; Selenko, P. Efficient modification of α-synuclein serine 129 by protein kinase CK1 requires phosphorylation of tyrosine 125 as a priming event. ACS Chem. Neurosci. 2014, 5, 1203–1208. [Google Scholar] [CrossRef]
- Chau, K.Y.; Ching, H.L.; Schapira, A.H.V.; Cooper, J.M. Relationship between alpha synuclein phosphorylation, proteasomal inhibition and cell death: Relevance to Parkinson’s disease pathogenesis. J. Neurochem. 2009, 110, 1005–1013. [Google Scholar] [CrossRef]
- Legleiter, J.; Mitchell, E.; Lotz, G.P.; Sapp, E.; Ng, C.; DiFiglia, M.; Thompson, L.M.; Muchowski, P.J. Mutant huntingtin fragments form oligomers in a polyglutamine length-dependent manner in vitro and in vivo. J. Biol. Chem. 2010, 285, 14777–14790. [Google Scholar] [CrossRef] [Green Version]
- Kayed, R.; Head, E.; Thompson, J.L.; McIntire, T.M.; Milton, S.C.; Cotman, C.W.; Glabe, C.G. Common structure of soluble amyloid oligomers implies common mechanism of pathogenesis. Science 2003, 300, 486–489. [Google Scholar] [CrossRef] [Green Version]
- Bucciantini, M.; Giannoni, E.; Chiti, F.; Baroni, F.; Formigli, L.; Zurdo, J.; Taddei, N.; Ramponi, G.; Dobson, C.M.; Stefani, M. Inherent toxicity of aggregates implies a common mechanism for protein misfolding diseases. Nature 2002, 416, 507–511. [Google Scholar] [CrossRef]
- Danzer, K.M.; Haasen, D.; Karow, A.R.; Moussaud, S.; Habeck, M.; Giese, A.; Kretzschmar, H.; Hengerer, B.; Kostka, M. Different species of α-synuclein oligomers induce calcium influx and seeding. J. Neurosci. 2007, 27, 9220–9232. [Google Scholar] [CrossRef]
- Interaction Network of CK1BP. Available online: https://thebiogrid.org/120963 (accessed on 4 July 2021).

Publisher’s Note: MDPI stays neutral with regard to jurisdictional claims in published maps and institutional affiliations. |
© 2021 by the authors. Licensee MDPI, Basel, Switzerland. This article is an open access article distributed under the terms and conditions of the Creative Commons Attribution (CC BY) license (https://creativecommons.org/licenses/by/4.0/).
Share and Cite
Elsholz, L.; Wasser, Y.; Ziegler, P.; Habib, P.; Voigt, A. CK1BP Reduces α-Synuclein Oligomerization and Aggregation Independent of Serine 129 Phosphorylation. Cells 2021, 10, 2830. https://doi.org/10.3390/cells10112830
Elsholz L, Wasser Y, Ziegler P, Habib P, Voigt A. CK1BP Reduces α-Synuclein Oligomerization and Aggregation Independent of Serine 129 Phosphorylation. Cells. 2021; 10(11):2830. https://doi.org/10.3390/cells10112830
Chicago/Turabian StyleElsholz, Lea, Yasmine Wasser, Patrick Ziegler, Pardes Habib, and Aaron Voigt. 2021. "CK1BP Reduces α-Synuclein Oligomerization and Aggregation Independent of Serine 129 Phosphorylation" Cells 10, no. 11: 2830. https://doi.org/10.3390/cells10112830
APA StyleElsholz, L., Wasser, Y., Ziegler, P., Habib, P., & Voigt, A. (2021). CK1BP Reduces α-Synuclein Oligomerization and Aggregation Independent of Serine 129 Phosphorylation. Cells, 10(11), 2830. https://doi.org/10.3390/cells10112830