1. Introduction
Nonalcoholic fatty liver disease (NAFLD) includes various dysfunctions such as increased intrahepatic triglyceride content (steatosis), inflammation, and fibrosis [
1,
2]. The transition from fatty livers to more severe disease (steatohepatitis) is triggered by inflammation. Cholestasis (or decreased bile flow) is a marker of severity. Significant progress has been made to decrease the burden of NAFLD, but the translation of experimental treatments to the human disease has consistently failed [
3]. One of the reasons is that the mechanisms underlying the disease are numerous and complex. Nevertheless, these experimental models contribute to a better understanding of the disease.
Thus, NAFLD modifies the expression of transporters located on the basolateral and canalicular membranes of hepatocytes. Human Organic Anion Transporting Polypeptide B1/B3 (OATP1B1/B3) are not altered in steatosis, but their expression is decreased in patients with steatohepatitis [
4]. In contrast, the Multidrug Resistance Associated Protein 3 (MRP3) expression is increased in fatty livers and steatohepatitis. MRP2 is upregulated in steatohepatitis [
5]. The activity of these transporters determines the hepatocyte concentrations of endogenous substrates and drugs that might be unpredictable in fatty livers. Thus, patients with steatohepatitis have higher liver concentrations of mebrofenin (MEB, Choletec
®, Bracco imaging, Milan, Italy) than volunteers [
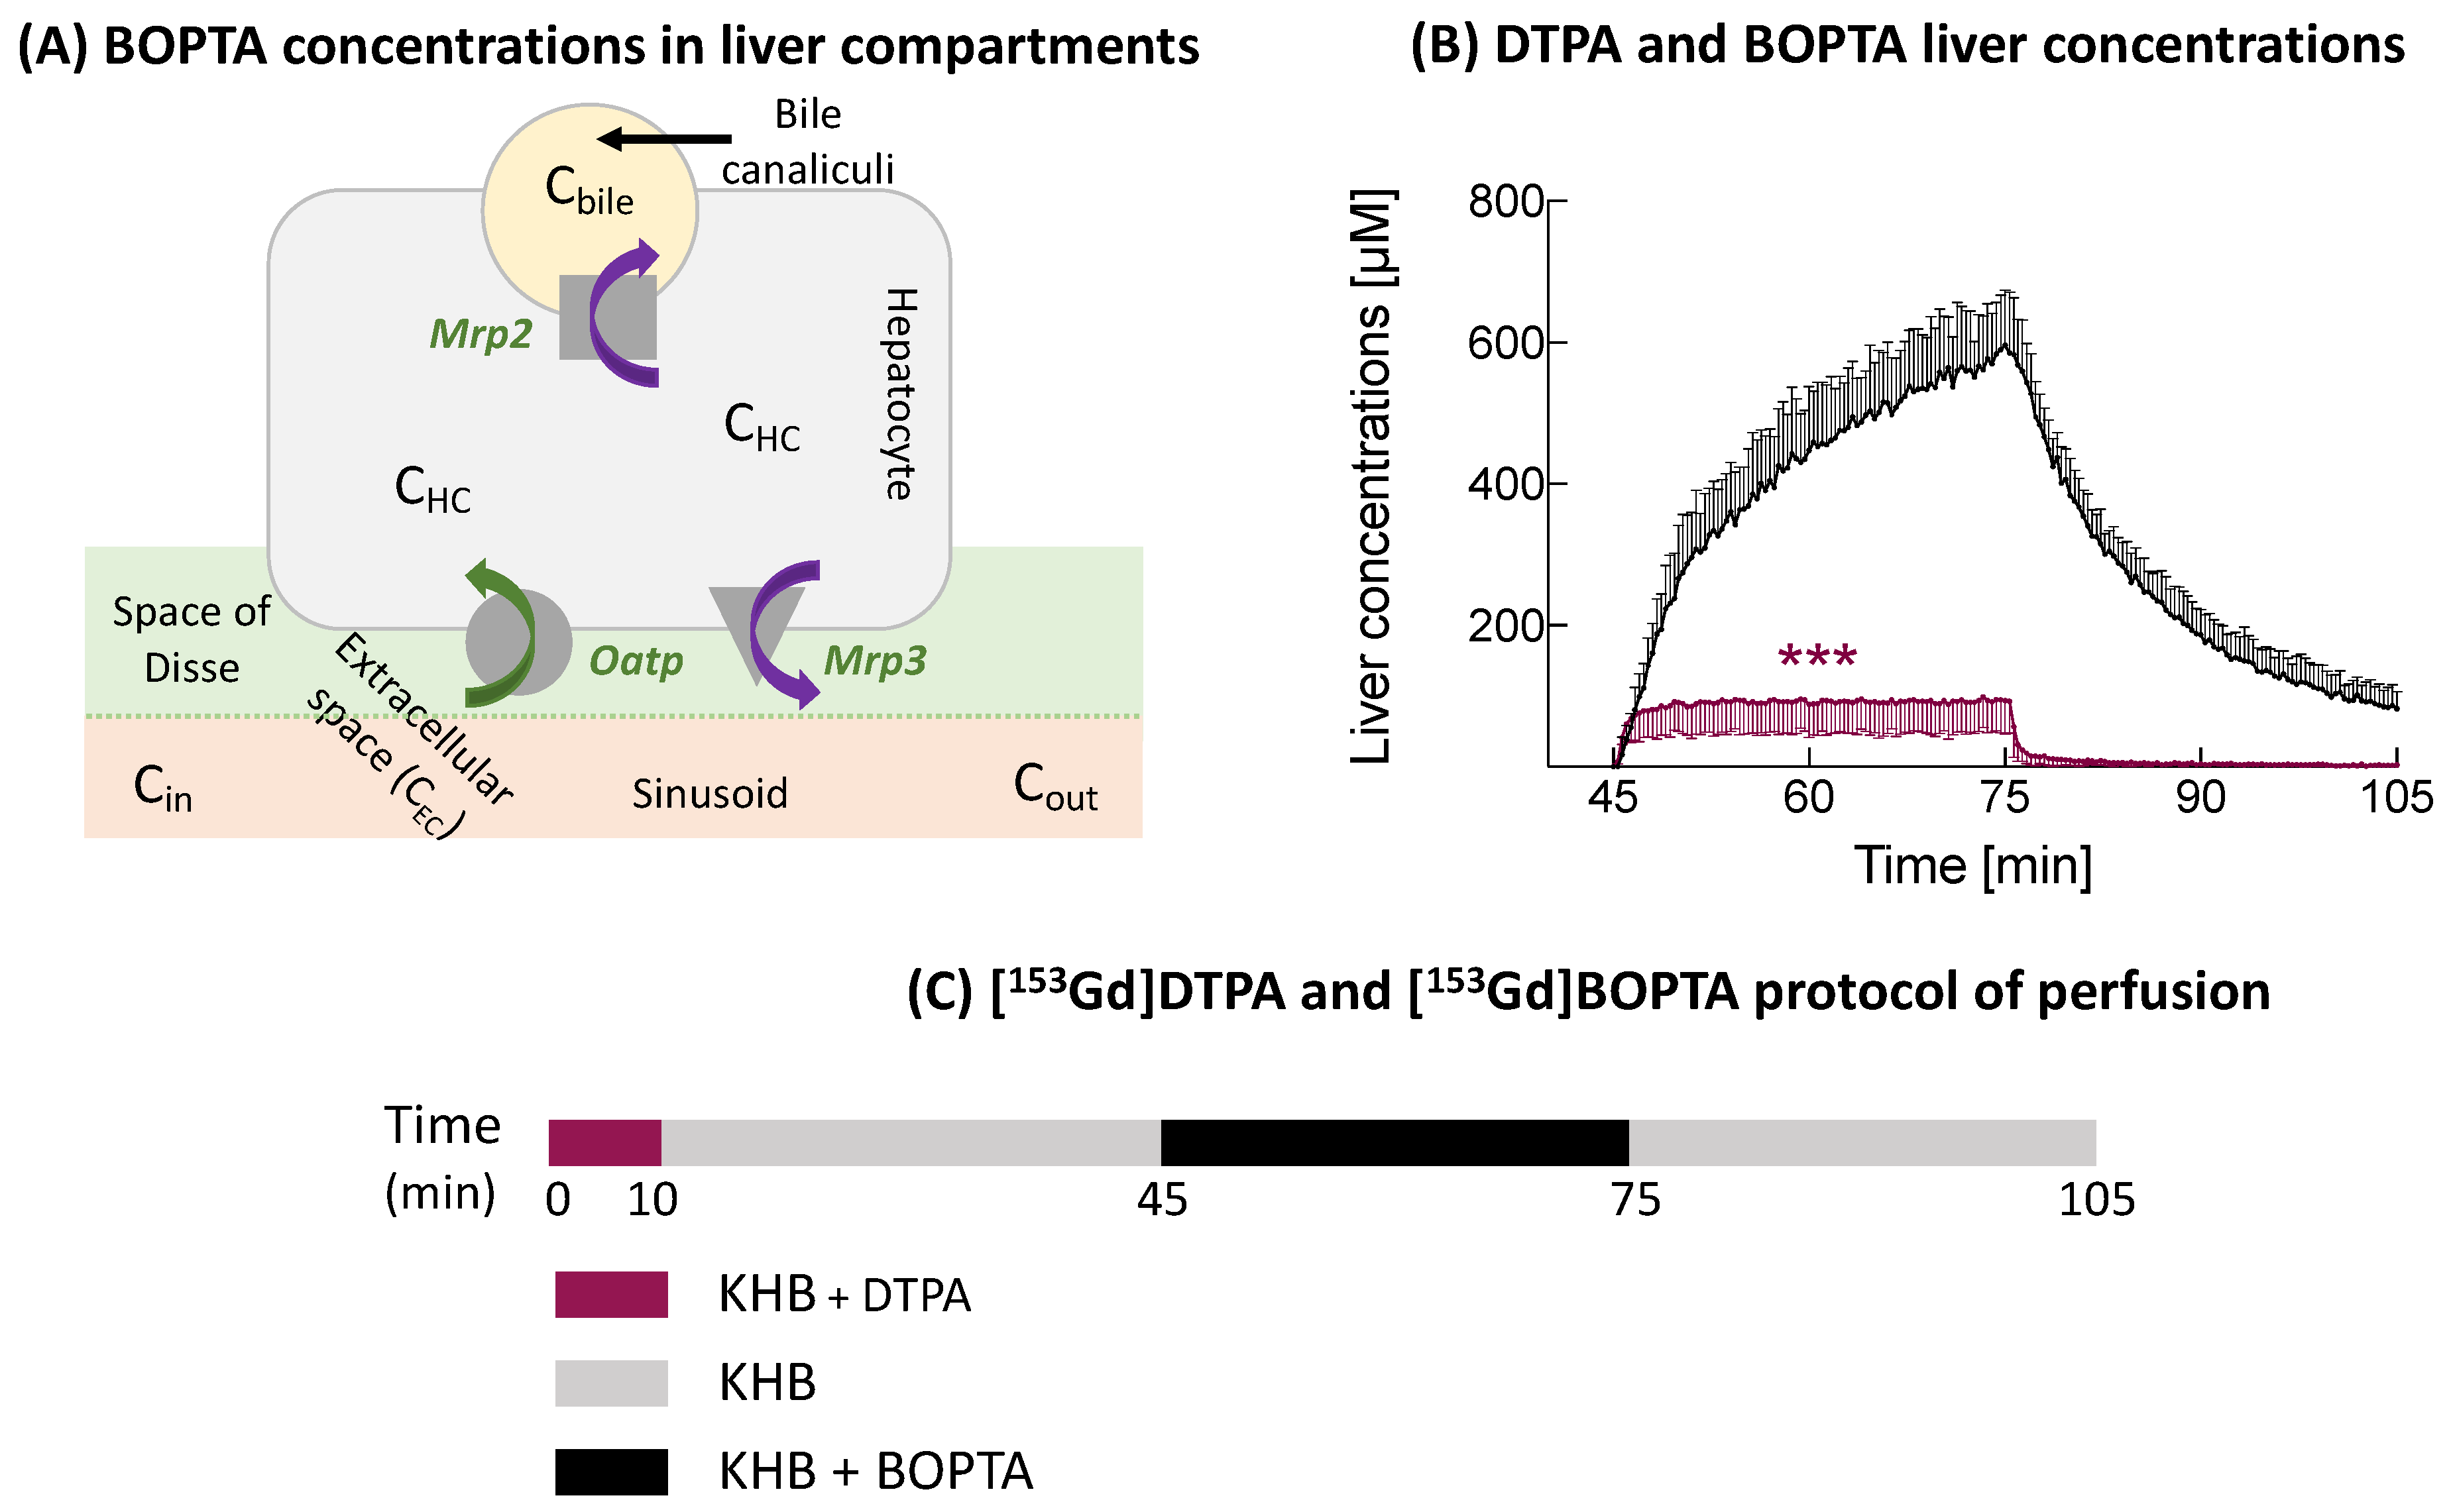
6]. MEB is transported across hepatocytes via human OATPs, MRP2, and MRP3 (
Figure 1A).
Experimental nonalcoholic fatty livers can be investigated in Zucker fatty (
fa/fa) rats [
7,
8]. These rats have a mutated leptin receptor and a decreased leptin affinity. Rats develop severe obesity with insulin resistance and hepatic steatosis. The spontaneous progression of steatosis to steatohepatitis is rare and needs a second hit [
9]. Heterozygous
fa/+ rats serve as control animals. In biopsies, we showed previously that hepatocytes in
fa/fa livers are distended by large fat droplets [
10]. This fat accumulation increases the hepatocyte volume and total liver weights [
11]. No inflammation or fibrosis is detected. Steatosis is associated with high triglyceride and cholesterol serum concentrations [
10]. Portal pressures remain normal, but bile flow rates were significantly decreased in comparison to normal livers.
The expression of hepatocyte transporters was also investigated in
fa/fa livers. According to Canet et al. [
12], Oatp1a4 expression is downregulated while that of Oatp1b2 is induced in
fa/fa livers. In contrast, Mrp2 and Mrp3 expression is not significantly different in
fa/fa and control Sprague-Dawley livers. Another experimental study found that rats fed with a high fat diet had a decreased mRNA expression of
Slco1a2,
Slco1b2,
Abcc2, and
Abcc3 (genes coding for Oatps, Mrp2, and Mrp3) [
13]. However, the protein expression of the transporters was not available.
We previously showed that
fa/fa rats have a decreased bile excretion of Gadobenate dimeglumine (BOPTA, Multihance
®, Bracco Imaging, Milan, Italy) [
10]. BOPTA is a clinical hepatobiliary contrast agent that characterises liver parenchyma and focal lesions [
14]. BOPTA distributes into the extracellular compartment and enters into rat hepatocytes by the Organic anion transporting polypeptide transporters (Oatp1a1, Oatp1a4, and Oatp1b2) (
Figure 1A) [
15]. BOPTA is excreted unchanged (no metabolism) into bile canaliculi through the Multidrug resistance-associated protein 2 (Mrp2) [
16]. BOPTA can also return back to sinusoids using Mrp3. BOPTA accumulation in hepatocytes is modulated by the activity of these influx and efflux transporters.
In an ex-vivo model of isolated and perfused rat liver (IPRL), we previously published the distribution of BOPTA in the extracellular space, hepatocytes, and bile canaliculi [
17]. By placing a gamma counter over livers, it is possible to measure the liver concentrations of labelled BOPTA (
Figure 1B). A preperfusion of labelled gadopentetate dimeglumine (DTPA) quantifies the extracellular concentrations, because it distributes exclusively into the extracellular space. Concentrations of bile canaliculi and hepatocytes were calculated. We found that the maximal BOPTA hepatocyte concentrations (obtained at the end of the perfusion period) were similar in
fa/+ and
fa/fa livers. A compartmental pharmacokinetic modelling determined that the BOPTA influx rates were similar in both groups while the efflux rates from hepatocytes into bile and back into sinusoids were decreased.
In the present study, we reanalysed the row data of fa/+ and fa/fa livers to quantify the BOPTA compartmental distribution (or respective contribution of the extracellular space, hepatocytes, and bile canaliculi to liver concentrations) and new pharmacokinetic parameters that characterise BOPTA accumulation and decay in hepatocytes.
2. Materials and Methods
2.1. Isolated and Perfused Rat Livers
Before liver isolation, Zucker fat (
fa/fa,
n = 5) and Zucker lean (
fa/+,
n = 5) rats were anesthetised with pentobarbital (50 mg · kg
−1, ip). In these two groups, we published previous biological parameters of liver functions while the transporter functions were assessed by pharmacokinetic modelling [
10]. In the present study, we returned to row data to analyse the new hepatic pharmacokinetic parameters. Rat livers were isolated, leaving the organs in the carcass. The abdominal cavity was opened and the portal vein cannulated. The hepatic artery was not perfused. The abdominal vena cava was transected, and an oxygenated Krebs–Henseleit bicarbonate (KHB) solution was pumped into the portal vein, the solution being discarded after liver distribution via a vena cava transection. The flow rate was slowly increased over 1 min up to 30 mL/min. In the second step, the chest was opened, and a cannula was inserted through the right atrium to collect solutions flowing from the hepatic veins. Finally, the abdominal inferior vena cava was ligated, allowing solutions perfused by the portal vein to be eliminated by the hepatic veins.
The perfusion system included a reservoir, a pump, a heating circulator, a bubble trap, a filter, and an oxygenator. Solutions of perfusion were equilibrated with a mixture of 95% O
2 and 5% CO
2. Livers were continuously perfused with fresh solutions using a nonrecirculating system. The common bile duct was cannulated with a PE
10 catheter, and bile samples were collected every 5 min to measure the bile flow rates (Q
bile, µL/min/liver) and BOPTA concentrations (C
bile, µM). Samples were collected from hepatic veins every 5 min (C
out, µM). C
out during the BOPTA perfusion period were concentrations that did not enter into hepatocytes plus concentrations that entered into hepatocytes (via Oatps) and returned into sinusoids via Mrp3 (
Figure 1A). During the rinse period, C
out were concentrations leaving hepatocytes because the concentration in the portal vein (C
in) was 0.
An adequate viability of livers was assessed by a steady portal pressure below 12 mmHg during the entire protocol. We previously published that a flow rate of 30 mL/min/liver maintains a normal liver O
2 consumption [
18].
2.2. Perfusion of DTPA and BOPTA
Rat livers were perfused with gadopentetate dimeglumine (DTPA; Magnevist
®; Bayer imaging, Berlin, Germany) and gadobenate dimeglumine (BOPTA, MultiHance
®; Bracco Imaging, Milan, Italy). DTPA distributes only within sinusoids and the interstitium, while BOPTA distributes into the extracellular space, hepatocytes, and bile canaliculi. DTPA and BOPTA labelled with
153Gd were obtained by adding
153GdCl
3 (1 MBq/mL) to the commercially available (0.5 M) solutions of DTPA and BOPTA. Then, [
153Gd]DTPA and [
153Gd]BOPTA were diluted in the KHB solution to obtain a 200-µM concentration. Livers were successively perfused with 200 µM [
153Gd]DTPA (10 min), KHB solution (35 min), 200 µM [
153Gd]BOPTA (30 min, accumulation or perfusion period), and KHB solution (30 min, decay or elimination period) (
Figure 1C). The protocol lasted 105 min for each group.
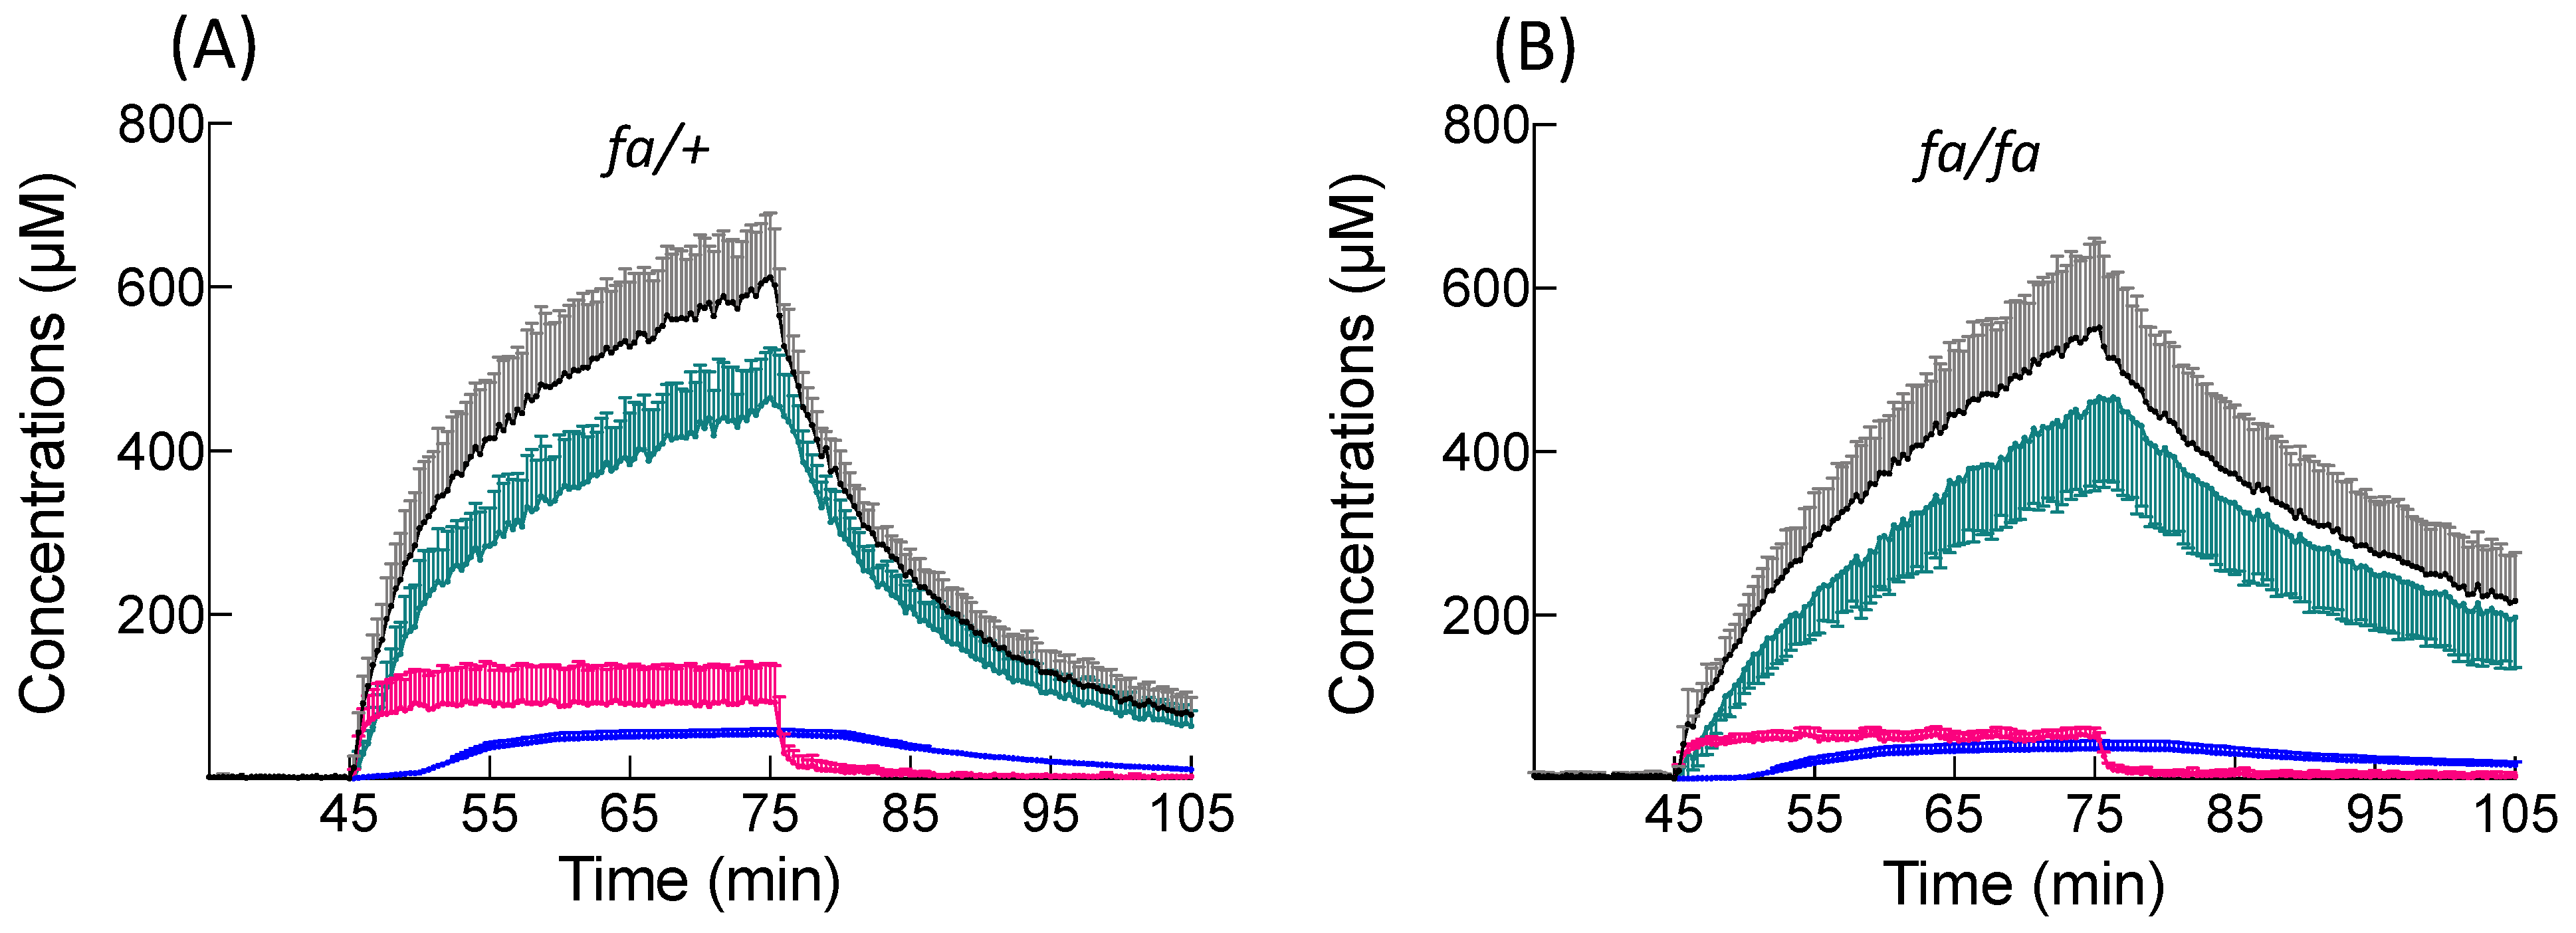
2.3. Concentrations in Liver Compartments
To quantify the BOPTA concentrations in liver compartments, a gamma counter that collects count rates every 20 s was placed 1 cm above a right liver lobe. The counter measured the radioactivity in a region of interest that was identical in each liver. To transform count rates into BOPTA concentrations, the total liver radioactivity was measured by an activimetre at the end of each experiment and related to the last count rates. Radioactivity was corrected for decay. The gamma counter delineated a region of interest in a liver lobe from which all count rates originating from the extracellular space, hepatocytes, and bile canaliculi were divided by the liver weight to obtain liver concentrations (C
liver, µM). To calculate the hepatocyte concentrations, we must eliminate the BOPTA concentrations located inside the extracellular space (C
EC) and bile canaliculi (C
BC). BOPTA extracellular concentrations cannot be measured, because the substrate rapidly enters into hepatocytes (<2 min). We used DTPA that distributes only in the extracellular space to estimate the BOPTA C
EC. Assuming that DTPA C
EC is similar to BOPTA C
EC, we can subtract BOPTA C
liver − DTPA C
liver (or DTPA C
EC). The concentrations were constant during the 10-min perfusion. During BOPTA perfusion, this plateau was extended over 30 min (
Figure 1B). We assumed that the concentrations inside bile canaliculi were similar to those measured in the common bile duct (C
bile, µM), although solute export from cholangiocytes and water transport along ductules and ducts may modify the primary bile in canaliculi. The volume ratio of the bile canaliculi and liver was previously estimated by Blouin et al. [
19] at 0.43%. Concentrations in the bile canaliculi detected by the counter (C
BC) were then equal to 0.0043 · C
bile. Hepatocyte concentrations in a 78% liver volume (C
HC78%) detected by the counter were C
liver − C
EC − 0.0043 C
bile. Indeed, Blouin et al. [
19] determined previously that the volume ratio of hepatocytes to liver in the absence of fibrosis or inflammation was 78%. In situ C
HC100% were calculated by (100/78) · C
HC78%.
2.4. Transfer Rates and Clearances between Compartments
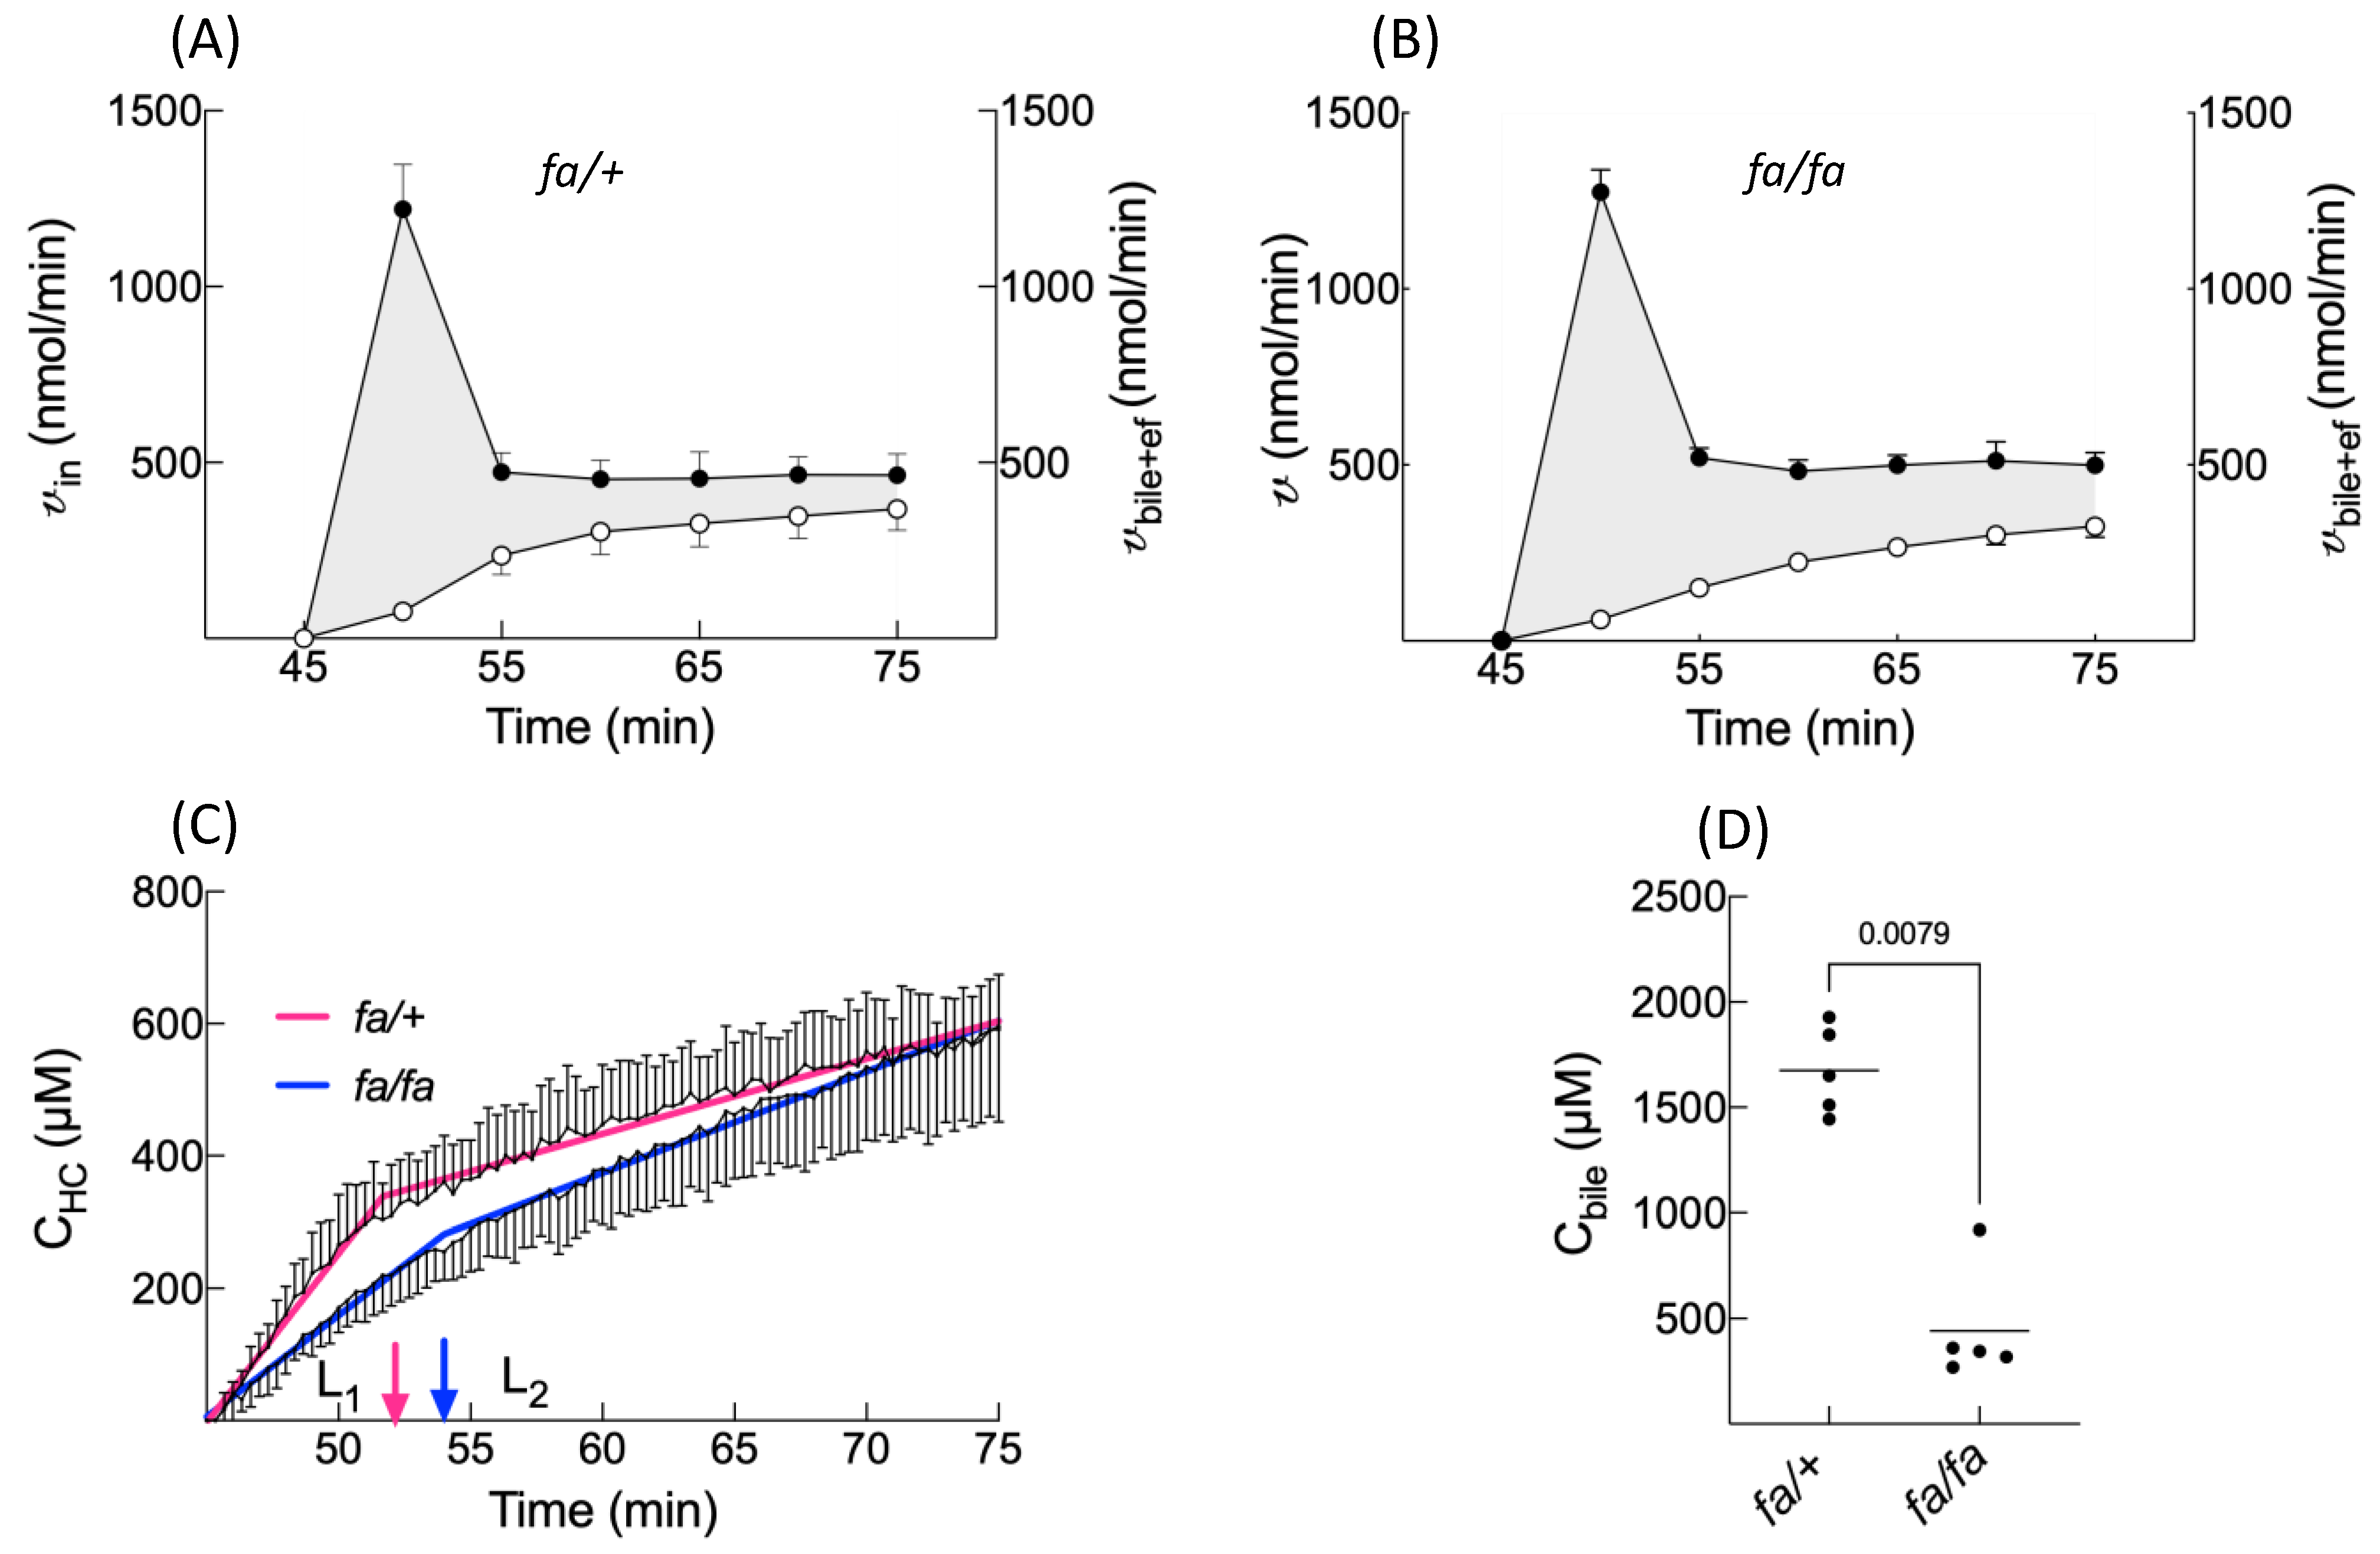
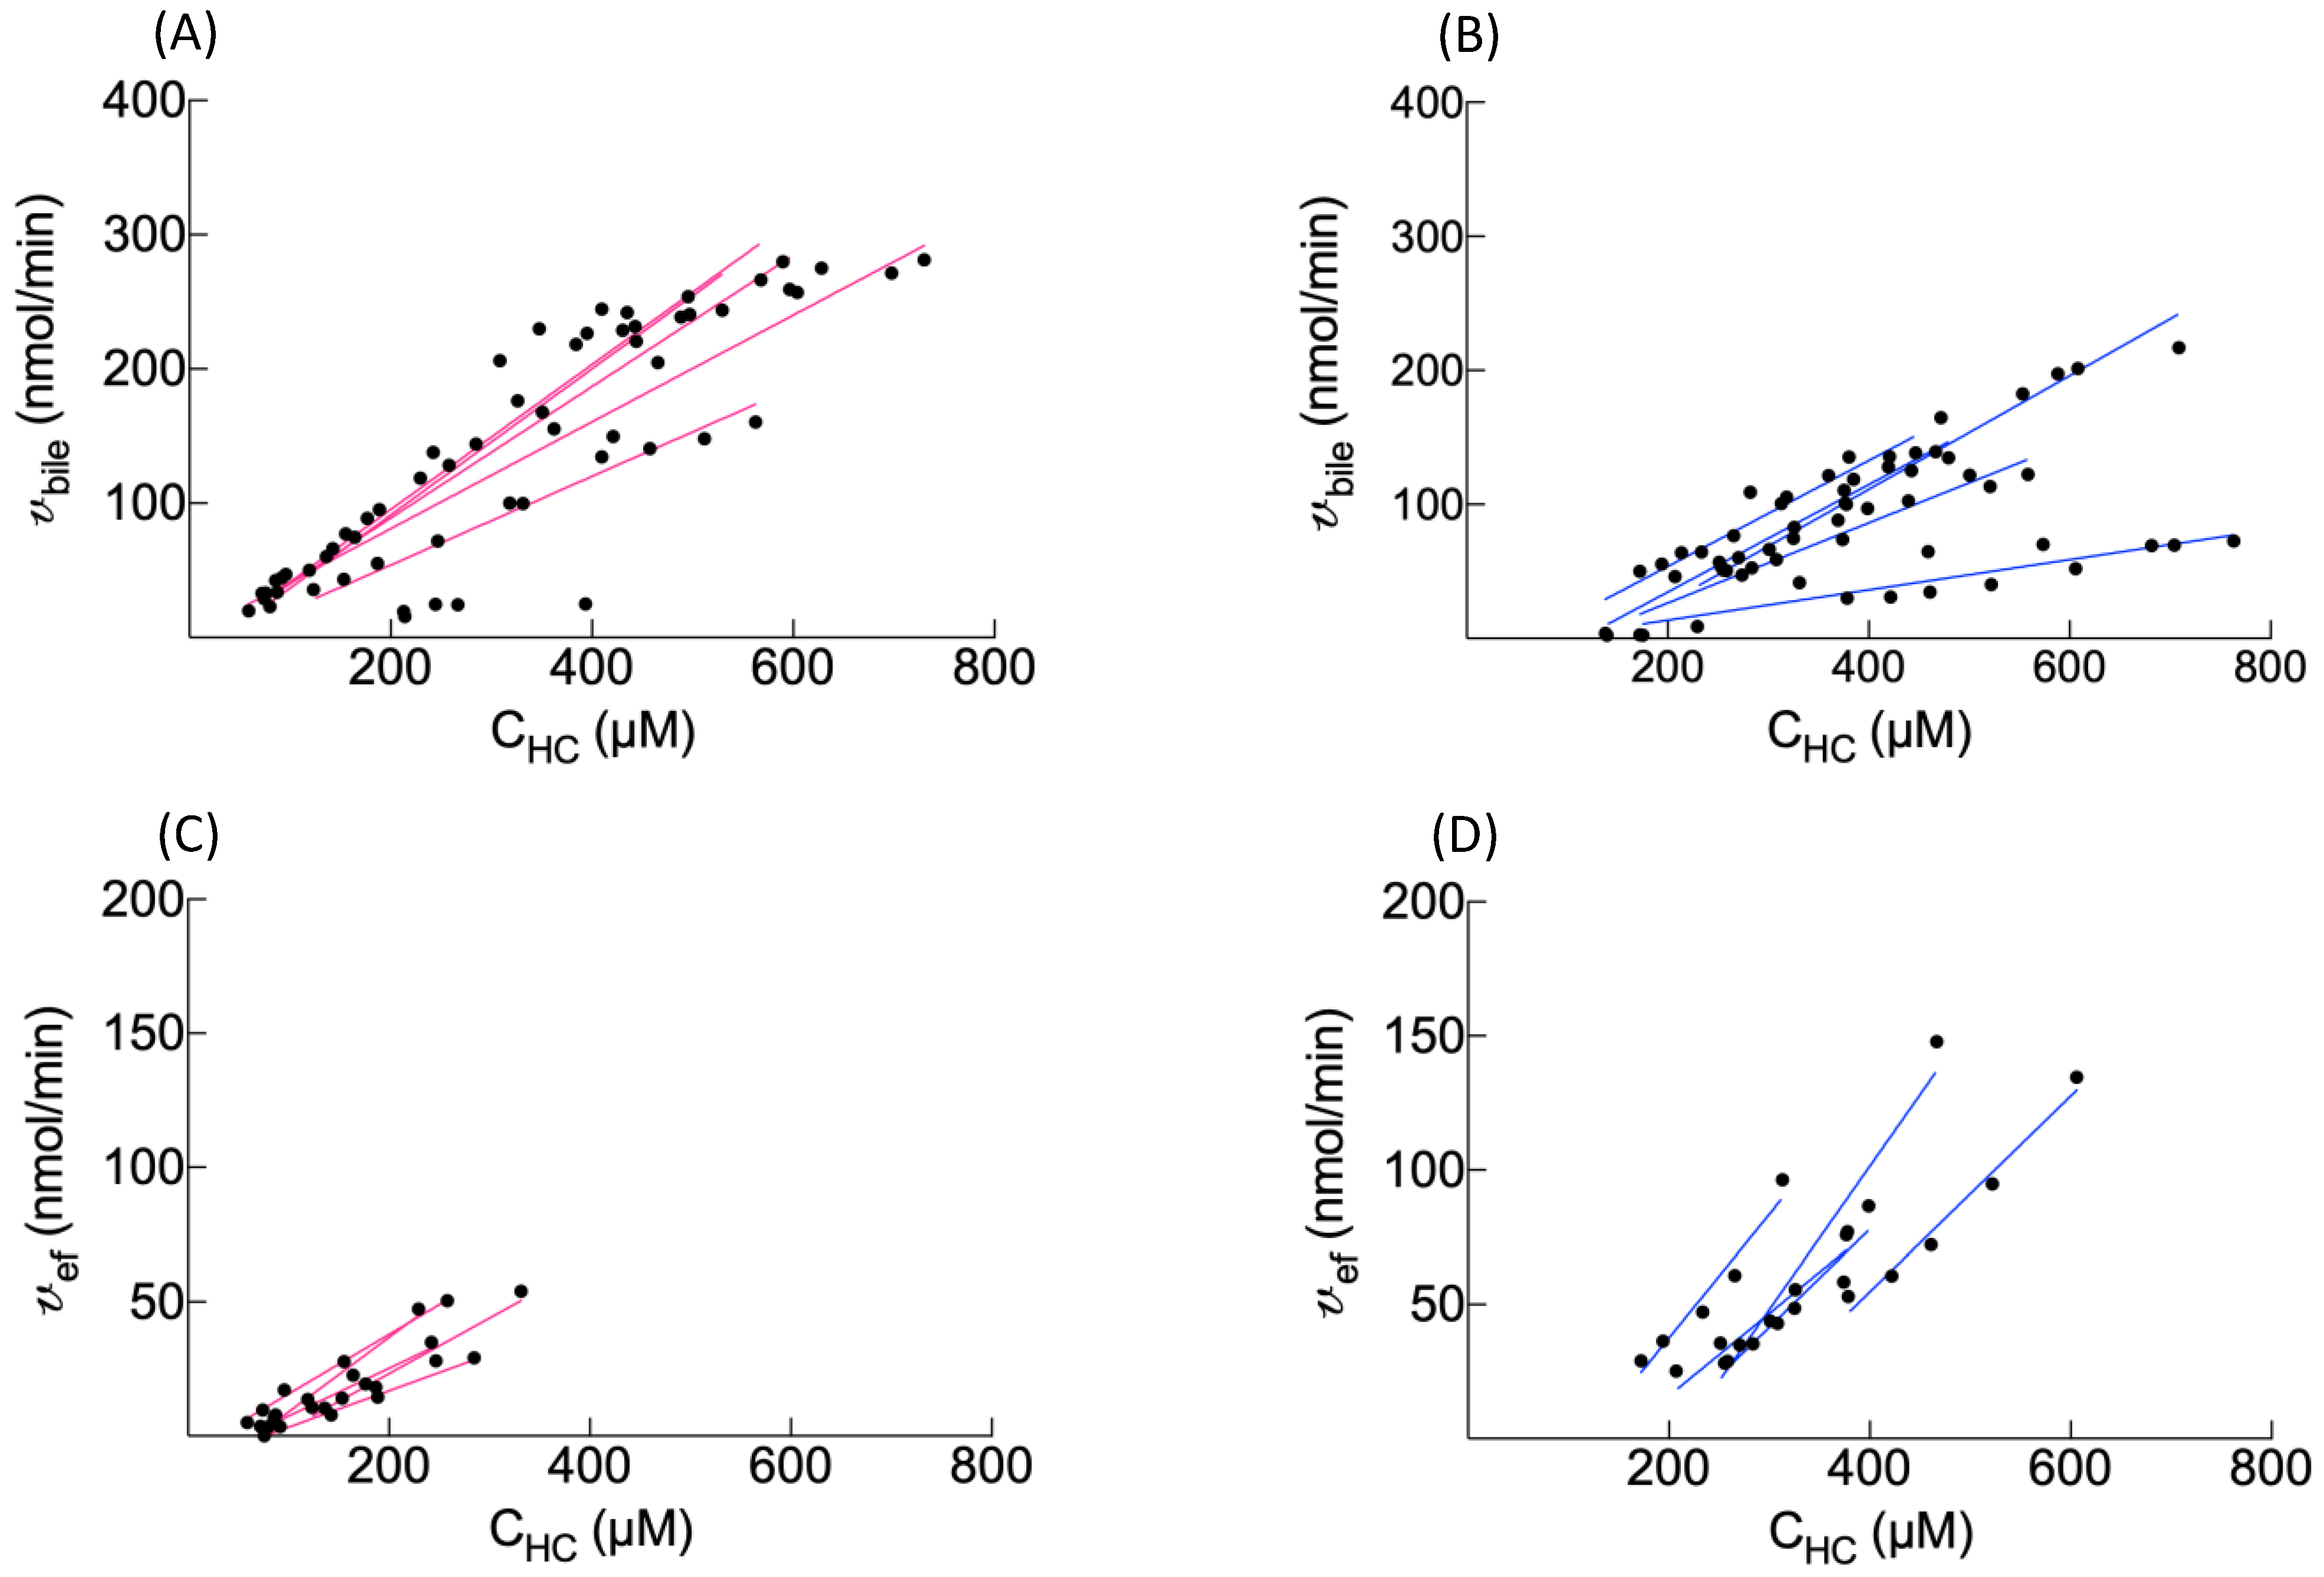
The BOPTA removal rate from sinusoids during the perfusion period (v, nmol/min) was measured by QH · (Cin − Cout), where QH was the constant liver flow rate (30 mL/min), Cin (µM) was the constant portal concentration, and Cout (µM) was the concentration measured in hepatic veins. The unbound fraction in the solutions was 1, because no protein was added into the solutions. Hepatic clearance (CLH, mL/min) was the ratio of v and Cin during the last min of perfusion. The BOPTA extraction ratio (ER) was (Cin − Cout)/Cin. The BOPTA biliary excretion rate (vbile, nmol/min) was Cbile · Qbile, where Cbile (µM) was the concentration in the common bile duct, and Qbile was the bile flow rate (µL/min/liver weight). Clearance from the hepatocytes to bile canaliculi (CLbile, mL/min) was the slope of the linear regression between vbile (Y-axis) and the hepatocyte concentrations (CHC, X-axis). CLbile was measured during the entire protocol. During the rinse period, BOPTA concentrations leaving hepatocytes into sinusoids (Cef, µM) were measured by Cout in the absence of BOPTA entry into livers. The basolateral efflux from hepatocytes into sinusoids (vef, nmol/min) was Cef · QH, and the basolateral clearance (CLef, mL/min) was the slope of linear regression between vef (Y-axis) and CHC (X-axis). With the assumption that CLef was similar during both the perfusion and rinse periods, we estimated Cef during the accumulation period by (CHC · CLef)/QH. The hepatocyte influx rate vin (nmol/min) was [Cin − (Cout − Cef)] · QH, and the hepatocyte influx clearance CLin (mL/min) was vin/Cin. The CLin was measured during the last min of perfusion.
2.5. Accumulation Profile of Hepatocyte Concentrations
During the perfusion period, BOPTA hepatocyte accumulation was best described by a segmental linear regression obtained from GraphPad Prism version 8, GraphPad Software, La Jolla, CA, USA [
20]. This function defines a first line L
1 for a time below T
0 and a second line L
2 for a time higher than T
0. T
0 is the time when the two lines would intersect. No constraint was applied to fit the data.
2.6. Concentration Ratios (R) between Compartments
In in vivo studies, only liver-to-plasma concentration ratios are available. However, concentrations facing the sinusoidal membrane of hepatocytes where Oatps reside are the extracellular concentrations, because the space of Disse intertwines between sinusoids and the sinusoidal membrane. Thus, the hepatocyte-to-extracellular concentration ratio (RHC/EC) characterises BOPTA transport across Oatps. RHC/EC was measured at T0 before the BOPTA efflux out of cells. The bile-to-hepatocyte concentration ratio (Rbile/HC) was the slope of the relationship between Cbile (Y-axis) and CHC (X-axis) during the entire protocol. Rbile/HC was independent of the BOPTA influx into hepatocytes. The hepatic vein-to-hepatocyte ratio (RHV/HC) was the slope of the relationship between Cout (Y-axis) and CHC (X-axis) during the rinse period. RHV/HC was independent of the BOPTA influx into the hepatocytes. The concentrations used in these ratios were in situ concentrations. Finally, the bile-to-extracellular concentration ratio (Rbile/EC) assessed the ability of transporters to concentrate BOPTA from the extracellular space to bile compartments. Rbile/EC was measured at the end of the perfusion period, when the bile concentration was maximal.
2.7. Decay Profile of Hepatocyte Concentrations
During the decay period, the data were best described by a one phase decay (GraphPad Prism version 8, GraphPad Software, La Jolla, CA, USA) [
21]. The plateau was constrained to 0, because BOPTA must leave hepatocytes. The model was defined by a rate constant of elimination (k
el,HC, min
−1). Knowing CL
bile+ef and k
el,HC, we calculated the apparent hepatocyte volumes (V
HC, mL) as CL
bile+ef/k
el,HC.
2.8. Statistics
Data were the means ± SD. The parameters obtained in normal and fatty livers were compared with a Mann–Whitney test (GraphPad Prism version 8, GraphPad Software, La Jolla, CA, USA).
4. Discussion
BOPTA is a clinical hepatobiliary contrast agent that characterises liver disease and focal lesions in liver magnetic resonance imaging [
14]. BOPTA distributes within the extracellular compartment and enters into rat hepatocytes by Organic anion transporting polypeptide transporters (Oatp1a1, Oatp1a4, and Oatp1b2) [
15]. The contrast agent is excreted unchanged (no metabolism) into bile canaliculi through Mrp2 [
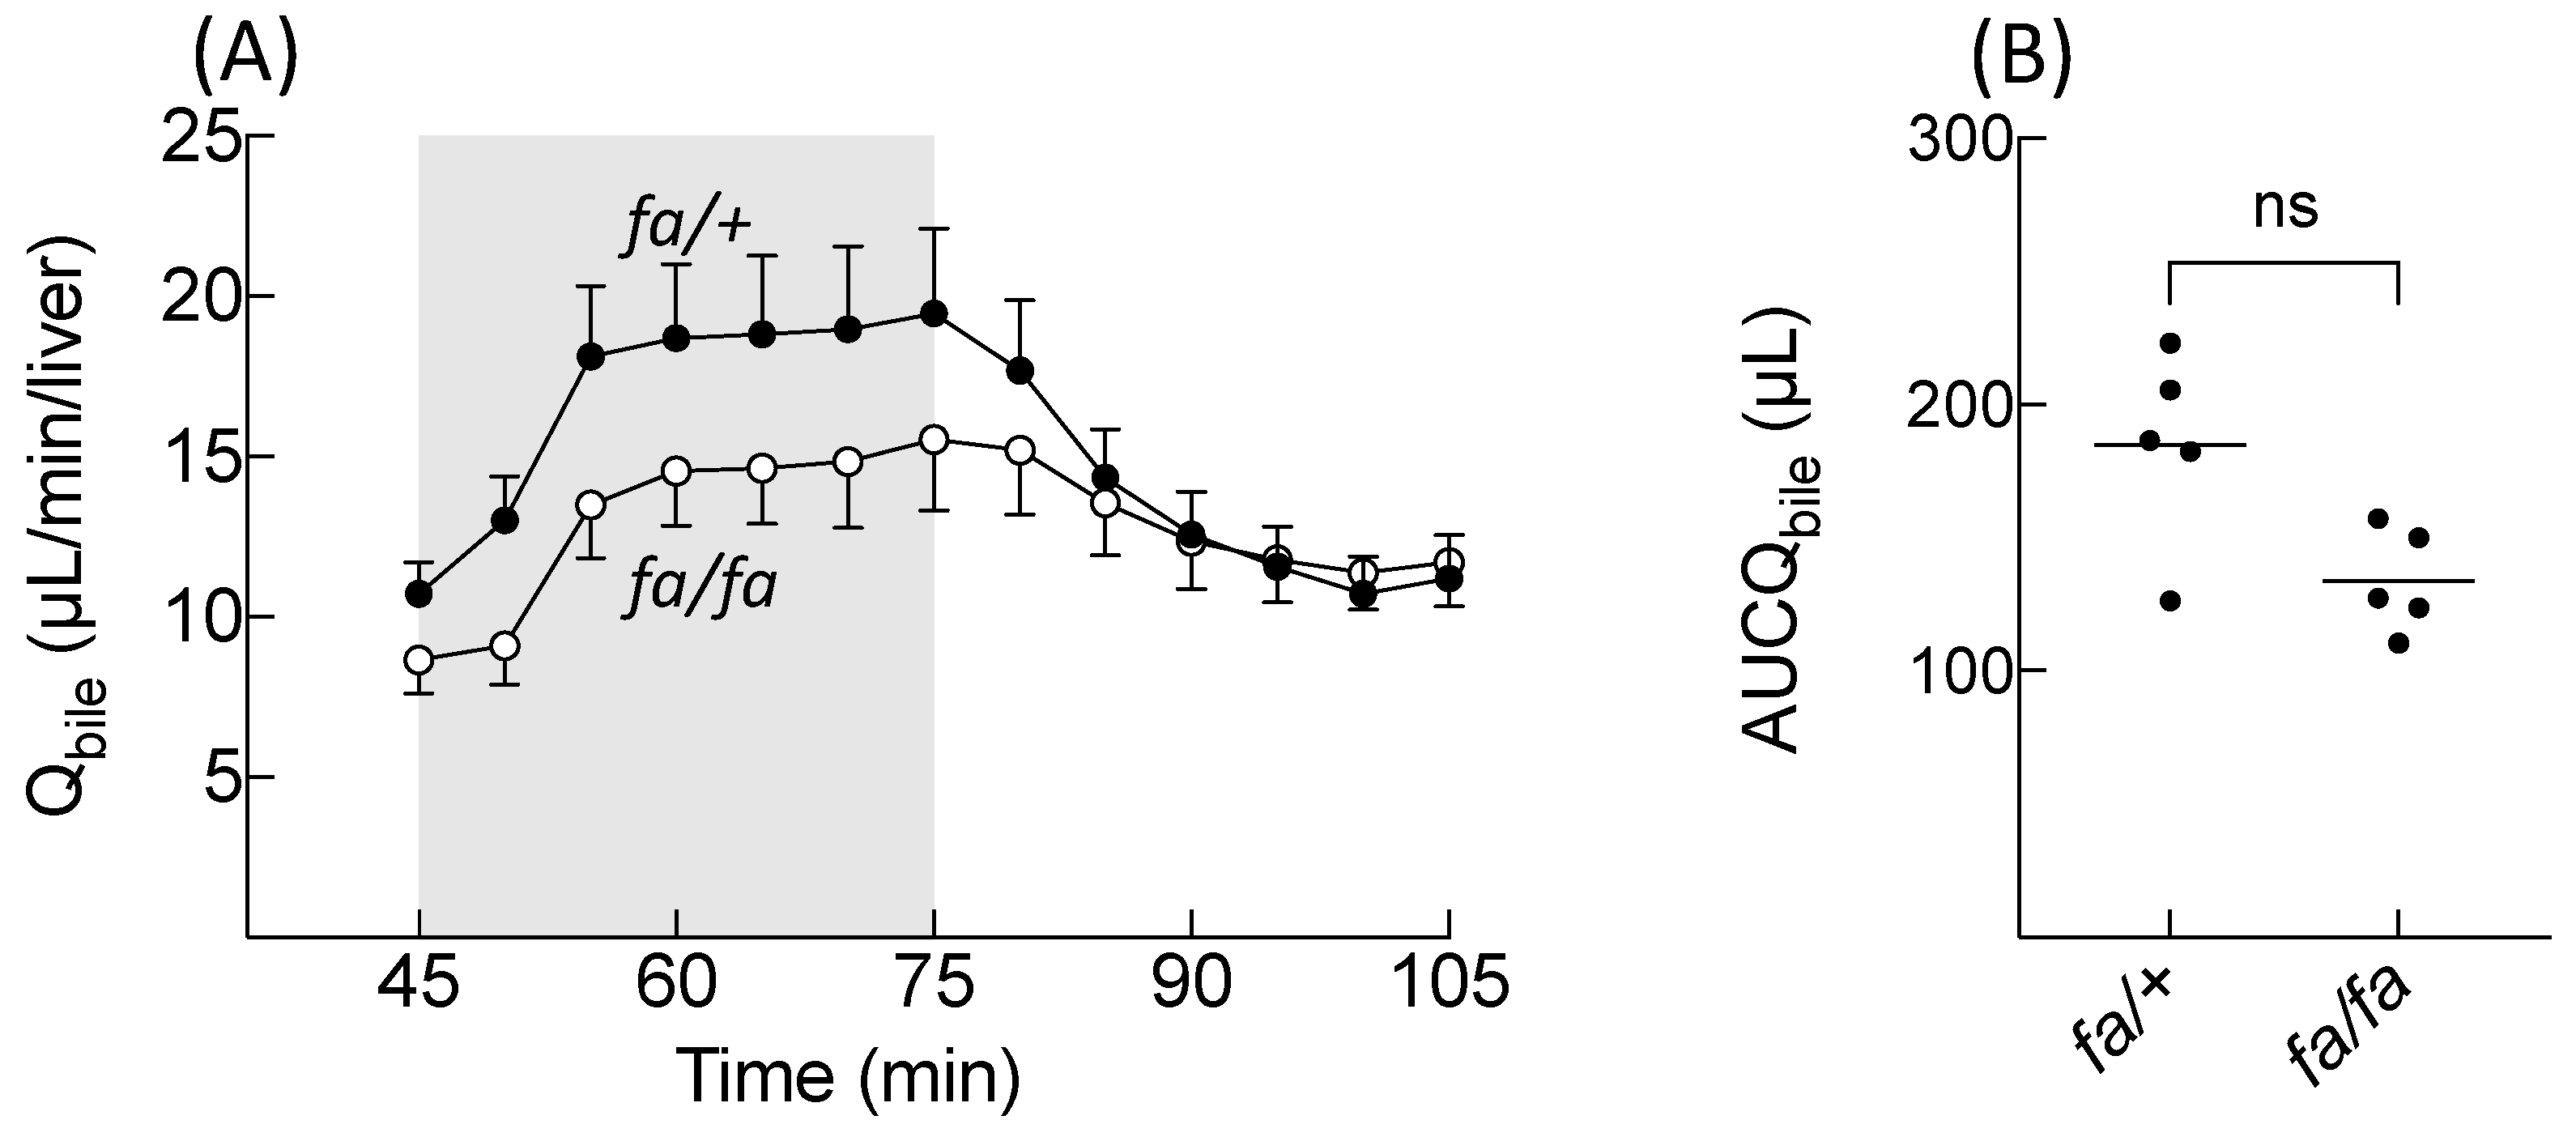
16]. BOPTA can also return back to sinusoids using Mrp3. BOPTA hepatocyte accumulation is modulated by the activity of the three transporters. In this study, we showed that BOPTA has a low liver extraction ratio (<7%) that is not modified by steatosis. BOPTA transport by Mrp2 is associated with water transport (choleresis). We showed that a BOPTA-induced bile flow increase is not significantly different in
fa/fa and
fa/+ livers. However, a single low value of AUCQ
bile in the
fa/+ group might hide the statistical difference between the groups. The water transport across the canalicular membrane may be linked to BOPTA crossing via Mrp2, which triggers the trafficking and insertion of aquaporin-8-containing vesicles into the canalicular membrane [
22,
23]. BOPTA-induced choleresis is concentration-dependent and inhibited in livers lacking Mrp2 [
16]. Similar results were published with benzylpenicillin [
24].
BOPTA distributes into the extracellular space before reaching Oatps. In accordance with the absence of fibrosis in fatty livers [
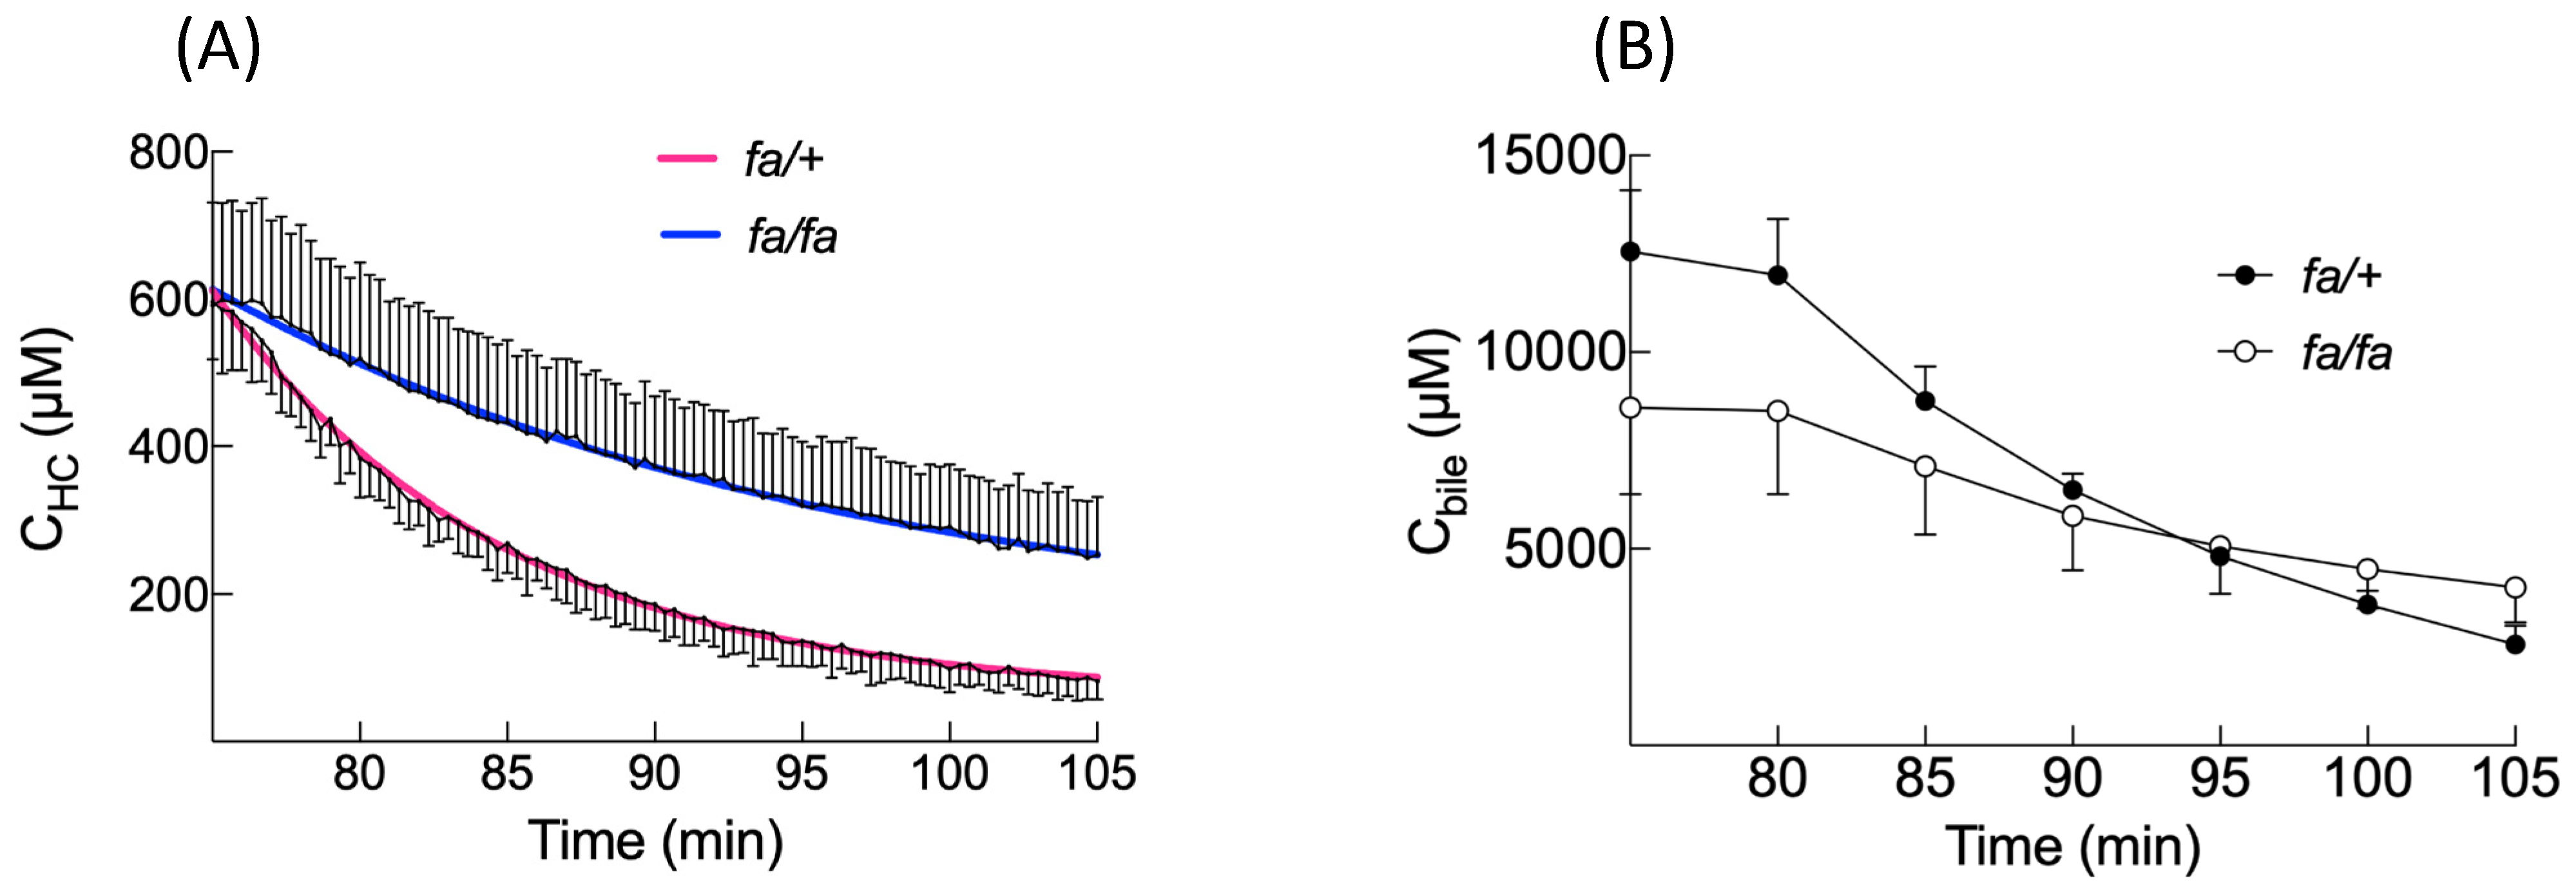
10], steatosis does not modify the extracellular concentrations that represent 13% of the liver concentrations in both groups. The maximal hepatocyte concentrations are also similar, as are the liver concentrations. Consequently, liver imaging following BOPTA injection would not detect differences between the two groups. However, BOPTA accumulation profiles are modified in steatosis. BOPTA accumulation into hepatocytes is best described by segmental linear regression [
20]. This function defines a first line L
1 for a time before T
0 (before BOPTA efflux from hepatocytes). T
0 is slightly delayed in fatty hepatocytes, anticipating a delay in cellular emptying. Steatosis decreases the L
1 slope or BOPTA entry into fatty hepatocytes. After T
0, L
2 slopes are much lower than L
1 slopes, because BOPTA efflux from hepatocytes counteracts the influx. Steatosis does not modify the L
2 slopes.
Another parameter of BOPTA influx into hepatocytes is the concentration ratio between the hepatocytes and extracellular space (R
HC/EC) measured at T
0 before BOPTA cellular efflux. Steatosis does not modify this ratio. BOPTA influx clearance (CL
in) and hepatic clearance (CL
H) are also similar at the end of BOPTA perfusion, confirming that steatosis does not substantially modify the Oatp activity. Geier et al. [
11] found a decreased expression of Oatp1a4 but not Oatp1a1 in
fa/fa livers. The transport activities were not investigated in this study. The reason why the L
1 slope is lower in
fa/fa than
fa/+ hepatocytes might be explained by the larger volume of fatty hepatocytes, the L
1 slope being expressed in µM/min or nmol/(mL · min). With similar v
in in both groups, the L
1 slope will be lower in a larger volume of fatty hepatocytes.
The BOPTA accumulation in bile (C
bile) is significantly lower during the accumulation period in
fa/fa livers, and the C
bile decrease during the rinse period is slower in fatty livers. Accordingly, the bile clearance (CL
bile) is lower in fatty livers, showing a decreased activity of Mrp2 associated with steatosis. The low activity of Mrp2 can be attributed to a lower expression [
11,
25]. In contrast, efflux clearance back into sinusoids (CL
ef) is significantly higher in fatty livers, reflecting an increased activity of Mrp3 that compensates the decreased activity of Mrp2. Thus, the sum of both efflux clearances (CL
bile+ef) is not significantly different between both groups. Such compensation was previously published [
26]. Nevertheless, the Mrp3 expression is not increased in
fa/fa livers [
11,
25], suggesting that a dysregulation might promote BOPTA transport without changing the transporter expression. In contrast, the human MRP3 expression is increased in fatty livers and steatohepatitis [
4]. Another way to describe BOPTA hepatocyte emptying is to compare the rate constant of elimination (k
el,HC) obtained with the one phase decay equation. The k
el,HC that quantifies BOPTA efflux into bile canaliculi and sinusoids is lower in the presence of steatosis. Knowing CL
bile+ef and k
el,HC, we can calculate the apparent hepatocyte volume where BOPTA distributes (V
HC). The V
HC is significantly higher in
fa/fa livers. However, these apparent hepatocyte volumes overestimate the hepatocyte volume calculated by 0.78 · liver weights.
When we previously determined the transporter activities of Oatps, Mrp2, and Mrp3 by pharmacokinetic modelling, we found that the BOPTA hepatocyte influx in
fa/fa rats was not significantly different from
fa/+ livers [
10]. In contrast, the bile and sinusoidal effluxes were both significantly decreased. The pharmacokinetic modelling did not evidence that a high efflux into sinusoids can compensate for a decreased efflux into bile canaliculi. The direct quantification of transporter activities we proposed in the present study is innovative and might validate new modelling approaches. The experimental model is useful to quantify the functions of hepatocyte transporters in liver diseases.
The isolated and perfused rat liver is a convenient model, because the experimental conditions are well-controlled and simplified. The structure of the liver is maintained. However, livers are perfused only through the portal vein, avoiding the complexity of a dual-input entry but changing the physiology of liver perfusion. To simplify the protocol, we did not add proteins in the KHB solution, and BOPTA was free to enter into hepatocytes. The gamma counter placed over the liver detects the concentrations of imaging substrates every 20 s, avoiding the collection of serial biopsy samples that damage rat livers. An important assumption is that the region of interest measured by the counter is representative of the entire liver. Moreover, the hepatocyte concentrations we obtained averaged out the concentrations of numerous hepatocytes, knowing that Oatps are mainly expressed in perivenous hepatocytes where BOPTA is likely to enter. Additionally, extrapolation of the results to other species and humans must be cautious, because the expressions of membrane transporters can differ.


