
Exendin-4 Pretreatment Attenuates Kainic Acid-Induced Hippocampal Neuronal Death


 and
and 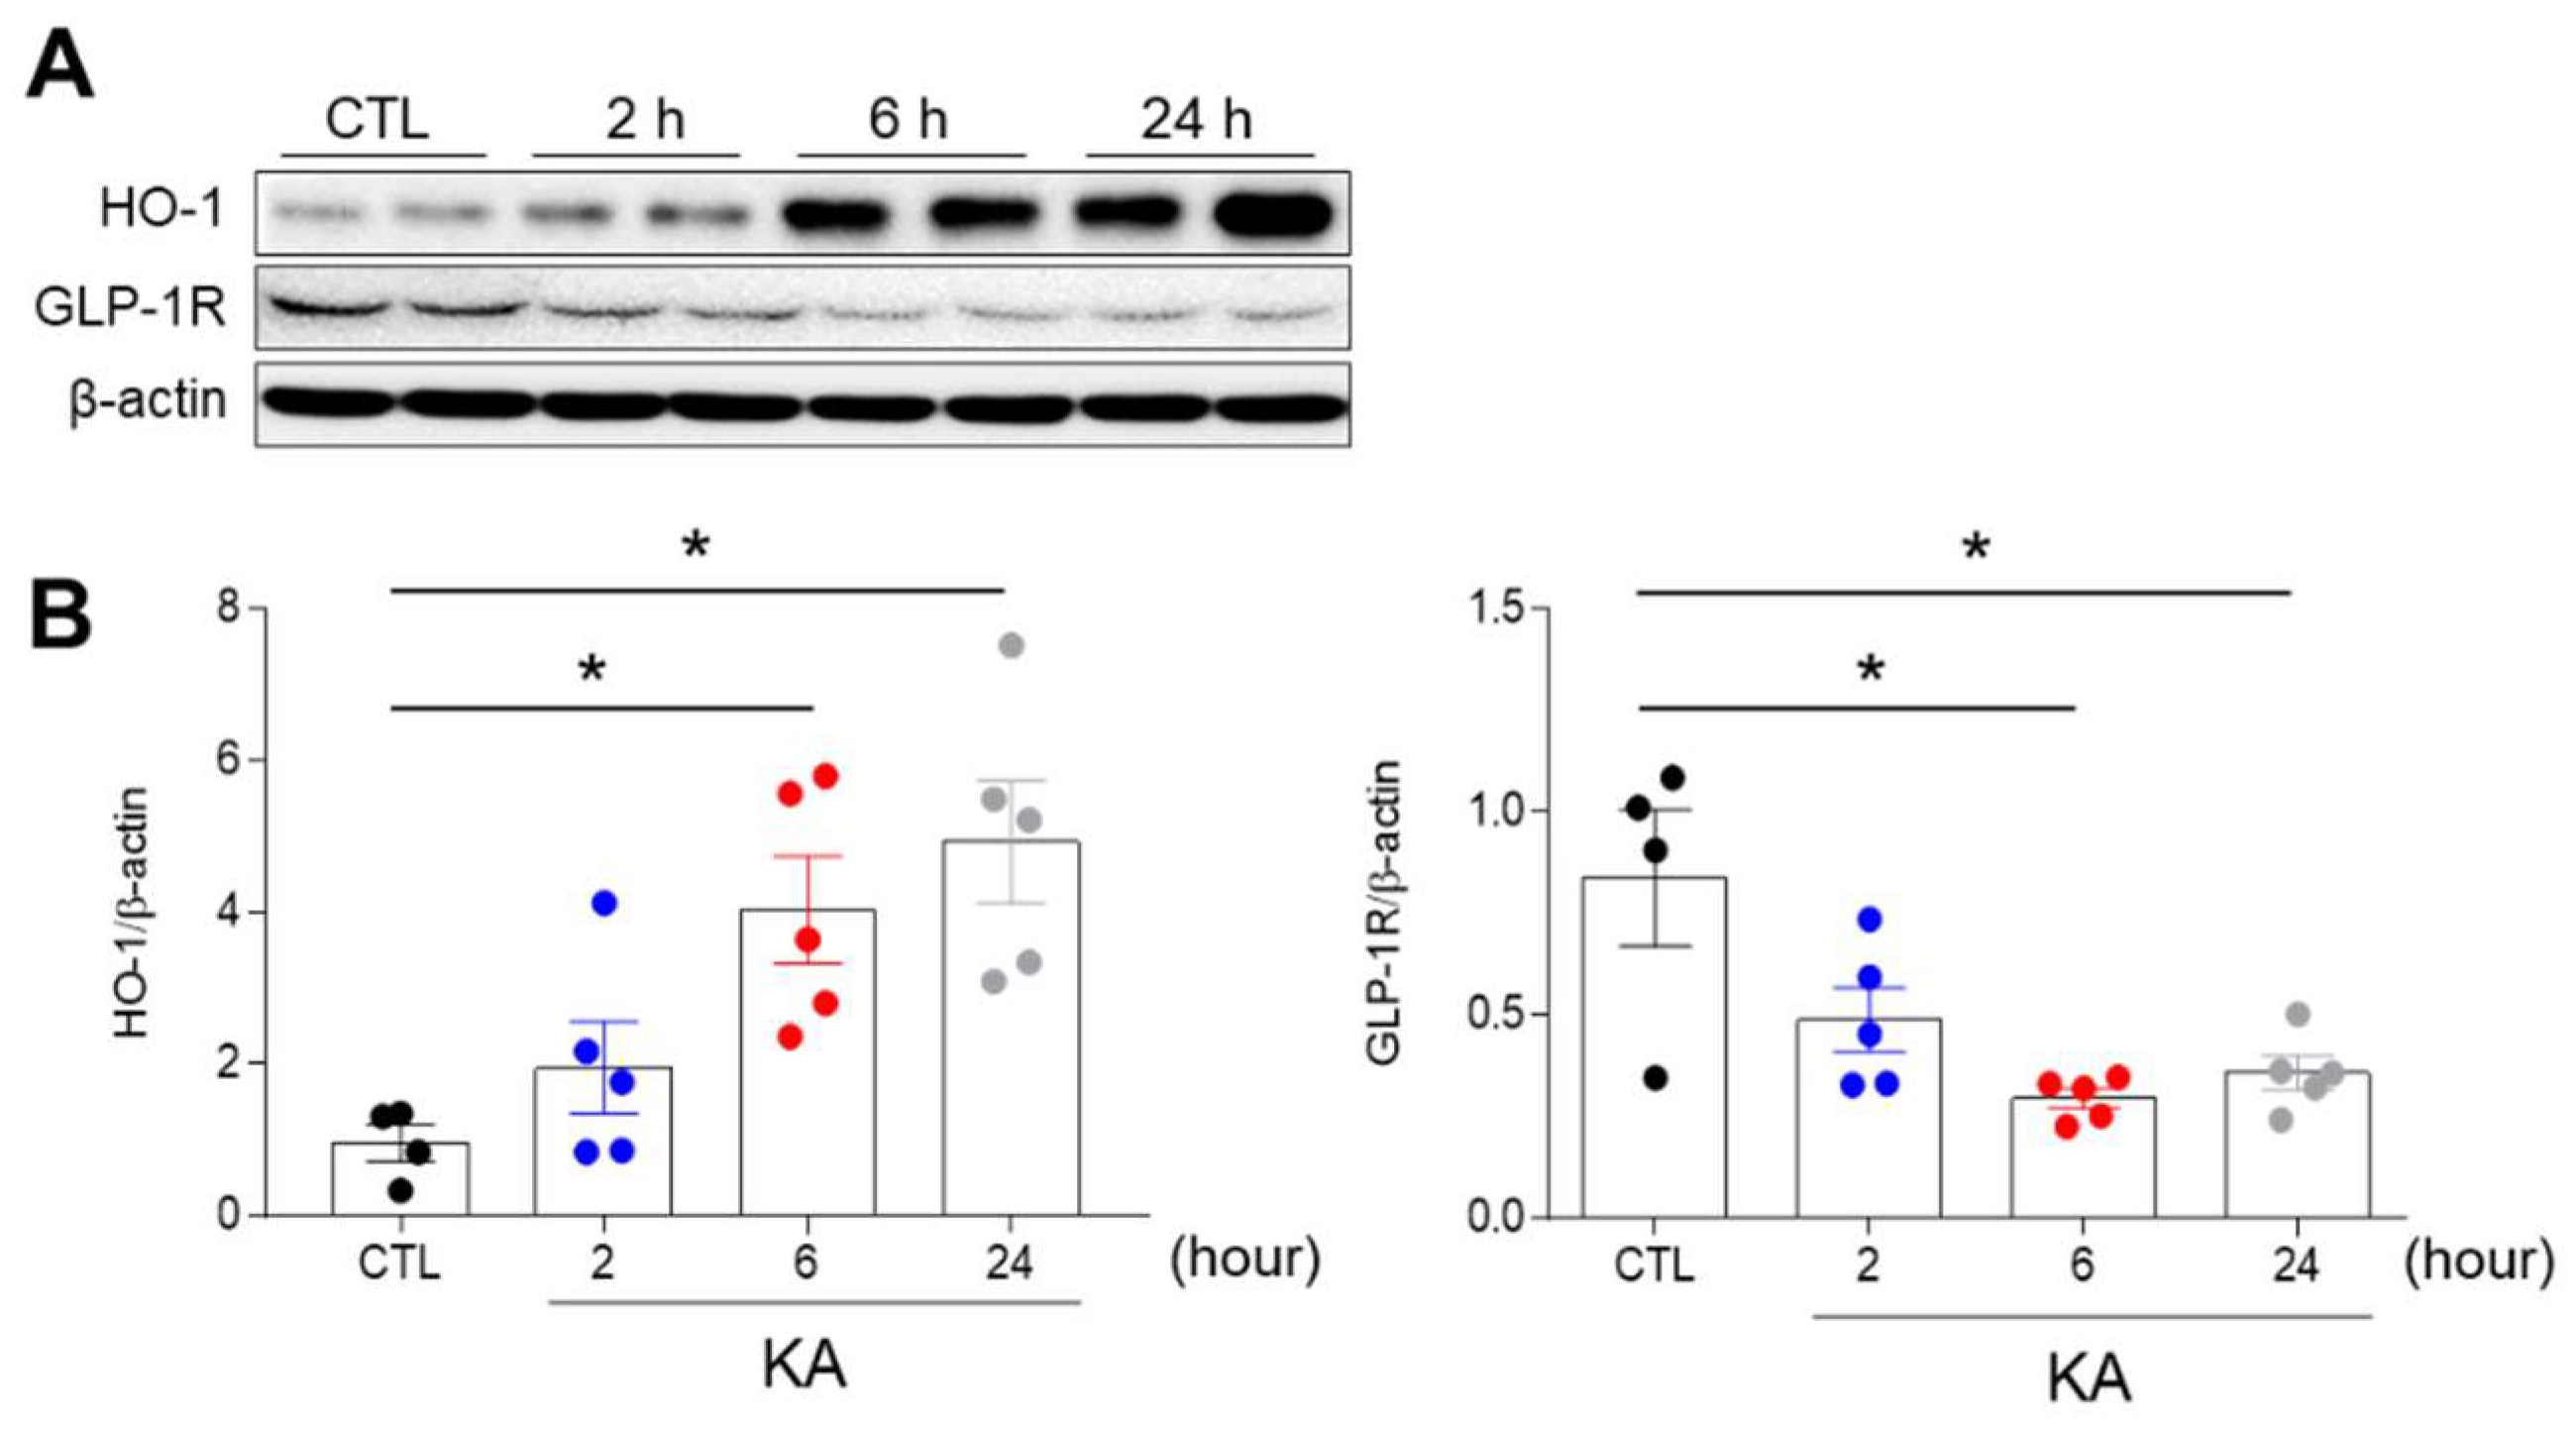
Abstract
1. Introduction
2. Materials and Methods
2.1. Animals
2.2. Ex-4-Albumin Binding Domain (ABD) Protein Expression and Purification
2.3. Drug Treatment and Seizure Mouse Model
2.4. Enzyme-Linked Immunosorbent Assay (ELISA)
2.5. Tissue Preparation and Cresyl Violet Staining
2.6. Terminal Deoxynucleotidyl Transferase dUTP Nick End Labeling (TUNEL) Assay
2.7. Western Blot Analysis
2.8. Proximity Ligation Assay (PLA)
2.9. Double Immunofluorescence
2.10. Immunohistochemistry
2.11. Quantification of Histological Data
2.12. Statistical Analysis
3. Results
3.1. KA Treatment Affects the Hippocampal Expression of Heme Oxygenase-1 (HO-1) and GLP-1R in Mice
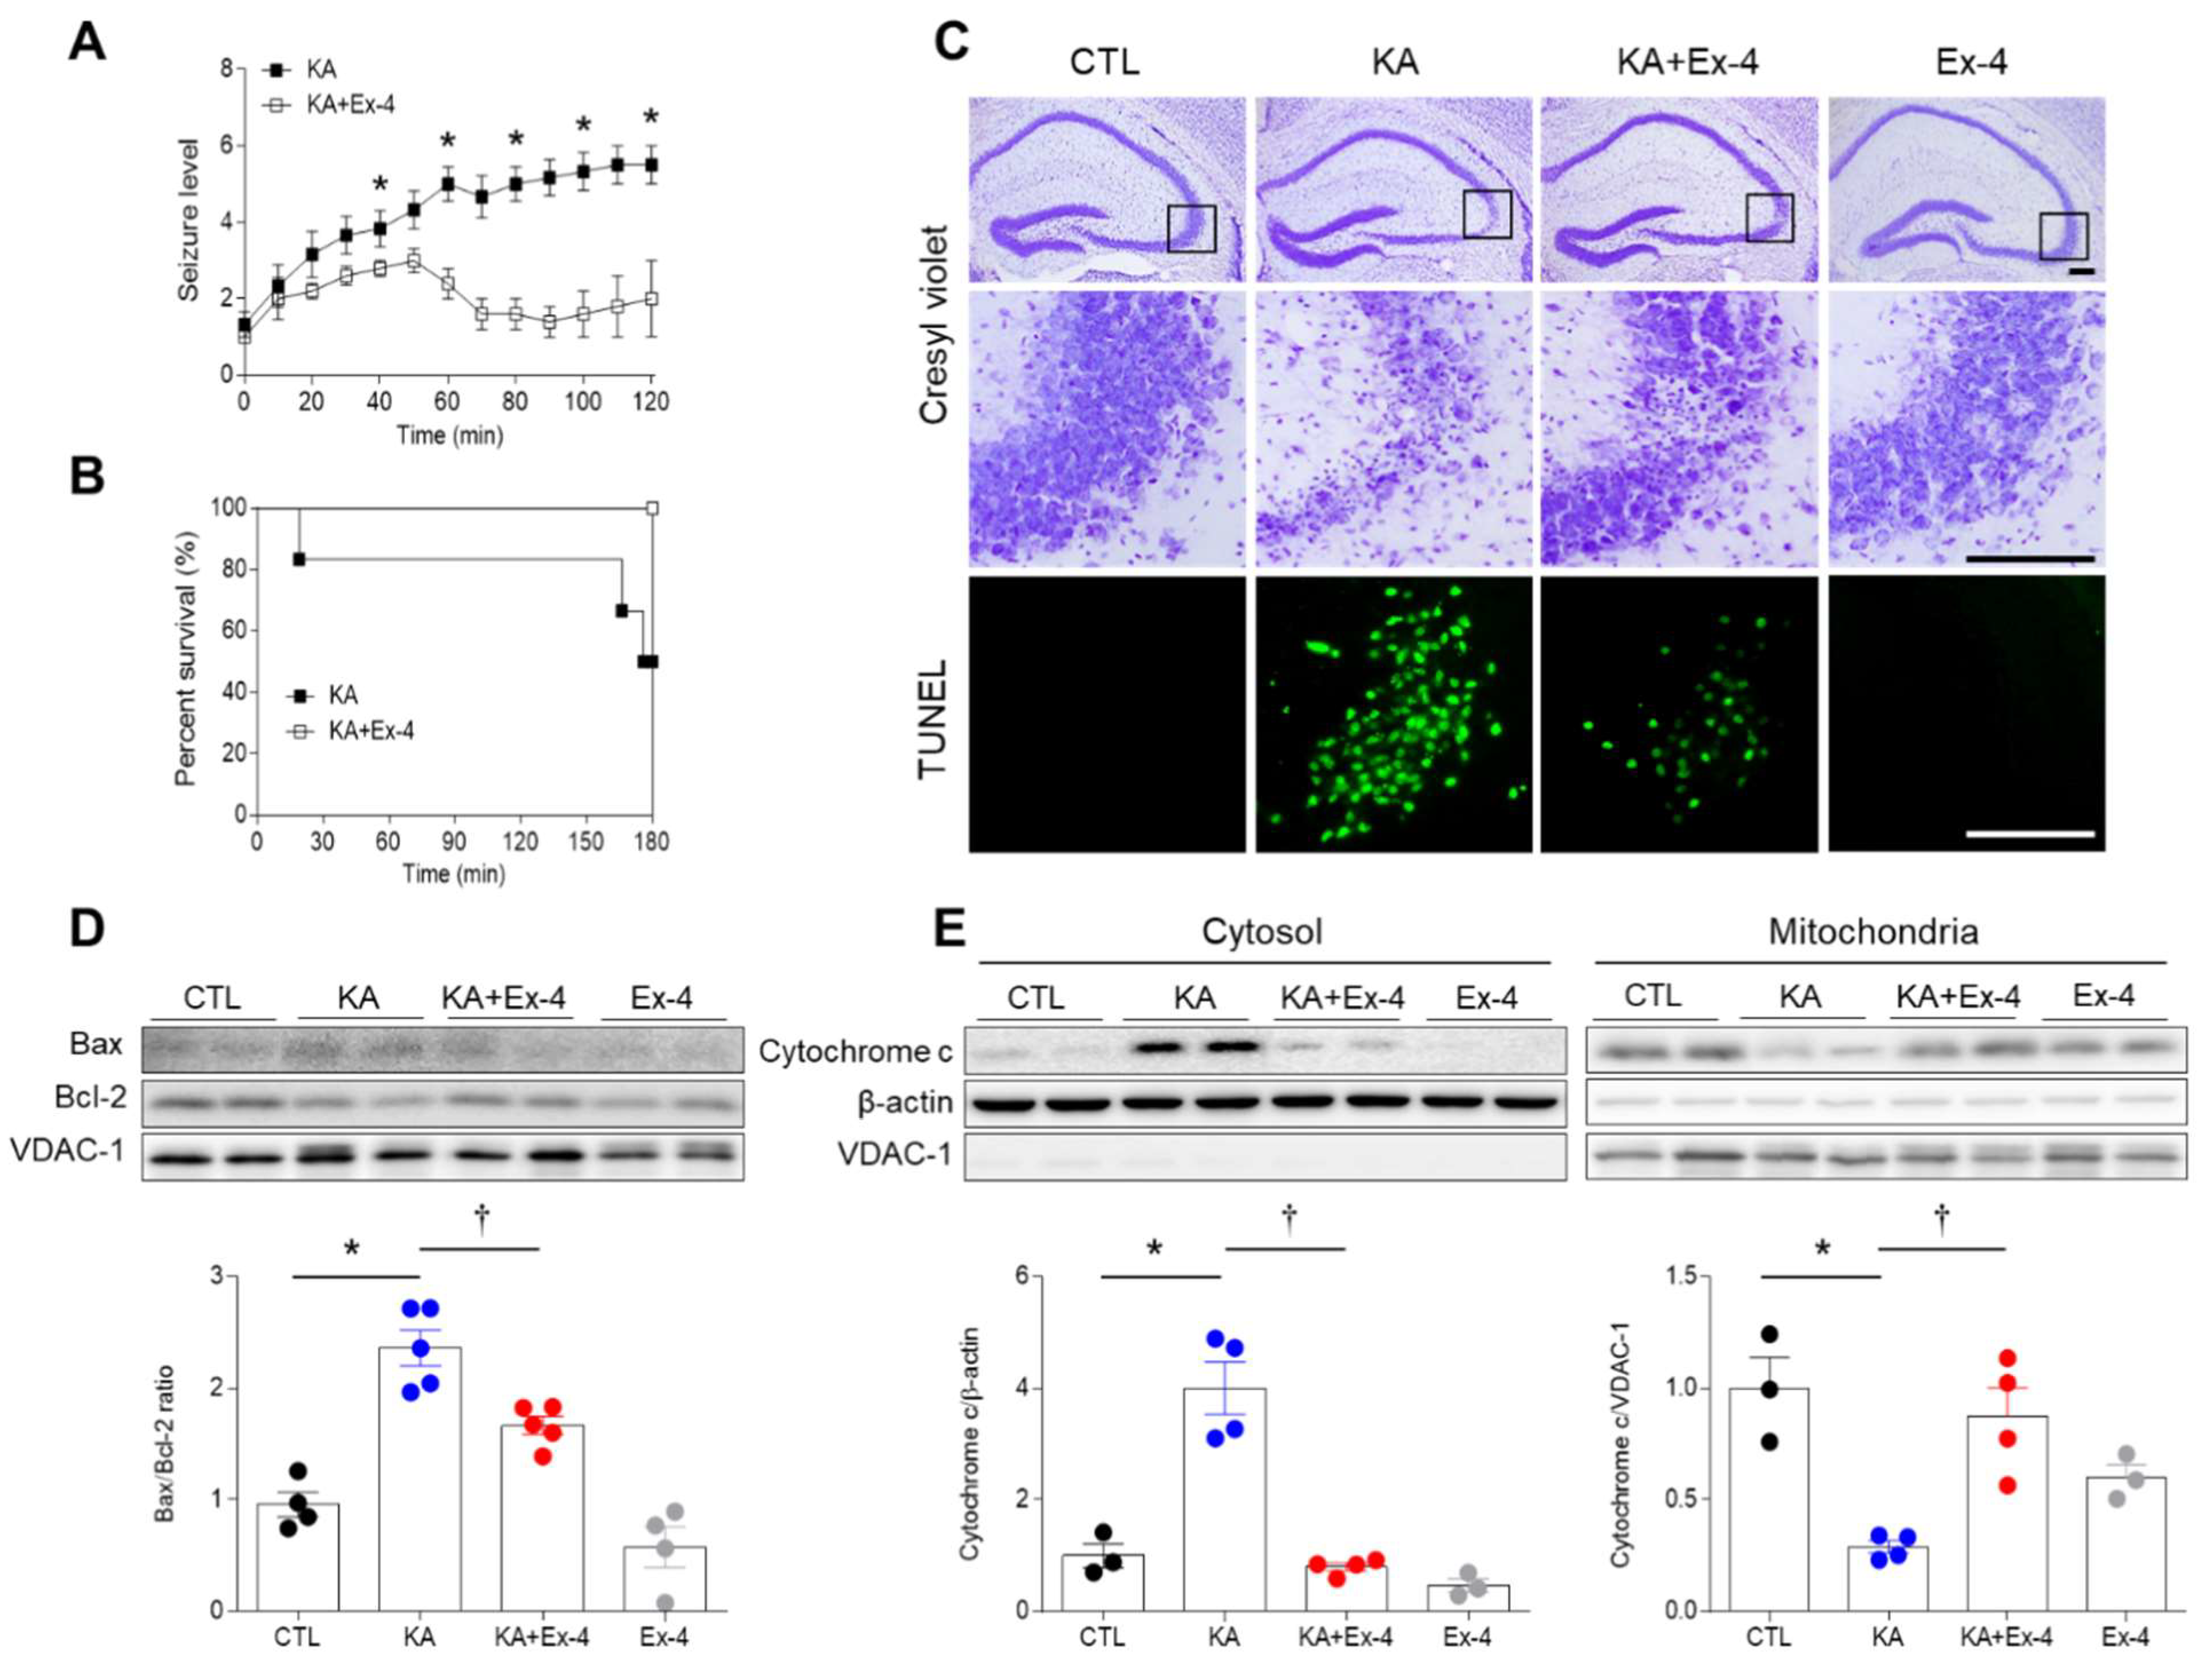
3.2. Ex-4 Pretreatment Reduces KA-Induced Seizure Activity and Hippocampal Cell Death in Mice
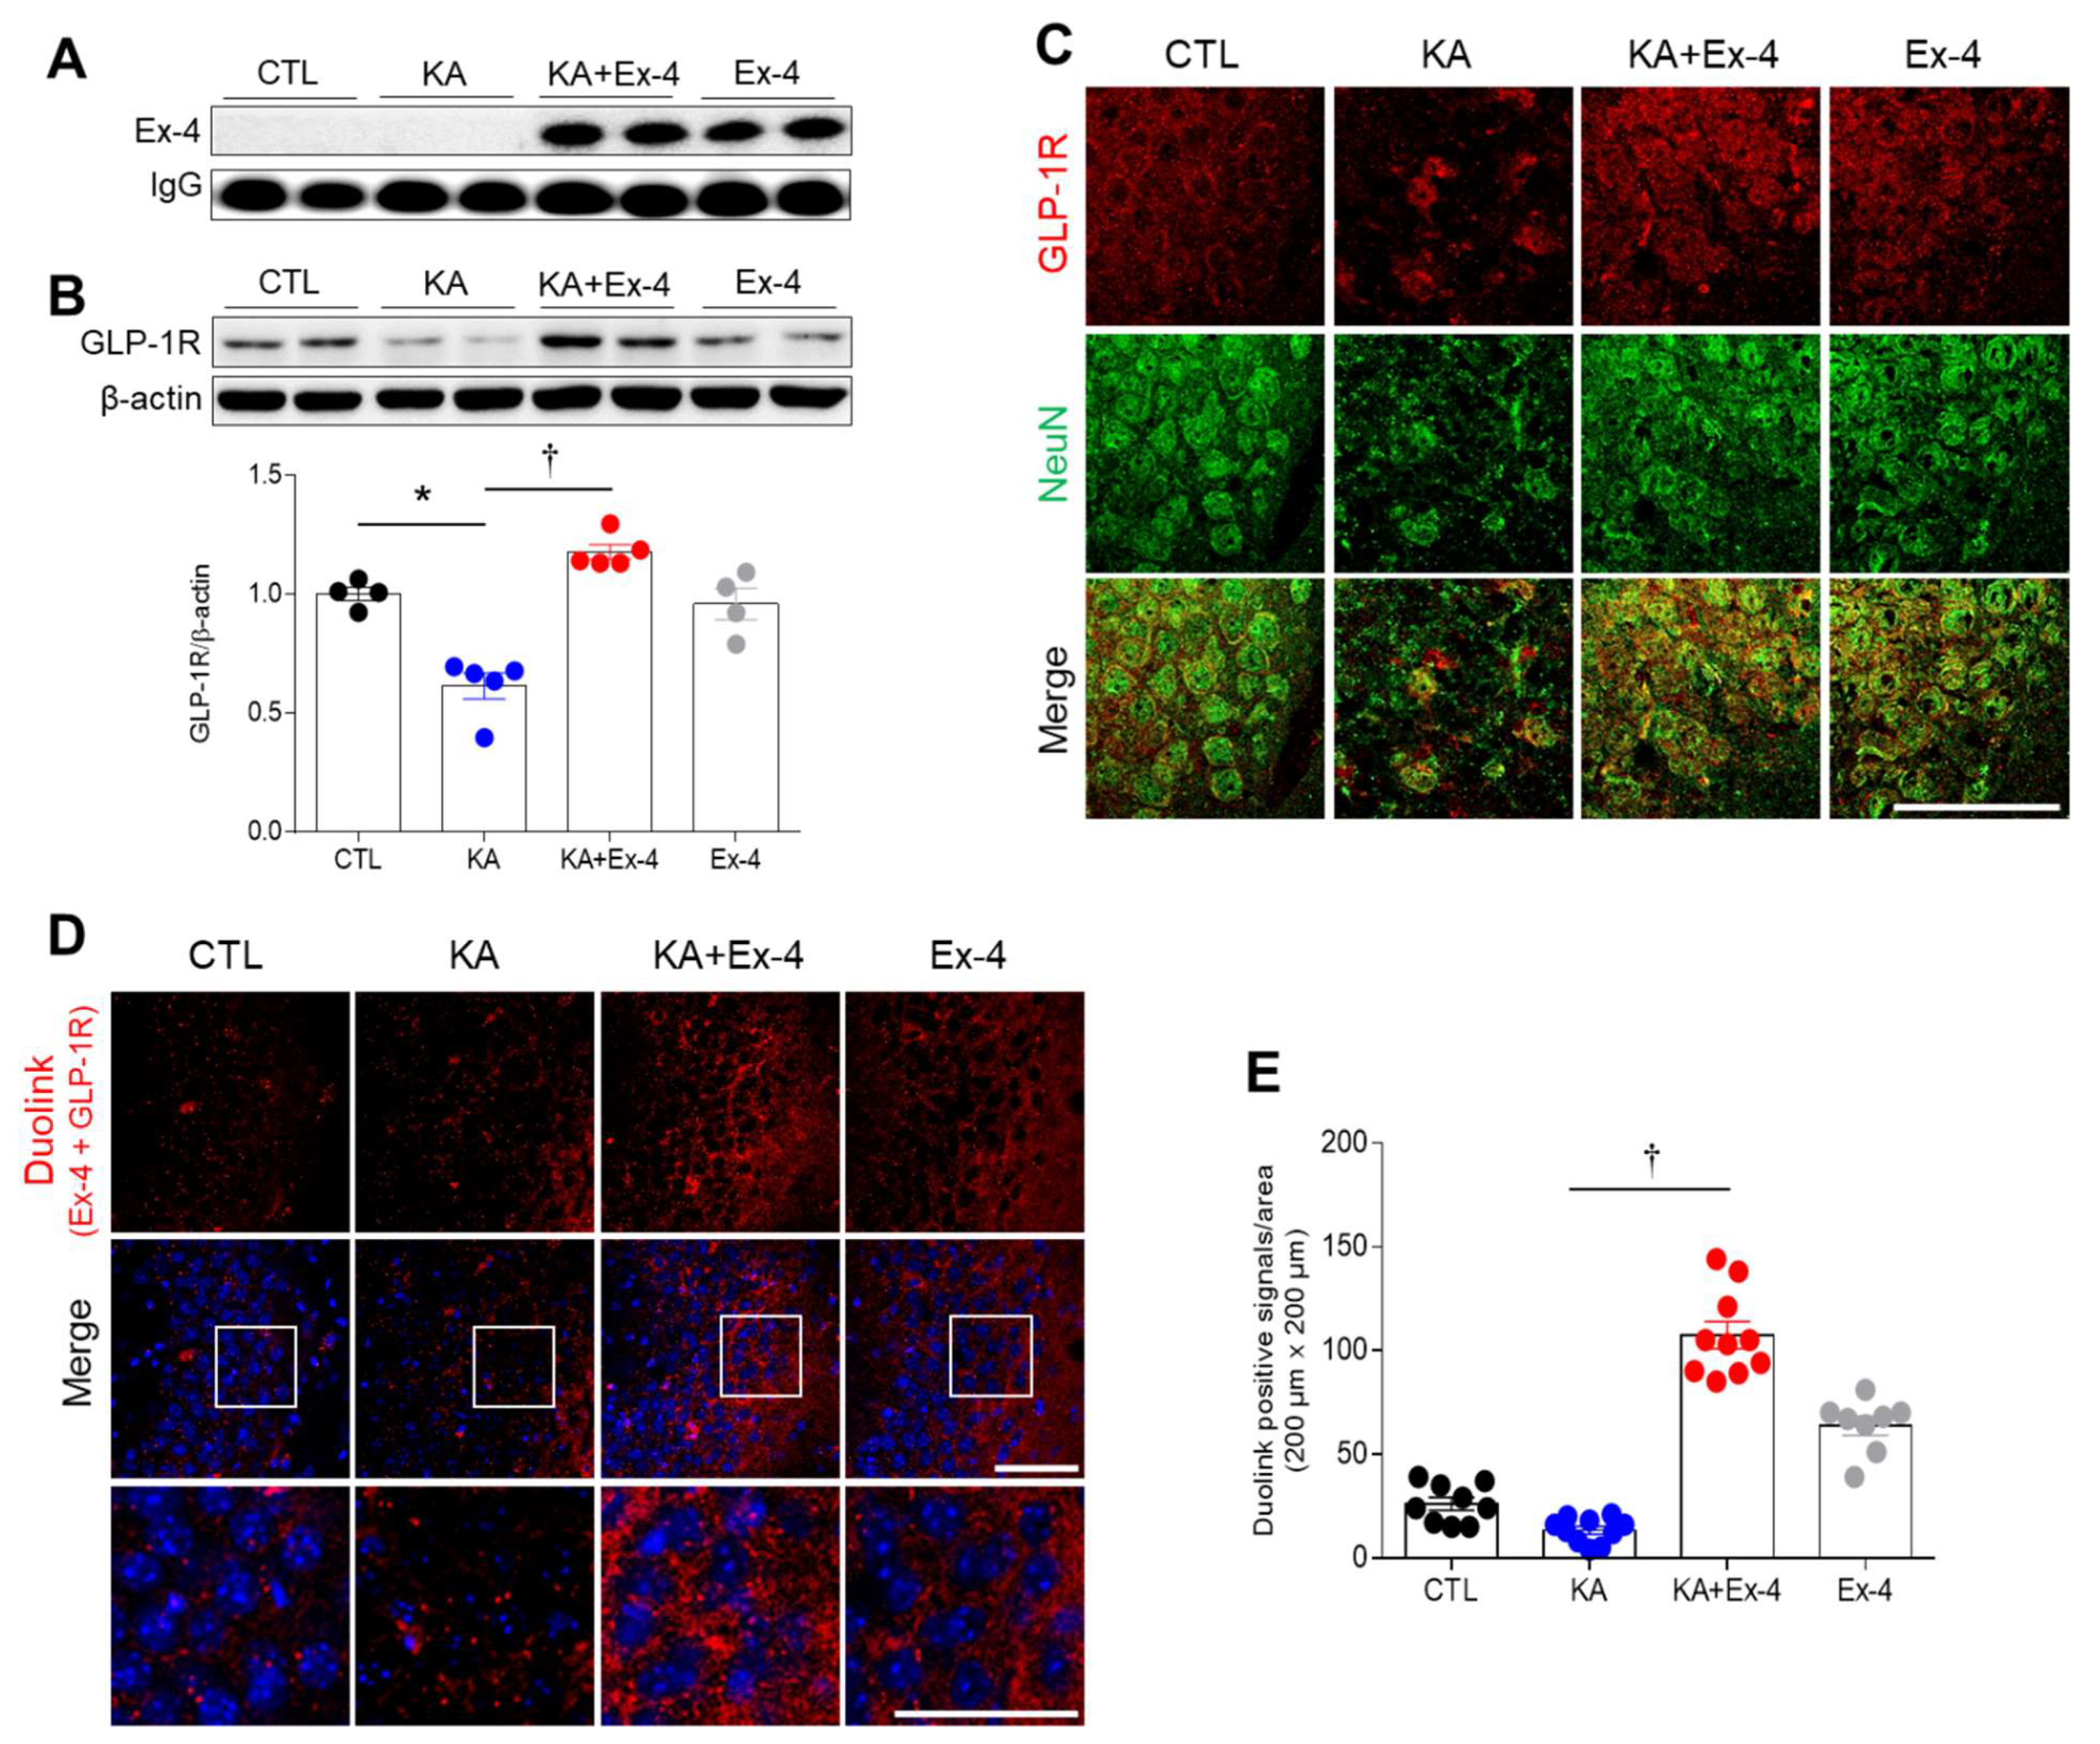
3.3. Ex-4 Pretreatment Prevents the Inhibition of GLP-1R Protein Expression in the Hippocampus of KA-Treated Mice
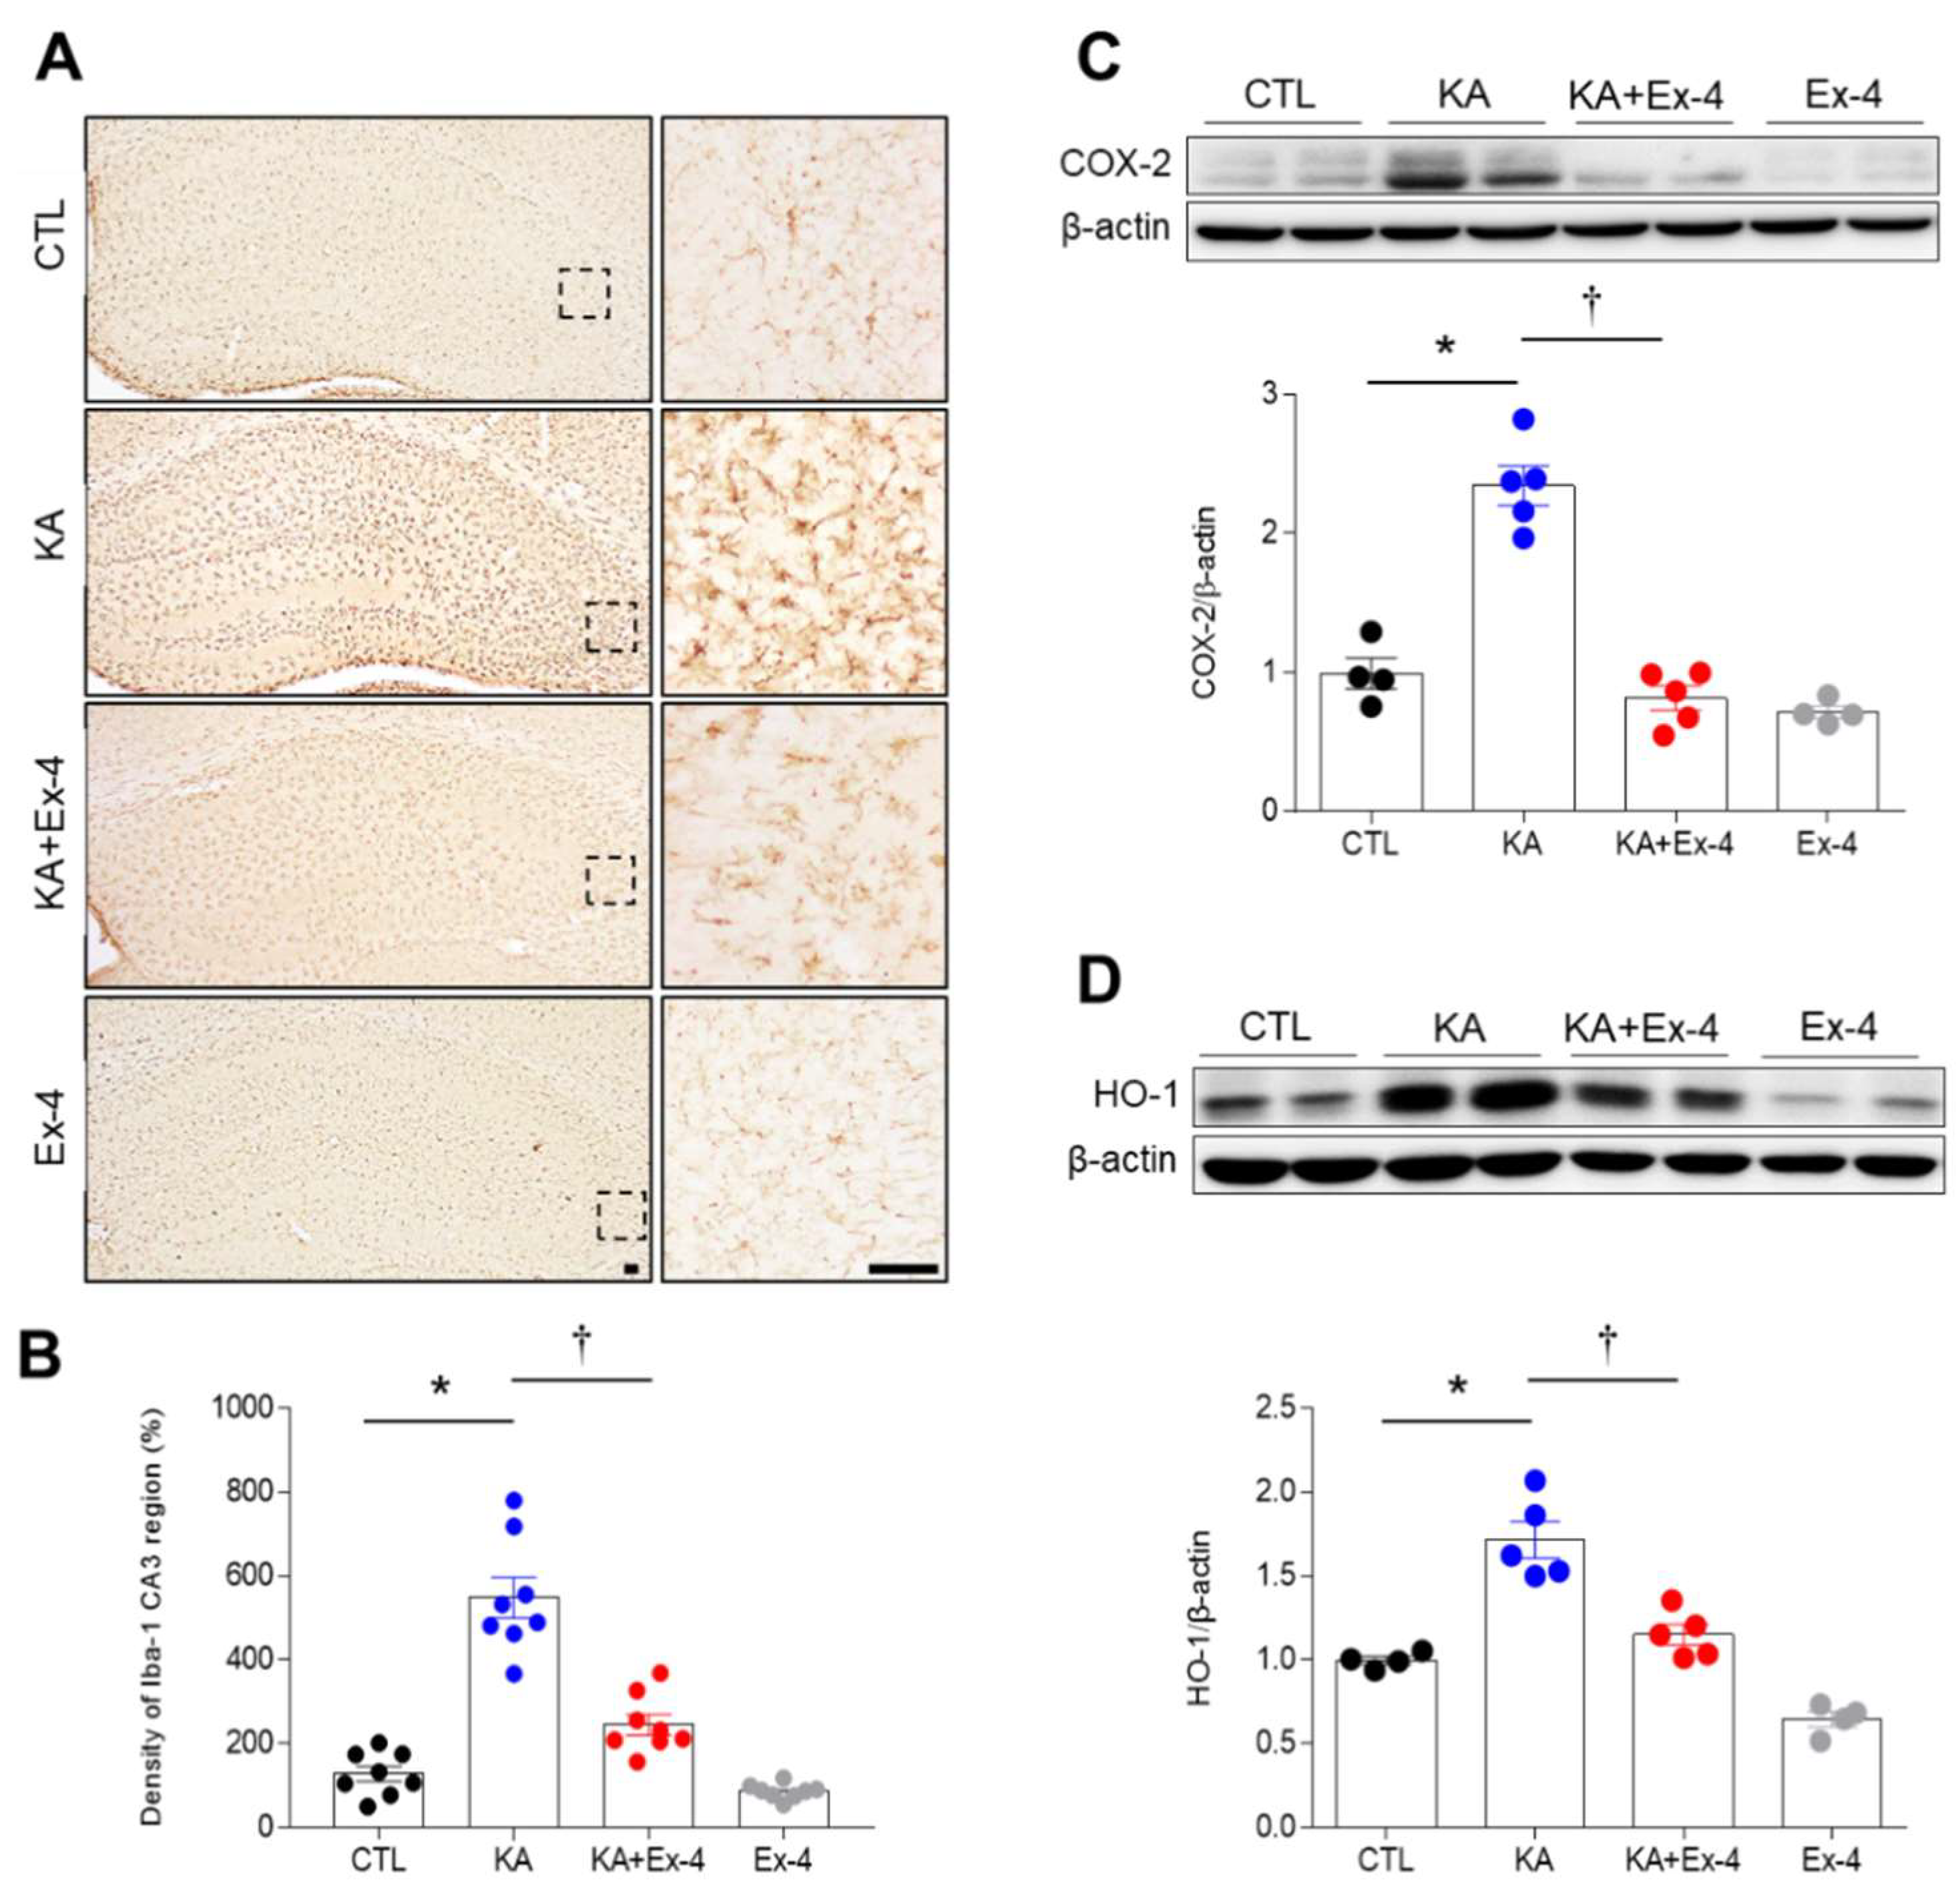
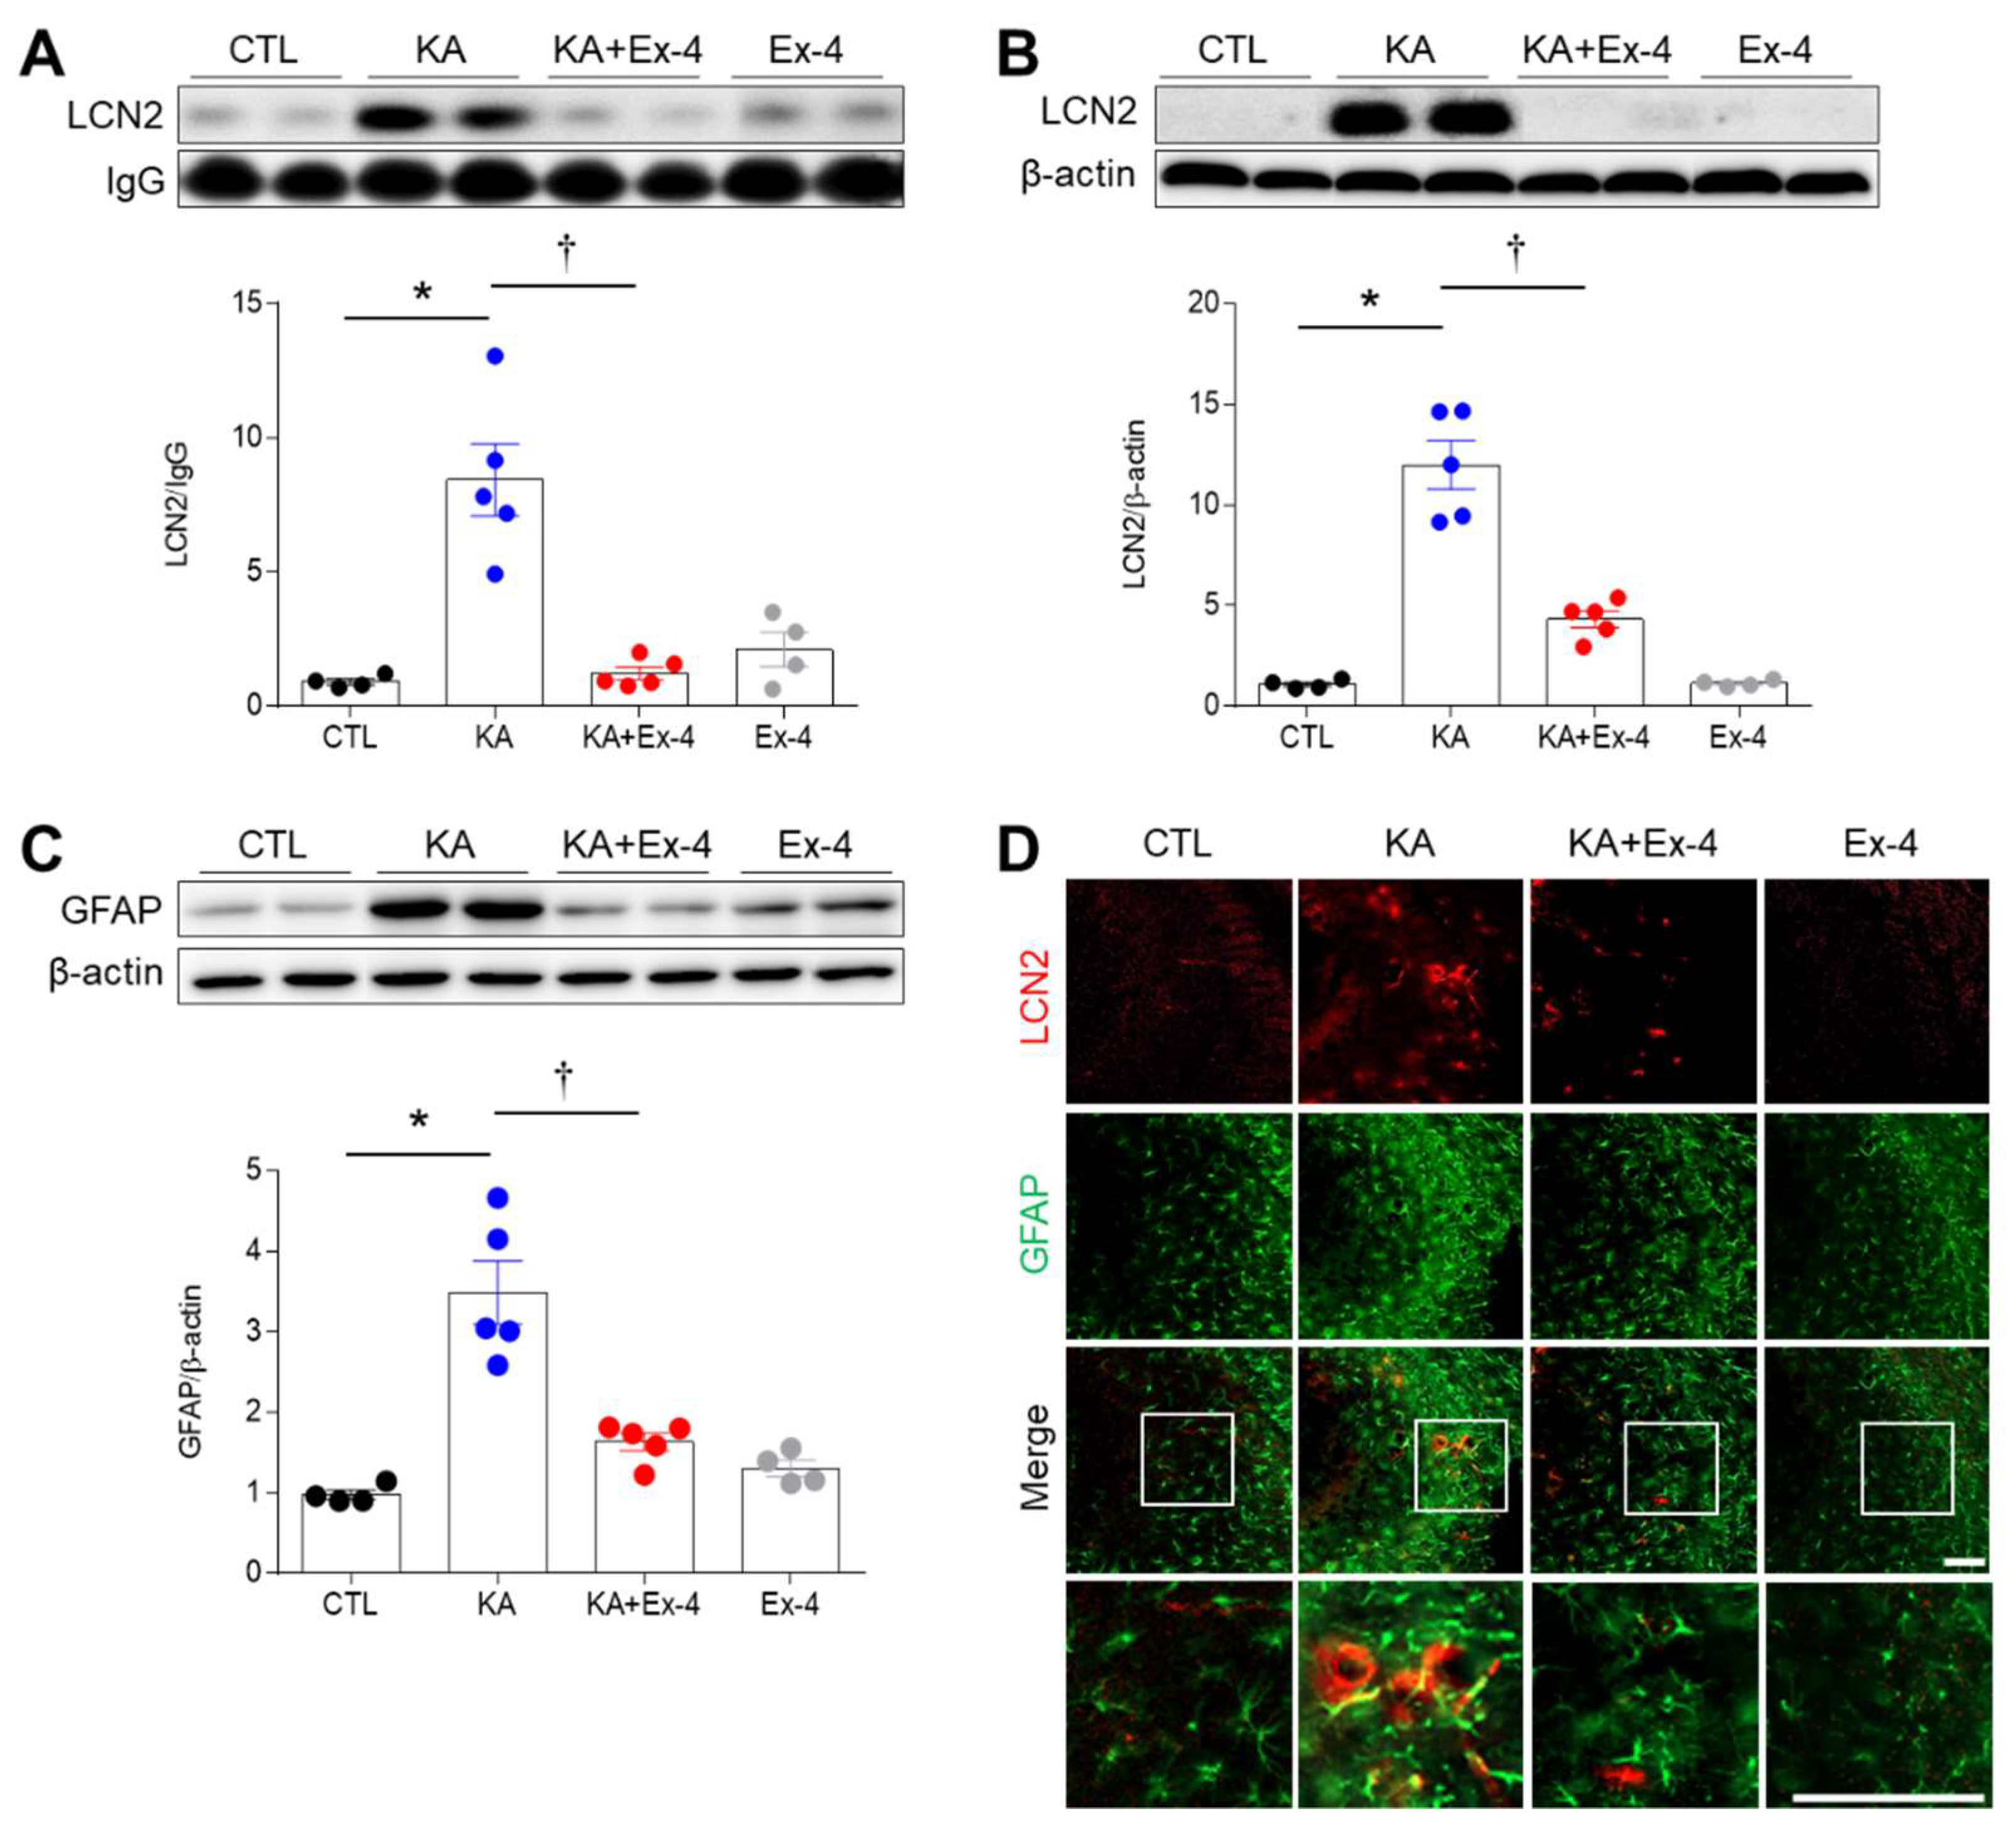
3.4. Ex-4 Pretreatment Attenuates Neuroinflammation in KA-Treated Mice
3.5. Ex-4 Pretreatment Attenuates Neuroinflammation in KA-Treated Mice
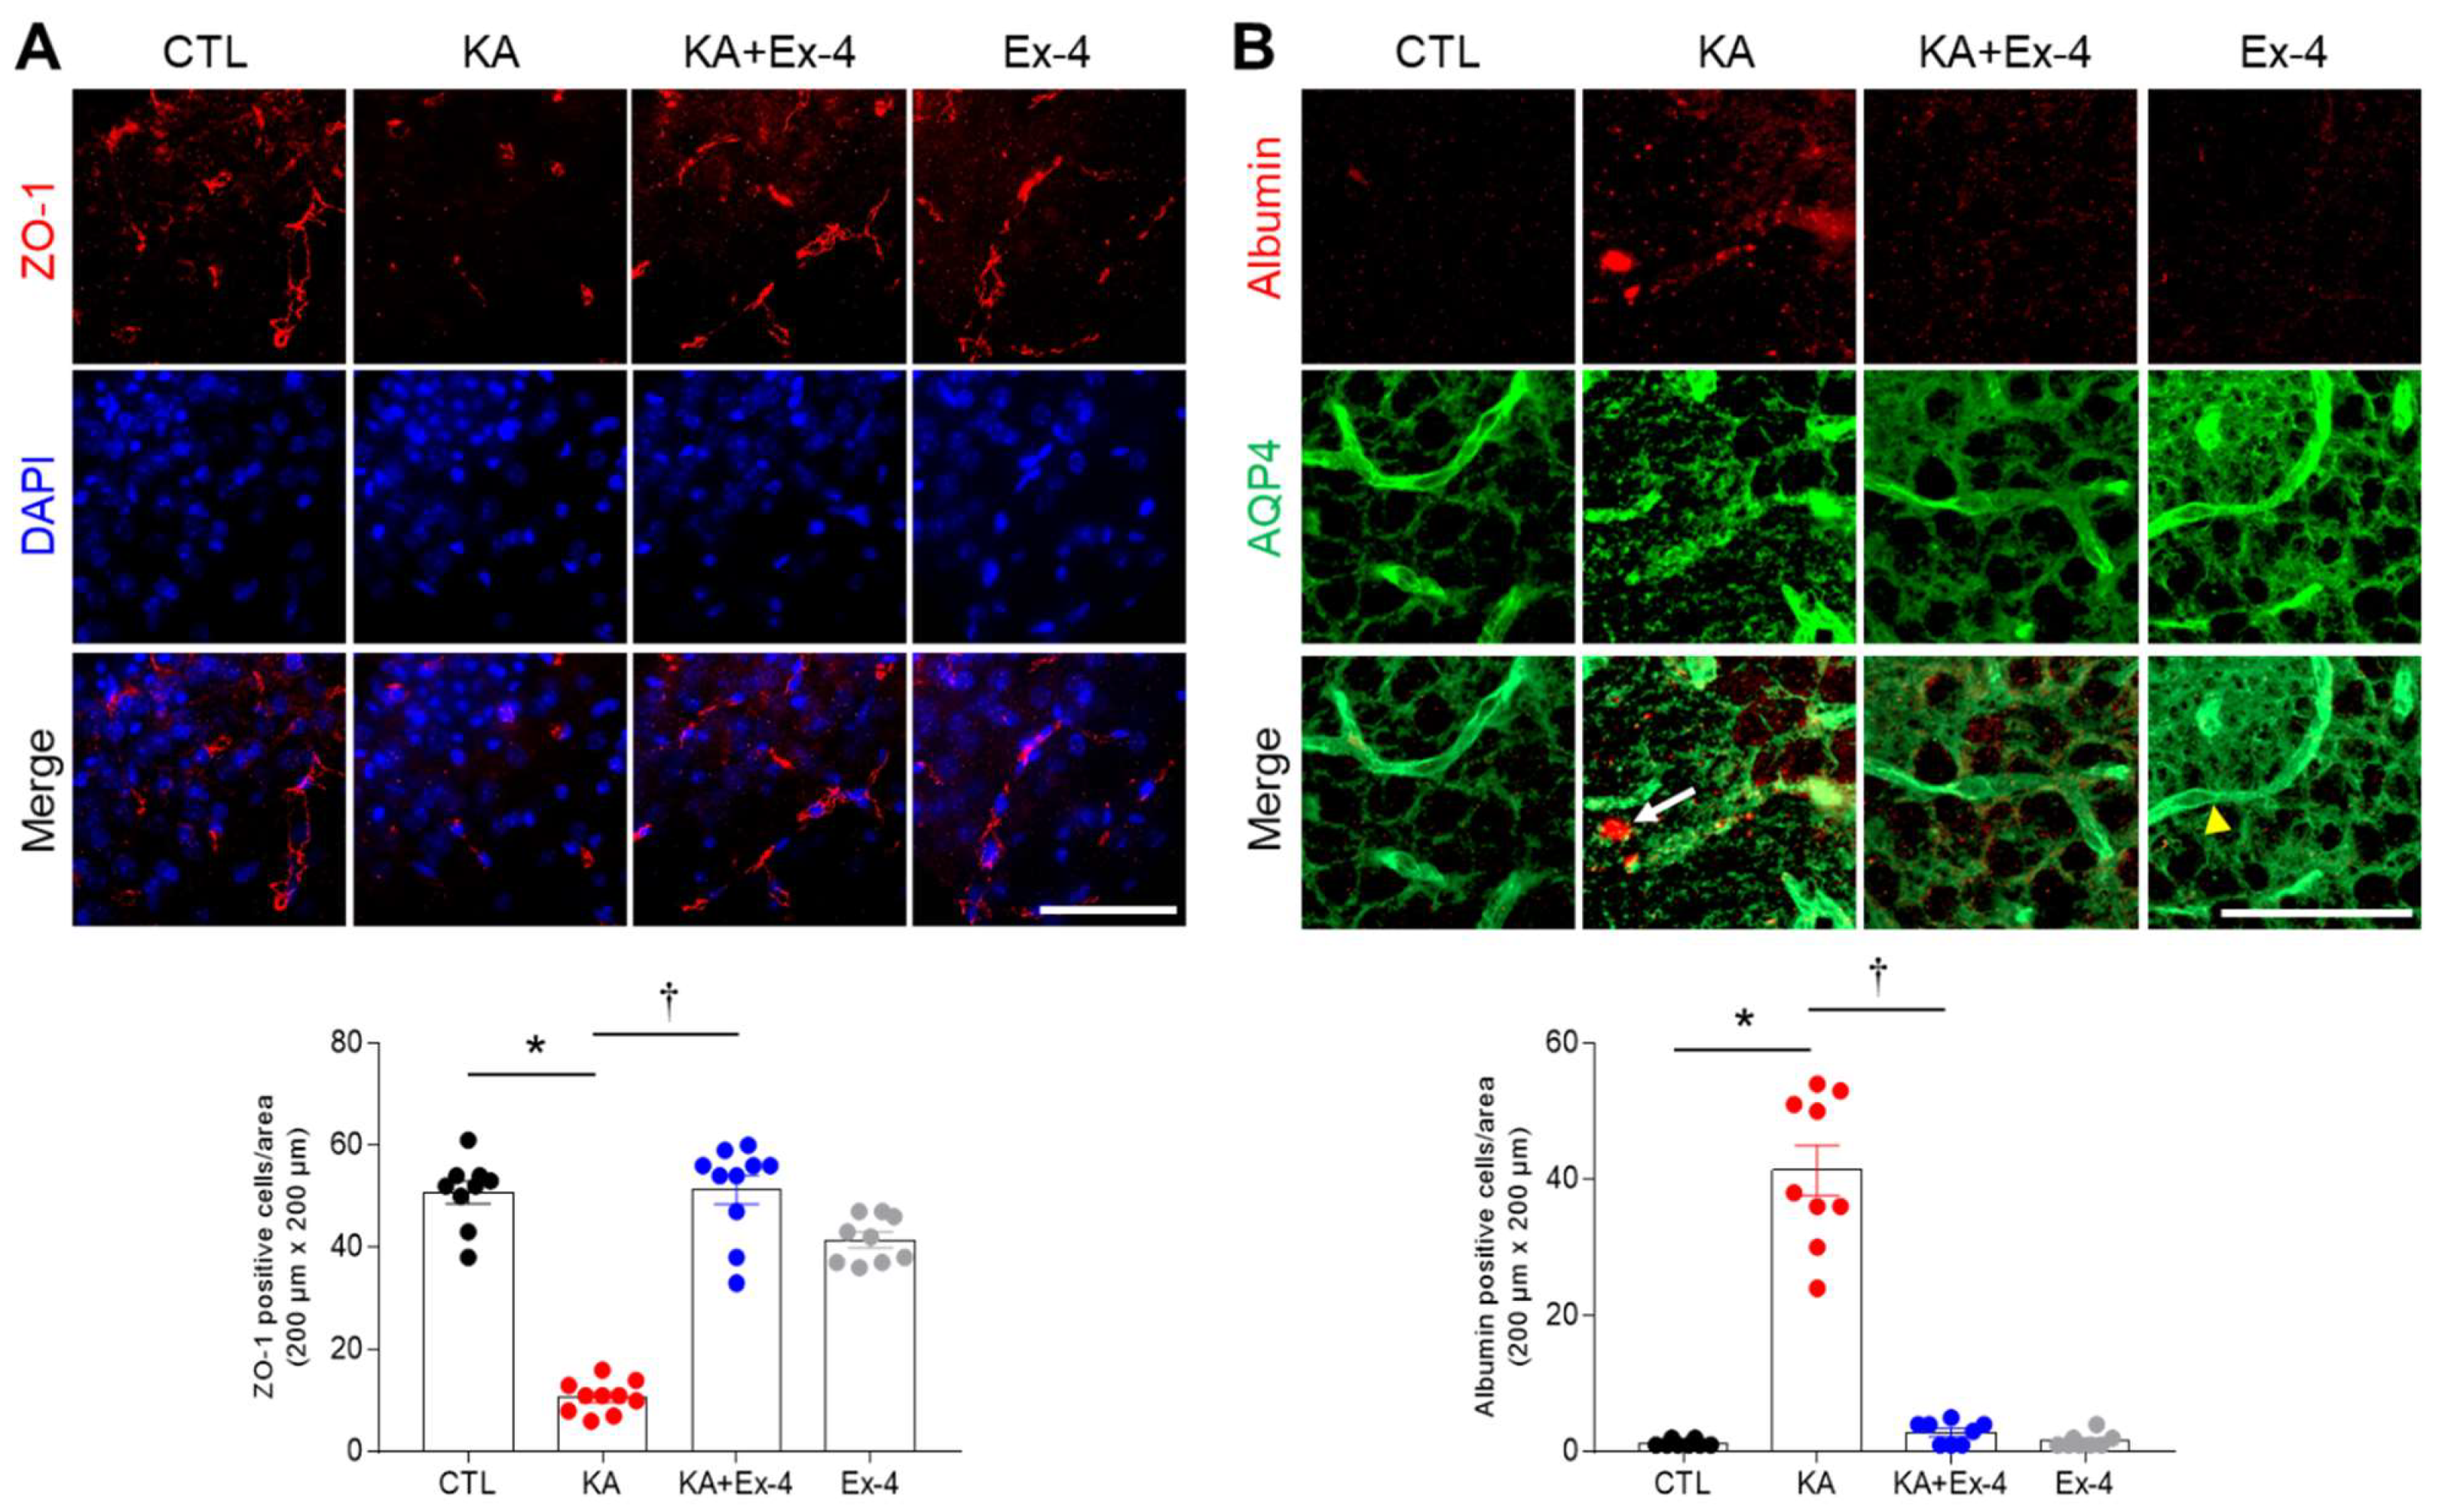
3.6. Ex-4 Pretreatment Protects against BBB Leakage in KA-Treated Mouse Hippocampus
3.7. Ex-4 Pretreatment Affects Hippocampal p-CREB Expression in KA-Treated Mice
4. Discussion
5. Conclusions
Supplementary Materials
Author Contributions
Funding
Institutional Review Board Statement
Informed Consent Statement
Data Availability Statement
Acknowledgments
Conflicts of Interest
References
- Shin, H.J.; Jeong, E.A.; Lee, J.Y.; An, H.S.; Jang, H.M.; Ahn, Y.J.; Lee, J.; Kim, K.E.; Roh, G.S. Lipocalin-2 Deficiency Reduces Oxidative Stress and Neuroinflammation and Results in Attenuation of Kainic Acid-Induced Hippocampal Cell Death. Antioxidants 2021, 10, 100. [Google Scholar] [CrossRef] [PubMed]
- Bordey, A.; Sontheimer, H. Properties of human glial cells associated with epileptic seizure foci. Epilepsy Res. 1998, 32, 286–303. [Google Scholar] [CrossRef]
- Shin, H.J.; Lee, J.Y.; Son, E.; Lee, D.H.; Kim, H.J.; Kang, S.S.; Cho, G.J.; Choi, W.S.; Roh, G.S. Curcumin attenuates the kainic acid-induced hippocampal cell death in the mice. Neurosci. Lett. 2007, 416, 49–54. [Google Scholar] [CrossRef]
- Gronlund, K.M.; Gerhart, D.Z.; Leino, R.L.; McCall, A.L.; Drewes, L.R. Chronic Seizures Increase Glucose Transporter Abundance in Rat Brain. J. Neuropathol. Exp. Neurol. 1996, 55, 832–840. [Google Scholar] [CrossRef] [PubMed][Green Version]
- Gupta, R.C.; Dettbarn, W.-D. Prevention of kainic acid seizures-induced changes in levels of nitric oxide and high-energy phosphates by 7-nitroindazole in rat brain regions. Brain Res. 2003, 981, 184–192. [Google Scholar] [CrossRef]
- Sapolsky, R.M.; Stein, B.A. Status epilepticus-induced hippocampal damage is modulated by glucose availability. Neurosci. Lett. 1989, 97, 157–162. [Google Scholar] [CrossRef]
- Schurr, A.; Rigor, B.M. Kainate toxicity in energy-compromised rat hippocampal slices: Differences between oxygen and glucose deprivation. Brain Res. 1993, 614, 10–14. [Google Scholar] [CrossRef]
- Kang, D.H.; Heo, R.W.; Yi, C.-O.; Kim, H.; Choi, C.H.; Roh, G.S. High-fat diet-induced obesity exacerbates kainic acid-induced hippocampal cell death. BMC Neurosci. 2015, 16, 72. [Google Scholar] [CrossRef]
- Xie, Z.; Enkhjargal, B.; Wu, L.; Zhou, K.; Sun, C.; Hu, X.; Gospodarev, V.; Tang, J.; You, C.; Zhang, J.H. Exendin-4 attenuates neuronal death via GLP-1R/PI3K/Akt pathway in early brain injury after subarachnoid hemorrhage in rats. Neuropharmacology 2018, 128, 142–151. [Google Scholar] [CrossRef]
- Kastin, A.J.; Akerstrom, V.; Pan, W. Interactions of Glucagon-Like Peptide-1 (GLP-1) with the Blood-Brain Barrier. J. Mol. Neurosci. 2002, 18, 7–13. [Google Scholar] [CrossRef]
- Kastin, A.J.; Akerstrom, V. Entry of exendin-4 into brain is rapid but may be limited at high doses. Int. J. Obes. 2003, 27, 313–318. [Google Scholar] [CrossRef] [PubMed]
- Zhang, Y.; Fang, J.; Feng, W.; Sun, Q.; Xu, J.; Xia, Q. The role of the GLP-1/GLP-1R signaling pathway in regulating seizure susceptibility in rats. Brain Res. Bull. 2018, 142, 47–53. [Google Scholar] [CrossRef]
- During, M.J.; Cao, L.; Zuzga, D.S.; Francis, J.S.; Fitzsimons, H.L.; Jiao, X.; Bland, R.J.; Klugmann, M.; Banks, W.; Drucker, D.J.; et al. Glucagon-like peptide-1 receptor is involved in learning and neuroprotection. Nat. Med. 2003, 9, 1173–1179. [Google Scholar] [CrossRef]
- Zhang, Y.; Liu, Y.; Xu, J.; Sun, Q.; Yu, F.; Cheng, J.; Peng, B.; Liu, W.; Xiao, Z.; Yin, J.; et al. Inhibition of DPP4 enhances inhibitory synaptic transmission through activating the GLP-1/GLP-1R signaling pathway in a rat model of febrile seizures. Biochem. Pharmacol. 2018, 156, 78–85. [Google Scholar] [CrossRef]
- Wen, Y.; Wu, K.; Xie, Y.; Dan, W.; Zhan, Y.; Shi, Q. Inhibitory effects of glucagon-like peptide-1 receptor on epilepsy. Biochem. Biophys. Res. Commun. 2019, 511, 79–86. [Google Scholar] [CrossRef]
- Teramoto, S.; Miyamoto, N.; Yatomi, K.; Tanaka, Y.; Oishi, H.; Arai, H.; Hattori, N.; Urabe, T. Exendin-4, a Glucagon-Like Peptide-1 Receptor Agonist, Provides Neuroprotection in Mice Transient Focal Cerebral Ischemia. Br. J. Pharmacol. 2011, 31, 1696–1705. [Google Scholar] [CrossRef] [PubMed]
- Kitagawa, K. CREB and cAMP response element-mediated gene expression in the ischemic brain. FEBS J. 2007, 274, 3210–3217. [Google Scholar] [CrossRef] [PubMed]
- Li, Y.; Tweedie, D.; Mattson, M.P.; Holloway, H.W.; Greig, N.H. Enhancing the GLP-1 receptor signaling pathway leads to proliferation and neuroprotection in human neuroblastoma cells. J. Neurochem. 2010, 113, 1621–1631. [Google Scholar] [CrossRef] [PubMed]
- Erbil, D.; Eren, C.Y.; Demirel, C.; Küçüker, M.U.; Solaroğlu, I.; Eser, H.Y. GLP-1′s role in neuroprotection: A systematic review. Brain Inj. 2019, 33, 734–819. [Google Scholar] [CrossRef] [PubMed]
- Zhang, H.; Meng, J.; Zhou, S.; Liu, Y.; Qu, D.; Wang, L.; Li, X.; Wang, N.; Luo, X.; Ma, X. Intranasal Delivery of Exendin-4 Confers Neuroprotective Effect Against Cerebral Ischemia in Mice. AAPS J. 2015, 18, 385–394. [Google Scholar] [CrossRef] [PubMed]
- Perry, T.; Haughey, N.J.; Mattson, M.P.; Egan, J.M.; Greig, N.H. Protection and Reversal of Excitotoxic Neuronal Damage by Glucagon-Like Peptide-1 and Exendin-4. J. Pharmacol. Exp. Ther. 2002, 302, 881–888. [Google Scholar] [CrossRef] [PubMed]
- Park, K.-A.; Jin, Z.; Lee, J.Y.; An, H.S.; Choi, E.B.; Kim, K.E.; Shin, H.J.; Jeong, E.A.; Min, K.A.; Shin, M.C.; et al. Long-Lasting Exendin-4 Fusion Protein Improves Memory Deficits in High-Fat Diet/Streptozotocin-Induced Diabetic Mice. Pharmaceutics 2020, 12, 159. [Google Scholar] [CrossRef]
- Lee, J.Y.; Park, T.; Hong, E.; Amatya, R.; Park, K.-A.; Park, Y.-H.; Min, K.A.; Jin, M.; Lee, S.; Hwang, S.; et al. Genetic engineering of novel super long-acting Exendin-4 chimeric protein for effective treatment of metabolic and cognitive complications of obesity. Biomaterials 2020, 257, 120250. [Google Scholar] [CrossRef] [PubMed]
- Jeong, E.A.; Jeon, B.T.; Shin, H.J.; Kim, N.; Lee, D.H.; Kim, H.J.; Kang, S.S.; Cho, G.J.; Choi, W.S.; Roh, G.S. Ketogenic diet-induced peroxisome proliferator-activated receptor-γ activation decreases neuroinflammation in the mouse hippocampus after kainic acid-induced seizures. Exp. Neurol. 2011, 232, 195–202. [Google Scholar] [CrossRef] [PubMed]
- Ku, B.M.; Joo, Y.; Mun, J.; Roh, G.S.; Kang, S.S.; Cho, G.J.; Choi, W.S.; Kim, H.J. Heme oxygenase protects hippocampal neurons from ethanol-induced neurotoxicity. Neurosci. Lett. 2006, 405, 168–171. [Google Scholar] [CrossRef] [PubMed]
- Graham, D.L.; Durai, H.H.; Trammell, T.S.; Noble, B.L.; Mortlock, D.P.; Galli, A.; Stanwood, G.D. A novel mouse model of glucagon-like peptide-1 receptor expression: A look at the brain. J. Comp. Neurol. 2020, 528, 2445–2470. [Google Scholar] [CrossRef]
- Kim, Y.S.; Choi, M.Y.; Ryu, J.H.; Lee, D.H.; Jeon, B.T.; Roh, G.S.; Kang, S.S.; Kim, H.J.; Cho, G.J.; Choi, W.S. Clusterin interaction with Bcl-xL is associated with seizure-induced neuronal death. Epilepsy Res. 2012, 99, 240–251. [Google Scholar] [CrossRef]
- Reed, J.C. Mechanisms of apoptosis. Am. J. Pathol. 2000, 157, 1415–1430. [Google Scholar] [CrossRef]
- Yoshino, Y.; Ishisaka, M.; Tsujii, S.; Shimazawa, M.; Hara, H. Glucagon-like peptide-1 protects the murine hippocampus against stressors via Akt and ERK1/2 signaling. Biochem. Biophys. Res. Commun. 2015, 458, 274–279. [Google Scholar] [CrossRef]
- Zhou, H.; Yang, J.; Xin, T.; Li, D.; Guo, J.; Hu, S.; Zhou, S.; Zhang, T.; Zhang, Y.; Han, T.; et al. Exendin-4 protects adipose-derived mesenchymal stem cells from apoptosis induced by hydrogen peroxide through the PI3K/Akt–Sfrp2 pathways. Free Radic. Biol. Med. 2014, 77, 363–375. [Google Scholar] [CrossRef]
- Tu, X.-K.; Chen, Q.; Chen, S.; Huang, B.; Ren, B.-G.; Shi, S.-S. GLP-1R Agonist Liraglutide Attenuates Inflammatory Reaction and Neuronal Apoptosis and Reduces Early Brain Injury after Subarachnoid Hemorrhage in Rats. Inflammation 2021, 44, 397–406. [Google Scholar] [CrossRef]
- Park, S.W.; Mansur, R.B.; Lee, Y.; Lee, J.-H.; Seo, M.K.; Choi, A.J.; McIntyre, R.S.; Lee, J.G. Liraglutide Activates mTORC1 Signaling and AMPA Receptors in Rat Hippocampal Neurons Under Toxic Conditions. Front. Neurosci. 2018, 12, 756. [Google Scholar] [CrossRef] [PubMed]
- Combs, C.K. Are GLP-1 receptor agonists useful against traumatic brain injury? J. Neurochem. 2015, 135, 1059–1061. [Google Scholar] [CrossRef]
- Kim, D.-I.; Park, M.-J.; Choi, J.-H.; Lim, S.-K.; Choi, H.-J.; Park, S.-H. Hyperglycemia-induced GLP-1R downregulation causes RPE cell apoptosis. Int. J. Biochem. Cell Biol. 2015, 59, 41–51. [Google Scholar] [CrossRef] [PubMed]
- Tsao, P.; Cao, T.; von Zastrow, M. Role of endocytosis in mediating downregulation of G-protein-coupled receptors. Trends Pharmacol. Sci. 2001, 22, 91–96. [Google Scholar] [CrossRef]
- Fang, Z.; Chen, S.; Manchanda, Y.; Bitsi, S.; Pickford, P.; David, A.; Shchepinova, M.M.; Corrêa, I.R., Jr.; Hodson, D.J.; Broichhagen, J.; et al. Ligand-Specific Factors Influencing GLP-1 Receptor Post-Endocytic Trafficking and Degradation in Pancreatic Beta Cells. Int. J. Mol. Sci. 2020, 21, 8404. [Google Scholar] [CrossRef]
- Araki, T.; Ikegaya, Y.; Koyama, R. Microglia attenuate the kainic acid-induced death of hippocampal neurons in slice cultures. Neuropsychopharmacol. Rep. 2020, 40, 85–91. [Google Scholar] [CrossRef]
- Hostenbach, S.; Cambron, M.; D’Haeseleer, M.; Kooijman, R.; De Keyser, J. Astrocyte loss and astrogliosis in neuroinflammatory disorders. Neurosci. Lett. 2014, 565, 39–41. [Google Scholar] [CrossRef]
- Zhao, N.; Xu, X.; Jiang, Y.; Gao, J.; Wang, F.; Xu, X.; Wen, Z.; Xie, Y.; Li, J.; Li, R.; et al. Lipocalin-2 may produce damaging effect after cerebral ischemia by inducing astrocytes classical activation. J. Neuroinflamm. 2019, 16, 168. [Google Scholar] [CrossRef]
- Shin, H.J.; Kim, H.; Heo, R.W.; Kim, H.J.; Choi, W.S.; Kwon, H.M.; Roh, G.S. Tonicity-responsive enhancer binding protein haplodeficiency attenuates seizure severity and NF-κB-mediated neuroinflammation in kainic acid-induced seizures. Cell Death Differ. 2014, 21, 1095–1106. [Google Scholar] [CrossRef]
- Yang, C.; Hawkins, K.E.; Doré, S.; Candelario-Jalil, E. Neuroinflammatory mechanisms of blood-brain barrier damage in ischemic stroke. Am. J. Physiol. Cell Physiol. 2019, 316, C135–C153. [Google Scholar] [CrossRef]
- Senatorov, V.V.; Friedman, A.R.; Milikovsky, D.Z.; Ofer, J.; Saar-Ashkenazy, R.; Charbash, A.; Jahan, N.; Chin, G.; Mihaly, E.; Lin, J.M.; et al. Blood-brain barrier dysfunction in aging induces hyperactivation of TGFβ signaling and chronic yet reversible neural dysfunction. Sci. Transl. Med. 2019, 11, eaaw8283. [Google Scholar] [CrossRef]
- Morin-Brureau, M.; Lebrun, A.; Rousset, M.-C.; Fagni, L.; Bockaert, J.; De Bock, F.; Lerner-Natoli, M. Epileptiform Activity Induces Vascular Remodeling and Zonula Occludens 1 Downregulation in Organotypic Hippocampal Cultures: Role of VEGF Signaling Pathways. J. Neurosci. 2011, 31, 10677–10688. [Google Scholar] [CrossRef]
- Levine, S.M. Albumin and multiple sclerosis. BMC Neurol. 2016, 16, 1–12. [Google Scholar] [CrossRef] [PubMed]
- Han, X.; Huang, Q.; Liu, L.; Sha, X.; Hu, B.; Liu, H. Changes in the Expression of AQP4 and AQP9 in the Hippocampus Following Eclampsia-Like Seizure. Int. J. Mol. Sci. 2018, 19, 300. [Google Scholar] [CrossRef] [PubMed]
- Zhou, Y.; Li, Z.; Cao, X.; Ma, H.; White, P.F.; Xu, X.; Jiang, Y.; Sun, X.; Cui, Y. Exendin-4 improves behaviorial deficits via GLP-1/GLP-1R signaling following partial hepatectomy. Brain Res. 2019, 1706, 116–124. [Google Scholar] [CrossRef] [PubMed]
- Que, Q.; Guo, X.; Zhan, L.; Chen, S.; Zhang, Z.; Ni, X.; Ye, B.; Wan, S. The GLP-1 agonist, liraglutide, ameliorates inflammation through the activation of the PKA/CREB pathway in a rat model of knee osteoarthritis. J. Inflamm. 2019, 16, 1–9. [Google Scholar] [CrossRef]
- Tanaka, K.; Nogawa, S.; Ito, D.; Suzuki, S.; Dembo, T.; Kosakai, A.; Fukuuchi, Y. Activated phosphorylation of cyclic AMP response element binding protein is associated with preservation of striatal neurons after focal cerebral ischemia in the rat. Neurosciences 2000, 100, 345–354. [Google Scholar] [CrossRef]
- Park, Y.-S.; Jin, Z.; Jeong, E.A.; Yi, C.-O.; Lee, J.Y.; Park, I.S.; Roh, G.S. Cilostazol attenuates kainic acid-induced hippocampal cell death. Korean J. Physiol. Pharmacol. 2018, 22, 63–70. [Google Scholar] [CrossRef]
- Sun, J.; Shao, X.-M.; Fang, F.; Shen, Z.; Wu, Y.-Y.; Fang, J.-Q. Electroacupuncture alleviates retrieval of pain memory and its effect on phosphorylation of cAMP response element-binding protein in anterior cingulate cortex in rats. Behav. Brain Funct. 2015, 11, 9. [Google Scholar] [CrossRef]
- Walton, M.R.; Dragunow, I. Is CREB a key to neuronal survival? Trends Neurosci. 2000, 23, 48–53. [Google Scholar] [CrossRef]
- Tanis, K.Q.; Duman, R.S.; Newton, S.S. CREB Binding and Activity in Brain: Regional Specificity and Induction by Electroconvulsive Seizure. Biol. Psychiatry 2008, 63, 710–720. [Google Scholar] [CrossRef]
- Moore, A.N.; Waxham, M.N.; Dash, P.K. Neuronal Activity Increases the Phosphorylation of the Transcription Factor cAMP Response Element-binding Protein (CREB) in Rat Hippocampus and Cortex. J. Biol. Chem. 1996, 271, 14214–14220. [Google Scholar] [CrossRef]
- Shin, N.; Yi, M.-H.; Kim, S.; Baek, H.; Triantafillu, U.L.; Park, J.; Kim, D.W. Astrocytic Expression of CTMP Following an Excitotoxic Lesion in the Mouse Hippocampus. Exp. Neurobiol. 2017, 26, 25–32. [Google Scholar] [CrossRef]


Publisher’s Note: MDPI stays neutral with regard to jurisdictional claims in published maps and institutional affiliations. |
© 2021 by the authors. Licensee MDPI, Basel, Switzerland. This article is an open access article distributed under the terms and conditions of the Creative Commons Attribution (CC BY) license (https://creativecommons.org/licenses/by/4.0/).
Share and Cite
Ahn, Y.-J.; Shin, H.-J.; Jeong, E.-A.; An, H.-S.; Lee, J.-Y.; Jang, H.-M.; Kim, K.-E.; Lee, J.; Shin, M.-C.; Roh, G.-S. Exendin-4 Pretreatment Attenuates Kainic Acid-Induced Hippocampal Neuronal Death. Cells 2021, 10, 2527. https://doi.org/10.3390/cells10102527
Ahn Y-J, Shin H-J, Jeong E-A, An H-S, Lee J-Y, Jang H-M, Kim K-E, Lee J, Shin M-C, Roh G-S. Exendin-4 Pretreatment Attenuates Kainic Acid-Induced Hippocampal Neuronal Death. Cells. 2021; 10(10):2527. https://doi.org/10.3390/cells10102527
Chicago/Turabian StyleAhn, Yu-Jeong, Hyun-Joo Shin, Eun-Ae Jeong, Hyeong-Seok An, Jong-Youl Lee, Hye-Min Jang, Kyung-Eun Kim, Jaewoong Lee, Meong-Cheol Shin, and Gu-Seob Roh. 2021. "Exendin-4 Pretreatment Attenuates Kainic Acid-Induced Hippocampal Neuronal Death" Cells 10, no. 10: 2527. https://doi.org/10.3390/cells10102527
APA StyleAhn, Y.-J., Shin, H.-J., Jeong, E.-A., An, H.-S., Lee, J.-Y., Jang, H.-M., Kim, K.-E., Lee, J., Shin, M.-C., & Roh, G.-S. (2021). Exendin-4 Pretreatment Attenuates Kainic Acid-Induced Hippocampal Neuronal Death. Cells, 10(10), 2527. https://doi.org/10.3390/cells10102527