Article

Freeze-Thaw Induced Gully Erosion: A Long-Term High-Resolution Analysis

Department of Geosciences, East Tennessee State University, Johnson City, TN 37614, USA
*
Author to whom correspondence should be addressed.
Agronomy 2019, 9(9), 549; https://doi.org/10.3390/agronomy9090549
Submission received: 31 July 2019 / Revised: 3 September 2019 / Accepted: 9 September 2019 / Published: 13 September 2019
(This article belongs to the Special Issue Surface Runoff and Soil Erosion under Various Climate Conditions)

Abstract

:
Gullies are significant contributors of sediment to streams in the southeastern USA. This study investigated gully erosion in the clay-rich soils of east Tennessee under a humid subtropical climate. The aims of this study were to (1) estimate long-term erosion rates for different gully geomorphic settings, (2) compare patterns of erosion for the different settings, and (3) model the response of gully erosion to freeze-thaw events. Erosion was measured weekly from June 2012 to August 2018 using 105 erosion pins distributed in gully channels, interfluves, and sidewalls. Erosion rates were estimated from average slopes of lines of best fit of pin lengths versus time. Maximum and minimum temperature was calculated daily using an on-site weather station and freeze-thaw events were identified. Gully erosion was modeled using antecedent freeze-thaw activity for the three geomorphic settings. Long-term erosion rates in channels, interfluves, and sidewalls were 2.5 mm/year, 20 mm/year, and 21 mm/year, respectively; however, week-by-week erosion was statistically different between the three settings, indicating different erosive drivers. Models of erosion with lagged freeze-thaw variables explained up to 34.8% of the variability in erosion variables; sidewall erosion was most highly related to freeze-thaw activity. Freeze-thaw in prior weeks was an important variable in all erosion models.

Graphical Abstract

1. Introduction

Soil detachment and removal by gully erosion is a serious form of land degradation, threatening the global environment, including arable land and water resources. Gully erosion takes place when surface runoff converges in narrow flowpaths and erodes the soil, resulting in scoured channels, which are difficult to restore using normal soil management practices [1]. Arable land degraded by gully erosion is associated with loss of soil mass, loss of nutrients, reduction of the soil’s water holding capacity, and decline of water available for plant growth or livestock [2]. Additionally, the eroded soil is often deposited in water bodies, which increases turbidity, disturbing aquatic ecosystems and polluting drinking water supplies [3,4].
To prevent these negative impacts and to remediate affected areas, several researchers have focused on assessments of the causative factors of gully erosion, such as rainfall, snowmelt, wind, freeze–thaw cycles, gravity, and land use management [5,6]. Improper land use management is commonly the main driver of development and proliferation of gully erosion [7,8] followed by excess rainfall induced runoff on land surfaces [1]. Evaluation of the impact of rainfall induced runoff on gully erosion is abundant in the literature [9,10,11,12,13]. In higher latitude and altitude areas, snowmelt runoff and freeze-thaw cycles contribute to gully erosion [14,15,16]. Therefore, winter weather, snow accumulation, snowmelt, and soil freeze–thaw cycles have been used to model soil erosion [16,17], revealing that land degradation from snow melt erosion can often exceed rainfall induced erosion [18]. Xu and team [8] summarized that soil erosion produced by snowmelt runoff explains 76% of total sediment production in the Schafertal Basin, eastern Germany [19]; 80% in the Peace River Basin, British Columbia, Canada [20]; 90% along the Pacific coast, northwestern United States [17]; and 96% in Fosheim Peninsula, Canada [21]. The same team also observed as much as 14.27 t of soil loss from annual snowmelt induced erosion in Northeast China.
In addition to the use of accurate snowmelt runoff prediction to estimate soil erosion, the study of soil freeze-thaw cycles is an important predictor of erosion, as the process affects soil’s cohesive strength and erodibility [22,23]. Especially in climatic regions where ground freezing and heaving are predominant, freeze-thaw induced erosion is more prevalent than snowmelt runoff induced erosion [24]. Freeze-thaw events due to snowmelt infiltration are complicated physical phenomena dependent on soil temperature, water content, the depth and slope of soil, overlying snowpack, albedo effect, wind speed, etc. [24,25]. Laboratory simulations to predict freeze-thaw induced erosion have mentioned physical conditions; however, laboratory studies are mostly associated with boundary conditions different from the actual field environment [25,26,27]. A few field studies have investigated the interaction of snow cover, air temperature, and soil freeze-thaw; and concluded, in addition to the mentioned governing factors, that regional climate influences the rate of erosion [28,29]. Due to logistical difficulties of performing long-term field work in cold environments, some studies have short-range data collection periods [25].
Gully erosion in the southeastern United States, in the Appalachian Valley and Ridge and Piedmont physiographic provinces, is an under-researched area. Primary causes of erosion are the wet and humid climate of the region, steep hillslopes, erodible clay-rich soil, and a transition in land cover from woodland to farmland [30,31]. A few studies in the Appalachian Valley and Ridge province investigated the characteristics of erodible clay-rich soil [32], the role of rainfall pattern, duration and intensity [10], and the aeolian processes [33] in a gully system. The studies concluded that different morphological settings within a gully respond differently to rainfall-driven and wind-driven erosion. Recent research in middle Tennessee’s Highland Rim physiographic province, on a site with similar, clay-rich soils, concluded that erosion rates differed for interfluves (26 mm/year) and channels (14 mm/year), and that frost action, rain splash, and dry ravel were driving processes for erosion, varying seasonally [34].
Seasonally freezing and thawing of soil has occurred widely in the humid subtropical climate of the southeastern US, where short and mild winters cause a thin surface layer (5–10 cm) of frost heaved soil. Soil becomes cohesionless and dislodges from the hillslope after a few freeze-thaw cycles, and can erode under the influence of gravity or from snowmelt or rainfall related runoff [35]. However, impact of soil freeze-thaw processes are greatly under-represented in the literature for the southeastern US Appalachian Valley and Ridge physiographic provinces. One prior study conducted by the present researchers evaluated freeze-thaw erosion on an Appalachian hillslope using a 27 month short-duration dataset. The research concluded that the combined effect of existing and prior freeze-thaw cycles, and mass wasting due to the presence of cohesionless soil from frost heaving and needle ice formation contributed to soil erosion [35]. The same study indicated the importance of further study using multiple prior freeze-thaw cycles with a longer monitoring period to identify lagged effects of antecedent freeze-thaw processes and seasonal trends.
Therefore, the present study evaluates freeze-thaw induced gully erosion in a hillslope gully system at weekly time scales monitored for a period of 75 months; i.e., over six years. Investigating the relationship between freeze-thaw and soil erosion using a long-term dataset in a well-developed gully system will be helpful in (i) calculating erosion rates over the long term for clay-rich soils in three different geomorphic areas (gully channels, interfluves, and sidewalls); (ii) identifying how different geomorphic units within gully systems behave with freeze-thaw, and (iii) modeling erosion using antecedent freeze-thaw activity.

2. Materials and Methods

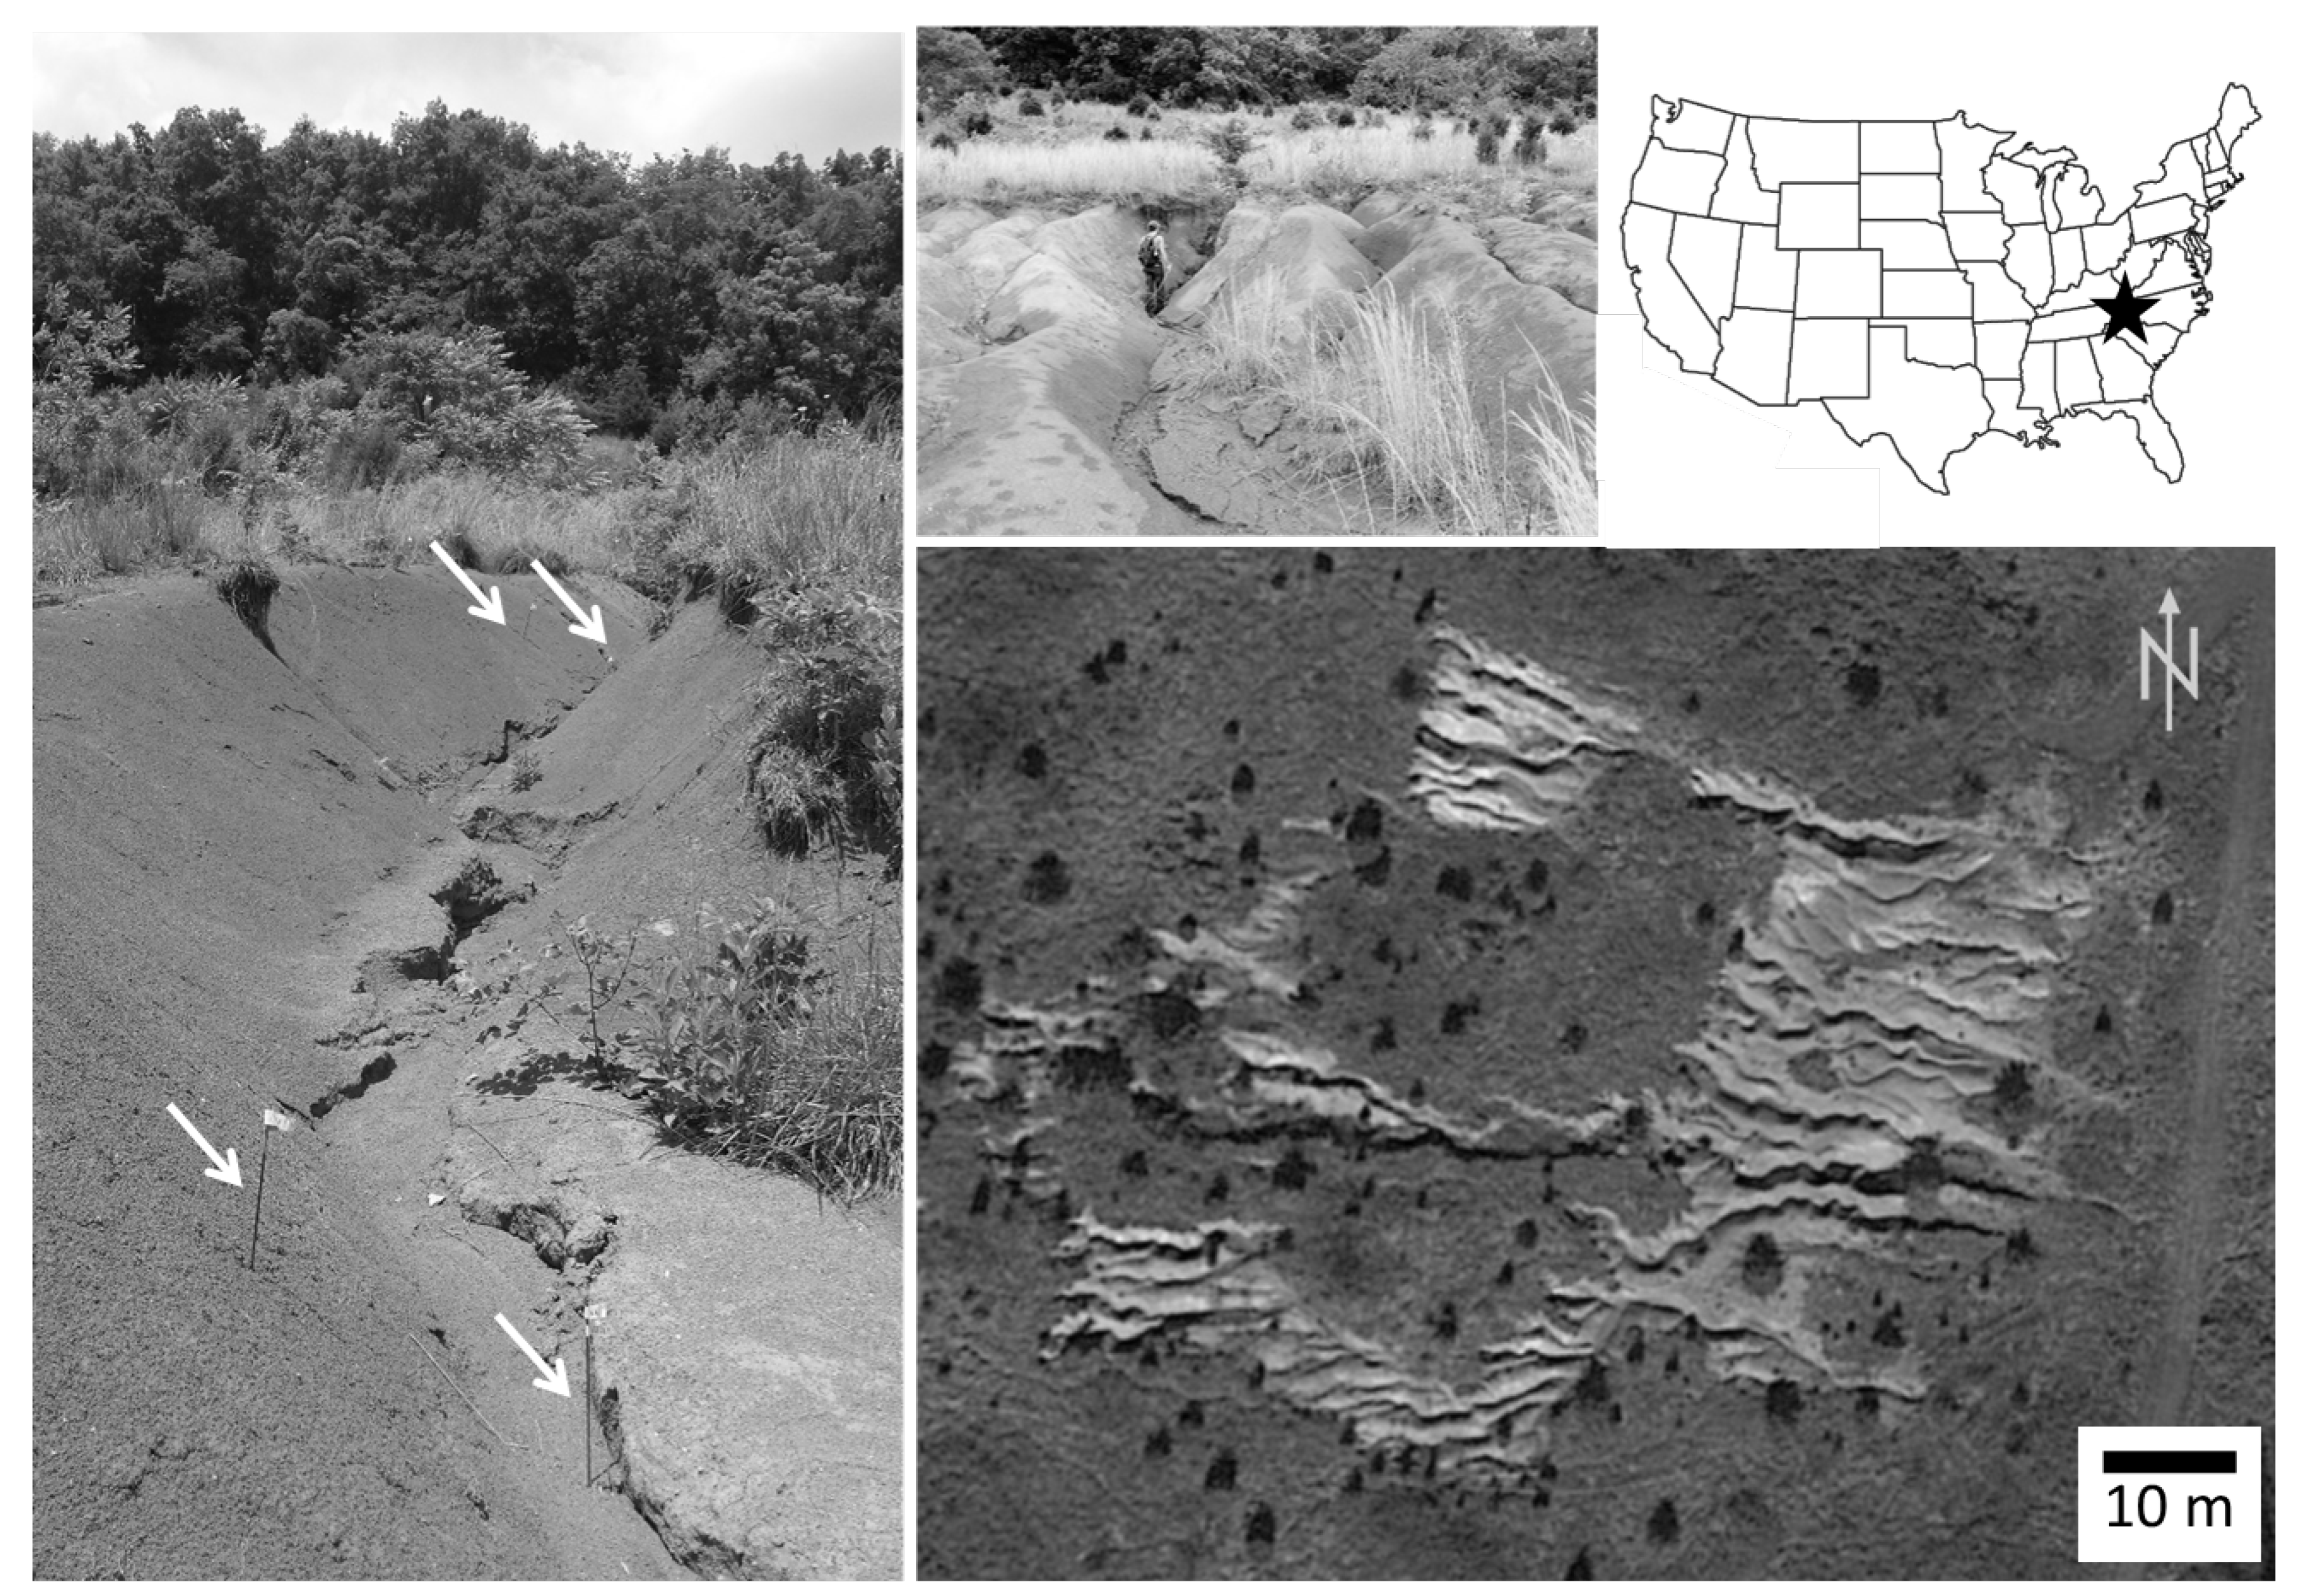
2.1. Site Description

The study area is an eroding hillslope at the East Tennessee State University Valleybrook research facility (+36°25′36.77″, −82°32′10.63″), Washington County, TN, USA in the Appalachian Valley and Ridge physiographic province. The gullied area consists of multiple branching networks of tributary gullies that feed into increasingly larger gullies with a dendritic drainage pattern (Figure 1). The catchment has an area of 1.52 ha, with actively eroding gullies accounting for over 25% of the study area (0.39 ha). The gully system is part of the catchment that drains into Kendrick Creek, which receives on average 107 cm (42 in) of rain a year. Temperature ranges from an average of 1.1 °C (34 °F) in January to 23.3 °C (74 °F) in July in this humid subtropical (Köppen Cfa) climate. Land cover is forest and pasture land, with the surrounding tracts of land devoted to agricultural and residential uses, with the exception of a landfill, which borders the property to the south. The geology consists of valleys and ridges that trend northeast to southwest. Ridges are underlain by resistant shale (Nolichucky Formation), while valleys are underlain by limestone, dolostone, and chert (Maynardville Formation) [36]. Soils from the Nolichucky Formation produce fine grained silty and clayey Ultisols of the Collegedale–Etowah complex (CeD3) that are highly erodible. The average erodibility factor of the CeD3 soil is 0.28 (on a scale from 0.02 to 0.69), which represents the susceptibility of the soil to detachment by raindrop impact and transport by runoff [37].

2.2. Erosion Parameters

Erosion was measured with a series of n = 105 steel erosion pins installed in a series of transects along gully cross sections. Pins were classified in three morphological settings: channels (n = 34 pins), interfluves (n = 29 pins), and sidewalls (n = 42 pins). Erosion pins in channels were 1 m × 5 mm and those in sidewalls and interfluves were 0.5 m × 5 mm. Pin length was recorded approximately weekly from 23/5/2012 to 22/8/2018 (n = 294 measurement periods) using a folding ruler. The length of measurement period varied due to site and weather conditions; after heavy rain the site became very muddy and we elected to refrain from accessing the site for 1–2 days to reduce interference with natural erosion processes.
Pin lengths from week to week (measurement period to measurement period) were calculated, and a dataset of pin differences was generated for each pin for each period. An increase in length from one week to the next indicated erosion, while a decrease in length indicated deposition. Erosion rates were estimated by modeling the average trend in pin length over time for each morphological area (channel, sidewall, and interfluve) using ordinary least squares regression. Erosion rates were compared by morphology using Kruskall–Wallis non-parametric tests and pairwise comparisons. All statistical analyses were completed in SPSS 25 [38].
Four erosion parameters were generated for pins in each morphological area: (1) average change in pin length from one measurement period to the next (AvgCh); (2) average of absolute value of change (Avg|Ch|); (3) average of only positive changes in pin lengths (deposition) from one measurement period to the next (Dep); and (4) the average of only negative changes in pin lengths (erosion) from one measurement period to the next (Erosion). In this way, 12 parameters were generated for each measurement period, four for each of channels, interfluves, and sidewalls, generating a time series dataset of week-by-week changes in the gully system for each of the different morphologies. Differences between the gully morphological settings for each of the four erosion parameters were examined statistically using the non-parametric Kruskal–Wallis test and Mann–Whitney U test for post-hoc analysis.

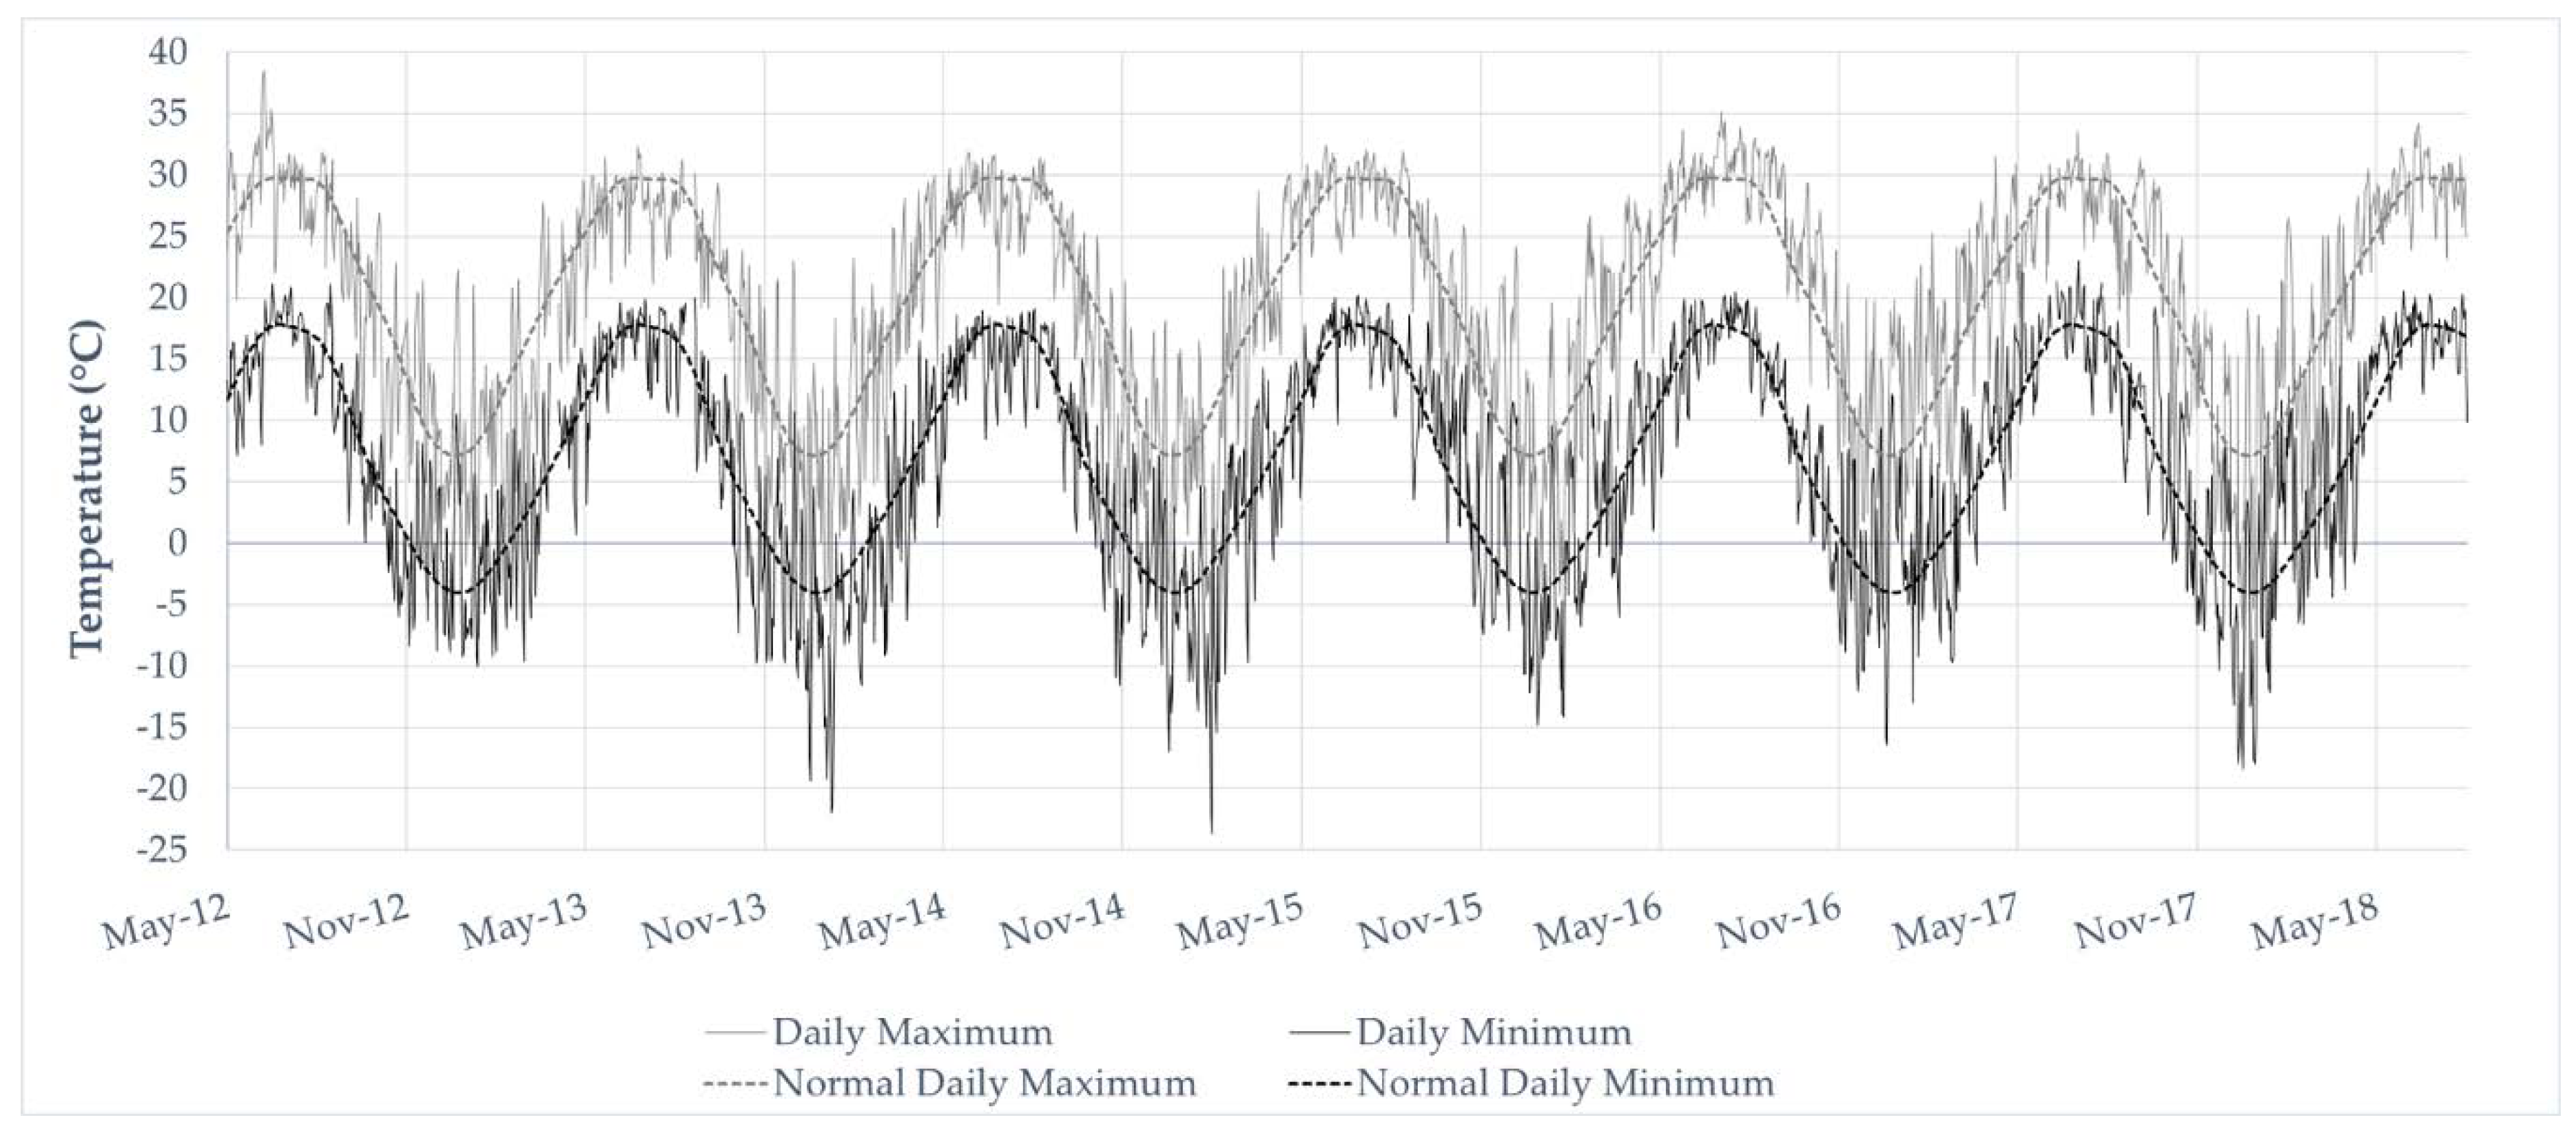
2.3. Freeze-Thaw Variables

Weather data were collected on site at five-minute intervals from 23/5/2012 to 22/8/2018 using a Davis Vantage Pro wireless weather station (KTNJONES12, data available at https://www.wunderground.com/dashboard/pws/KTNJONES12). During the study period, occasional weather data gaps occurred when the weather station was not functioning (100 of 2282 days) (Table 1). Most gaps (n = 79 days) were filled with data from a Davis Vantage Pro weather station located approximately 1.6 km away (KTNJONES7, data available at https://www.wunderground.com/dashboard/pws/KTNJONES7). Occasionally, both stations were down simultaneously due to severe weather or power outages and gaps remain in the data record for n = 21 days (<1% of the study period). These measurement periods were excluded from the analyses.
Daily maximum and minimum temperatures were extracted from the 5-minute weather dataset and compared to 30 year daily climate data obtained from National Oceanic and Atmospheric Administration (NOAA) for the Bristol Airport TN US Station GHCND:USW00013877, available at https://www.ncdc.noaa.gov/cdo-web/. Daily maximum and minimum observed temperatures and normal daily maximum and minimum temperature data are displayed in Figure 2.
For each study day, a freeze-thaw event was recorded if daily observed maximum temperature exceeded 0 °C and minimum was equal to or less than 0 °C. For each erosion pin measurement period, the proportion of freeze-thaw days (PropFTh) was calculated using PropFTh = number of freeze-thaw days in period/number of days in period, so that a value of 1 indicated all days had freeze-thaw activity and a value of 0 indicated no freeze-thaw activity. In addition, eleven weather variables were added to the database representing antecedent freeze-thaw activity: the proportion of freeze-thaw days in each of the prior eleven measurement periods (PropFTh-1, PropFTh-2, PropFTh-3, and so on). We elected to stop at a lag of eleven periods, because this represents a lag of approximately 3 months, and going beyond this would begin to bracket the start and end of the winter season for the study area.

2.4. Erosion and Freeze-Thaw Models

To assess the relationship between freeze-thaw activity and erosion in channels, sidewalls, and interfluves, the correlation between erosion parameters and freeze-thaw variables was calculated. Cross correlation between lagged freeze-thaw and erosion was also calculated and ordinary least squares regression models were generated for all erosion parameters that were significantly correlated to freeze-thaw lagged variables.

3. Results

Descriptive statistics for erosion parameters and the freeze-thaw variable are presented first, followed by long-term erosion rate calculations for each morphological area. Next, week-to-week changes in pin length are compared for each morphological area and modeled using lagged freeze-thaw variables.

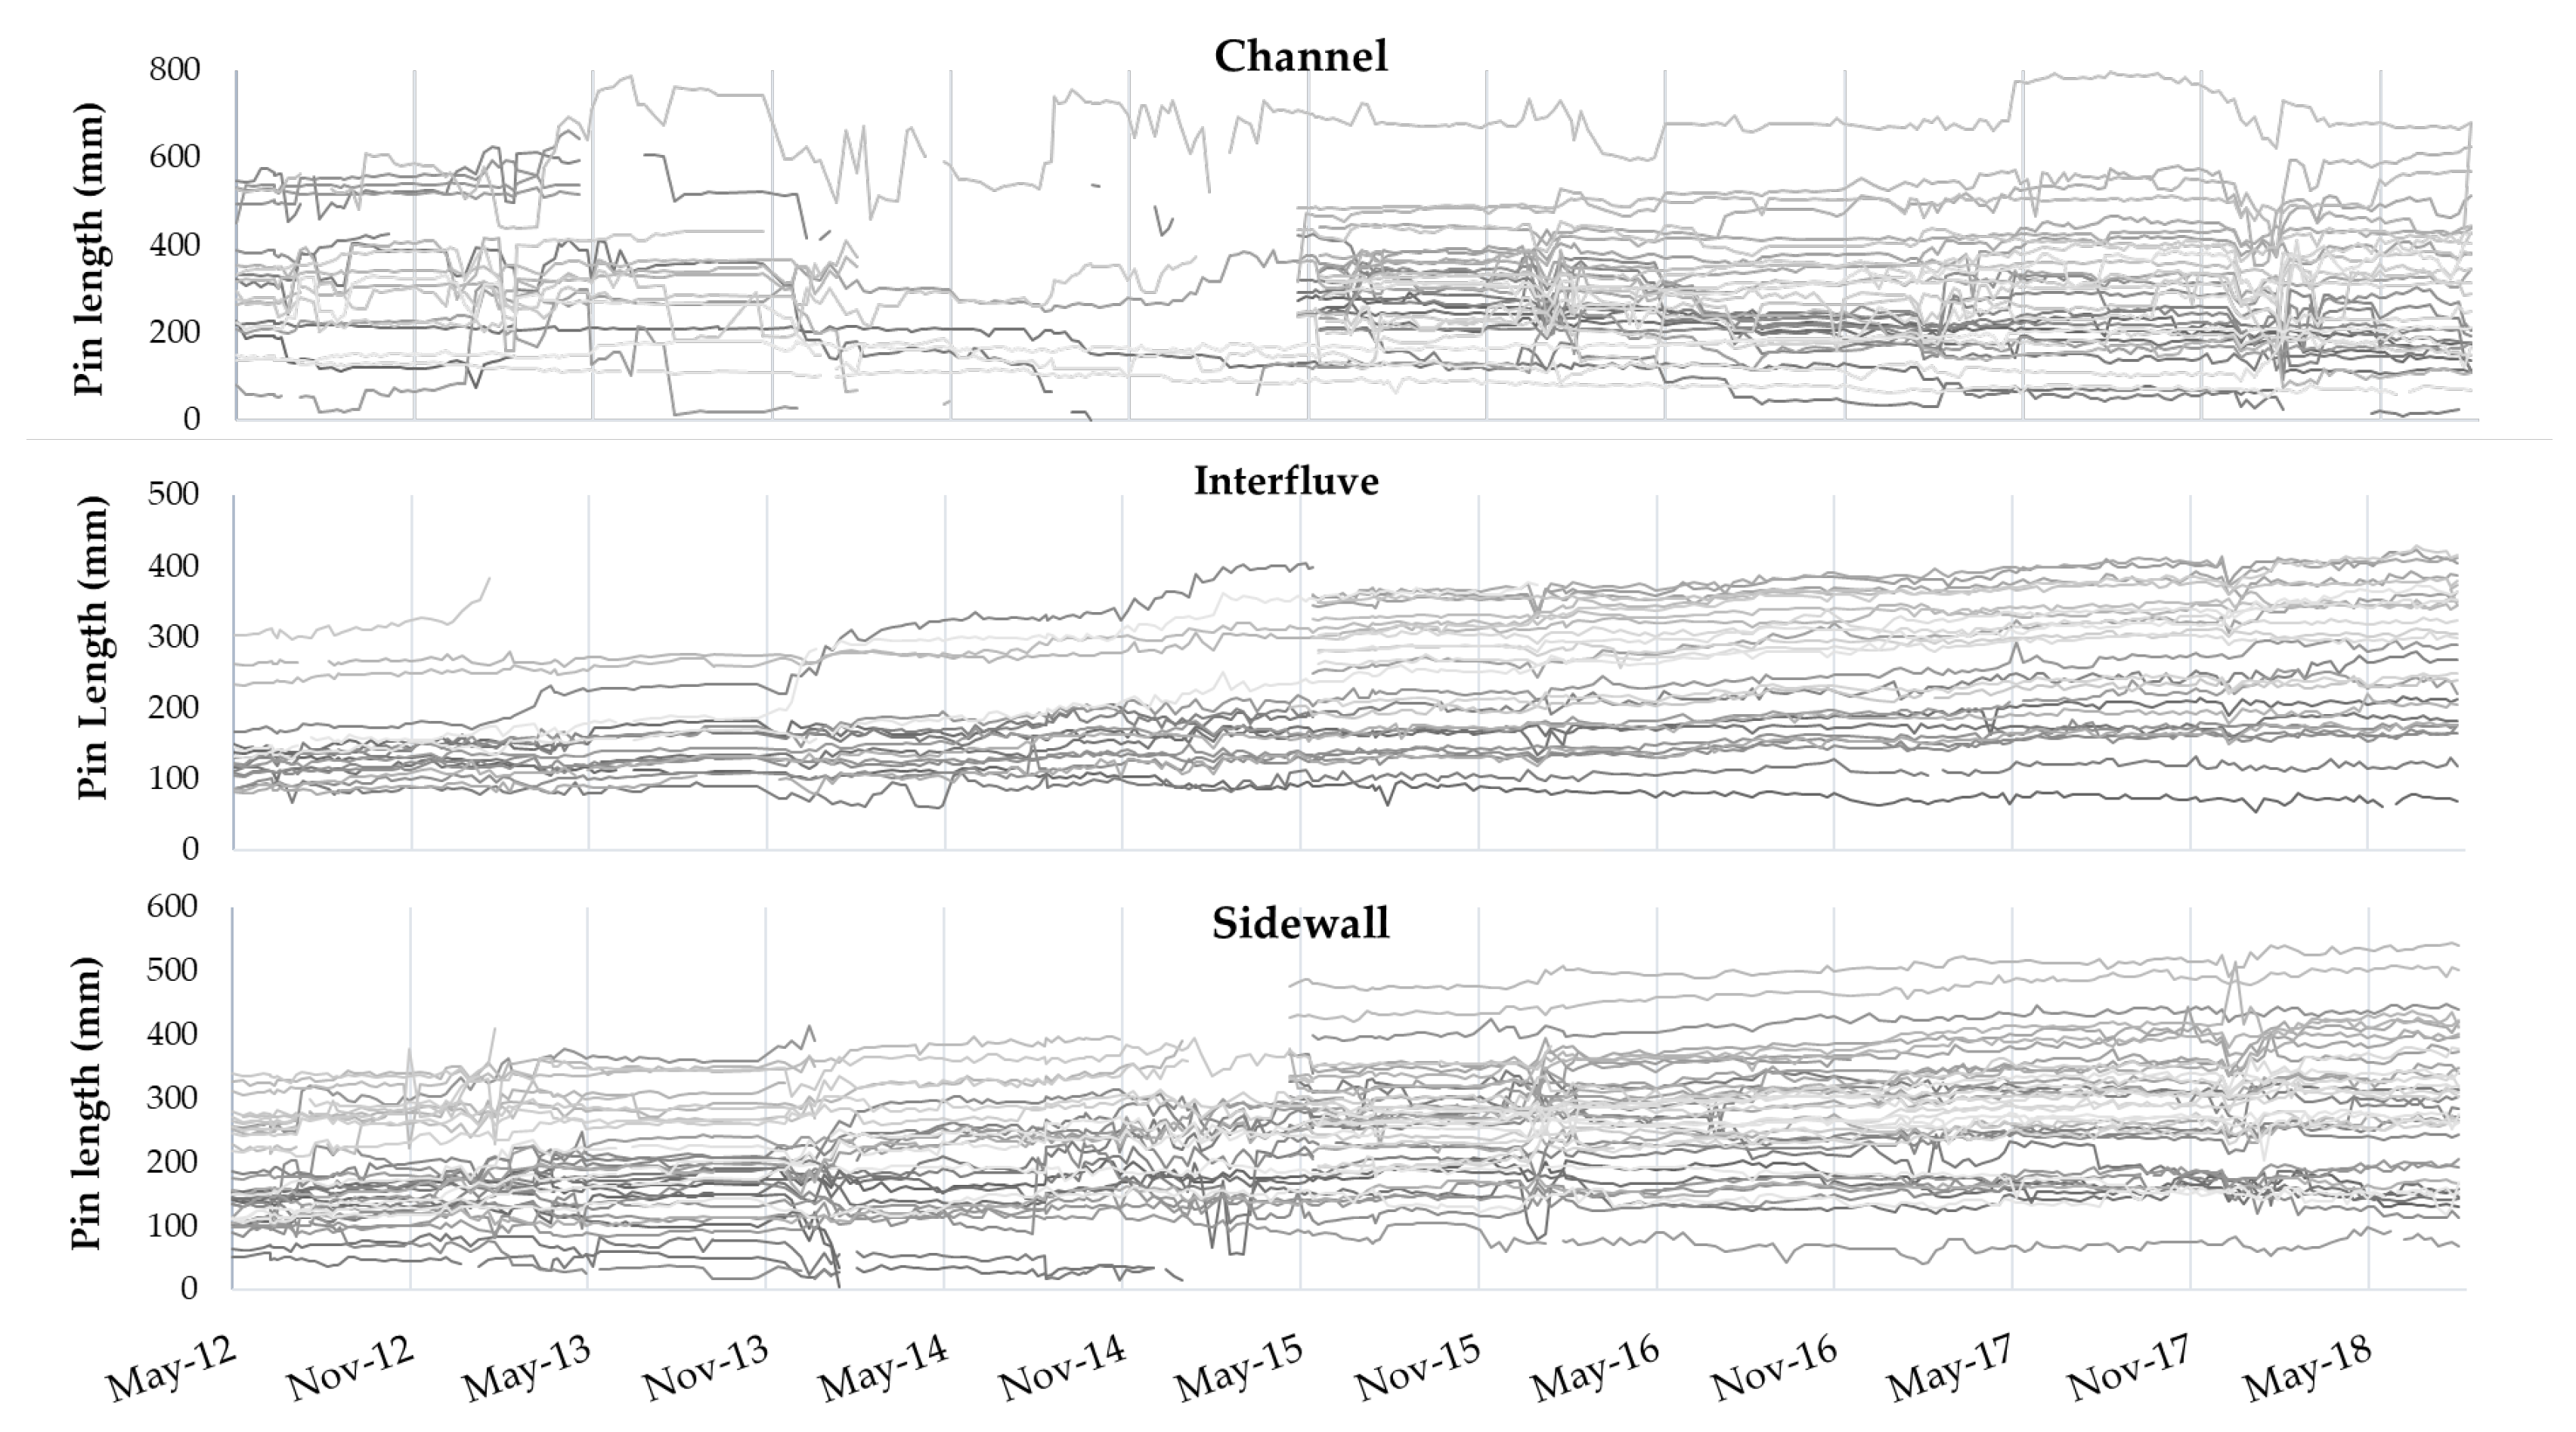
3.1. Descriptive Statistics
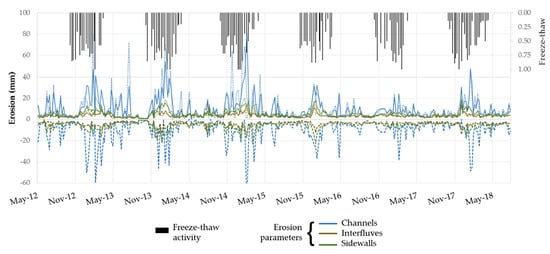
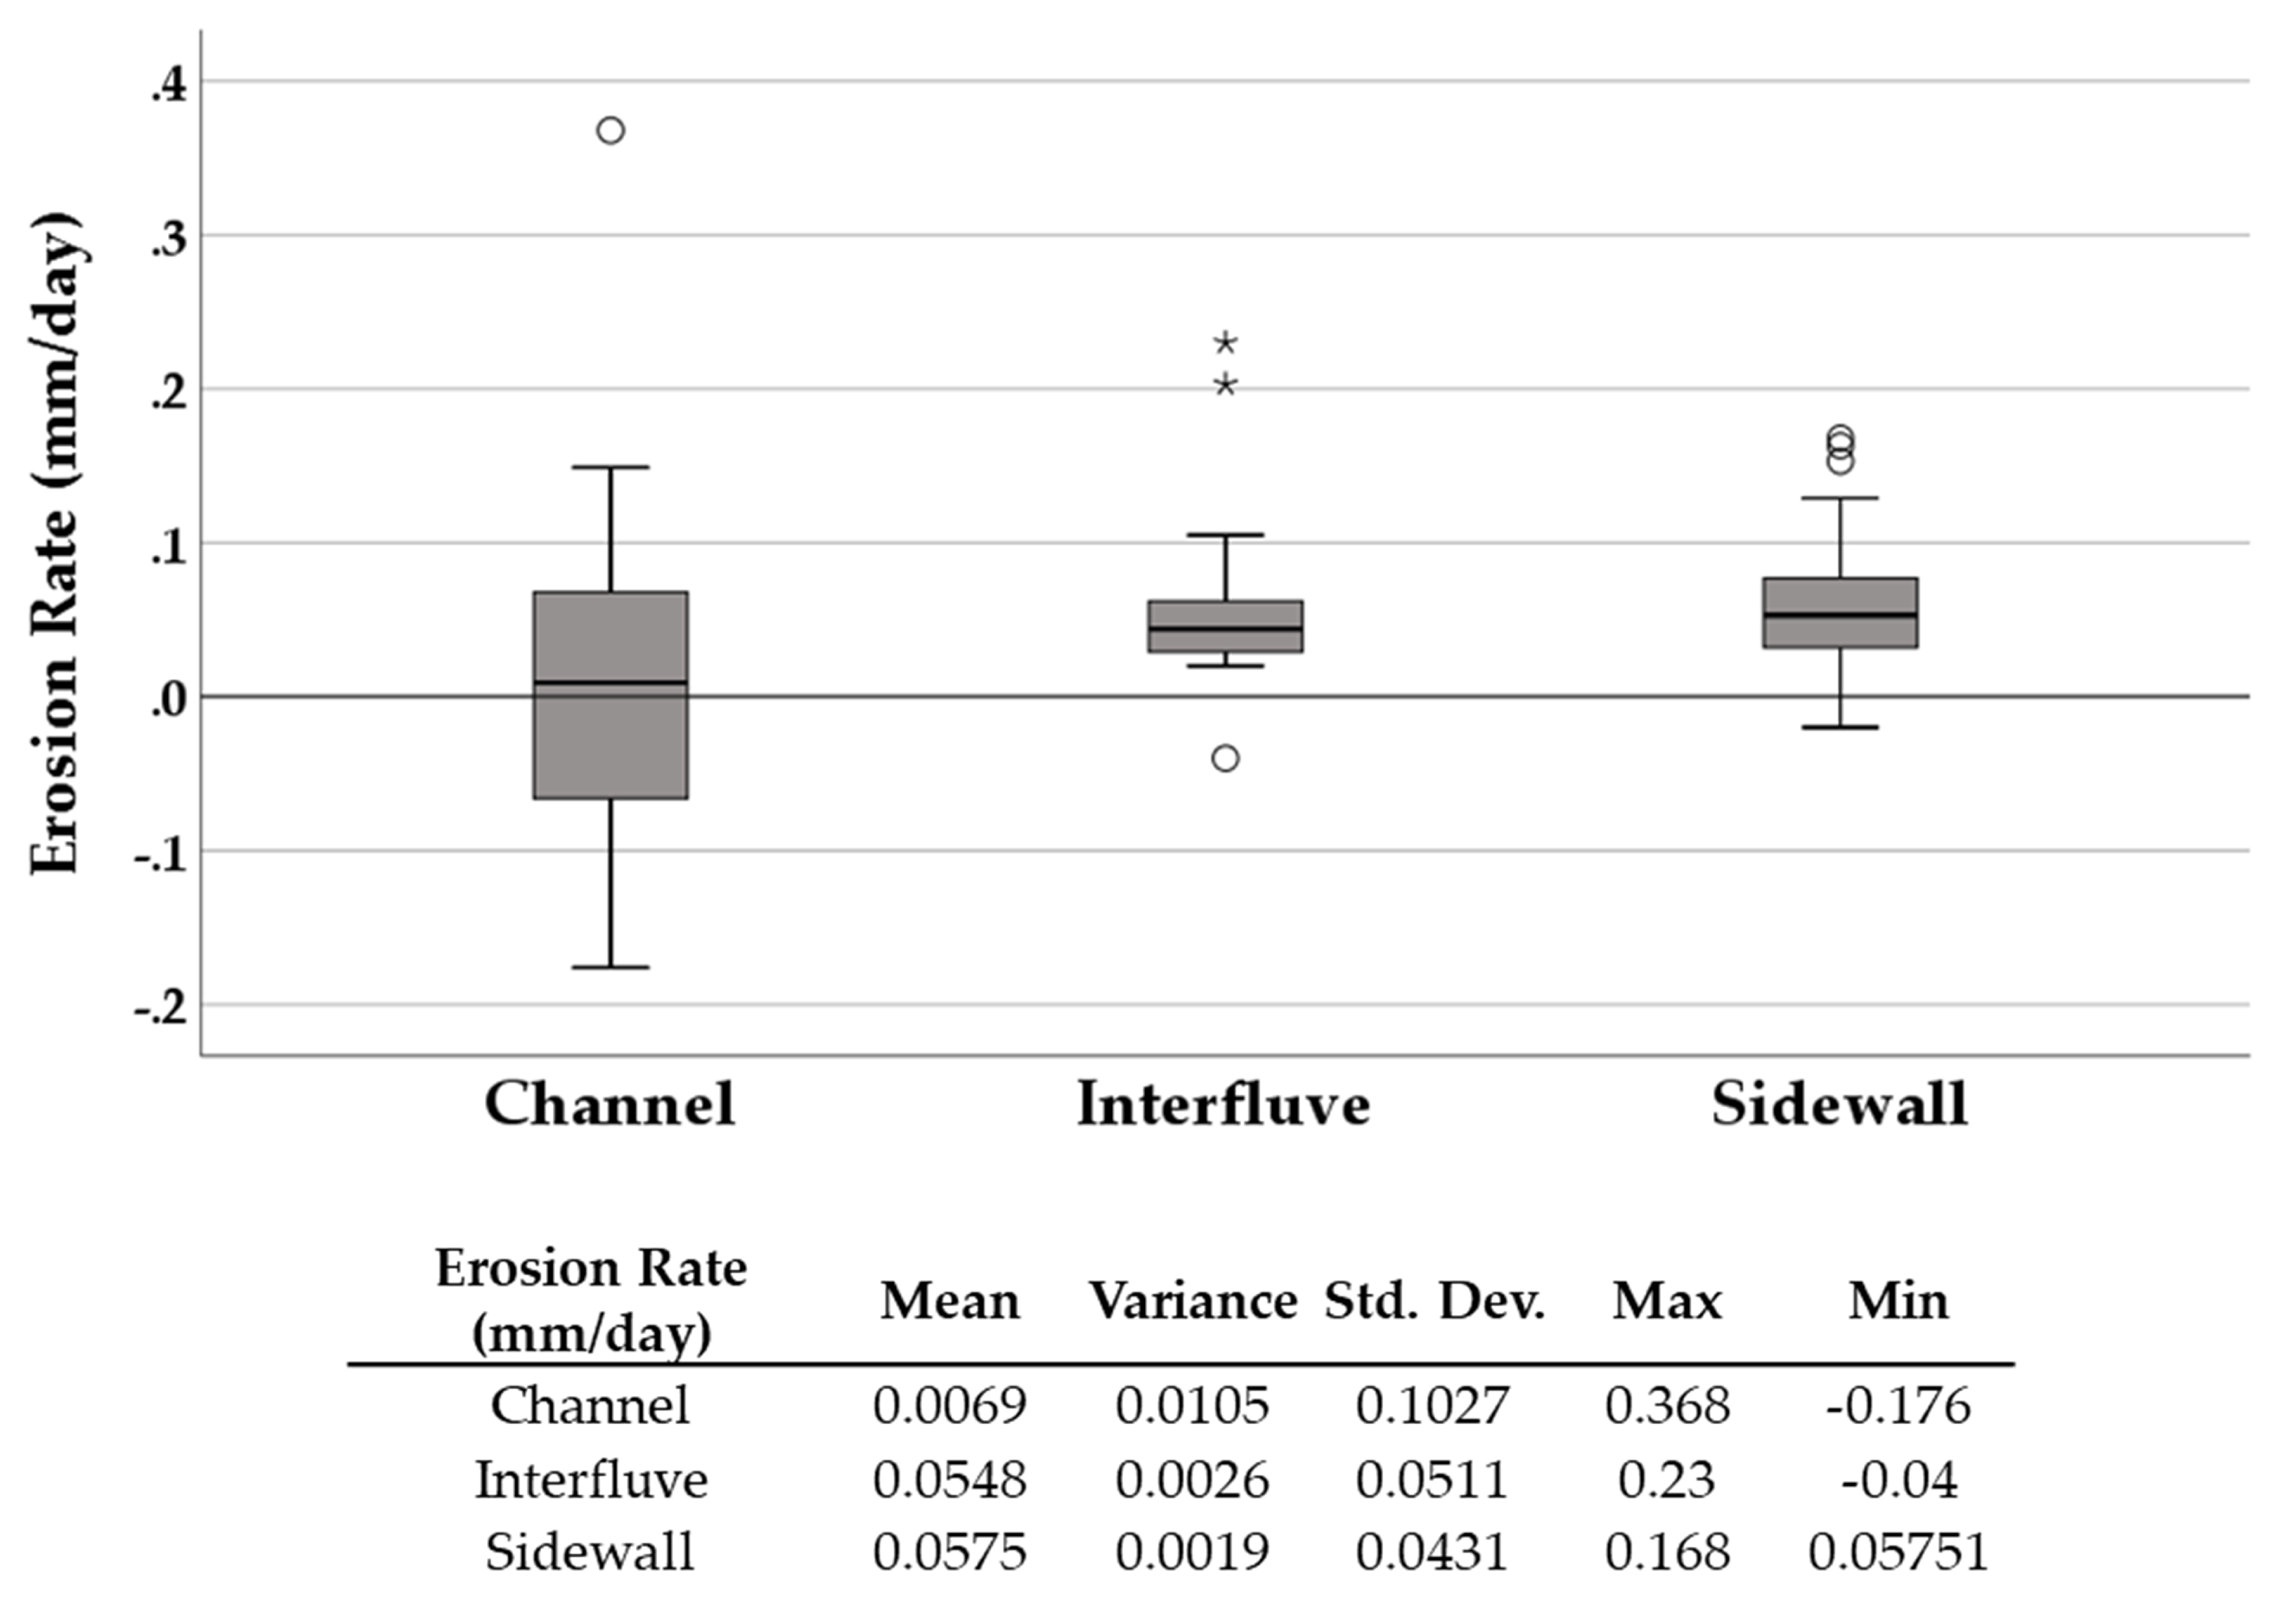
Descriptive statistics for all parameters are shown in Table 2. A total of 294 measurement periods occurred during the study period. For channels, the deposition and erosion parameters have fewer than 294 periods because for some measurement periods, only erosion (four periods) or only deposition (two periods) occurred for all channel pins. Negative values for erosion parameters indicate erosion only. Some measurement periods experienced freeze-thaw activity on all days (PropFTh = 1), while others experienced no freeze-thaw activity (PropFTh = 0). Averaging over all measurement periods, freeze-thaw activity was observed 23% of the time. Average change (averaged over the lumped set of all pins and all periods) for the three morphological areas (CAvgCh, IAvgCh, and SAvgCh) is close to zero, showing that erosion and deposition tend to cancel each other out over time and space. Indeed, previous research has shown that a better metric is the absolute value of average pin change (Avg|Ch|), as this captures variability and gives a sense of how dynamic the site is in terms of erosional activity [10,39,40]. For Avg|Ch|, channels (mean = 9.90 mm) are more dynamic than either interfluves (mean = 3.53 mm) or sidewalls (mean = 4.99 mm). Following the same pattern, channels show both more deposition and more erosion (10.52 mm and −9.37 mm, respectively) than interfluves (3.72 mm and −4.08 mm, respectively) and sidewalls (5.21 mm and −5.56 mm, respectively).

3.2. Erosion Rates

Plots of individual pin lengths versus time reveals a trend of increasing pin length (indicating erosion) for all three morphologies (Figure 3). Periodic disturbances may be observed for all three morphological areas, during which increased erosion (and often deposition, especially in channels) occurred. Sediment movement in channels was more dynamic than interfluves and sidewalls, both of which had less variability in erosion rate. Pin attrition can be observed in the graphs, where some pins eroded out, became damaged, or were dislodged by animal activity. In May 2015, 43 new pins were installed and 3 damaged pins were replaced.
Average erosion rates in each morphological area, calculated from slopes of linear regression models of pin length (dependent variable) with time (independent variable), reveal long-term erosion trends in the gully system. Channels erode more slowly than the other two morphological areas by an order of magnitude (0.0069 mm/day (2.5 mm/year) for channels, versus 0.055 mm/day (20 mm/year) and 0.058 mm/day (21 mm/year) for interfluves and sidewalls, respectively; Figure 4). Moreover, the variance in erosion rates for channels is an order of magnitude larger than the same statistic for both interfluves and channels. Kruskall–Wallis tests and pairwise comparisons reveal significant differences in erosion rates between pins in channels versus interfluves (p = 0.05), and channels versus sidewalls (p = 0.01). Over the long-term, there is no statistically significant difference in erosion rates between interfluves and sidewalls.

3.3. Comparison of Channels, Interfluves, and Sidewalls

Examination of erosion rates using pin differences from week to week is useful to identify the pattern of erosion over the short term (high temporal resolution), which can help to identify relevant drivers. Differences between channels, interfluves, and sidewalls for the four erosion parameters: AvgCh, Avg|Ch|, Dep, and Erosion assessed using Kruskal–Wallis non-parametric tests indicated significant differences in gully erosion between all three gully morphological settings (p = 0.011). Furthermore, paired post-hoc analyses using Mann–Whitney U-tests show that gully channels, sidewalls, and interfluves behave statistically differently for all erosion parameters, with the exception of the SAvgCh-IAvgCh pair (p = 0.634).

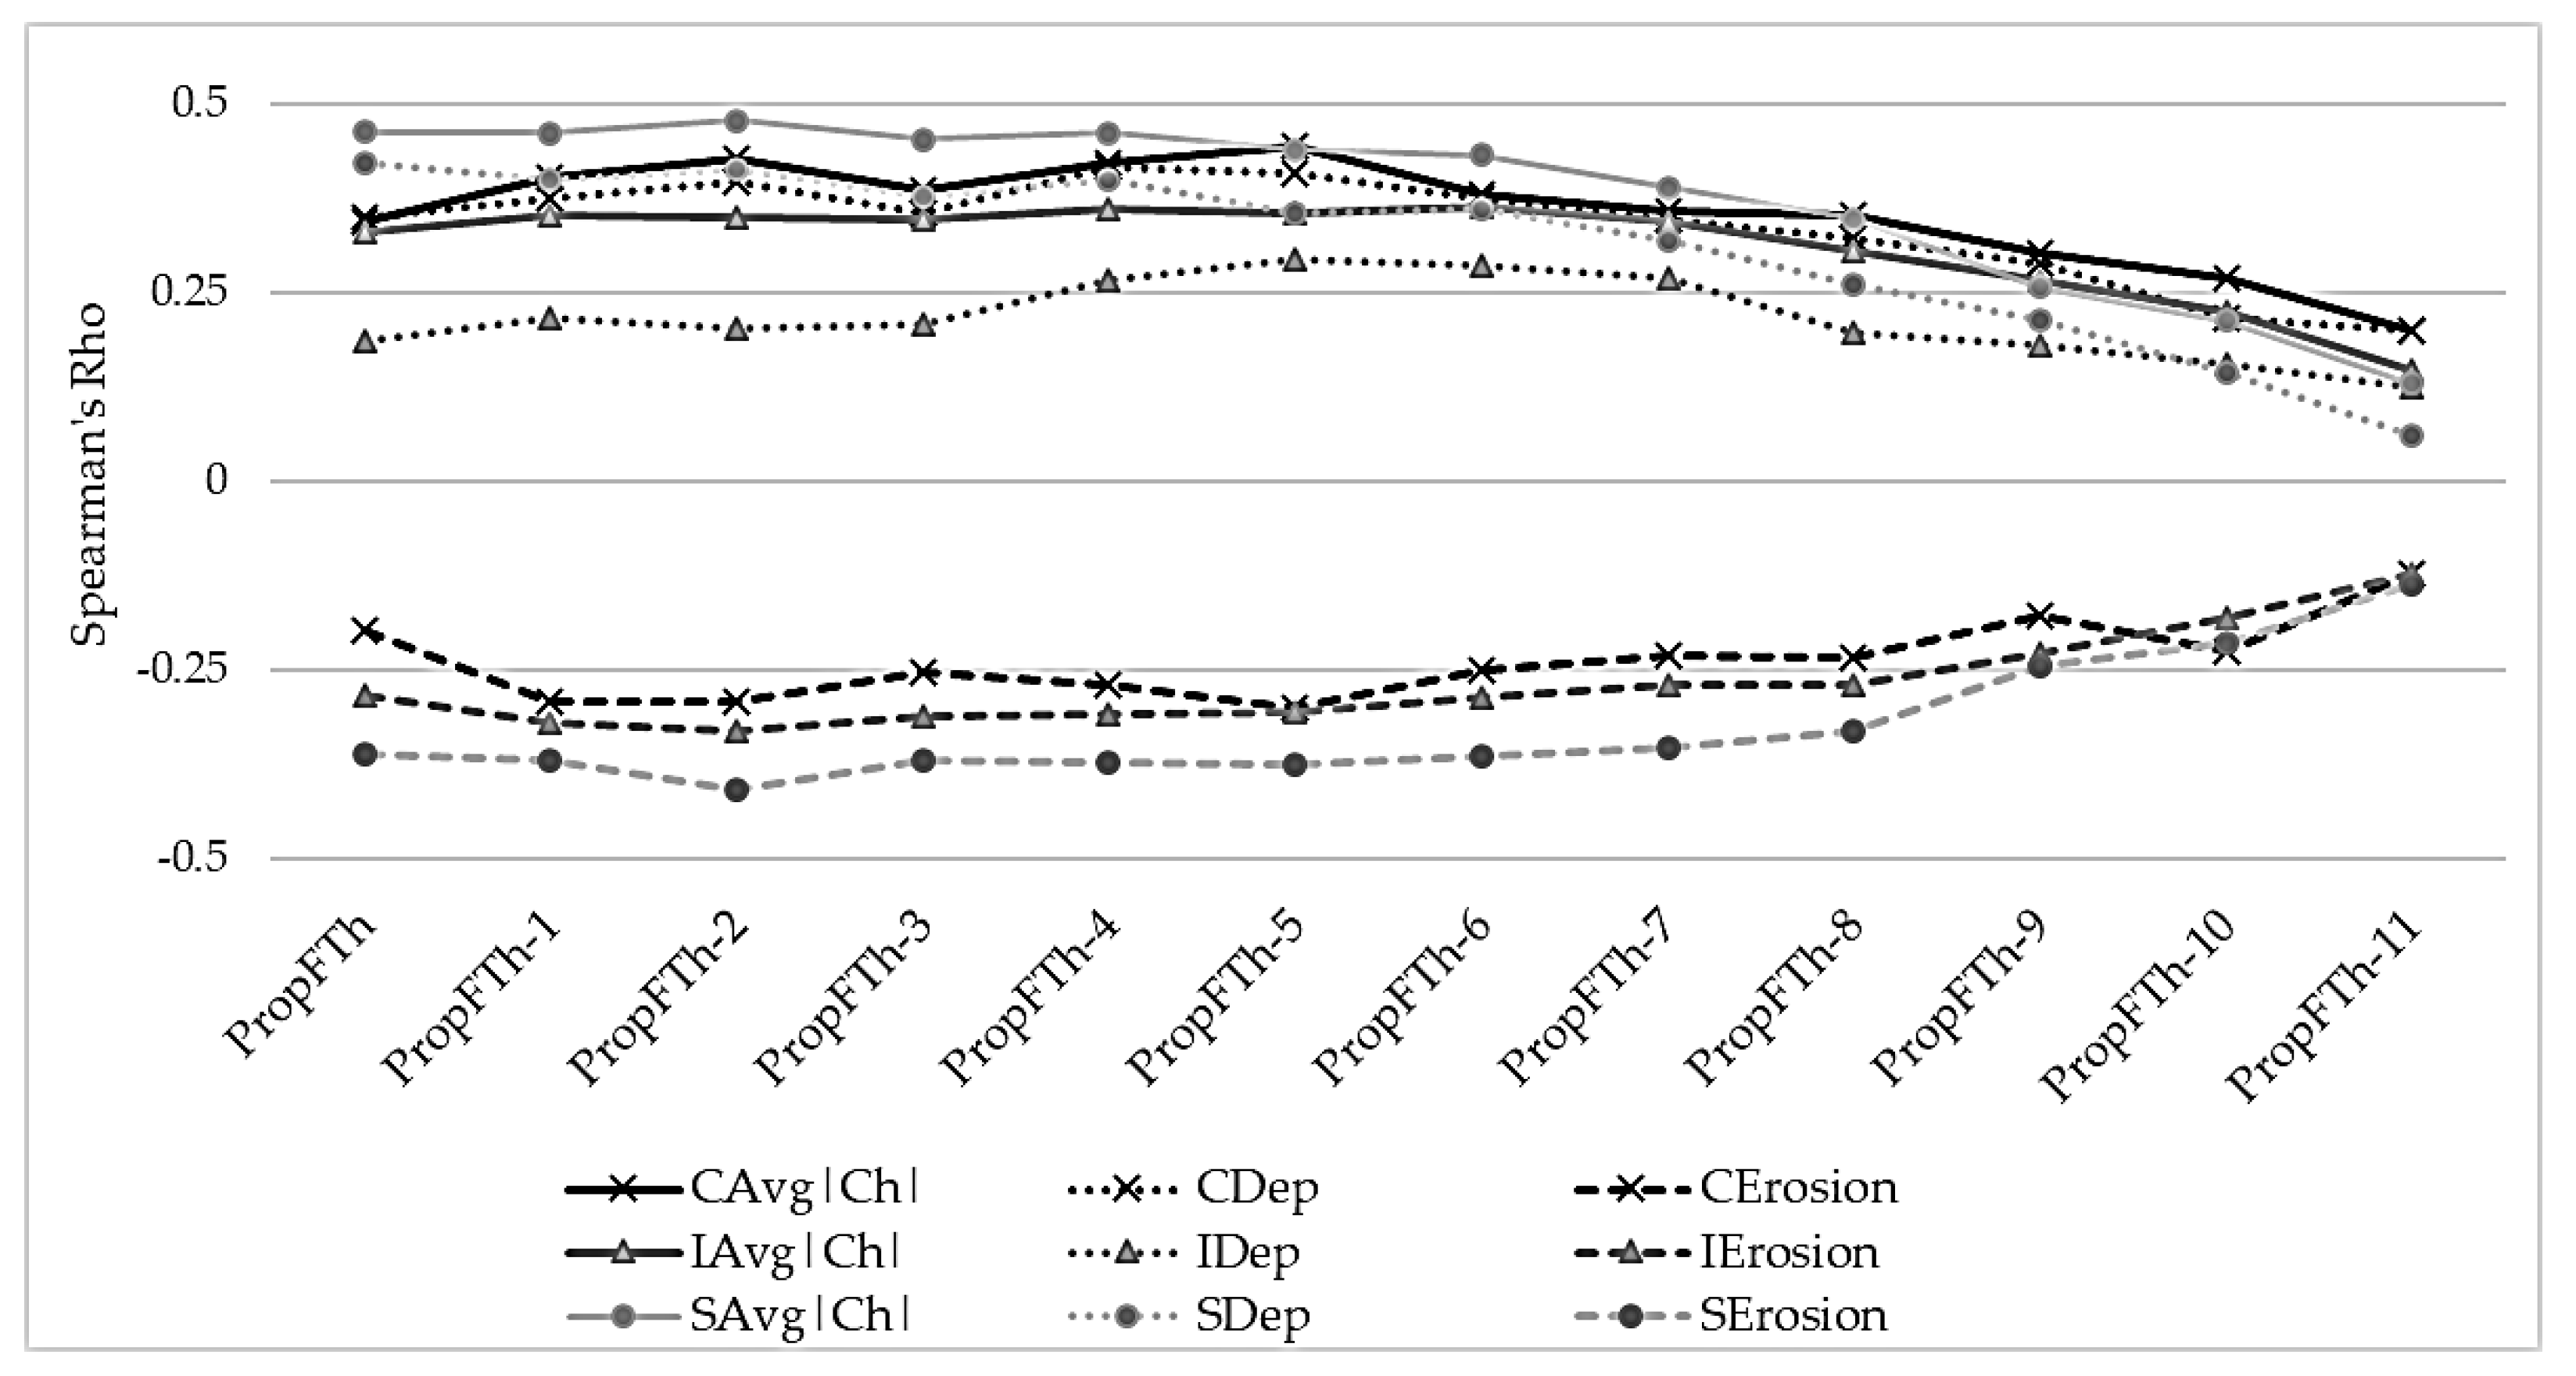
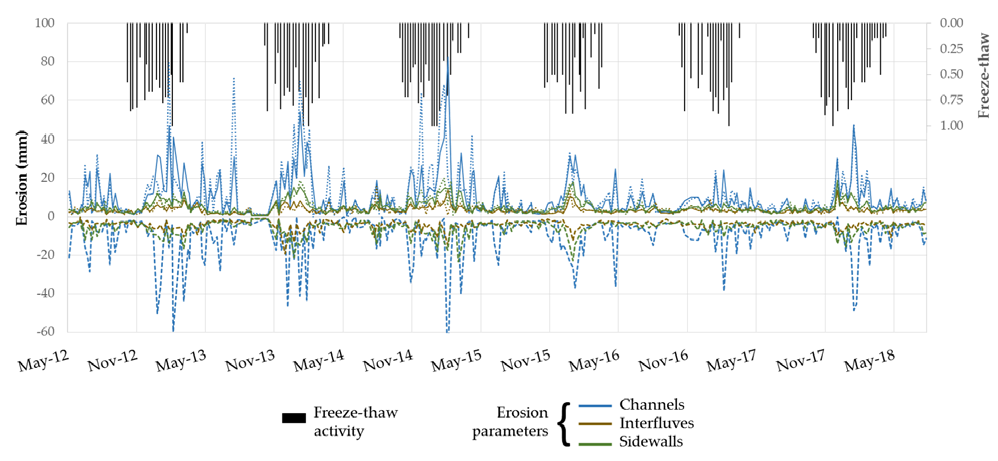
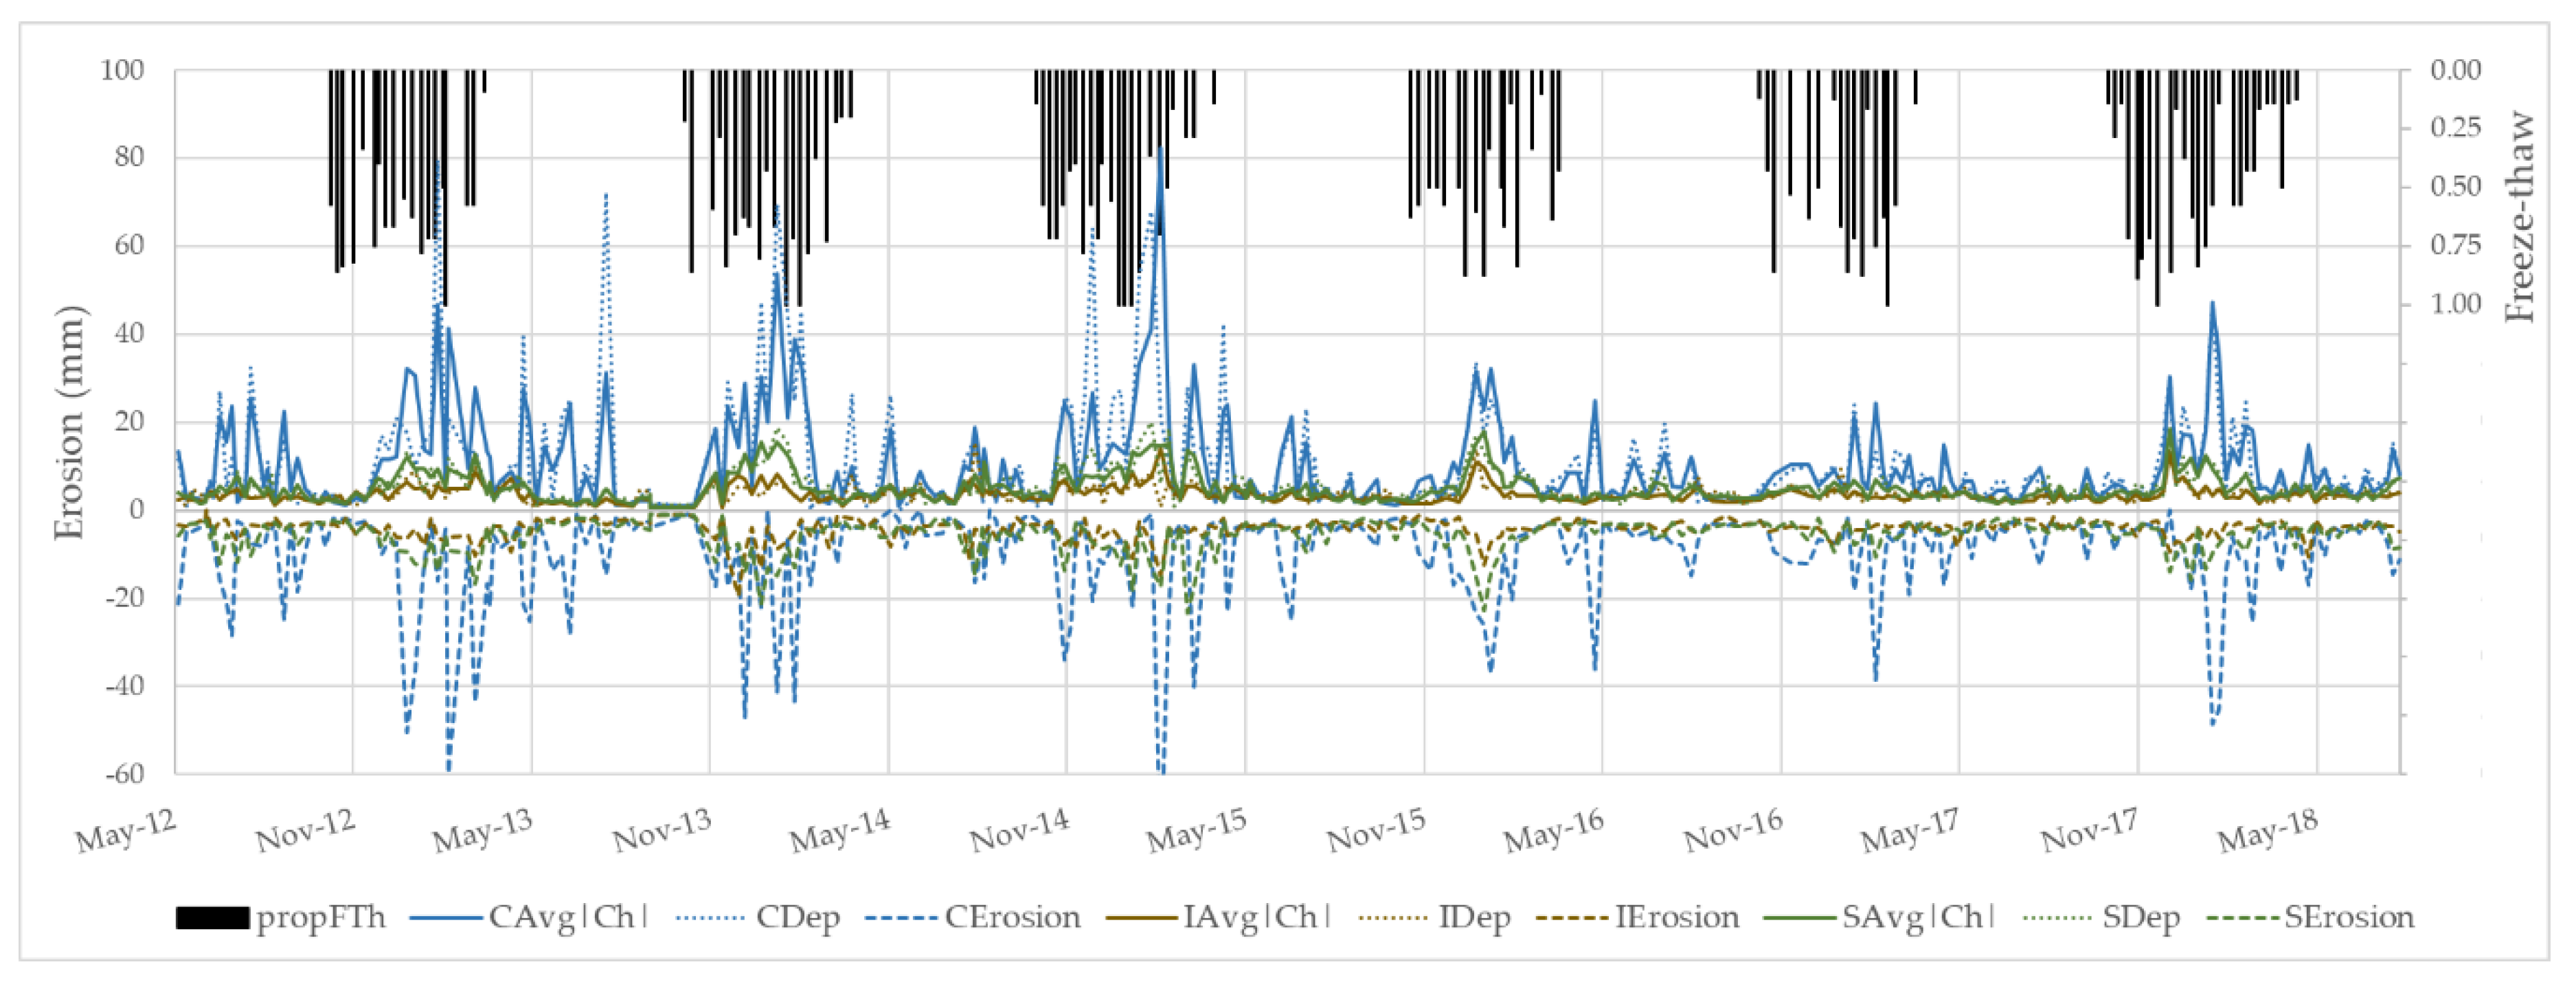
3.4. Erosion Response to Freeze-Thaw Activity

Erosion and freeze-thaw activity were significantly correlated for all erosion parameters, except AvgCh parameters for all morphological areas (Table 3). Moreover, the cross-correlation between erosion parameters and lagged freeze-thaw variables reveals a longer-term impact of freeze-thaw up to 11 weeks prior, with peaks up to five measurement periods prior (i.e., at lags of five periods). Significant reduction in correlation strength occurred after lags of six measurement periods for all erosion parameters (Figure 5).
Channels, interfluves, and sidewalls showed a seasonal pattern of erosional activity that matched freeze-thaw events (Figure 6), confirmed statistically by correlation results presented in Table 3. Lagged relationships may also be observed in the time series, whereby onset of freeze-thaw activity precedes onset of major erosional activity each season.
Regression models of erosion parameters with lagged freeze-thaw variables as independent variables were significant with R2 values ranging from 0.067 to 0.348 (Table 4). Freeze-thaw variables had the greatest explanatory power for erosion parameters in sidewalls, followed by channels and then interfluves. Models for parameter Avg|Ch| were able to explain the greatest amount of variability in the parameter for all morphological areas. These models retained various lagged freeze-thaw variables from lags of zero (current period) up to lags of eight measurement periods prior (approximately eight weeks). Models for the deposition parameter (Dep) tended to retain freeze-thaw variables at lower lags, while models for parameter Erosion retained variables at both short and very long lags, with the exception of IErosion.

4. Discussion

The calculated average erosion rate was 2.5 mm/year for gully channels, and was 20 mm/year and 21 mm/year for interfluves and sidewalls, respectively. Gully channels behaved differently from sidewalls and interfluves when erosion rates were compared, and it is clear that diverse erosional agents were acting in different gully morphologies. In channels, intermittent cycles of deposition and erosion occurred, as pulses of accumulated sediment moved downhill in the channels during runoff events [10,39,40]. In contrast, gully sidewall erosion was the most sensitive to freeze-thaw cycles when compared to precipitation duration and intensity [10], and aeolian processes [33]. Interestingly, gully interfluves had a similar erosion rate to sidewalls, but were less steep, covered with sparse vegetation, and less moist, and would therefore, be less affected by freeze-thaw. This is supported by the models presented in Table 4. Even though long-term erosion rates were similar between interfluves and sidewalls, when week-to-week variability was considered, differences between interfluve and sidewall erosion became apparent, demonstrated by the differences in Avg|Ch|, Dep and Erosion parameters. This suggests that, while overall erosion occurred at the same rate over the long-term, different processes drive erosion in interfluves and sidewalls. Sheet flow and rain-splash erosion are likely drivers of erosion in interfluves under humid subtropical climate conditions [34].
Erosion rates measured in this study are two to three orders of magnitude greater than erosion rates assessed in heavily forested Great Smoky Mountain (southern Appalachian region) river valleys with metamorphic bedrock (0.03 mm/year) [41]. The presence of heavy vegetation and resistant metamorphic bedrock resulted in a much lower rate of erosion when compared to the present study, which was focused on an almost barren hillslope gully system in erodible silty-clay soil.
Hart et al.’s 2017 study [34] of erosion in similar clay-rich soils and a humid subtropical climate produced similar erosion rates of 14 mm/year in gullies and 26 mm/year in interfluves, which is also similar to an average erosion rate of 15 mm/year observed in the badlands of New Jersey, USA [34]. Similar to our results, the same study also found that gully interfluves eroded more than channels. In two previous studies by the present authors at the east Tennessee gully system, erosion rates using 12-month and 20-month data were found to be 30 mm/day and 22.7 mm/day, respectively [10,42]. The present study also found very similar overall results, with the exception of one order of magnitude less erosion in the gully channels, which may be explained by deposition followed by active down cutting during summer rainstorms [34]. A future study by the authors will investigate the gully erosion pattern with respect to long-term rainfall in the area.
As described in the literature [10,39,40], and also reported in a previous short-term study at the same site [35], erosion parameter AvgCh (average change) is a poor predictor for gully erosion, due to deposition-erosion cycles producing an average with no significant trend. The remaining erosion parameters Avg|Ch| (absolute average change), Dep (deposition), and Erosion showed significant correlation with freeze-thaw, with sidewalls best correlated with Avg|Ch|(r = 0.463, p = 0.01). Sidewall slumping and sheeting action after freeze-thaw events were often observed during field data collection, and recorded in time-lapse camera records [35,43].
As expected, erosion models produced in the sidewalls were strongest, as freeze-thaw cycles and needle ice loosened the top layer of soil, which was then transported by gravity and post freeze-thaw runoff [34,35]. Thawed surface layers over still-frozen layers have great erosion potential [17], as demonstrated in a laboratory study in which melted needle ice saturated the surface soil and made a slurry that rested on ice-rich, frozen subsoil. The upper soil remained a slurry as long as slurry water could not infiltrate into the frozen subsoil, but when temperatures rose and the subsoil melted, slope failure occurred [27].
While an earlier study at this site [35] found that erosion in sidewalls was related to freeze-thaw activity in the current measurement period only, we found, using a longer-term dataset of lagged freeze-thaw activity, that antecedent freeze-thaw activity (occurring in up to eleven measurement periods prior) was important. Moreover, this relationship held for models of channel erosion as well as interfluve erosion, although interfluve models were substantially weaker. Indeed, freeze-thaw is a less important predictor of erosion in interfluve, where other factors like rain-splash and sheet flow are predominant drivers of erosion in similar soils and climate [34]. Additionally, interfluves may retain less moisture when compared to the moisture content of sidewalls and channels, and freeze-thaw is most effective in the presence of moisture due to formation of needle ice, which loosens the soil.
Other studies have shown that repeated freeze-thaw cycles loosen soils in the gully system causing soil detachment [34], and that the timing of snow accumulation and soil wetness prior to freezing are important factors in winter erosion [44]. Repeated freeze-thaw cycles on clay and silt-rich soil with low organic content increased soil stability for the first three cycles, but decreased stability at the fifth cycle and beyond [45]. Cold periods, during which soil remains continuously frozen for a prolonged time (10 days) was associated with 178% greater erosion than with daily freeze–thaw cycles over the same period [46]. Together, these studies support the influence of prior and repeated freeze-thaw cycles in gully erosion.

5. Conclusions

This study investigated gully erosion in clay-rich soils of east Tennessee in a humid subtropical climate over 75 months with a weekly time step. Long-term erosion rates were measured at 2.5 mm/year for channels, 20 mm/year for interfluves, and 21 mm/year for sidewalls. While long-term erosion rates for interfluves and sidewalls were similar, week-by-week changes in pin length were statistically different, indicating different drivers for erosion in interfluves and sidewalls. Ordinary least squares regression models of erosion, using lagged freeze-thaw variables, revealed that erosion in prior periods (up to 11 weeks prior) were important drivers for erosion, especially in sidewalls and channels. Models explained up to 34.8% of variability in erosion for sidewalls, up to 25.7% of variability in channels, and up to 19.9% of variability in interfluves. This research shows that antecedent freeze-thaw activity several months prior should be considered when assessing and identifying drivers for winter and spring erosion. Moreover, this study establishes that in rainfall-dominant humid subtropical climates, soil freezing conditions are important to consider, because freeze-thaw processes may exacerbate environmentally significant problems, like soil loss, reduced crop yield, and variable nutrient transport. The findings are also helpful for the identification of soil loss periods when planning for erosion control strategies in winter and spring months.

Author Contributions

Conceptualization, I.L. and A.N.; data curation, I.L.; formal analysis, I.L. and A.N.; funding acquisition, I.L. and A.N.; methodology, I.L. and A.N.; writing—original draft, I.L. and A.N.; writing—review and editing, I.L. and A.N.

Funding

This research received funding support from East Tennessee State University’s Honors College Federal Work Study students for collection of field data and from the East Tennessee State University Research Development Committee for manuscript publication fees.

Acknowledgments

The authors gratefully acknowledge the assistance in data collection provided by Tim Spiegel, Nicholas Barnes, Tim Land, Jamie Kincheloe, Nicholas McConnell, and Jennifer Grant. The authors are grateful for the valuable contribution of the anonymous reviewers.

Conflicts of Interest

The authors declare no conflict of interest.

References

  1. Le Roux, J.J.; Sumner, P.D. Factors controlling gully development: Comparing continuous and discontinuous gullies. Land Degrad. Dev. 2012, 23, 440–449. [Google Scholar] [CrossRef]
  2. Lal, R. Soil erosion and land degradation: The global risks. In Advances in Soil Science: Soil Degradation; Lal, R., Stewart, B.A., Eds.; Springer: New York, NY, USA, 1990; Volume 11, pp. 129–172. ISBN 978-1-4612-3322-0. [Google Scholar]
  3. Pimentel, D. Soil erosion and the threat to food security and the environment. Ecosyst. Health 2000, 6, 221–226. [Google Scholar] [CrossRef]
  4. Robertson, G.P.; Broome, J.C.; Chornesky, E.A.; Frankenberger, J.R.; Johnson, P.; Lipson, M.; Miranowski, J.A.; Owens, E.D.; Pimentel, D.; Thrupp, L.A. Rethinking the vision for environmental research in US agriculture. Bioscience 2004, 54, 61–65. [Google Scholar] [CrossRef]
  5. Parkner, T.; Page, M.J.; Marutani, T.; Trustrum, N.A. Development and controlling factors of gullies and gully complexes, East Coast, New Zealand. Earth Surf. Process. Landf. 2006, 31, 187–199. [Google Scholar] [CrossRef]
  6. Valentin, C.; Poesen, J.; Li, Y. Gully erosion: Impacts, factors and control. Catena 2005, 63, 132–153. [Google Scholar] [CrossRef]
  7. Castillo, C.; Gómez, J.A. A century of gully erosion research: Urgency, complexity and study approaches. Earth-Sci. Rev. 2016, 160, 300–319. [Google Scholar] [CrossRef]
  8. Xu, J.; Li, H.; Liu, X.B.; Hu, W.; Yang, Q.; Hao, Y.; Zhen, H.; Zhang, X. Gully erosion induced by snowmelt in Northeast China: A case study. Sustainability 2019, 11, 88. [Google Scholar] [CrossRef]
  9. Chaplot, V.; Brown, J.; Dlamini, P.; Eustice, T.; Janeau, J.L.; Jewitt, G.; Lorentz, S.; Martin, L.; Nontokozo-Mchunu, C.; Oakes, E.; et al. Rainfall simulation to identify the storm-scale mechanisms of gully bank retreat. Agric. Water Manag. 2011, 98, 1704–1710. [Google Scholar] [CrossRef] [Green Version]
  10. Luffman, I.E.; Nandi, A.; Spiegel, T. Gully morphology, hillslope erosion, and precipitation characteristics in the Appalachian Valley and Ridge province, southeastern USA. Catena 2015, 133, 221–232. [Google Scholar] [CrossRef]
  11. Nearing, M.A.; Jetten, V.; Baffaut, C.; Cerdan, O.; Couturier, A.; Hernandez, M.; Le Bissonnais, Y.; Nichols, M.H.; Nunes, J.P.; Renschler, C.S. Modeling response of soil erosion and runoff to changes in precipitation and cover. Catena 2005, 61, 131–154. [Google Scholar] [CrossRef]
  12. Baartman, J.E.M.; Jetten, V.G.; Ritsema, C.J.; Vente, J. Exploring effects of rainfall intensity and duration on soil erosion at the catchment scale using openLISEM: Prado catchment, SE Spain. Hydrol. Process. 2012, 26, 1034–1049. [Google Scholar] [CrossRef]
  13. el Kateb, H.; Zhang, H.; Zhang, P.; Mosandl, R. Soil erosion and surface runoff on different vegetation covers and slope gradients: A field experiment in Southern Shaanxi Province, China. Catena 2013, 105, 1–10. [Google Scholar] [CrossRef]
  14. Golosov, V.; Koiter, A.J.; Ivanov, M.; Maltsev, K.; Gusarov, A.; Sharifullin, A.; Radchenko, I. Assessment of soil erosion rate trends in two agricultural regions of European Russia for the last 60 years. J. Soils Sediments 2018, 18, 3388–3403. [Google Scholar] [CrossRef]
  15. Sonneveld, M.P.W.; Everson, T.M.; Veldkamp, A. Multi-scale analysis of soil erosion dynamics in Kwazulu-Natal, South Africa. Land Degrad. Dev. 2005, 16, 287–301. [Google Scholar] [CrossRef]
  16. Lin, C.; McCool, D.K. Simulating snowmelt and soil frost depth by an energy budget approach. Trans. Am. Soc. Agric. Biol. Eng. 2006, 49, 1383–1394. [Google Scholar]
  17. Wischmeier, W.H.; Smith, D.D. Predicting Rainfall Erosion Losses—A Guide to Conservation Planning; USDA, Science and Education Administration: Hyattsville, MA, USA, 1978. [Google Scholar]
  18. Demidov, V.V.; Ostroumov, V.Y.; Nikitishena, I.A.; Lichko, V.I. Seasonal freezing and soil erosion during snowmelt. Eurasian Soil Sci. 1995, 27, 78–87. [Google Scholar]
  19. Ollesch, G.; Kistner, I.; Meissner, R.; Lindenschmidt, K.E. Modelling of snowmelt erosion and sediment yield in a small low-mountain catchment in Germany. Catena 2006, 68, 161–176. [Google Scholar] [CrossRef]
  20. van Vliet, L.J.P.; Kline, R.; Hall, J.W. Effects of three tillage treatments on seasonal runoff and soil loss in the Peace River region. Can. J. Soil Sci. 1991, 71, 533–544. [Google Scholar] [CrossRef]
  21. Lewkowicz, A.G.; Kokelj, S.V. Slope sediment yield in arid lowland continuous permafrost environments, Canadian Arctic Archipelago. Catena 2002, 46, 261–283. [Google Scholar] [CrossRef]
  22. Kok, H.; McCool, D.K. Freeze thaw effects on soil strength. In International Symposium on Frozen Soil Impacts on Agricultural, Range, and Forest Lands; Cooley, K.R., Ed.; US Army Corps of Engineers Cold Regions Research and Engineering Laboaratory: Spokane, WA, USA, 1990; pp. 70–76. [Google Scholar]
  23. Formanek, G.E.; McCool, D.K.; Papendick, R.I. Freeze-thaw and consolidation effects on strength of a wet silt loam. Trans. Am. Soc. Agric. Biol. Eng. 1984, 27, 1749–1752. [Google Scholar] [CrossRef]
  24. Wu, Y.; Ouyang, W.; Hao, Z.; Yang, B.; Wang, L. Snowmelt water drives higher soil erosion than rainfall water in a mid-high latitude upland watershed. J. Hydrol. 2018, 556, 438–448. [Google Scholar] [CrossRef]
  25. He, H.; Dyck, M.F.; Si, B.C.; Zhang, T.; Lv, J.; Wang, J. Soil freezing-thawing characteristics and snowmelt infiltration in Cryalfs of Alberta, Canada. Geoderma Reg. 2015, 5, 198–208. [Google Scholar] [CrossRef]
  26. Wang, T.; Li, P.; Ren, Z.; Xu, G.; Li, Z.; Yang, Y.; Tang, S.; Yao, J. Effects of freeze-thaw on soil erosion processes and sediment selectivity under simulated rainfall. J. Arid Land 2017, 9, 234–243. [Google Scholar] [CrossRef] [Green Version]
  27. Gatto, L.W. Soil freeze-thaw-induced changes to a simulated rill: Potential impacts on soil erosion. Geomorphology 2000, 32, 147–160. [Google Scholar] [CrossRef]
  28. Iwata, Y.; Hayashi, M.; Hirota, T. Comparison of snowmelt infiltration under different soil-freezing conditions influenced by snow cover. Vadose Zone J. 2008, 7, 79–86. [Google Scholar] [CrossRef]
  29. Bayard, D.; Stähli, M.; Parriaux, A.; Flühler, H. The influence of seasonally frozen soil on the snowmelt runoff at two Alpine sites in southern Switzerland. J. Hydrol. 2005, 309, 66–84. [Google Scholar] [CrossRef]
  30. Galang, M.A.; Markewitz, D.; Morris, L.A.; Bussell, P. Land use change and gully erosion in the Piedmont region of South Carolina. J. Soil Water Conserv. 2007, 62, 122–129. [Google Scholar]
  31. Daniels, R.B. Soil erosion and degradation in the southern Piedmont of the USA. In Land Transformation in Agriculture; Wolman, M.G., Fournier, F.G.A., Eds.; John Wiley & Sons, Ltd.: Hoboken, NJ, USA, 1987; pp. 407–428. [Google Scholar]
  32. Nandi, A.; Luffman, I. Erosion related changes to physicochemical properties of Ultisols distributed on calcareous sedimentary rocks. J. Sustain. Dev. 2012, 5, 52–68. [Google Scholar] [CrossRef]
  33. Kincheloe, J.L.; Nandi, A.; Luffman, I.E. Aeolian erosion processes in humid subtropical ultisols in southeastern United States. J. Geogr. Earth Sci. 2018, 6, 19–30. [Google Scholar] [CrossRef]
  34. Hart, E.A.; Mills, H.H.; Li, P. Measuring erosion rates on exposed limestone residuum using erosion pins: A 10-year record. Phys. Geogr. 2017, 38, 541–555. [Google Scholar] [CrossRef]
  35. Barnes, N.; Luffman, I.; Nandi, A. Gully erosion and freeze-thaw processes in clay-rich soils, northeast Tennessee, USA. GeoResJ 2016, 9, 67–76. [Google Scholar] [CrossRef]
  36. Moore, H.L. Drainage problems in carbonate terrain of East Tennessee. In Proceedings of the 27th Annual Highway Geology Symposium, Orlando, FL, USA, 19–21 May 1976; pp. 112–131. [Google Scholar]
  37. USDA Web Soil Survey. Available online: http://websoilsurvey.nrcs.usda.gov/ (accessed on 20 December 2014).
  38. IBM Corp. SPSS Statistics for Windows Version 25.0; IBM Corp: Armonk, NY, USA, 2017. [Google Scholar]
  39. Couper, P.; Stott, T.; Maddock, I. Insights into river bank erosion processes derived from analysis of negative erosion-pin recordings: Observations from three recent UK studies. Earth Surf. Process. Landf. 2002, 27, 59–79. [Google Scholar] [CrossRef]
  40. Kearney, S.P.; Fonte, S.J.; García, E.; Smukler, S.M. Improving the utility of erosion pins: Absolute value of pin height change as an indicator of relative erosion. Catena 2018, 163, 427–432. [Google Scholar] [CrossRef]
  41. Matmon, A.; Bierman, P.R.; Larsen, J.; Southworth, S.; Pavich, M.; Caffee, M. Temporally and spatially uniform rates of erosion in the southern Appalachian Great Smoky Mountains. Geology 2003, 31, 155–158. [Google Scholar] [CrossRef] [Green Version]
  42. Luffman, I.; Nandi, A.; Luffman, B. Comparison of geometric and volumetric methods to a 3D solid model for measurement of gully erosion and sediment yield. Geosciences 2018, 8, 86. [Google Scholar] [CrossRef]
  43. McConnell, N.R.; Luffman, I.E.; Nandi, A. Time-lapse monitoring of sidewall mass-wasting in a Northeast Tennessee gully. In Proceedings of the Geological Society of America Southeastern Section Annual Meeting, Knoxville, TN, USA, 12–13 April 2018. [Google Scholar]
  44. He, H.; Dyck, M. Application of multiphase dielectric mixing models for understanding the effective dielectric permittivity of frozen soils. Vadose Zone J. 2013, 12. [Google Scholar] [CrossRef]
  45. Oztas, T.; Fayetorbay, F. Effect of freezing and thawing processes on soil aggregate stability. Catena 2003, 52, 1–8. [Google Scholar] [CrossRef]
  46. Edwards, L.M.; Burney, J.R. The effect of antecedent freeze-thaw frequency on runoff and soil loss from frozen soil with and without subsoil compaction and ground cover. Can. J. Soil Sci. 1989, 69, 799–811. [Google Scholar] [CrossRef]
Figure 1. Study site location and representative gully, showing interfluves, sidewalls, and channels. Erosion pins are indicated by arrows.
Agronomy 09 00549 g001
Figure 2. Observed and normal maximum and minimum temperature.
Agronomy 09 00549 g002
Figure 3. Each series represents a single erosion pin measured at weekly intervals. Length of erosion pins increases over time for channels, interfluves, and sidewalls. New pins were added in 2015 to replace pins eroded out during prior seasons.
Agronomy 09 00549 g003
Figure 4. Comparison of erosion rates between morphological areas. The distribution of erosion rates for channel pins is significantly different from interfluve and sidewall pins. Circles and asterisks indicate outliers (falling outside the second and third quartiles by 1.5 times and three times the interquartile range, respectively).
Agronomy 09 00549 g004
Figure 5. Cross correlation of lagged freeze-thaw variable with erosion parameters.
Agronomy 09 00549 g005
Figure 6. Time series of erosion parameters with freeze-thaw variables shows a seasonal pattern and lagged relationship between onset of freeze-thaw events and peak of erosive activity.
Agronomy 09 00549 g006
Table 1. Weather data gap coverage.#Days indicates number of days.
Date Range#DaysData Source
18/4/2013–25/4/20137not filled
3/9/2013–10/9/20137not filled
28/7/2014–5/8/20148KTNJONES7 station
14/10/2015–29/10/201515KTNJONES7 station
10/3/2015–27/3/201517KTNJONES7 station
25/5/20171not filled
17/6/2017–18/6/20171not filled
25/6/2017–29/6/20174not filled
16/8/20171not filled
13/3/2018–16/4/201834KTNJONES7 station
27/4/20181KTNJONES7 station
7/6/2018–11/6/20184KTNJONES7 station
Table 2. Descriptive statistics of freeze-thaw and erosion parameters (in mm) over n = 294 measurement periods.
nMinMaxMeanStd. DeviationSkewnessKurtosis
PropFTh2930.001.000.230.320.99−0.57
CAvgCh294−74.0040.400.229.19−1.2816.84
CAvg|Ch|2940.8582.409.9010.242.5710.23
CDep2921.0079.4410.5212.092.9010.47
CErosion290−78.200.00−9.3710.66−2.749.66
IAvgCh294−14.009.59−0.432.14−0.516.81
Iavg|Ch|2940.5614.113.531.772.167.99
IDep2941.0015.673.721.972.208.84
IErosion294−19.330.00−4.082.30−2.339.06
SAvgCh294−13.1214.65−0.342.950.625.89
Savg|Ch|2940.6018.154.993.191.672.92
SDep2941.0020.205.213.331.814.07
SErosion294−23.25−1.00−5.563.72−1.964.56
Table 3. Spearman correlation coefficients for non-lagged freeze-thaw variable—proportion of freeze-thaw days (PropFTh)—with all erosion parameters (** indicates significant at p = 0.01, * indicates significant at p = 0.05, and – indicates not significant).
ChannelsInterfluvesSidewalls
AvgCh---
Avg|Ch|0.345 **0.331 *0.463 **
Dep0.351 **0.185 **0.422 **
Erosion−0.198 **−0.285 **−0.363 **
Table 4. Summary of ordinary least squares (OLS) regression results for erosion parameters using lagged freeze-thaw variables.
ParameterVariables RetainedAdjusted R2
CAvg|Ch|PropFTh, PropFTh-2, PropFTh-80.257
CDep PropFTh-2, PropFTh-60.157
CErosionPropFTh-2, PropFTh-8, PropFTh-10, PropFTh-110.188
IAvg|Ch|PropFTh-2, PropFTh-60.199
IDep PropFTh-50.067
IErosionPropFTh-20.134
SAvg|Ch|PropFTh, PropFTh-2, PropFTh-70.348
SDep PropFTh, PropFTh-40.265
SErosionPropFTh, PropFTh-2, PropFTh-8, PropFTh-110.259

