Evaluation of the ‘Irish Rules’: The Potato Late Blight Forecasting Model and Its Operational Use in the Republic of Ireland

 ,
,  , ,
, , 
Abstract
1. Introduction
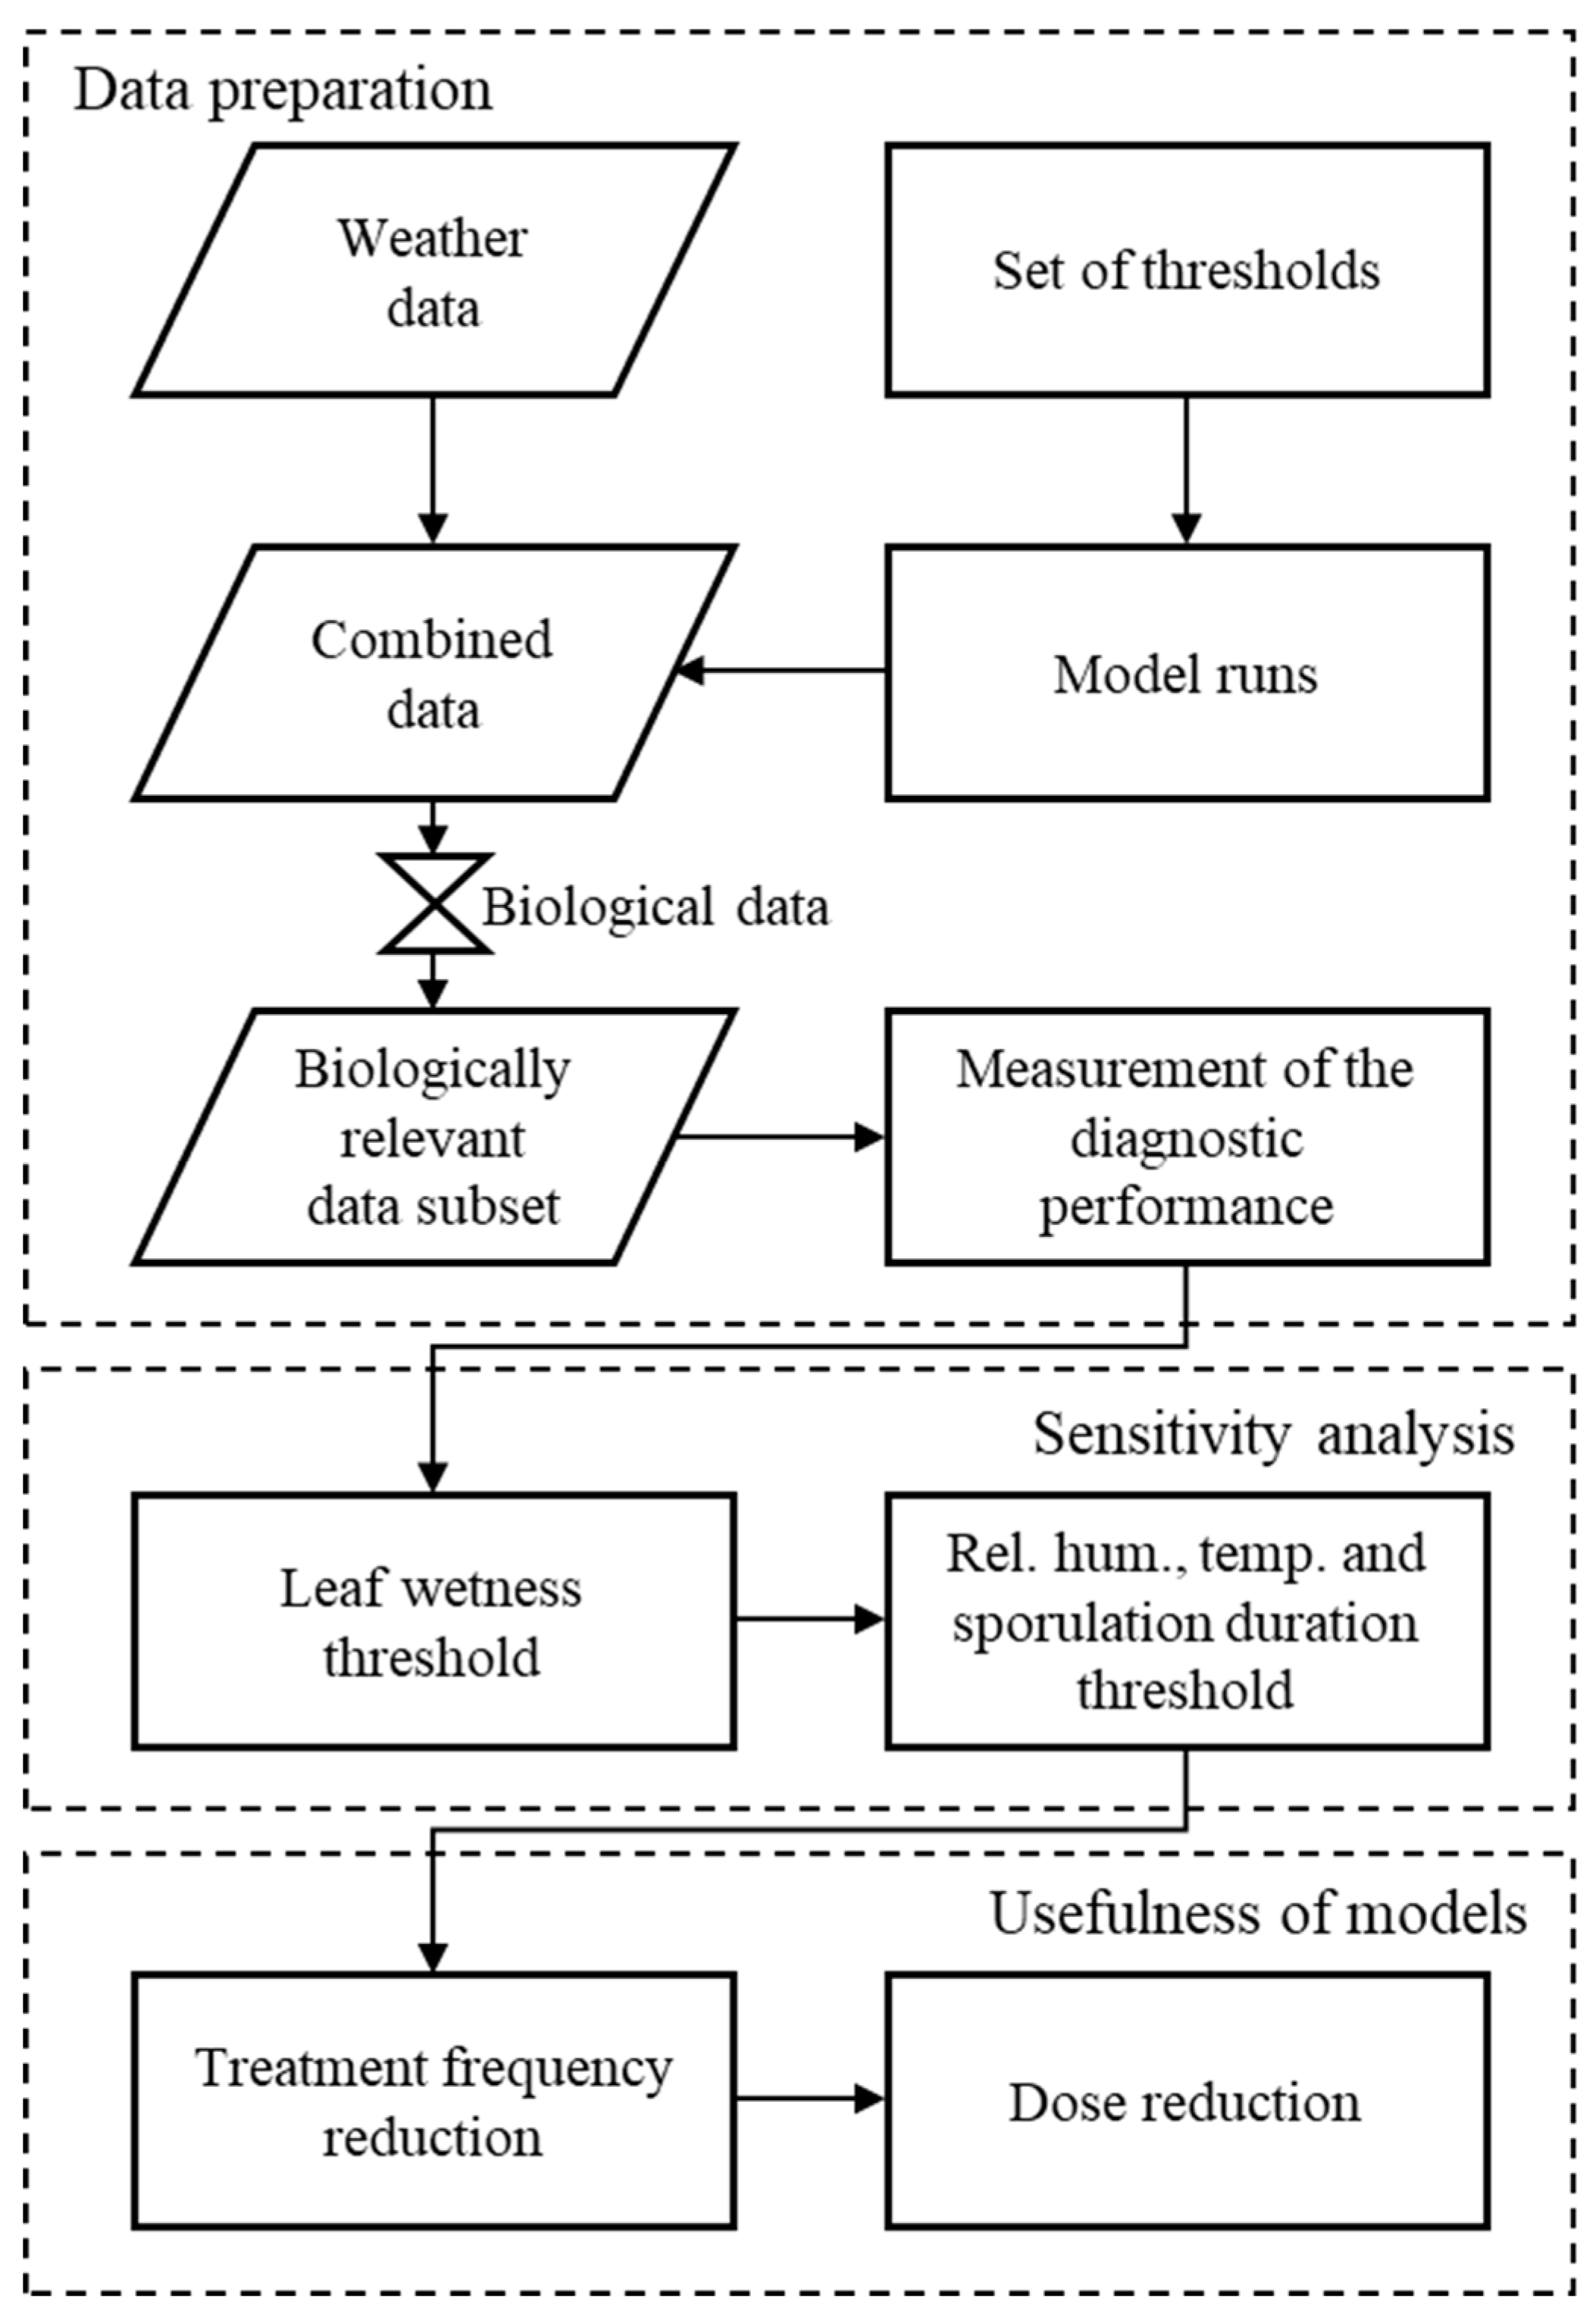
2. Data and Methods
2.1. Site Description
2.2. Data
2.2.1. Biological Data
2.2.2. Weather Data
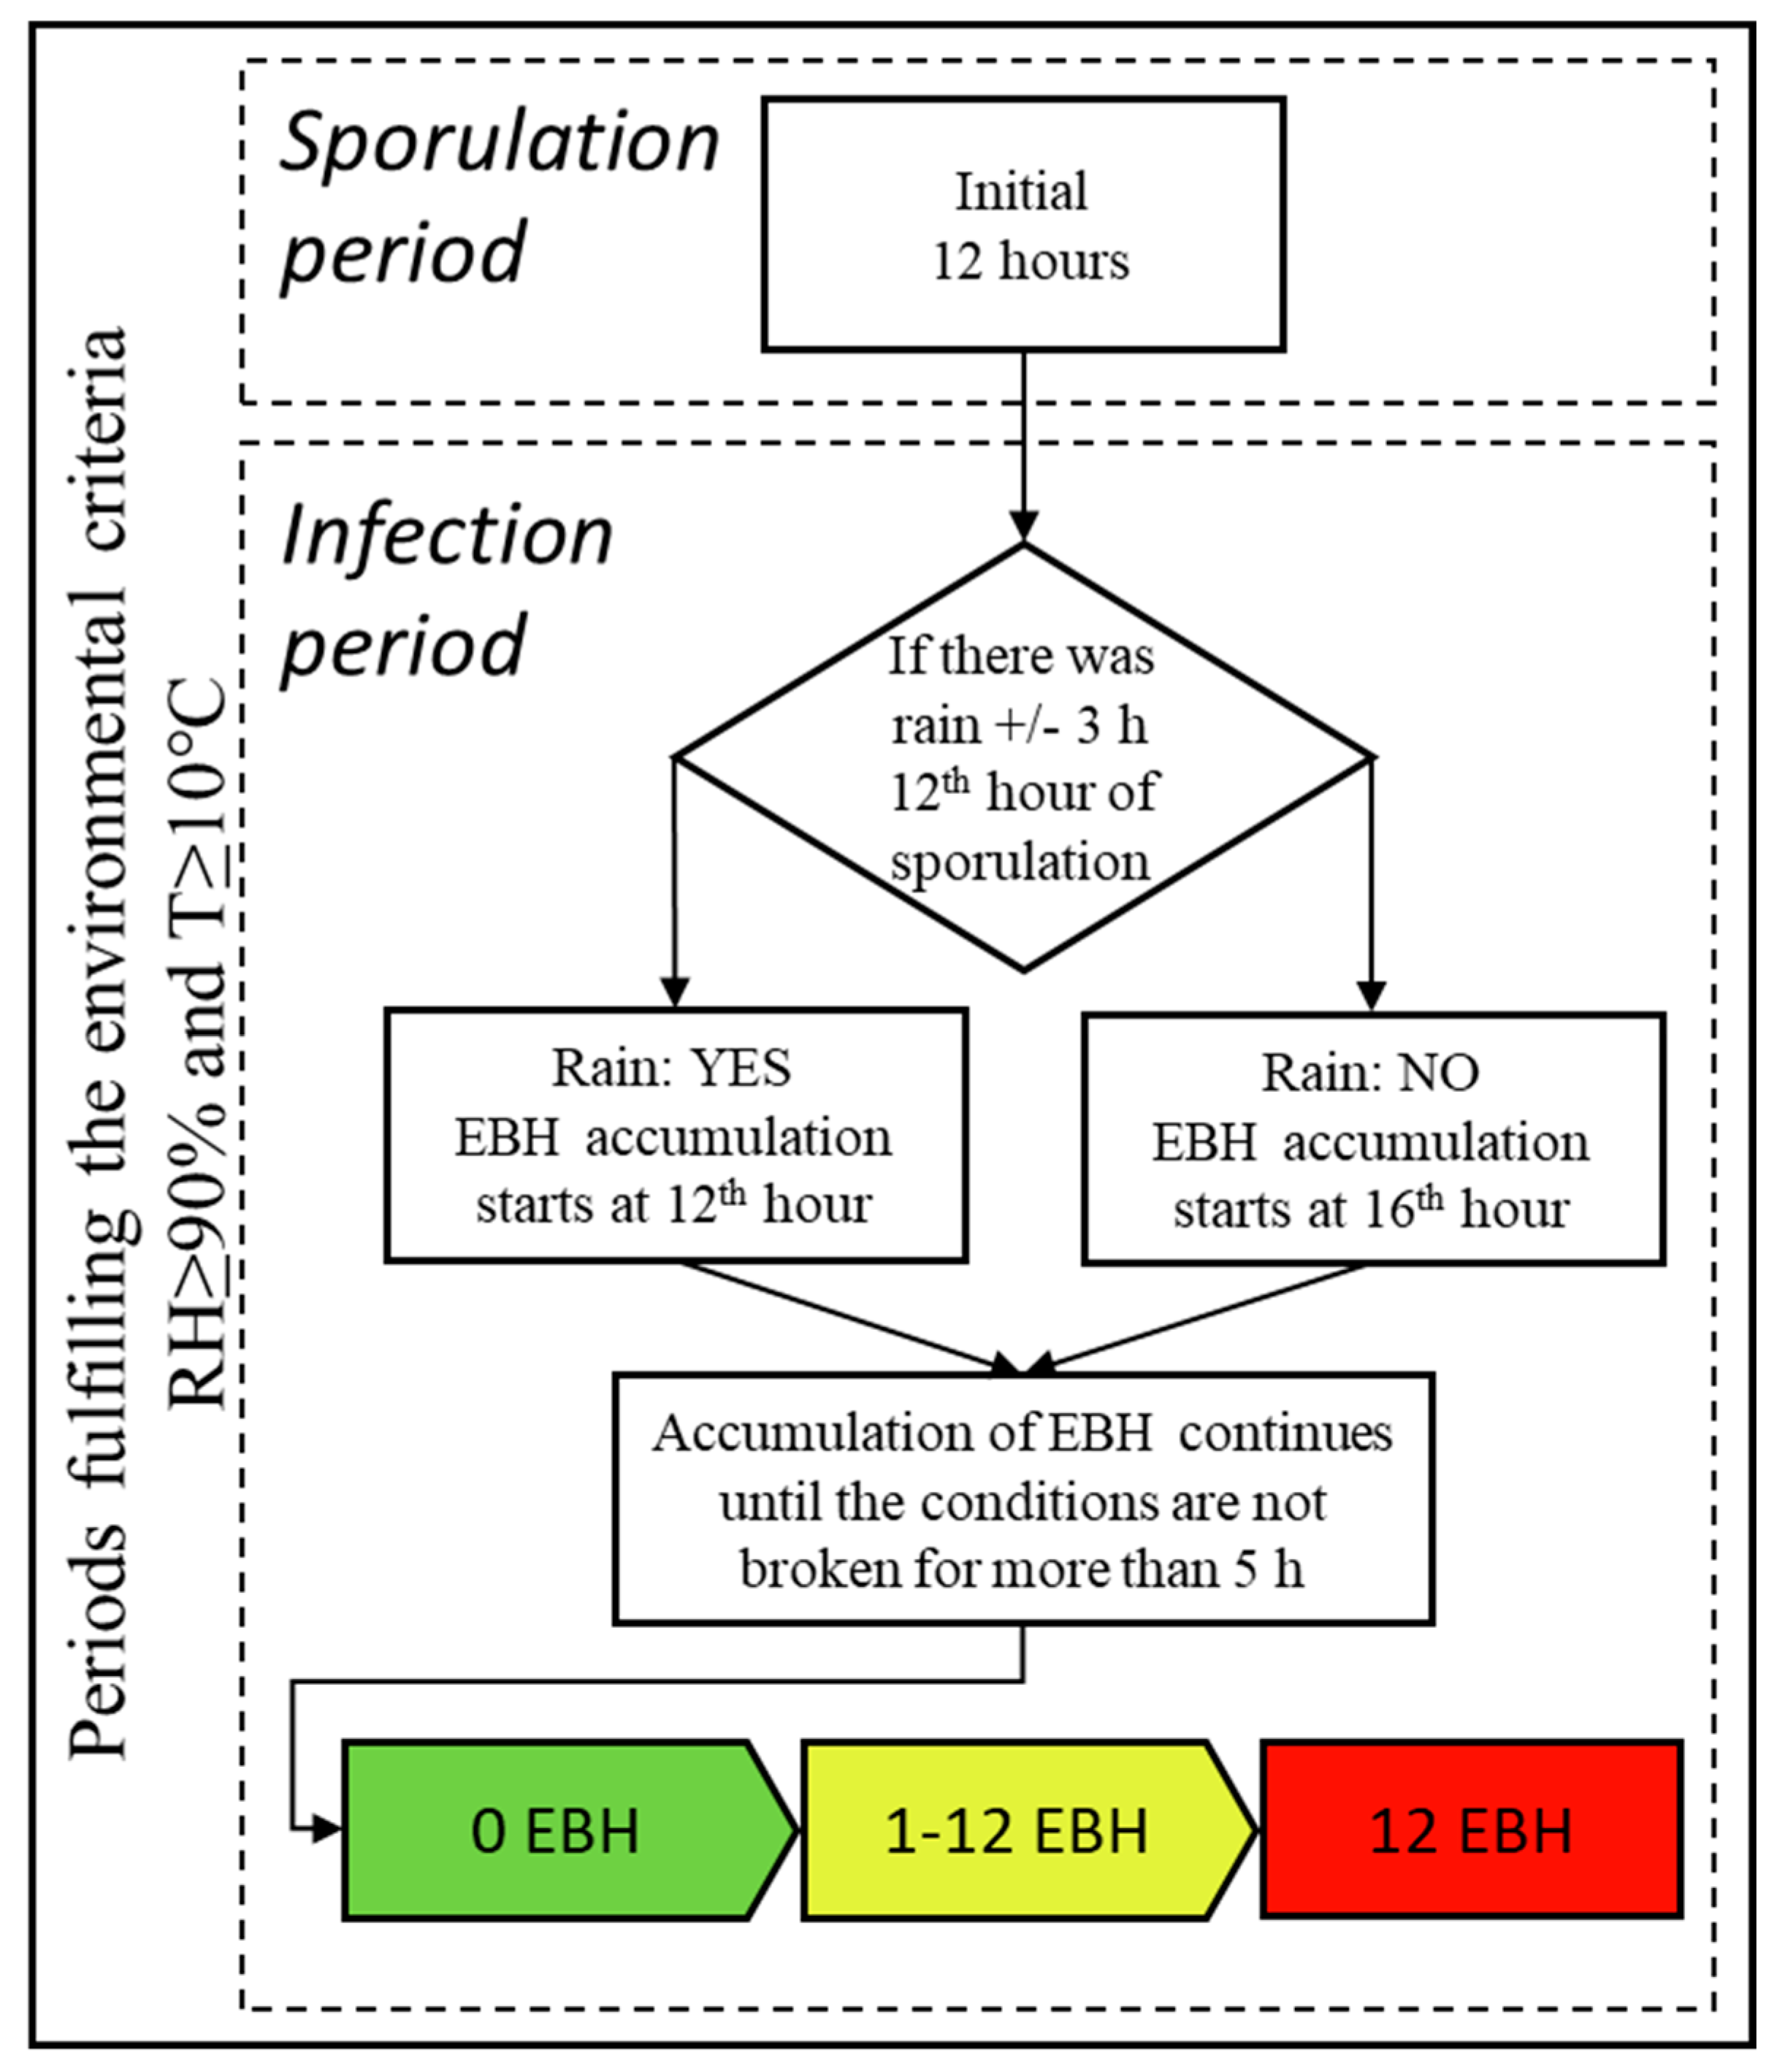
2.2.3. The IR Model and Its Operational Use
- Sporulation period—the initial stage considered necessary for the formation of sporangia is set to a minimum of 12 consecutive hours;
- Infection period—starts after the 12 hour sporulation period is completed. If the surface of the plant is not wet at the beginning of the infection period, effective blight hours (EBH) begin accumulating from the 16th hour (12 h sporulation period + 4 h = 16 h); when the surface of the plant is wet at the beginning of the infection period, the effective blight hours’ (EBH) accumulation is reduced by a period of 4 h (16 h − 4 h = 12 h). The leaf (surface) wetness (LWt) is considered present if there was a considerable amount of precipitation (≥ 0.1 mm) during the time window of 3 h before and 3 h after the 12th consecutive hour of sporulation. The infection period lasts until conditions (temperatures ≥ 10 ℃ and relative humidity ≥ 90%) are not broken for more than 5 consecutive hours, required for spore survival.
2.3. Evaluation Procedure
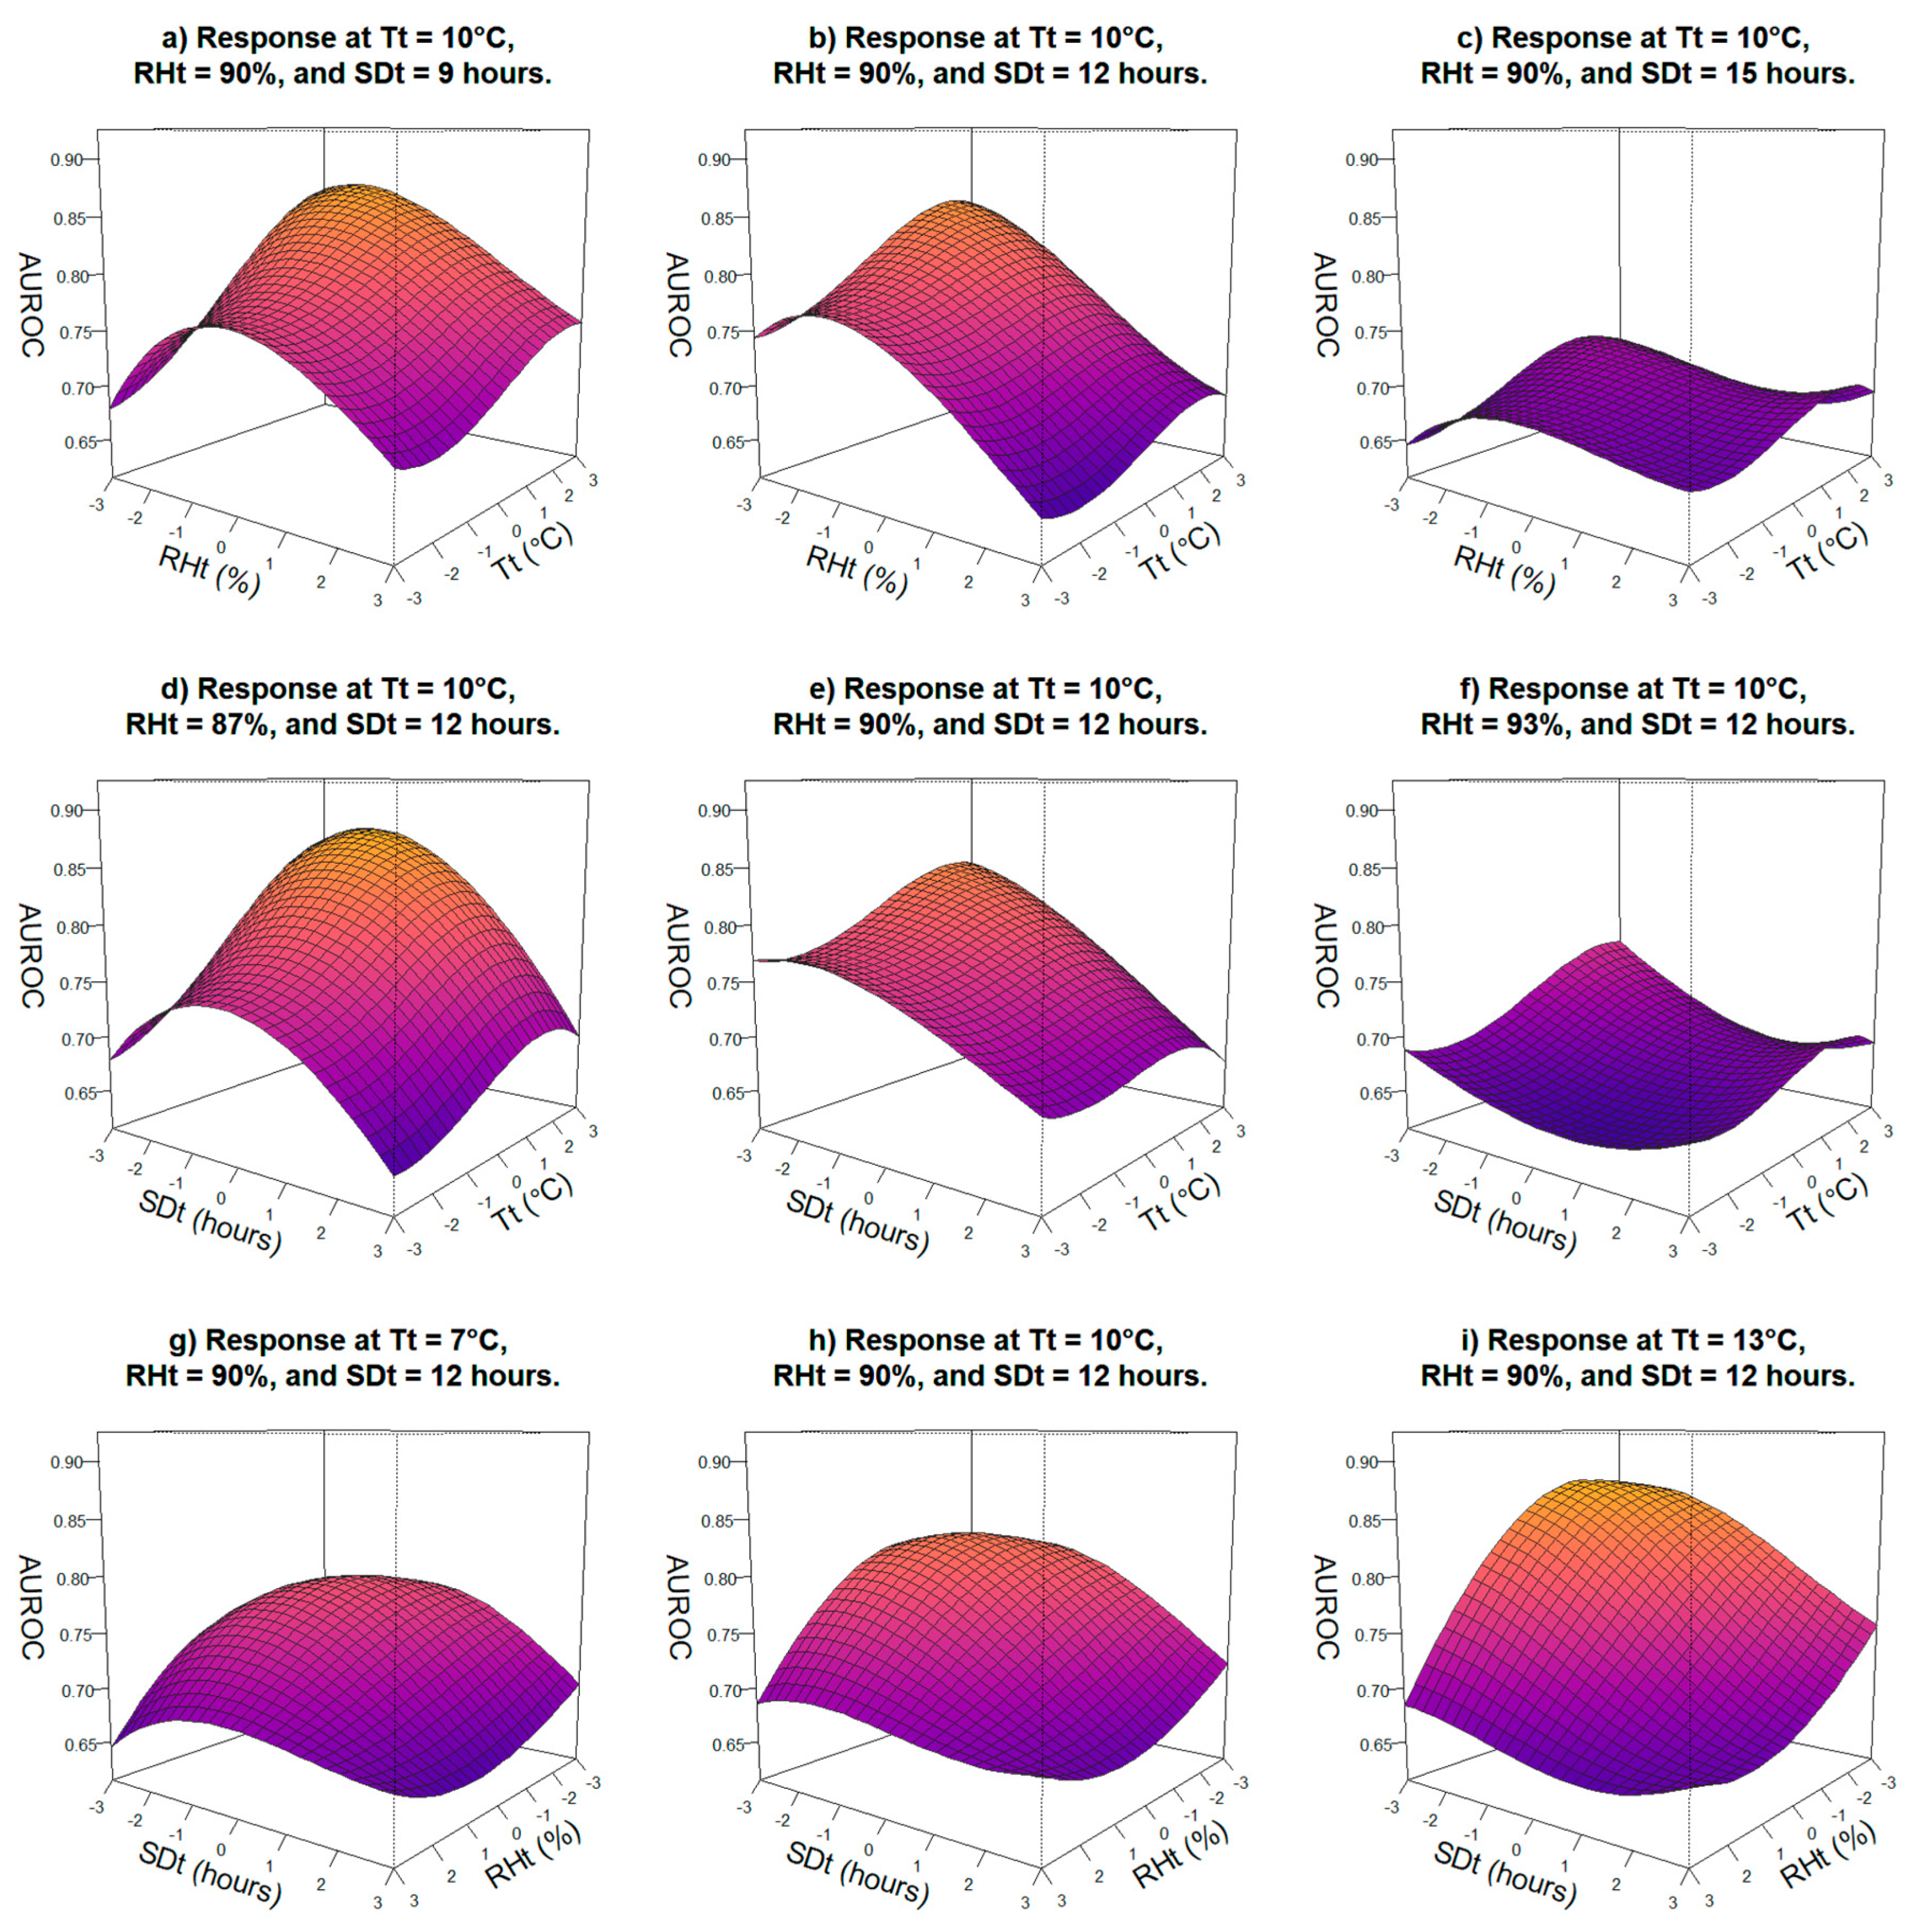
2.3.1. Model Thresholds under Evaluation
2.3.2. Analysis of Diagnostic Performance
- -
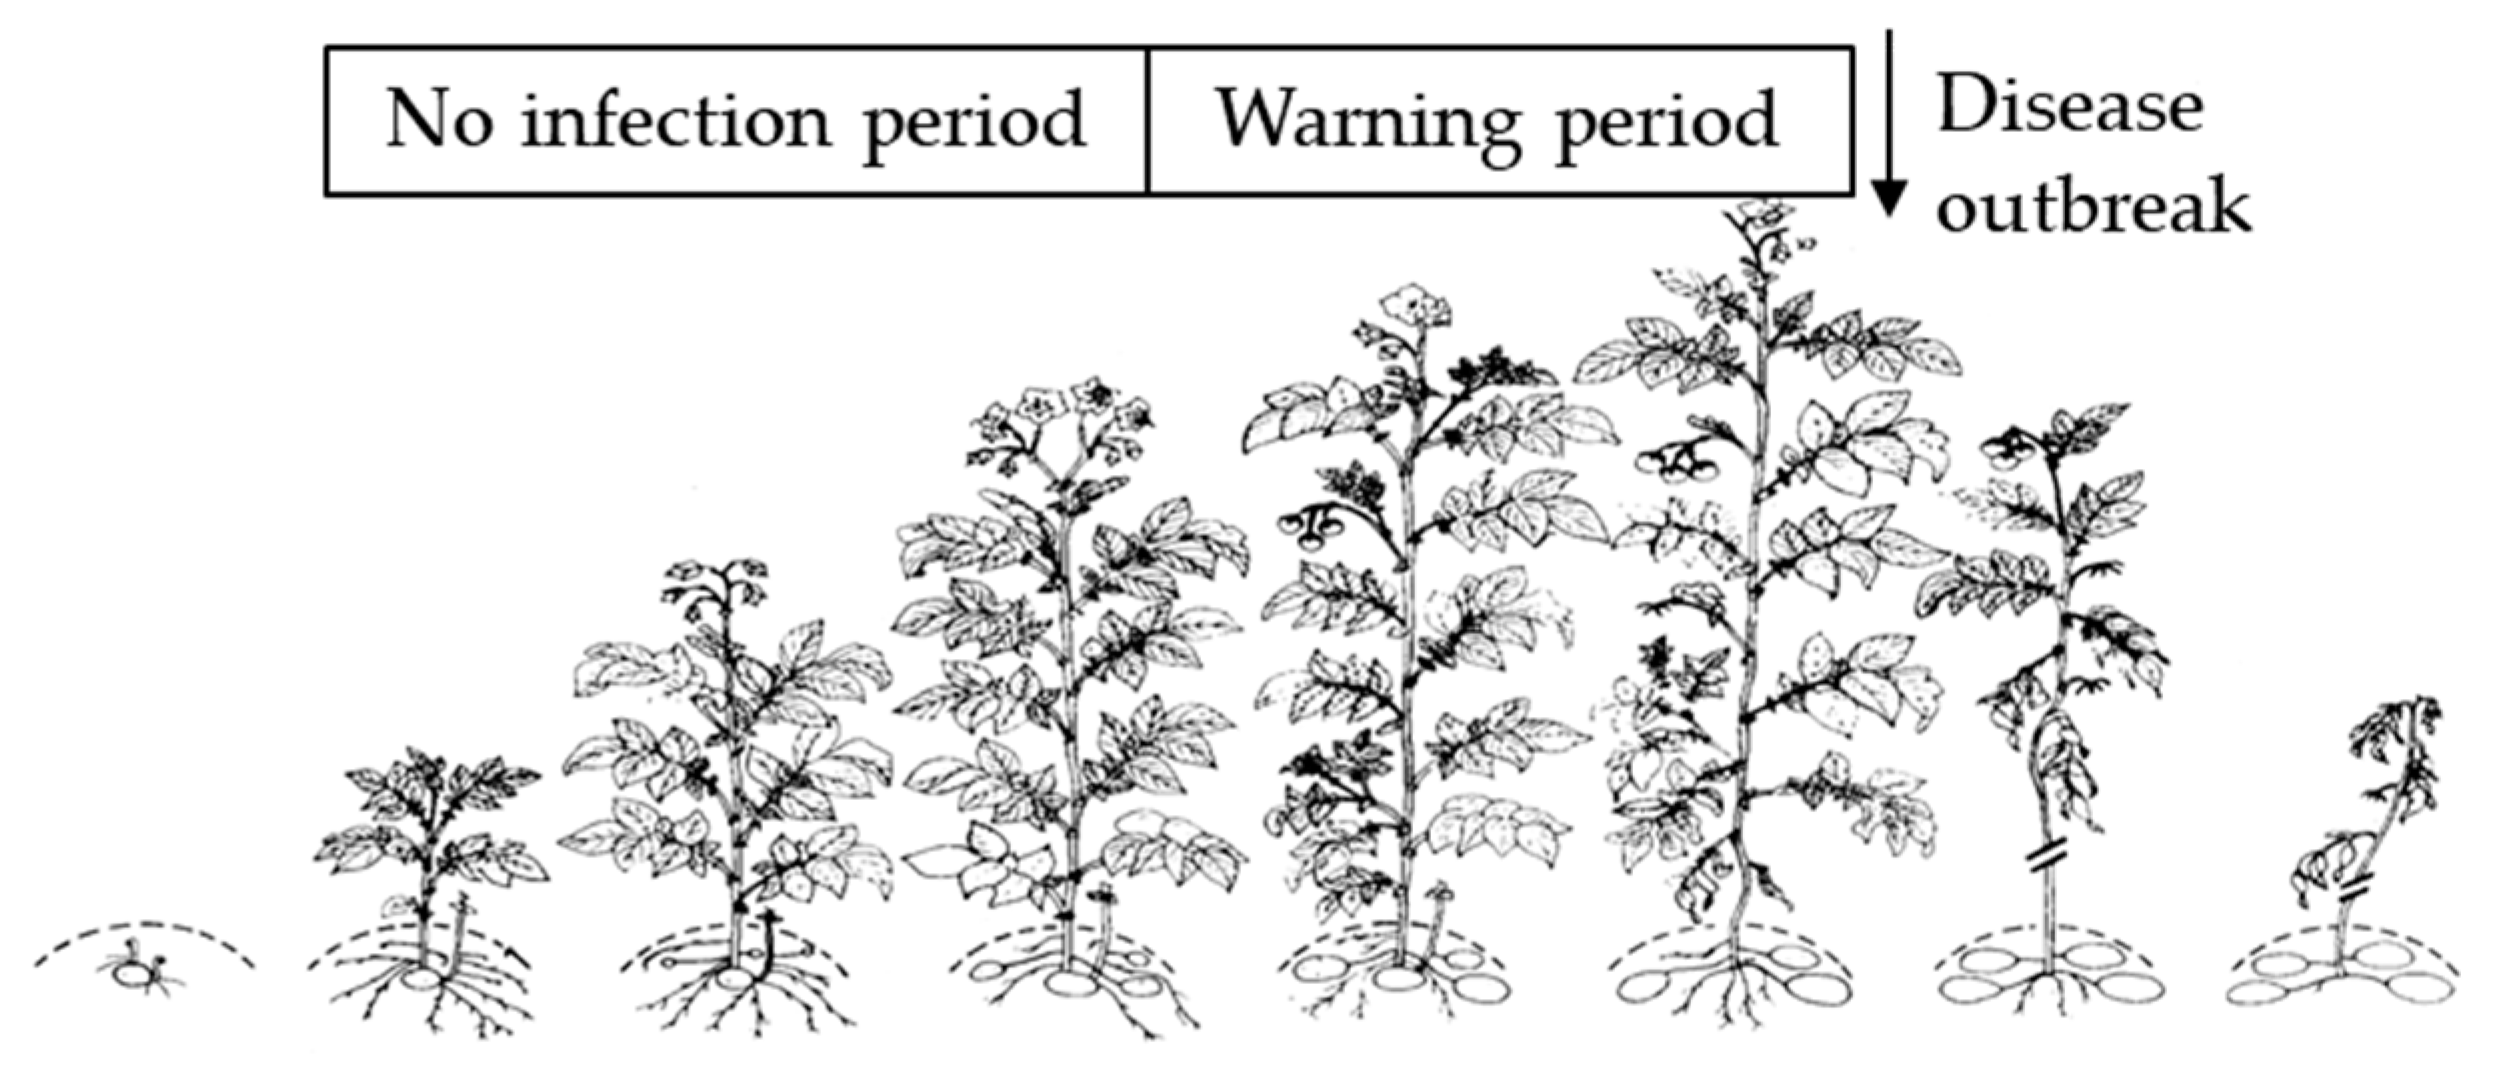
- No infection period: Considered the period when the healthy (susceptible) host was present, but no infections were observed. This period lasted from emergence, which was estimated to start three weeks after planting, to 14 days prior to the first observation of the disease in the field. Specificity or true negative rate was measured during this period. It was considered that each warning during this period activated a chemical treatment which provided protection for the subsequent period of 7 days, and was considered as a false positive (FP). True negatives (TN) were calculated as a proportion of the remaining period, when fungicide protection was not recommended.
- -
- Warning period: Considered a period when infections occurred and was assigned a 10-day time window, starting 14 days and ending 4 days prior to the disease being observed in the field. A risk warning of disease outbreak 10 days ahead has been reported as an optimum warning time [54], and a period of four days was considered to be a minimum incubation period. Sensitivity or true positive rate was assessed during ‘warning period’. Warning periods where the value of the warning threshold was reached and would trigger a fungicide treatment, is considered as a true positive (TP) and if the warning was not issued false negatives (FN).
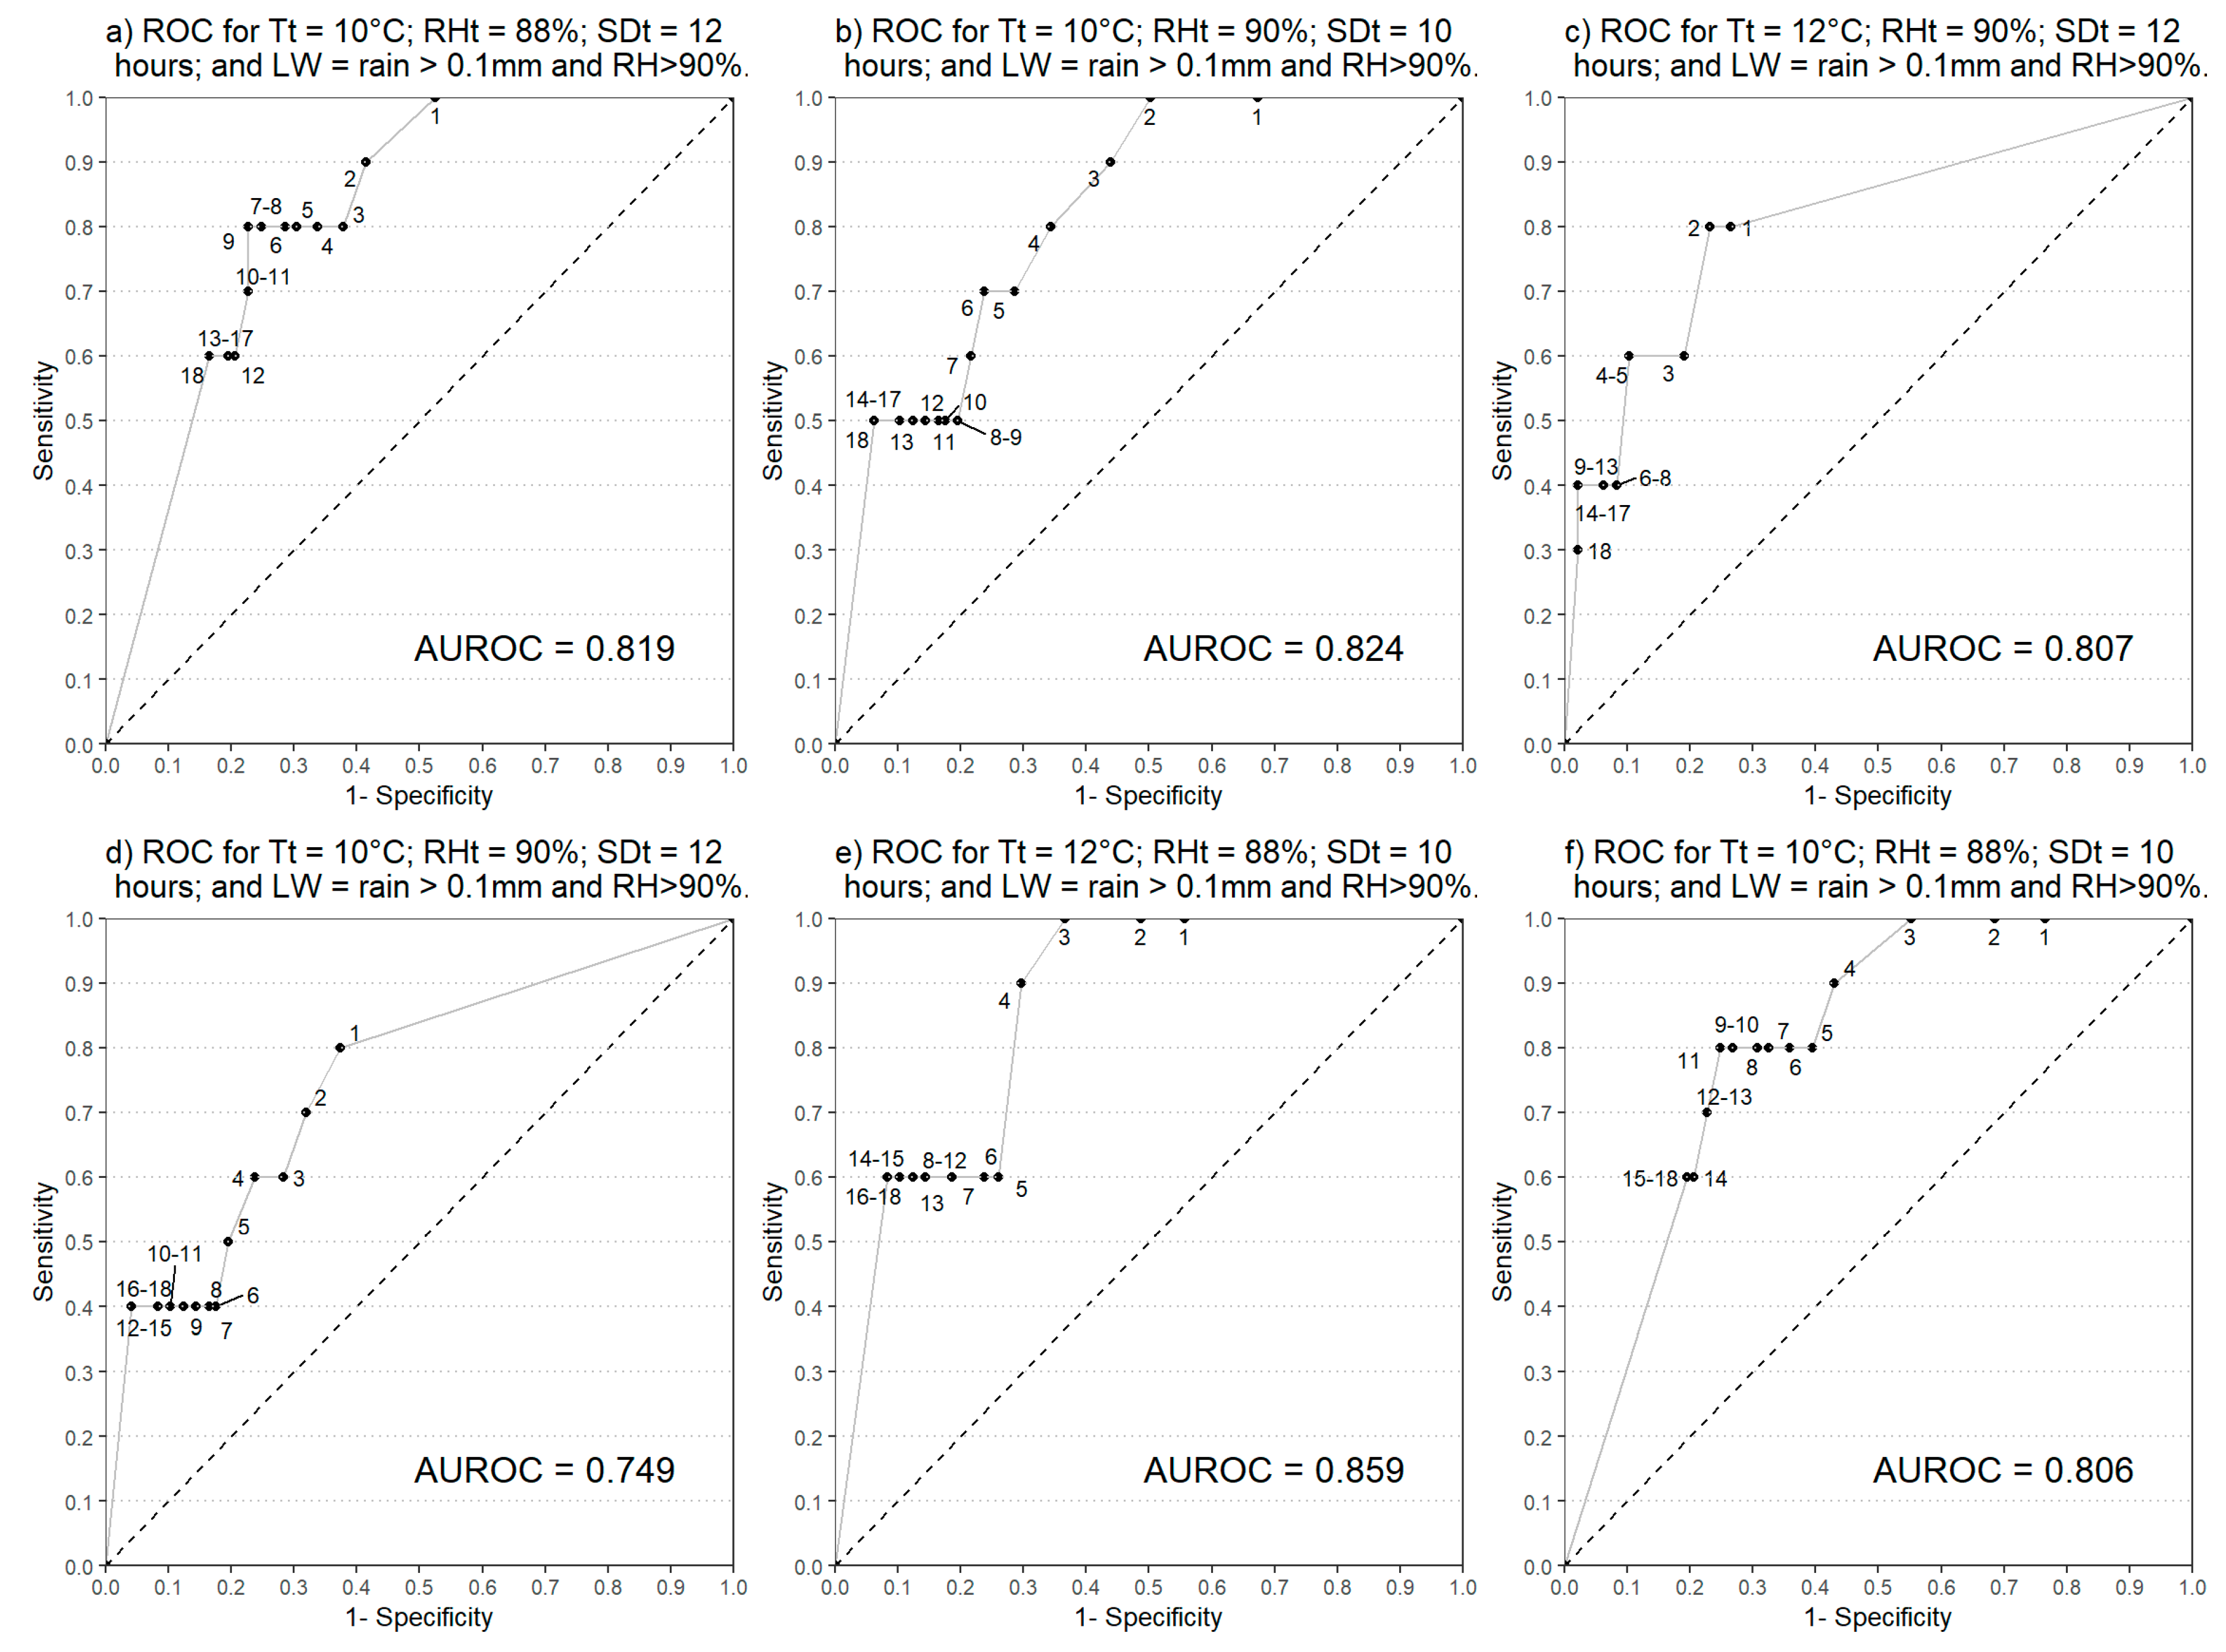
2.3.3. Receiver Operating Characteristic (ROC) Curves
2.4. Statistical Analysis
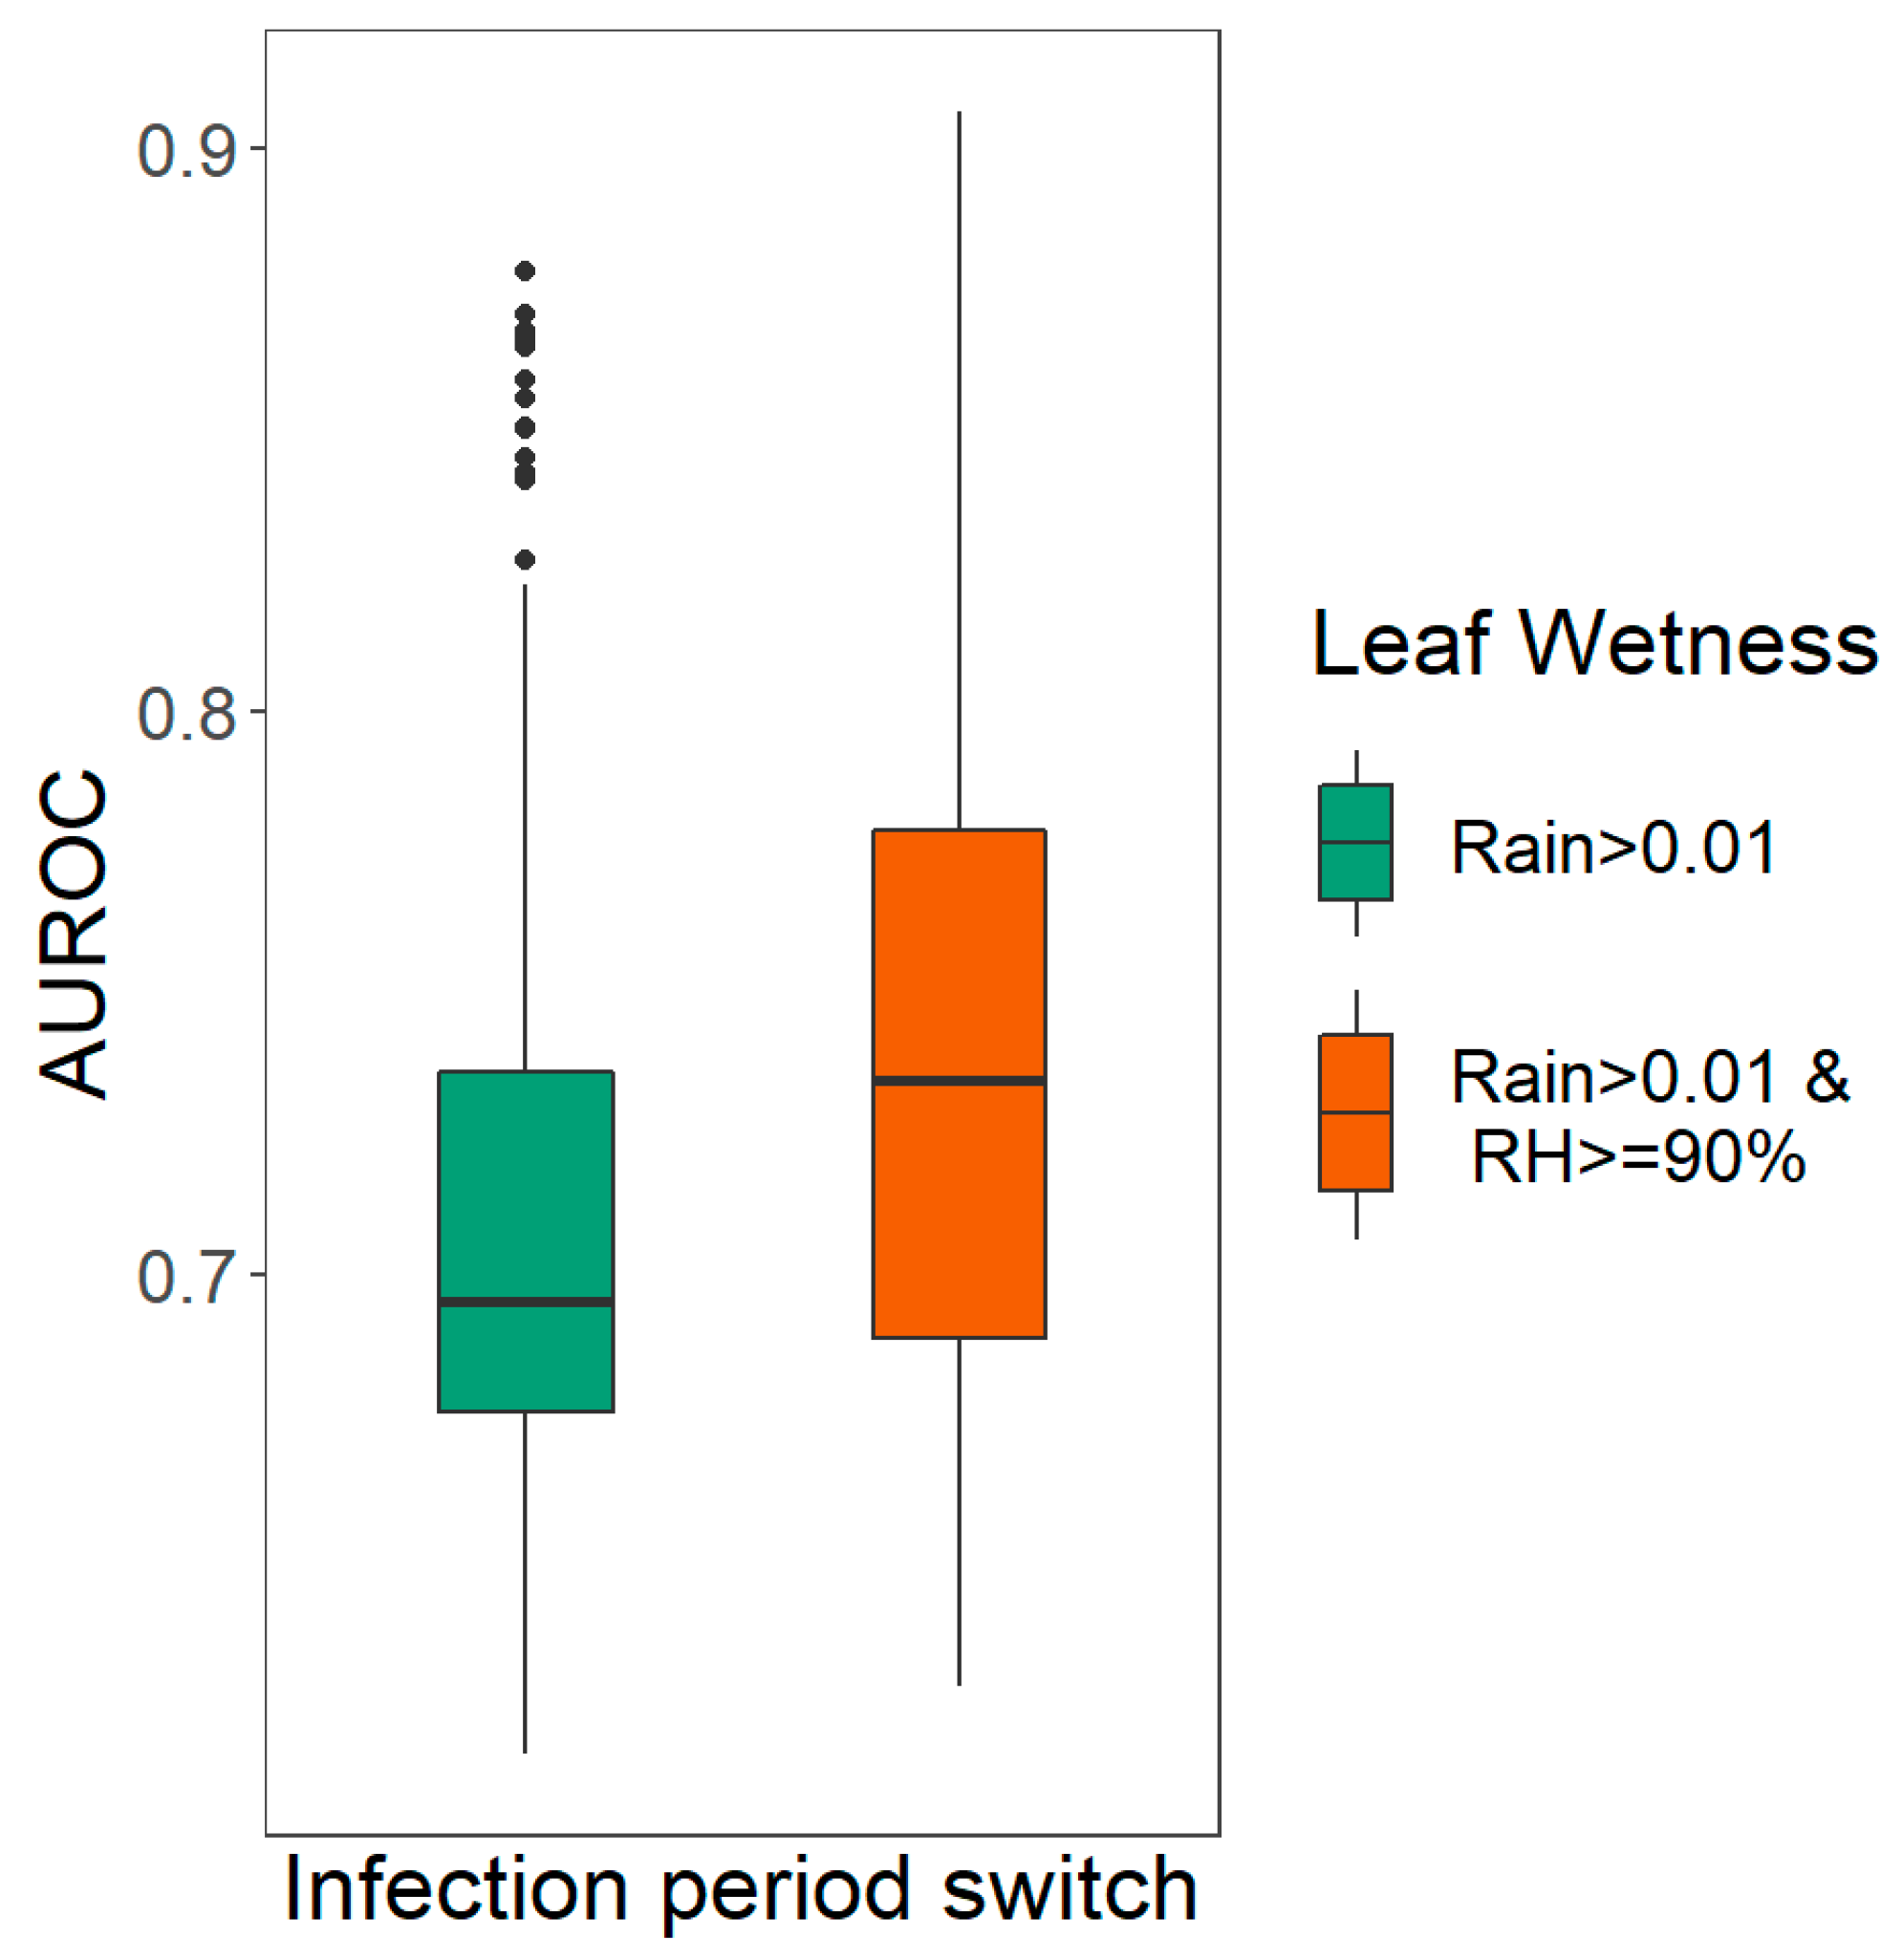
2.4.1. Evaluation of Leaf Wetness Estimation
2.4.2. Evaluation of Main Variable Thresholds
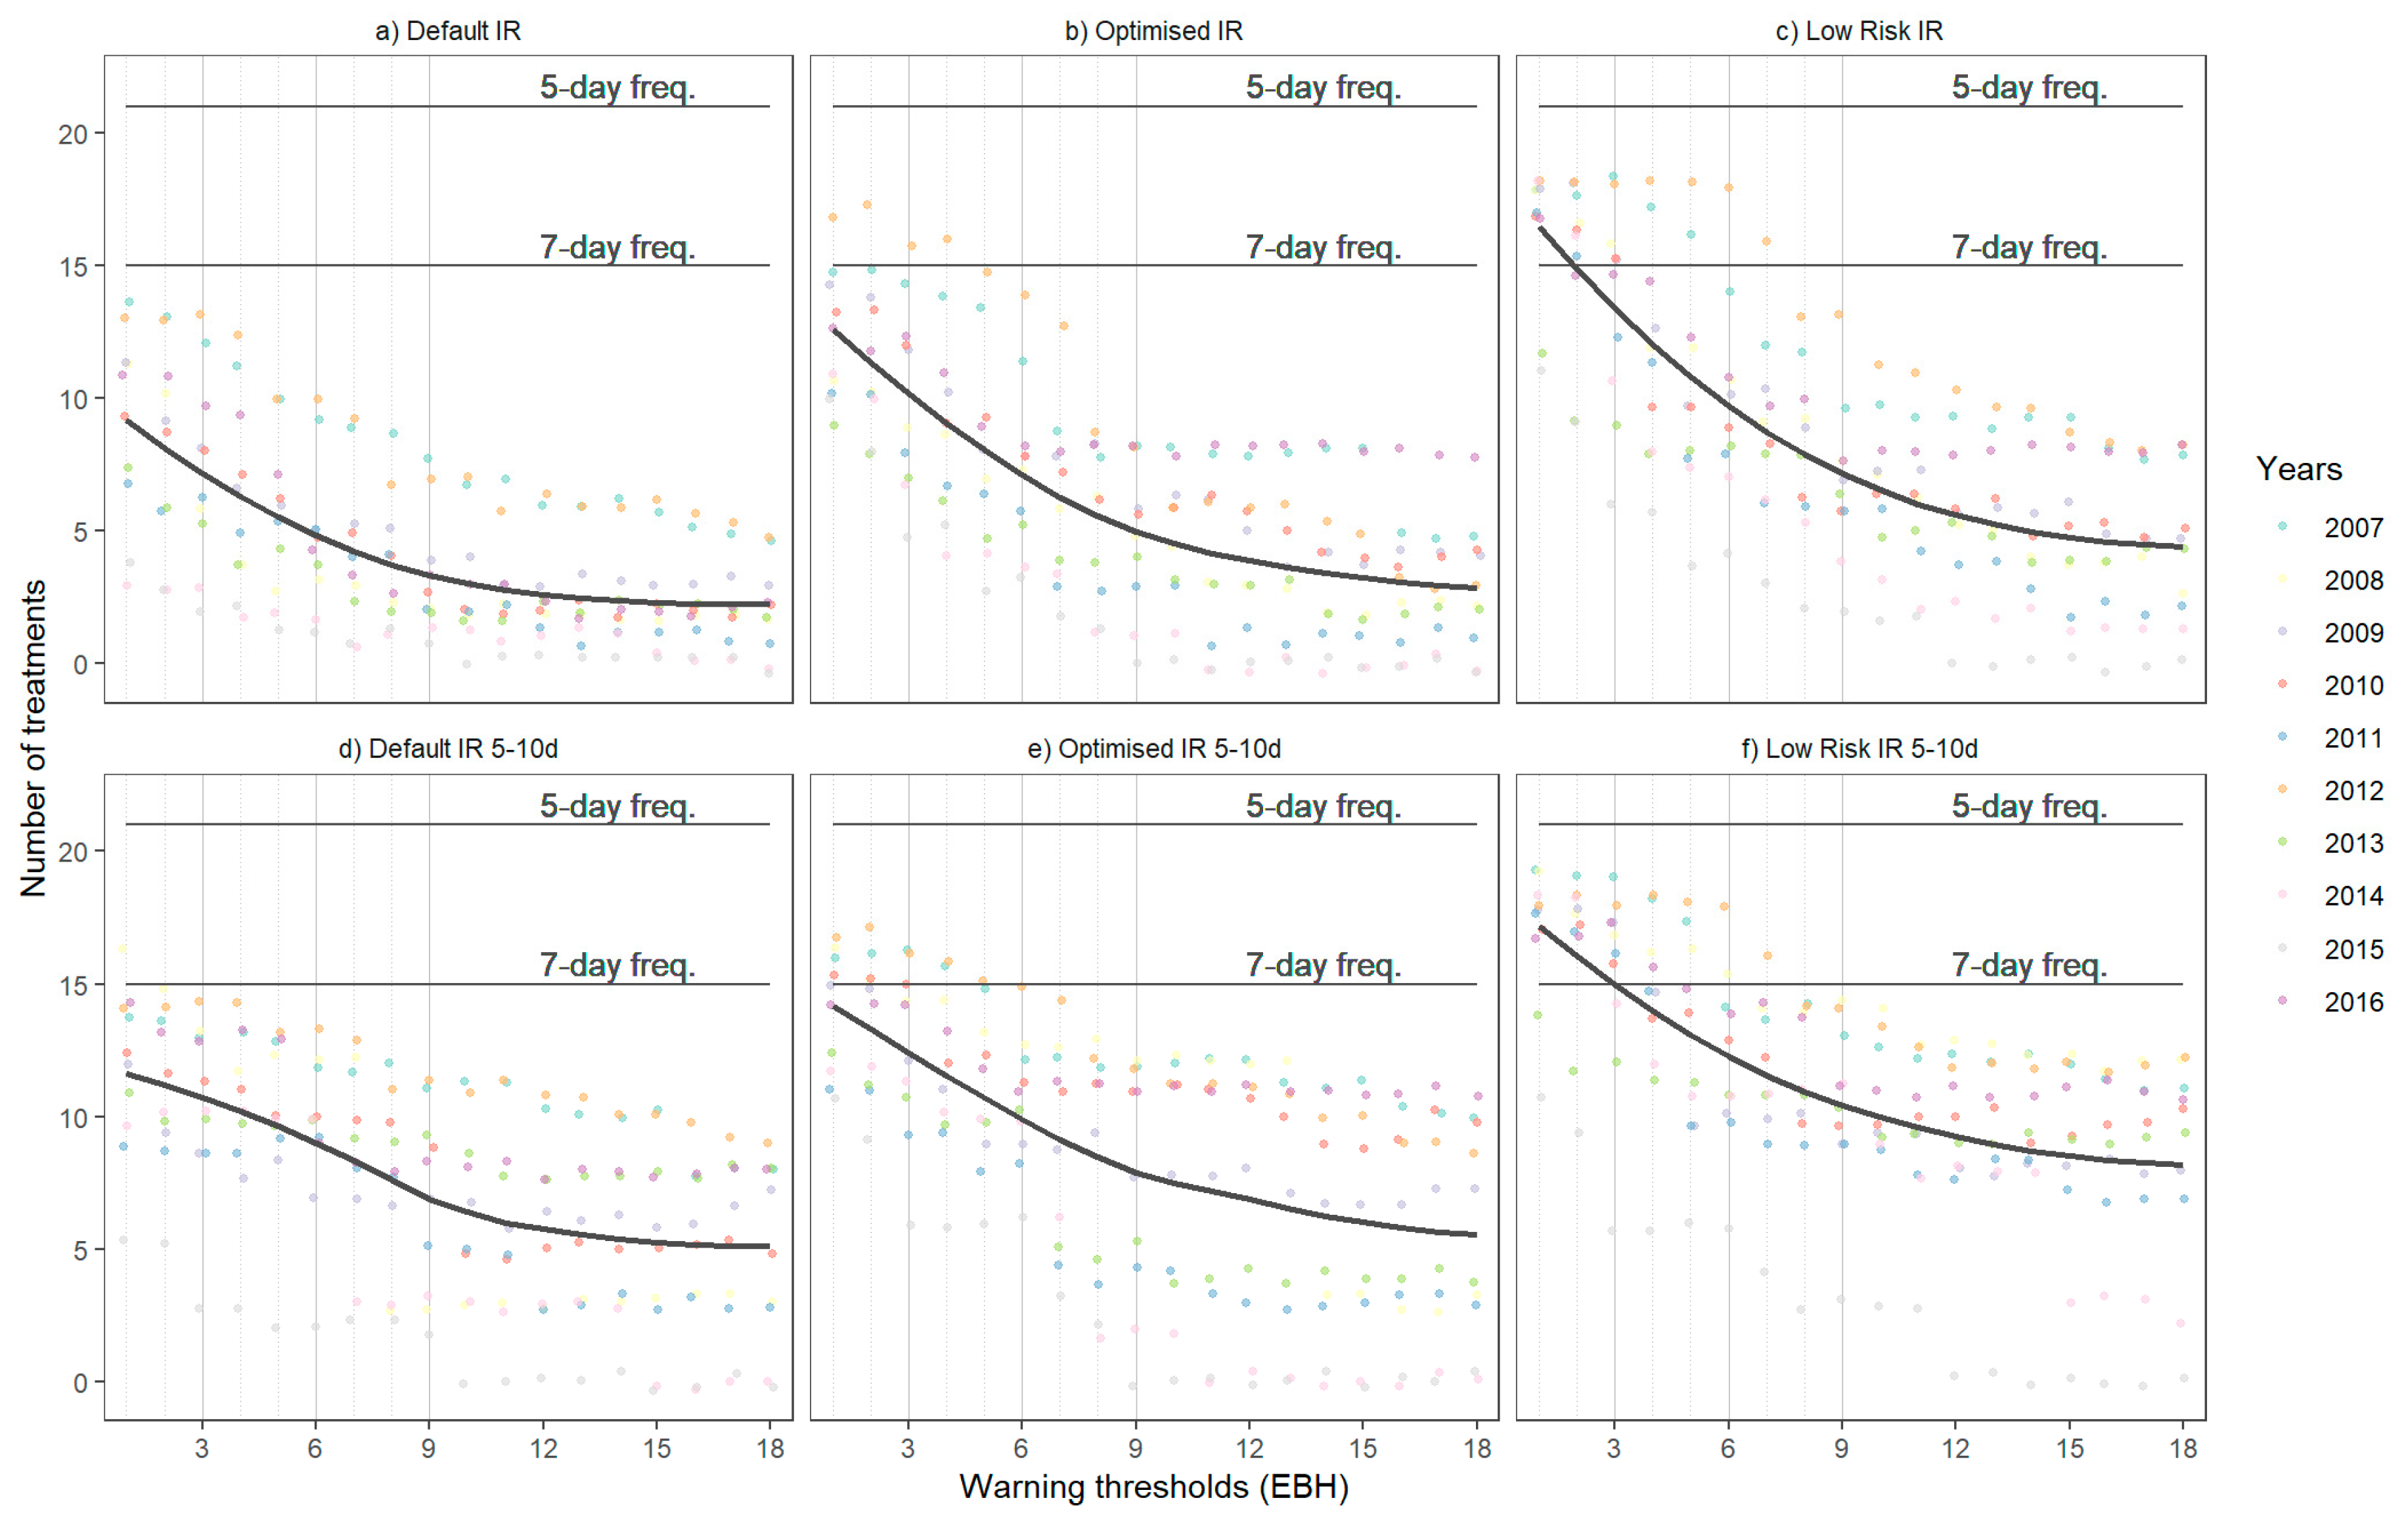
2.5. Treatment Frequency and Dose Reduction
- Reduction in the number of treatments, split into:
- Model guided: A fungicide treatment is applied every time the warning threshold is reached with a minimum period of 5 days prior to following treatment, and;
- Model and calendar guided: A minimum of 5 and maximum of 10 days between treatments.
- 2.
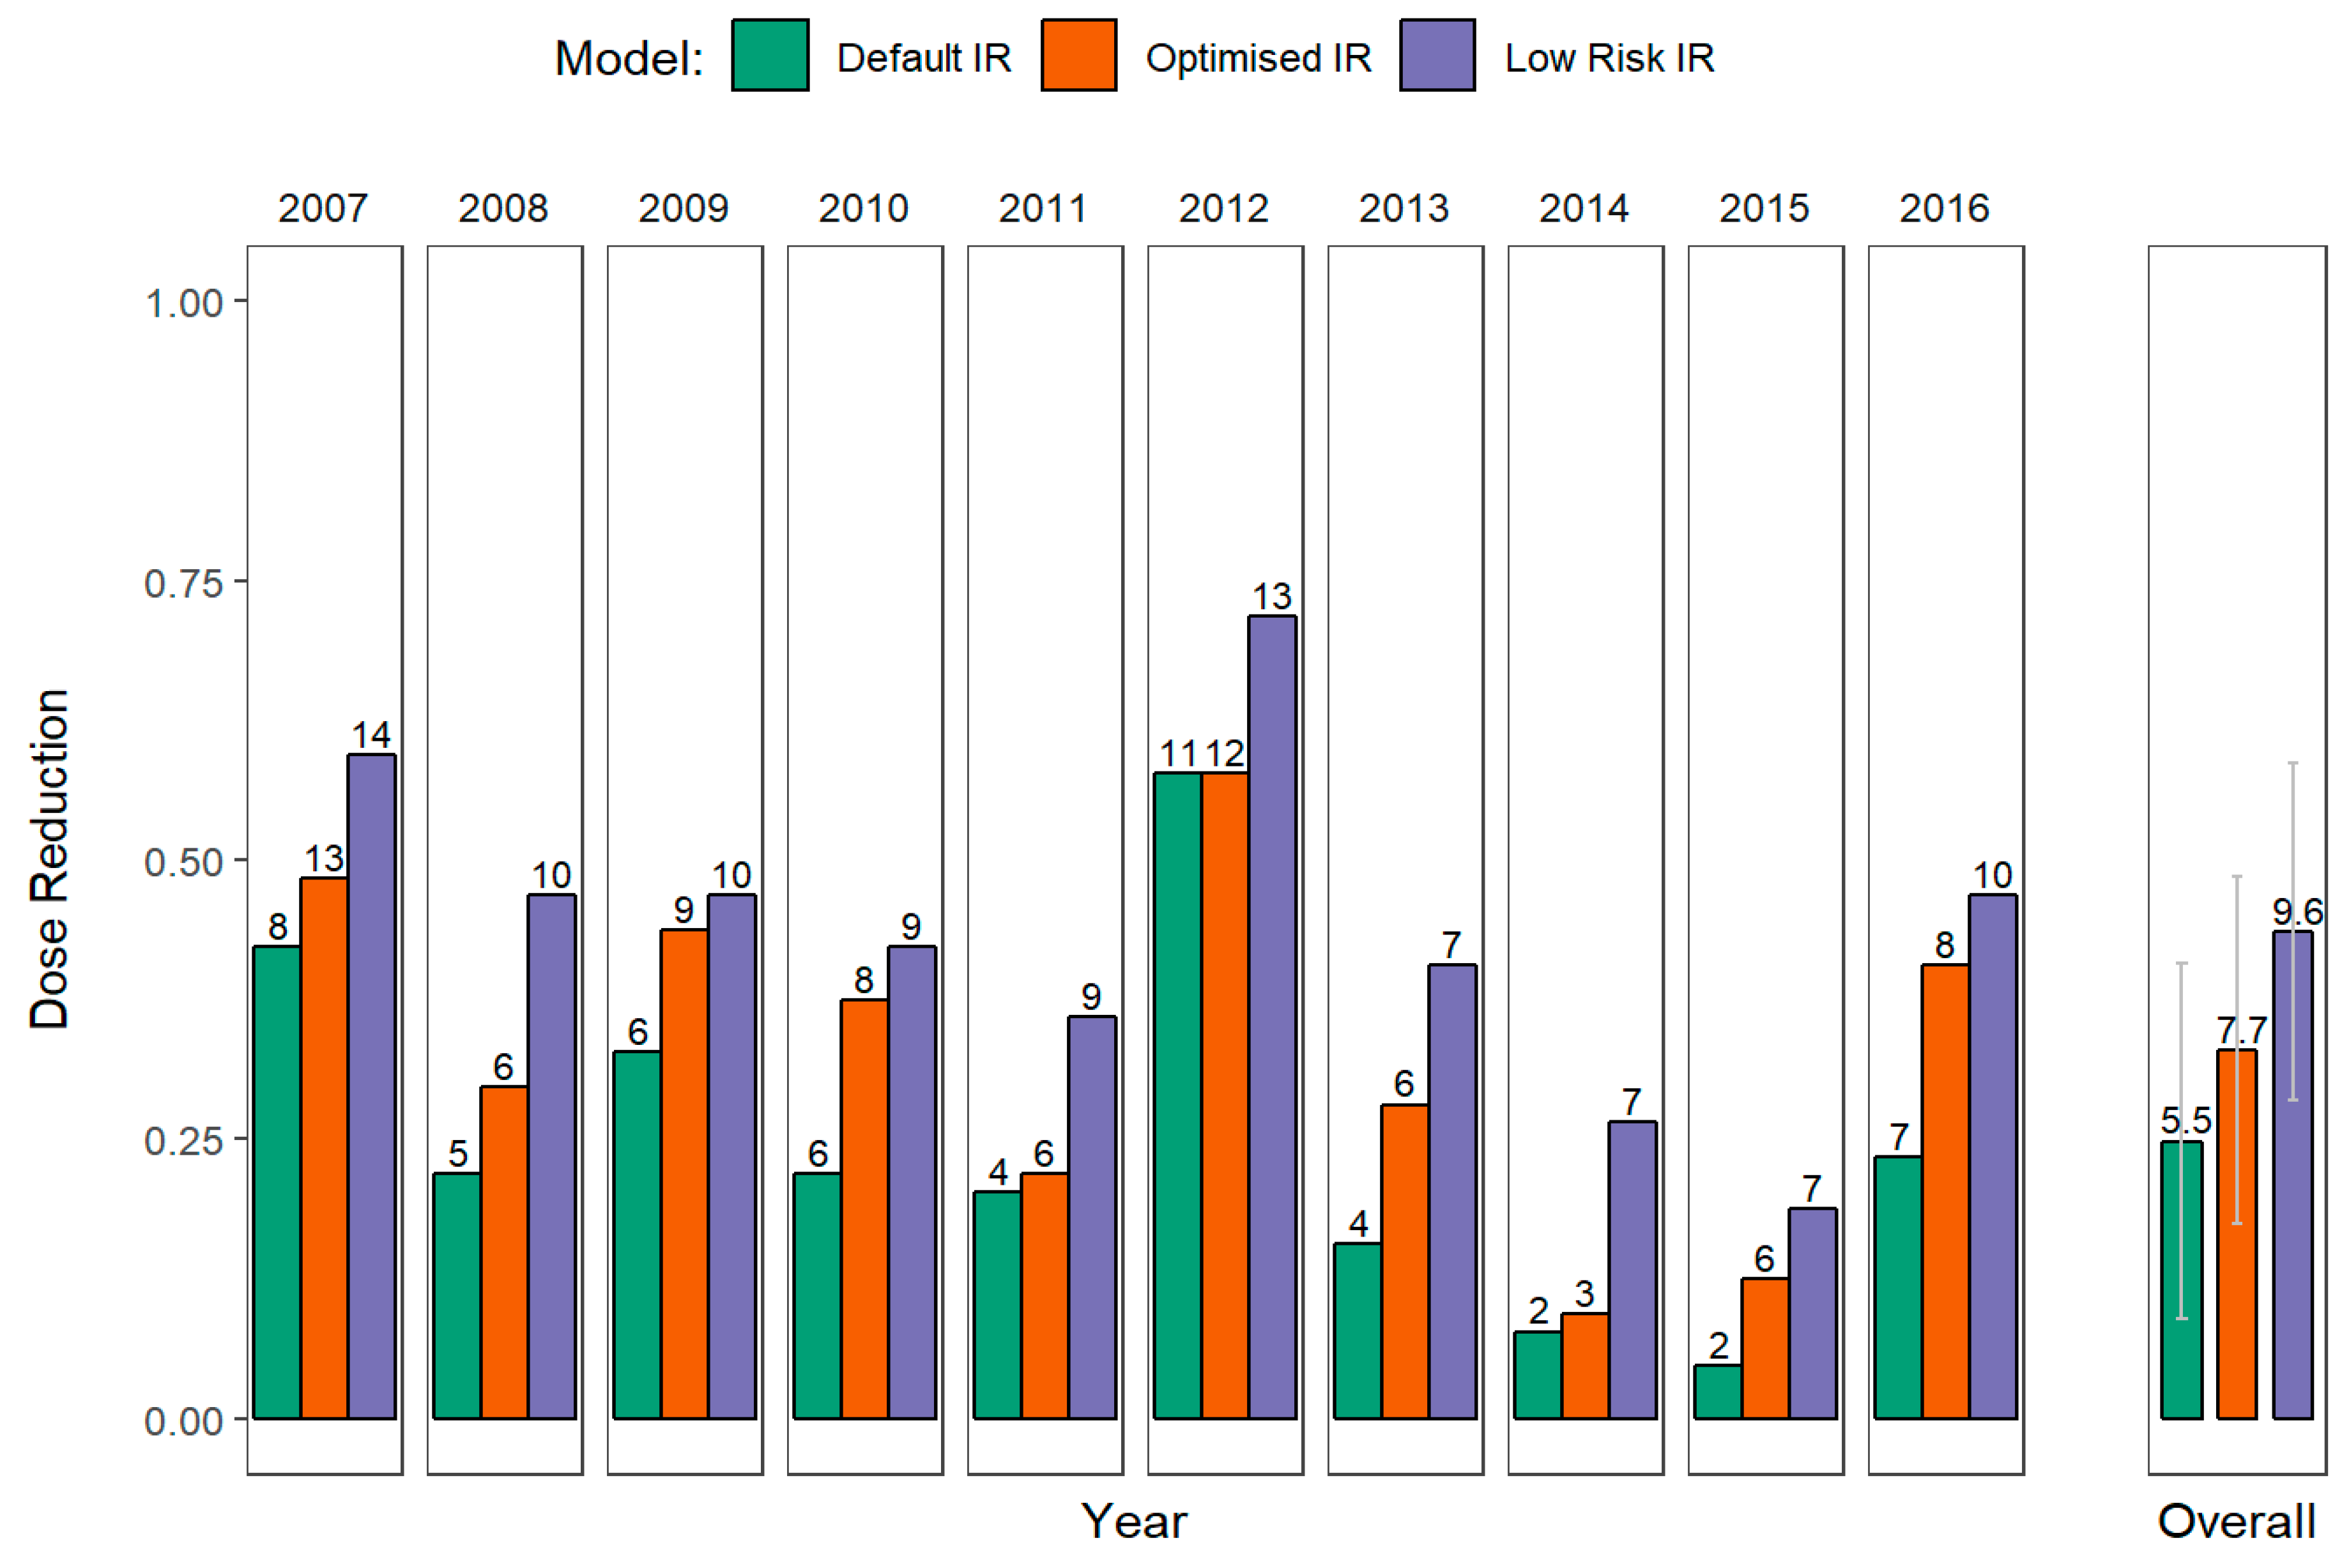
- Dose reduction based on 7-day calendar treatment. Currently, Irish growers do not rely on the operational warnings issued by the Met Éireann, but do increase the dose or use stronger, often less environmentally friendly, formulations during those periods identified as at risk. Possible dose reductions are calculated for the usual 7-day calendar treatment. The dose reductions are based on the maximum risk calculated by the model during the 7-day period between treatments. The maximum dose is applied if the risk is over 12 EBH, which is the current warning decision threshold in Ireland.
2.6. Software Used for the Analysis and the Reproducibility
3. Results
3.1. Evaluation Leaf Wetness Estimation
3.2. Evaluation of Main Variable Thresholds
3.3. Treatment Frequency and Dose Reduction
4. Discussion
5. Conclusions
Author Contributions
Funding
Acknowledgments
Conflicts of Interest
Repository
References
- De Bary, A. Researches into the nature of the potato fungus, Phytophthora infestans. J. Bot. Paris 1876, 14, 105–126. [Google Scholar]
- Mizubuti, E.S.G.; Fry, W.E. Potato late blight. In The Epidemiology of Plant Diseases; Cooke, B.M., Jones, G.D., Kaye, B., Eds.; Springer: Dordrecht, The Netherlands, 2006; pp. 445–471. ISBN 978-1-4020-4581-3. [Google Scholar]
- Hardwick, N.V. Disease forecasting. In The Epidemiology of Plant Diseases; Springer Netherlands: Dordrecht, The Netherlands, 2006; pp. 239–267. [Google Scholar]
- Bourke, A. ‘The Visitation of God’? The Potato and the Great Irish Famine; Lilliput Press, Ltd.: Dublin, Ireland, 1993. [Google Scholar]
- Haverkort, A.J.; Boonekamp, P.M.; Hutten, R.; Jacobsen, E.; Lotz, L.A.P.; Kessel, G.J.T.; Visser, R.G.F.; van der Vossen, E.A.G. Societal Costs of Late Blight in Potato and Prospects of Durable Resistance Through Cisgenic Modification. Potato Res. 2008, 51, 47–57. [Google Scholar] [CrossRef]
- Hirst, J.M.; Stedman, O.J. The Epidemiology of Phytophthora Infestans. Ann. Appl. Biol. 1960, 48, 489–517. [Google Scholar] [CrossRef]
- Harrison, J.G. Effects of the aerial environment on late blight of potato foliage–A review. Plant Pathol. 1992, 41, 384–416. [Google Scholar] [CrossRef]
- Crosier, W. Studies on the biology of Phytophthora infestans (Mont) de Bary. Cornell Univ. Agric. Exp. Stat. Mem. 1934, 155, 23–24. [Google Scholar]
- Wallin, J.R. Summary of recent progress in predicting late blight epidemics in United States and Canada. Am. Potato J. 1962, 39, 306–312. [Google Scholar] [CrossRef]
- Goodwin, S.B.; Cohen, B.A.; Fry, W.E. Panglobal distribution of a single clonal lineage of the Irish potato famine fungus. Proc. Natl. Acad. Sci. USA 1994, 91, 11591–11595. [Google Scholar] [CrossRef]
- Fry, W.E. Phytophthora infestans: New tools (and Old Ones) Lead to New Understanding and Precision Management. Annu. Rev. Phytopathol. 2016, 54, 529–547. [Google Scholar] [CrossRef]
- Mizubuti, E.S.G.; Fry, W.E. Temperature Effects on Developmental Stages of Isolates from Three Clonal Lineages of Phytophthora infestans. Phytopathology 1998, 88, 837–843. [Google Scholar] [CrossRef]
- Mizubuti, E.S.G.; Aylor, D.E.; Fry, W.E. Survival of Phytophthora infestans Sporangia Exposed to Solar Radiation. Phytopathology 2000, 90, 78–84. [Google Scholar] [CrossRef]
- Fry, W. Phytophthora infestans: The plant (and R gene) destroyer. Mol. Plant Pathol. 2008, 9, 385–402. [Google Scholar] [CrossRef] [PubMed]
- Mariette, N.; Androdias, A.; Mabon, R.; Corbière, R.; Marquer, B.; Montarry, J.; Andrivon, D. Local adaptation to temperature in populations and clonal lineages of the Irish potato famine pathogen Phytophthora infestans. Ecol. Evol. 2016, 6, 6320–6331. [Google Scholar] [CrossRef] [PubMed]
- Haverkort, A.J.; Boonekamp, P.M.; Hutten, R.; Jacobsen, E.; Lotz, L.A.P.; Kessel, G.J.T.; Vossen, J.H.; Visser, R.G.F. Durable Late Blight Resistance in Potato Through Dynamic Varieties Obtained by Cisgenesis: Scientific and Societal Advances in the DuRPh Project. Potato Res. 2016, 59, 35–66. [Google Scholar] [CrossRef]
- Li, Y.; van der Lee, T.A.J.; Evenhuis, A.; van den Bosch, G.B.M.; van Bekkum, P.J.; Förch, M.G.; van Gent-Pelzer, M.P.E.; van Raaij, H.M.G.; Jacobsen, E.; Huang, S.W.; et al. Population Dynamics of Phytophthora infestans in the Netherlands Reveals Expansion and Spread of Dominant Clonal Lineages and Virulence in Sexual Offspring. G3 (Bethesda) 2012, 2, 1529–1540. [Google Scholar] [CrossRef] [PubMed]
- Cooke, L.R.; Carlisle, D.J.; Donaghy, C.; Quinn, M.; Perez, F.M.; Deahl, K.L. The Northern Ireland Phytophthora infestans population 1998–2002 characterized by genotypic and phenotypic markers. Plant Pathol. 2006, 55, 320–330. [Google Scholar] [CrossRef]
- Griffin, D.; O’Sullivan, E.; Harmey, M.A.; Dowley, L.J. DNA fingerprinting, metalaxyl resistance and mating type determination of thePhytophthora infestans population in the Republic of Ireland. Potato Res. 2002, 45, 25–36. [Google Scholar] [CrossRef]
- Kildea, S.; Cooke, L.; Quinn, L.; Little, G.; Armstrong, C.; Hutton, F.; Dowley, L.; Griffin, D.; Schepers, H. Changes within the Irish potato late blight population. In Proceedings of the Twelfth EuroBlight Workshop; Praktijkonderzoek Plant & Omgeving, PPO: Lelystad, The Netherlands, 2010; pp. 147–150. [Google Scholar]
- Cooke, L.R. The potato blight population in Northern Ireland. PPO Spec. Rep. 2015, 17, 31–44. [Google Scholar]
- Stellingwerf, J.S.; Phelan, S.; Doohan, F.M.; Griffin, D.; Bourke, A.; Hutten, R.C.B.; Cooke, D.E.L.; Kildea, S.; Mullins, E. Evidence for selection pressure from resistant potato genotypes but not from fungicide application within a clonal Phytophthora infestans population. Plant Pathol. 2018, 67, 1528–1538. [Google Scholar] [CrossRef]
- Anonymous. Trends & Challenges in Irish Potato Production; The Irish Farmers’Association: Dublin, Ireland, 2011. [Google Scholar]
- Haverkort, A.J.; Verhagen, A. Climate Change and Its Repercussions for the Potato Supply Chain. Potato Res. 2008, 51, 223. [Google Scholar] [CrossRef]
- Baker, K.M.; Kirk, W.W.; Stein, J.M.; Andresen, J.A. Climatic Trends and Potato Late Blight Risk in the Upper Great Lakes Region. HortTechnology 2005, 15, 510–518. [Google Scholar] [CrossRef]
- Chowdappa, P.; Kumar, B.J.N.; Madhura, S.; Kumar, S.P.M.; Myers, K.L.; Fry, W.E.; Cooke, D.E.L. Severe outbreaks of late blight on potato and tomato in South India caused by recent changes in the Phytophthora infestans population. Plant Pathol. 2015, 64, 191–199. [Google Scholar] [CrossRef]
- Dowley, L.J.; Grant, J.; Griffin, D. Yield Losses Caused by Late Blight (Phytophthora infestans (Mont.) de Bary) in Potato Crops in Ireland. Ir. J. Agric. Food Res. 2008, 47, 69–78. [Google Scholar]
- Cooke, L.R.; Schepers, H.T.A.M.; Hermansen, A.; Bain, R.A.; Bradshaw, N.J.; Ritchie, F.; Shaw, D.S.; Evenhuis, A.; Kessel, G.J.T.; Wander, J.G.N.; et al. Epidemiology and Integrated Control of Potato Late Blight in Europe. Potato Res. 2011, 54, 183–222. [Google Scholar] [CrossRef]
- Bourke, P.M.A. Use of Weather Information in the Prediction of Plant Disease Epiphytotics. Annu. Rev. Phytopathol. 1970, 8, 345–370. [Google Scholar] [CrossRef]
- Fry, W.E. Principles of Plant Disease Management; Academic Press: Cambridge, MA, USA, 1982; ISBN 978-0-08-091830-3. [Google Scholar]
- Shtienberg, D. Will Decision-Support Systems Be Widely Used for the Management of Plant Diseases? Annu. Rev. Phytopathol. 2013, 51, 1–16. [Google Scholar] [CrossRef] [PubMed]
- Rossi, V.; Caffi, T.; Salinari, F. Helping farmers face the increasing complexity of decision-making for crop protection. Phytopathol. Mediterr. 2012, 51, 457–479. [Google Scholar]
- Kessel, G.J.T.; Mullins, E.; Evenhuis, A.; Stellingwerf, J.; Cortes, V.O.; Phelan, S.; van den Bosch, T.; Förch, M.G.; Goedhart, P.; van der Voet, H.; et al. Development and validation of IPM strategies for the cultivation of cisgenically modified late blight resistant potato. Eur. J. Agron. 2018, 96, 146–155. [Google Scholar] [CrossRef]
- Madden, L.V.; Ellis, M.A. How to develop plant disease forecasters. In Experimental Techniques in Plant Disease Epidemiology; Kranz, J., Rotem, J., Eds.; Springer Science & Business Media: Berlin/Heidelberg, Germany, 1988. [Google Scholar]
- Pavan, W.; Fraisse, C.W.; Peres, N.A. Development of a web-based disease forecasting system for strawberries. Comput. Electron. Agric. 2011, 75, 169–175. [Google Scholar] [CrossRef]
- Van Everdingen, E. Het verband tusschen de weersgesteldheid en de aardappelziekte (Phytophthora infestans). Tijdschr. Plantenziekten 1926, 32, 129–139. [Google Scholar] [CrossRef]
- Smith, L.P. Potato Blight Forecasting by 90 Per Cent Humidity Criteria. Plant Pathol. 1956, 5, 83–87. [Google Scholar] [CrossRef]
- Baldacci, E. Epifitie diPlasmopara viticola (1941–46) nell’Oltrepo Pavese ed adozione del calendario di incubazione come strumento di lotta.[Epidemics ofPlasmopara viticola (1941–46) in the Pavia area of the Po valley and the adoption of an incubation calendar as a means of control]. Atti Ist. bot. Univ. Pavia Ser. 1947, 5, 2. [Google Scholar]
- Bourke, A. Potato Blight and the Weather: A Fresh Approach; Irish Meteorological Service: Dublin, Ireland, 1953. [Google Scholar]
- Beaumont, A. The dependence on the weather of the dates of outbreak of potato blight epidemics. Trans. Br. Mycol. Soc. 1947, 31, 45–53. [Google Scholar] [CrossRef]
- Bourke, A. Potato Blight and the Weather in Ireland in 1953; Irish Meteorological Service: Dublin, Ireland, 1953. [Google Scholar]
- Madden, L.V.; Hughes, G.; Van Den Bosch, F. The Study of Plant Disease Epidemics; American Phytopathological Society: St. Paul, MN, USA, 2007; ISBN 0-89054-354-2. [Google Scholar]
- Frost, M.C. Potatoes, Phytophthora infestans, and the weather. Ann. Appl. Biol. 1976, 84, 271–272. [Google Scholar] [CrossRef]
- Keane, T. Weather and Potato Blight; Irish Meteorological Service: Dublin, Ireland, 1982. [Google Scholar]
- Hansen, J.G. NEGFRY—A system for scheduling chemical control of late blight in potatoes. In Proceedings of the Phytophthora 150 Sesquicentennial Scientific Conference; Boole Press Ltd.: Dublin, Ireland, 1995; pp. 201–208. [Google Scholar]
- Dowley, L.J.; Burke, J.J. Field validation of four decision support systems for the control of late blight of potatoes in Ireland. Potato Res. 2004, 47, 151–162. [Google Scholar] [CrossRef]
- Hansen, J.G. Integration of pathogen and host resistance information in existing DSSs—Introducing the IPMBlight2.0 approach. In Proceedings of the Sixteenth Euroblight Workshop, Aarhus, Denmark, 14–17 May 2017; pp. 147–158. [Google Scholar]
- Gent, D.H.; Mahaffee, W.F.; McRoberts, N.; Pfender, W.F. The Use and Role of Predictive Systems in Disease Management. Annu. Rev. Phytopathol. 2013, 51, 267–289. [Google Scholar] [CrossRef] [PubMed]
- Magarey, R.D.; Isard, S.A. A Troubleshooting Guide for Mechanistic Plant Pest Forecast Models. J. Integr. Pest Manag. 2017, 8, 1–7. [Google Scholar] [CrossRef][Green Version]
- Gleason, M.L.; Duttweiler, K.B.; Batzer, J.C.; Taylor, S.E.; Sentelhas, P.C.; Monteiro, J.E.B.A.; Gillespie, T.J. Obtaining weather data for input to crop disease-warning systems: Leaf wetness duration as a case study. Sci. Agric. 2008, 65, 76–87. [Google Scholar] [CrossRef]
- Magarey, R.D.; Travis, J.W.; Russo, J.M.; Seem, R.C.; Magarey, P.A. Decision Support Systems: Quenching the Thirst. Plant Dis. 2002, 86, 4–14. [Google Scholar] [CrossRef]
- Forsythe, G.E.; Malcolm, M.A.; Moler, C.B. Computer Methods for Mathematical Computations; Prentice-Hall: Englewood Cliffs, NJ, USA, 1977. [Google Scholar]
- Shah, D.A.; Molineros, J.E.; Paul, P.A.; Willyerd, K.; Madden, L.V.; Wolf, E.D.D. Predicting fusarium head blight epidemics with weather-driven pre- and post-anthesis logistic regression models. Phytopathology 2013, 103, 906–919. [Google Scholar] [CrossRef]
- Taylor, M.C.; Hardwick, N.V.; Bradshaw, N.J.; Hall, A.M. Relative performance of five forecasting schemes for potato late blight (Phytophthora infestans) I. Accuracy of infection warnings and reduction of unnecessary, theoretical, fungicide applications. Crop Prot. 2003, 22, 275–283. [Google Scholar] [CrossRef]
- Bleiholder, H.; Weber, E.; Lancashire, P.; Feller, C.; Buhr, L.; Hess, M.; Wicke, H.; Hack, H.; Meier, U.; Klose, R. Growth Stages of Mono-and Dicotyledonous Plants, BBCH Monograph; Federal Biological Research Centre for Agriculture and Forestry: Berlin/Braunschweig, Germany, 2001; p. 158. [Google Scholar]
- Skelsey, P.; Dancey, S.R.; Preedy, K.; Lees, A.K.; Cooke, D.E.L. Forecasting the spread of aerially transmitted crop diseases with a binary classifier for inoculum survival. Plant Pathol. 2018, 67, 920–928. [Google Scholar] [CrossRef]
- Yuen, J.E.; Hughes, G. Bayesian analysis of plant disease prediction. Plant Pathol. 2002, 51, 407–412. [Google Scholar] [CrossRef]
- Hanley, J.A.; McNeil, B.J. The meaning and use of the area under a receiver operating characteristic (ROC) curve. Radiology 1982, 143, 29–36. [Google Scholar] [CrossRef] [PubMed]
- Rosner, B. Fundamentals of Biostatistics; Nelson Education: Toronto, ON, Canada, 2015. [Google Scholar]
- Hosmer, D.W., Jr.; Lemeshow, S.; Sturdivant, R.X. Applied Logistic Regression; John Wiley & Sons: Hoboken, NJ, USA, 2013; Volume 398. [Google Scholar]
- Rawlings, J.O.; Pantula, S.G.; Dickey, D.A. Applied Regression Analysis: A Research Tool, 2nd ed.; Springer Texts in Statistics; Springer: New York, NY, USA, 1998; ISBN 978-0-387-98454-4. [Google Scholar]
- Box, G.; Wilson, K. On the Experimental Attainment of Optimum Conditions. J. R. Stat. Soc. Ser. B 1951, 13, 1–38. [Google Scholar] [CrossRef]
- Khuri, A.I. Response Surface Methodology and Its Applications In Agricultural and Food Sciences. Biom. Biostat. Int. J. 2017, 5, 00141. [Google Scholar] [CrossRef]
- Lin, L.I.-K. A Concordance Correlation Coefficient to Evaluate Reproducibility. Biometrics 1989, 45, 255–268. [Google Scholar] [CrossRef] [PubMed]
- Large, E.C. The battle against blight. Agriculture 1959, 65, 603–608. [Google Scholar]
- Madden, L.V. Botanical Epidemiology: Some Key Advances and its Continuing Role in Disease Management. Eur. J. Plant Pathol. 2006, 115, 3–23. [Google Scholar] [CrossRef]
- R Core Team. R: A Language and Environment for Statistical Computing; R Foundation for Statistical Computing: Vienna, Austria, 2018. [Google Scholar]
- Wickham, H.; Bryan, J. readxl: Read Excel Files, R package version 0.1; 2016, p. 1. Available online: https://readxl.tidyverse.org (accessed on 5 September 2019).
- Wickham, H. tidyverse: Easily Install and Load the “Tidyverse”. 2017. Available online: https://rdrr.io/cran/tidyverse/ (accessed on 5 September 2019).
- Zeileis, A.; Grothendieck, G. zoo: S3 Infrastructure for Regular and Irregular Time Series. J. Stat. Softw. 2005, 14, 1–27. [Google Scholar] [CrossRef]
- Dowle, M.; Srinivasan, A.; Gorecki, J.; Chirico, M.; Stetsenko, P.; Short, T.; Lianoglou, S.; Antonyan, E.; Bonsch, M.; Parsonage, H.; et al. data.table: Extension of “data.frame”. 2019. Available online: https://cran.r-project.org/web/packages/data.table/data.table.pdf (accessed on 5 September 2019).
- Borchers, H.W. pracma: Practical Numerical Math Functions. 2018. Available online: https://rdrr.io/rforge/pracma/ (accessed on 5 September 2019).
- Wickham, H. ggplot2: Elegant Graphics for Data Analysis; Springer: New York, NY, USA, 2016; ISBN 978-3-319-24277-4. [Google Scholar]
- Wilke, C.O. cowplot: Streamlined Plot Theme and Plot Annotations for “ggplot2”; R package. 2018. Available online: https://rdrr.io/cran/cowplot/ (accessed on 5 September 2019).
- Slowikowski, K. ggrepel: Automatically Position Non-Overlapping Text Labels with “ggplot2”; R package version 0.8.0. 2018. Available online: https://rdrr.io/cran/ggrepel/ (accessed on 5 September 2019).
- Lenth, R.V. Response-Surface Methods in R, Using rsm. J. Stat. Softw. 2009, 32, 1–17. [Google Scholar] [CrossRef]
- Arnold, J.B.; Daroczi, G.; Werth, B.; Weitzner, B.; Kunst, J.; Auguie, B.; Rudis, B.; Wickham, H.; Talbot, J.; London, J. ggthemes: Extra Themes, Scales and Geoms for “ggplot2”. 2019. Available online: https://rdrr.io/cran/ggthemes/ (accessed on 5 September 2019).
- Moritz, S.; Bartz-Beielstein, T. imputeTS: Time Series Missing Value Imputation in R. R J. 2017, 9, 207–218. [Google Scholar] [CrossRef]
- Daróczi, G.; Tsegelskyi, R. pander: An R “Pandoc” Writer. 2018. Available online: https://cran.r-project.org/web/packages/pander/pander.pdf (accessed on 5 September 2019).
- Allaire, J.J.; Xie, Y.; McPherson, J.; Luraschi, J.; Ushey, K.; Atkins, A.; Wickham, H.; Cheng, J.; Chang, W.; Iannone, R.; et al. rmarkdown: Dynamic Documents for R. 2019. Available online: https://github.com/rstudio/rmarkdown (accessed on 5 September 2019).
- Xie, Y.; Vogt, A.; Andrew, A.; Zvoleff, A.; Simon, A.; Atkins, A.; Wolen, A.; Manton, A.; Baumer, B.; Diggs, B.; et al. knitr: A General-Purpose Package for Dynamic Report Generation in R. 2019. Available online: https://rdrr.io/cran/knitr/ (accessed on 5 September 2019).
- Müller, K. here: A Simpler Way to Find Your Files. 2017. Available online: https://CRAN.R-project.org/package=here (accessed on 5 September 2019).
- Bengtsson, H.R. utils: Various Programming Utilities. 2019. Available online: https://CRAN.R-project.org/package=R.utils (accessed on 5 September 2019).
- Ewing, M. mgsub: Safe, Multiple, Simultaneous String Substitution. 2019. Available online: https://cran.r-project.org/web/packages/mgsub/mgsub.pdf (accessed on 5 September 2019).
- Mangiafico, S. rcompanion: Functions to Support Extension Education Program Evaluation. 2019. Available online: https://cran.r-project.org/web/packages/rcompanion/ (accessed on 5 September 2019).
- Fry, W.E.; Birch, P.R.J.; Judelson, H.S.; Grünwald, N.J.; Danies, G.; Everts, K.L.; Gevens, A.J.; Gugino, B.K.; Johnson, D.A.; Johnson, S.B.; et al. Five Reasons to Consider Phytophthora infestans a Reemerging Pathogen. Phytopathology 2015, 105, 966–981. [Google Scholar] [CrossRef] [PubMed]
- Yuen, J.; Mila, A. Landscape-scale disease risk quantification and prediction. Annu. Rev. Phytopathol. 2015, 53, 471–484. [Google Scholar] [CrossRef] [PubMed]
- Hartill, W.F.T.; Young, K.; Allan, D.J.; Henshall, W.R. Effects of temperature and leaf wetness on the potato late blight. N. Z. J. Crop Hortic. Sci. 1990, 18, 181–184. [Google Scholar] [CrossRef]
- Cooke, L.R. Current problems in the chemical control of late blight: The Northern Ireland experience. Phytophthora 1991, 337–348. [Google Scholar]
- Grainger, J. Scientific Proportion and Economic Decisions for Farmers. Annu. Rev. Phytopathol. 1979, 17, 223–252. [Google Scholar] [CrossRef]
- Winstel, K. Kraut-und Knollenfaule der kartoffel eine neue Prognosemoeglichkeit-sowie Beckaemptungsusutrategien. Meded.-Fac. Landbouwwet. Univ. Gent 1993, 58, 1477. [Google Scholar]
- Førsund, E. Late Blight Forecasting in Norway 1957–19801. EPPO Bull. 1983, 13, 255–258. [Google Scholar] [CrossRef]
- Schrödter, H.; Ullrich, J. Eine mathematisch-statistische lösung des problems der prognose von epidemien mit hilfe meteorologischer parameter, dargestellt am beispiel der kartoffelkrautfäule (Phytophtora infestans). Agric. Meteorol. 1967, 4, 119–135. [Google Scholar] [CrossRef]
- Grünwald, N.J.; Montes, G.R.; Saldaña, H.L.; Covarrubias, O.A.R.; Fry, W.E. Potato Late Blight Management in the Toluca Valley: Field Validation of SimCast Modified for Cultivars with High Field Resistance. Plant Dis. 2002, 86, 1163–1168. [Google Scholar] [CrossRef]
- Hermansen, A.; Amundsen, T. Evaluation of Old Potato Late Blight Forecasting Rules During 1994–1999 in Fields with the New Phytophthora infestans Population in Norway. Acta Agric. Scand. Sect. B Soil Plant Sci. 2003, 53, 118–128. [Google Scholar] [CrossRef]
- Lehsten, V.; Wiik, L.; Hannukkala, A.; Andreasson, E.; Chen, D.; Ou, T.; Liljeroth, E.; Lankinen, Å.; Grenville-Briggs, L. Earlier occurrence and increased explanatory power of climate for the first incidence of potato late blight caused by Phytophthora infestans in Fennoscandia. PLoS ONE 2017, 12, e0177580. [Google Scholar] [CrossRef] [PubMed]
- Gent, D.H.; De Wolf, E.; Pethybridge, S.J. Perceptions of Risk, Risk Aversion, and Barriers to Adoption of Decision Support Systems and Integrated Pest Management: An Introduction. Phytopathology 2010, 101, 640–643. [Google Scholar] [CrossRef] [PubMed]
- Magarey, R.D.; Seem, R.C.; Weiss, A.; Gillespie, T.; Huber, L. Estimating Surface Wetness on Plants. Agron. Hortic. Fac. Publ. 2005. Available online: https://digitalcommons.unl.edu/cgi/viewcontent.cgi?referer=https://www.google.com.hk/&httpsredir=1&article=1696&context=agronomyfacpub (accessed on 5 September 2019).
- Rowlandson, T.; Gleason, M.; Sentelhas, P.; Gillespie, T.; Thomas, C.; Hornbuckle, B. Reconsidering Leaf Wetness Duration Determination for Plant Disease Management. Plant Dis. 2014, 99, 310–319. [Google Scholar] [CrossRef] [PubMed]
- Sentelhas, P.C.; Dalla Marta, A.; Orlandini, S.; Santos, E.A.; Gillespie, T.J.; Gleason, M.L. Suitability of relative humidity as an estimator of leaf wetness duration. Agric. For. Meteorol. 2008, 148, 392–400. [Google Scholar] [CrossRef]
- Monteith, J.; Unsworth, M. Principles of Environmental Physics; Academic Press: Cambridge, MA, USA, 2007; ISBN 0-08-092479-4. [Google Scholar]
- Beruski, G.C.; Gleason, M.L.; Sentelhas, P.C.; Pereira, A.B. Leaf wetness duration estimation and its influence on a soybean rust warning system. Australas. Plant Pathol. 2019, 48, 395–408. [Google Scholar] [CrossRef]
- Gleason, M.L. Development and Validation of an Empirical Model to Estimate the Duration of Dew Periods. Plant Dis. 1994, 78, 1011–1016. [Google Scholar] [CrossRef]
- Doster, M.A.; Fry, W.E. Evaluation by computer simulation of strategies to time metalaxyl applications for improved control of potato late blight. Crop Prot. 1991, 10, 209–214. [Google Scholar] [CrossRef]
- Harrison, J.G. Factors involved in the development of potato late blight disease (Phytophthora infestans). In Potato Ecology and Modelling of Crops Under Conditions Limiting Growth; Springer: Dordrecht, The Netherlands, 1995; pp. 215–236. [Google Scholar]
- Kamoun, S.; Talbot, N.J.; Islam, M.T. Plant health emergencies demand open science: Tackling a cereal killer on the run. PLoS Biol. 2019, 17, e3000302. [Google Scholar] [CrossRef]
- Kamvar, Z.N.; Brooks, J.C.; Grünwald, N.J. Novel R tools for analysis of genome-wide population genetic data with emphasis on clonality. Front. Genet. 2015, 6, 208. [Google Scholar] [CrossRef] [PubMed]
- Sparks, A.H.; Forbes, G.A.; Hijmans, R.J.; Garrett, K.A. Climate change may have limited effect on global risk of potato late blight. Glob. Chang. Biol. 2014, 20, 3621–3631. [Google Scholar] [CrossRef] [PubMed]
- Kamilaris, A.; Kartakoullis, A.; Prenafeta-Boldú, F.X. A review on the practice of big data analysis in agriculture. Comput. Electron. Agric. 2017, 143, 23–37. [Google Scholar] [CrossRef]


| Abbreviations | Full Form |
|---|---|
| IPM | Integrated Pest Management |
| DSS | Decision Support System |
| PLB | Potato late blight |
| IR | Irish Rules |
| RHt | Relative humidity threshold |
| Tt | Temperature threshold |
| SDt | Sporulation duration threshold |
| LWt | Leaf wetness threshold |
| EBH | Effective blight hours |
| ROC | Receiver operating characteristic |
| AUROC | Area under the ROC curve |
| FP | False positive |
| TP | True positive |
| FN | False negative |
| TN | True negative |
| Range | Relative Humidity (%) (RHt) | Temperature (℃) (Tt) | Sporulation Duration (hours) (SDt) |
|---|---|---|---|
| +3 | 93 | 13 | 15 |
| +2 | 92 | 12 | 14 |
| +1 | 91 | 11 | 13 |
| Existing | 90 | 10 | 12 |
| −1 | 89 | 9 | 11 |
| −2 | 88 | 8 | 10 |
| −3 | 87 | 7 | 9 |
| Disease Forecast | Disease Observed | |
|---|---|---|
| Yes | No | |
| Yes | TP Warning period | FP No infection period |
| No | FN Warning period | TN No infection period |
| Measures of the performance | Sensitivity TP/(TP + FN) | Specificity TN/(TN + FP) |
| Order | No. of Parameters | Degrees of Freedom | R2 | Adj. R2 | F Statistic | p Value | Shapiro -Wilk Test | Shapiro – Wilk p-Value |
|---|---|---|---|---|---|---|---|---|
| 1 | 4 | 339 | 0.637 | 0.634 | 198.68 | <0.001 | 0.993 | 0.137 |
| 2 | 10 | 333 | 0.758 | 0.751 | 115.98 | <0.001 | 0.997 | 0.813 |
| 3 | 20 | 323 | 0.861 | 0.853 | 105.89 | <0.001 | 0.996 | 0.610 |
| 4 | 35 | 308 | 0.881 | 0.868 | 67.12 | <0.001 | 0.990 | 0.030 |
© 2019 by the authors. Licensee MDPI, Basel, Switzerland. This article is an open access article distributed under the terms and conditions of the Creative Commons Attribution (CC BY) license (http://creativecommons.org/licenses/by/4.0/).
Share and Cite
Cucak, M.; Sparks, A.; Moral, R.d.A.; Kildea, S.; Lambkin, K.; Fealy, R. Evaluation of the ‘Irish Rules’: The Potato Late Blight Forecasting Model and Its Operational Use in the Republic of Ireland. Agronomy 2019, 9, 515. https://doi.org/10.3390/agronomy9090515
Cucak M, Sparks A, Moral RdA, Kildea S, Lambkin K, Fealy R. Evaluation of the ‘Irish Rules’: The Potato Late Blight Forecasting Model and Its Operational Use in the Republic of Ireland. Agronomy. 2019; 9(9):515. https://doi.org/10.3390/agronomy9090515
Chicago/Turabian StyleCucak, Mladen, Adam Sparks, Rafael de Andrade Moral, Stephen Kildea, Keith Lambkin, and Rowan Fealy. 2019. "Evaluation of the ‘Irish Rules’: The Potato Late Blight Forecasting Model and Its Operational Use in the Republic of Ireland" Agronomy 9, no. 9: 515. https://doi.org/10.3390/agronomy9090515
APA StyleCucak, M., Sparks, A., Moral, R. d. A., Kildea, S., Lambkin, K., & Fealy, R. (2019). Evaluation of the ‘Irish Rules’: The Potato Late Blight Forecasting Model and Its Operational Use in the Republic of Ireland. Agronomy, 9(9), 515. https://doi.org/10.3390/agronomy9090515