Effects of Quantitative Ordinal Scale Design on the Accuracy of Estimates of Mean Disease Severity


Abstract
:1. Introduction
2. Materials and Methods
2.1. Assessment Methods
2.2. Simulation Method
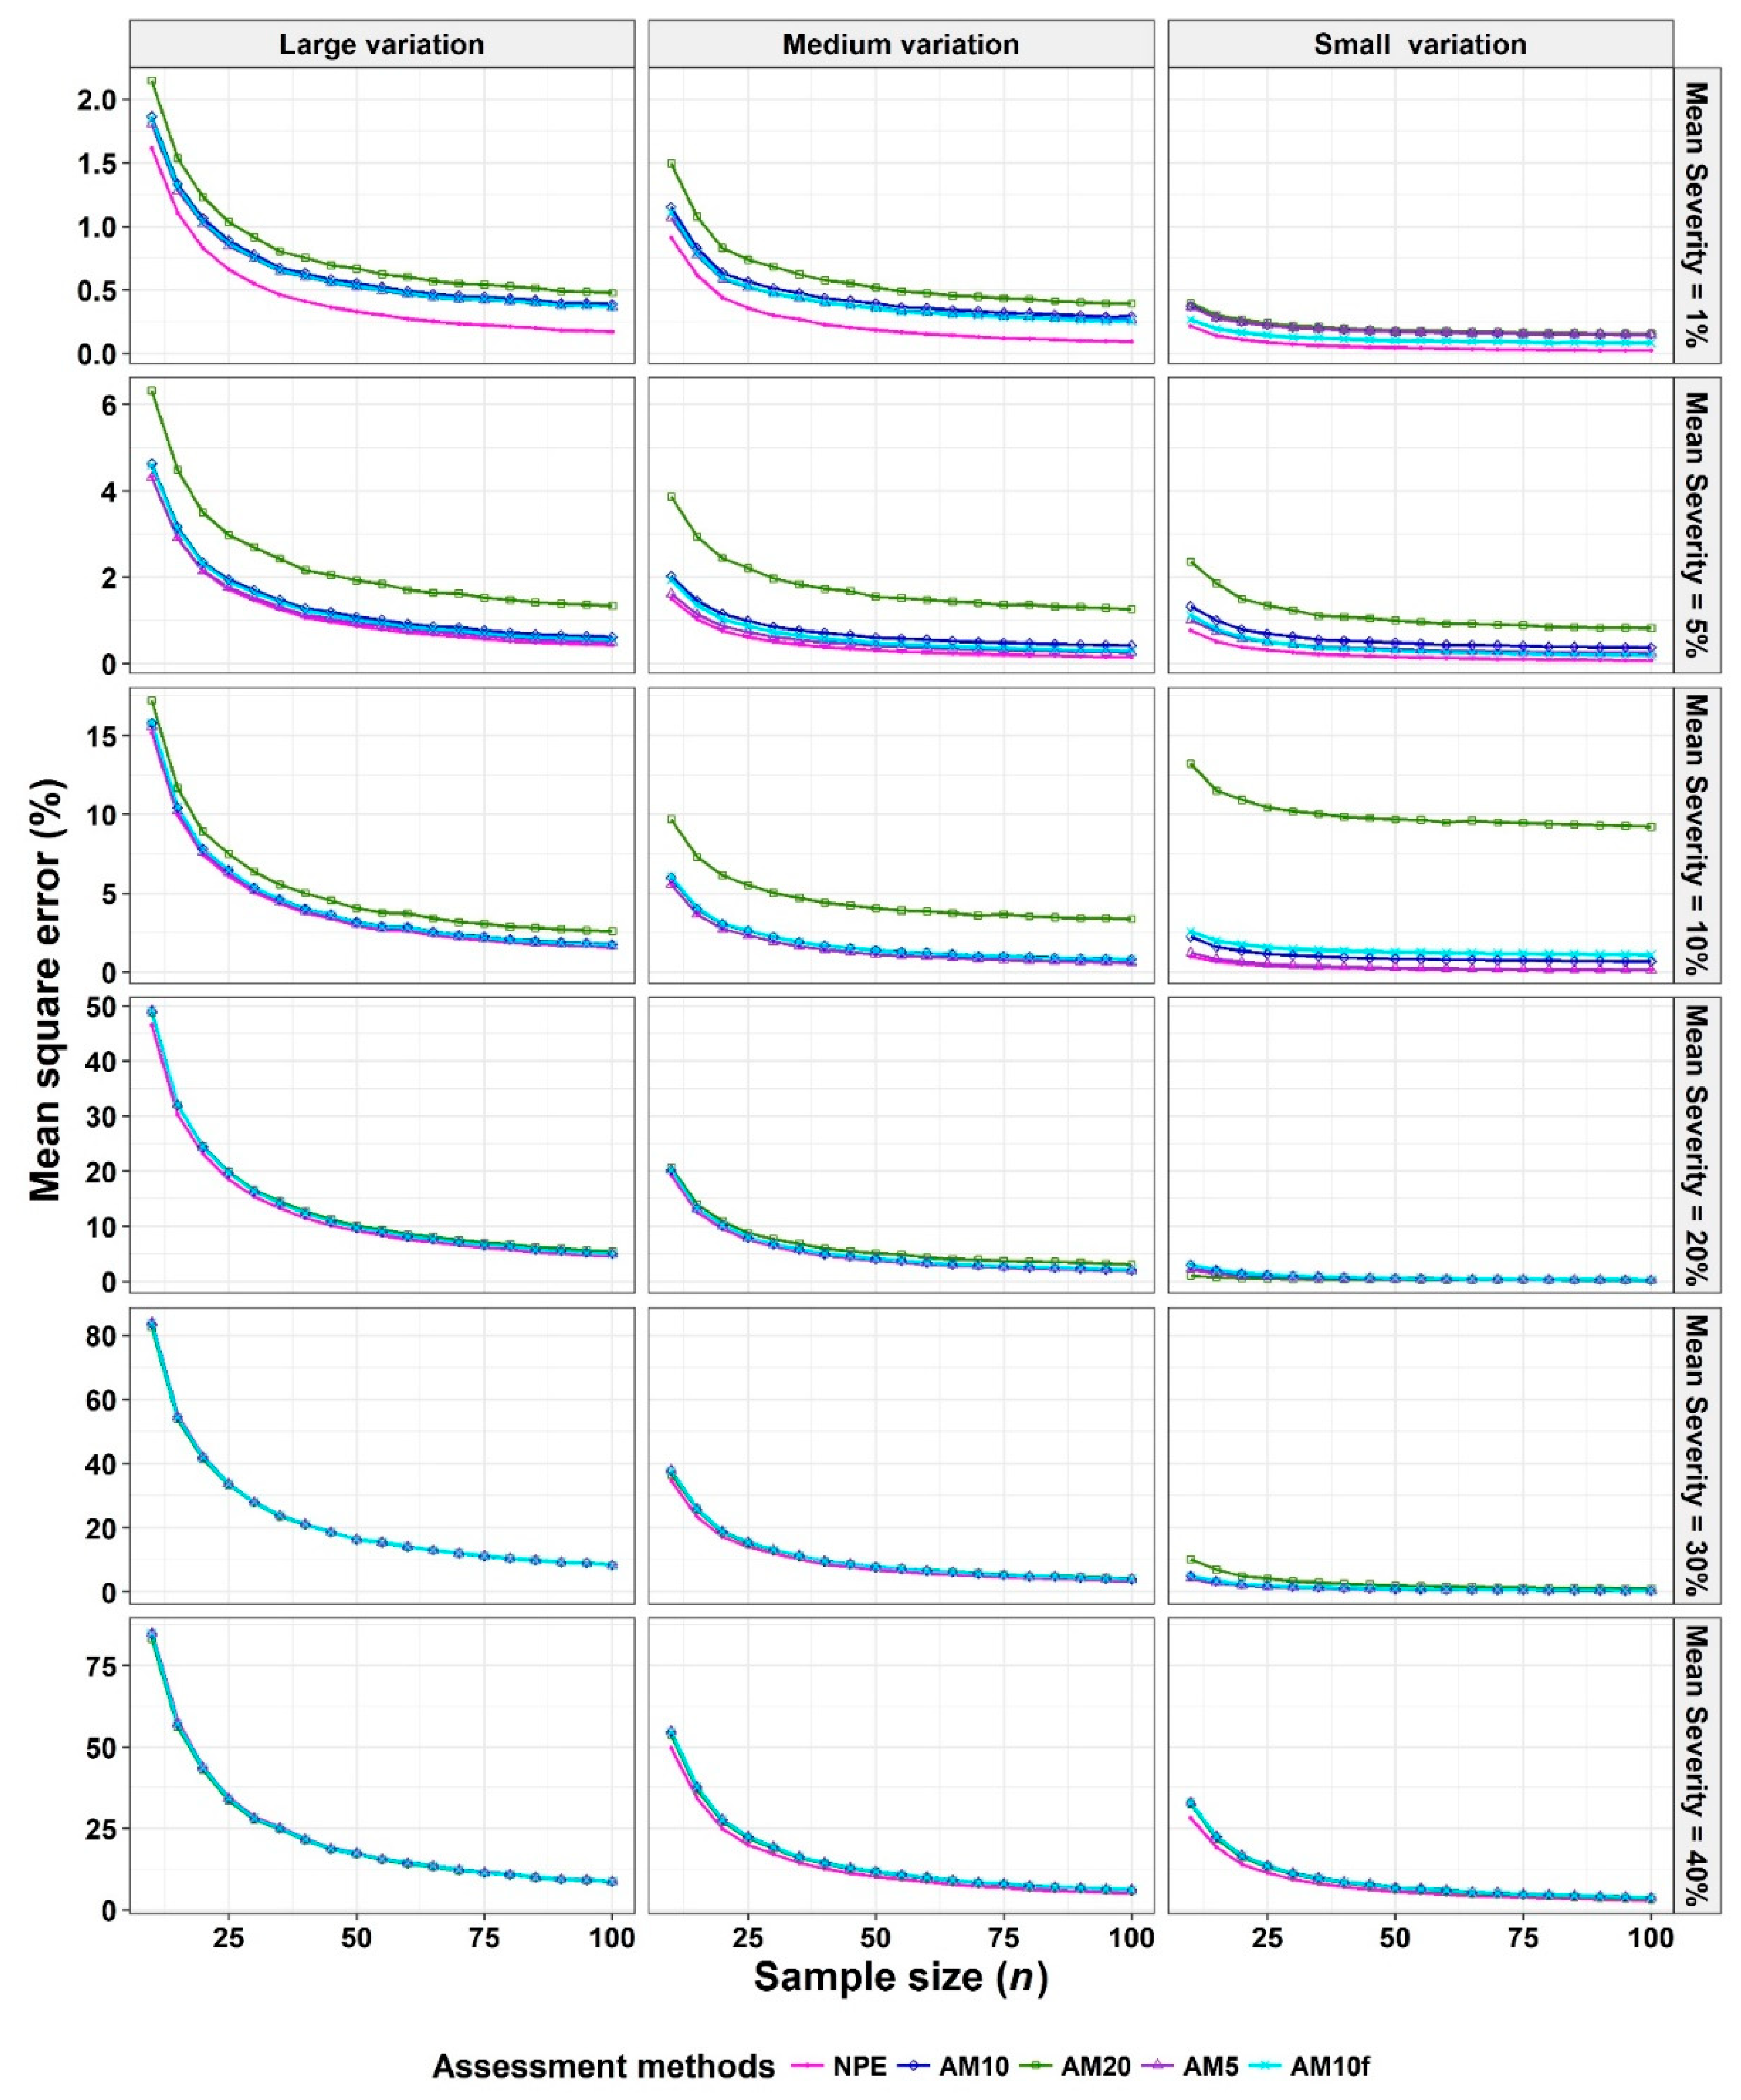
2.3. Criterion for Comparison: Mean Squared Error (MSE)
2.4. Simulation Framework
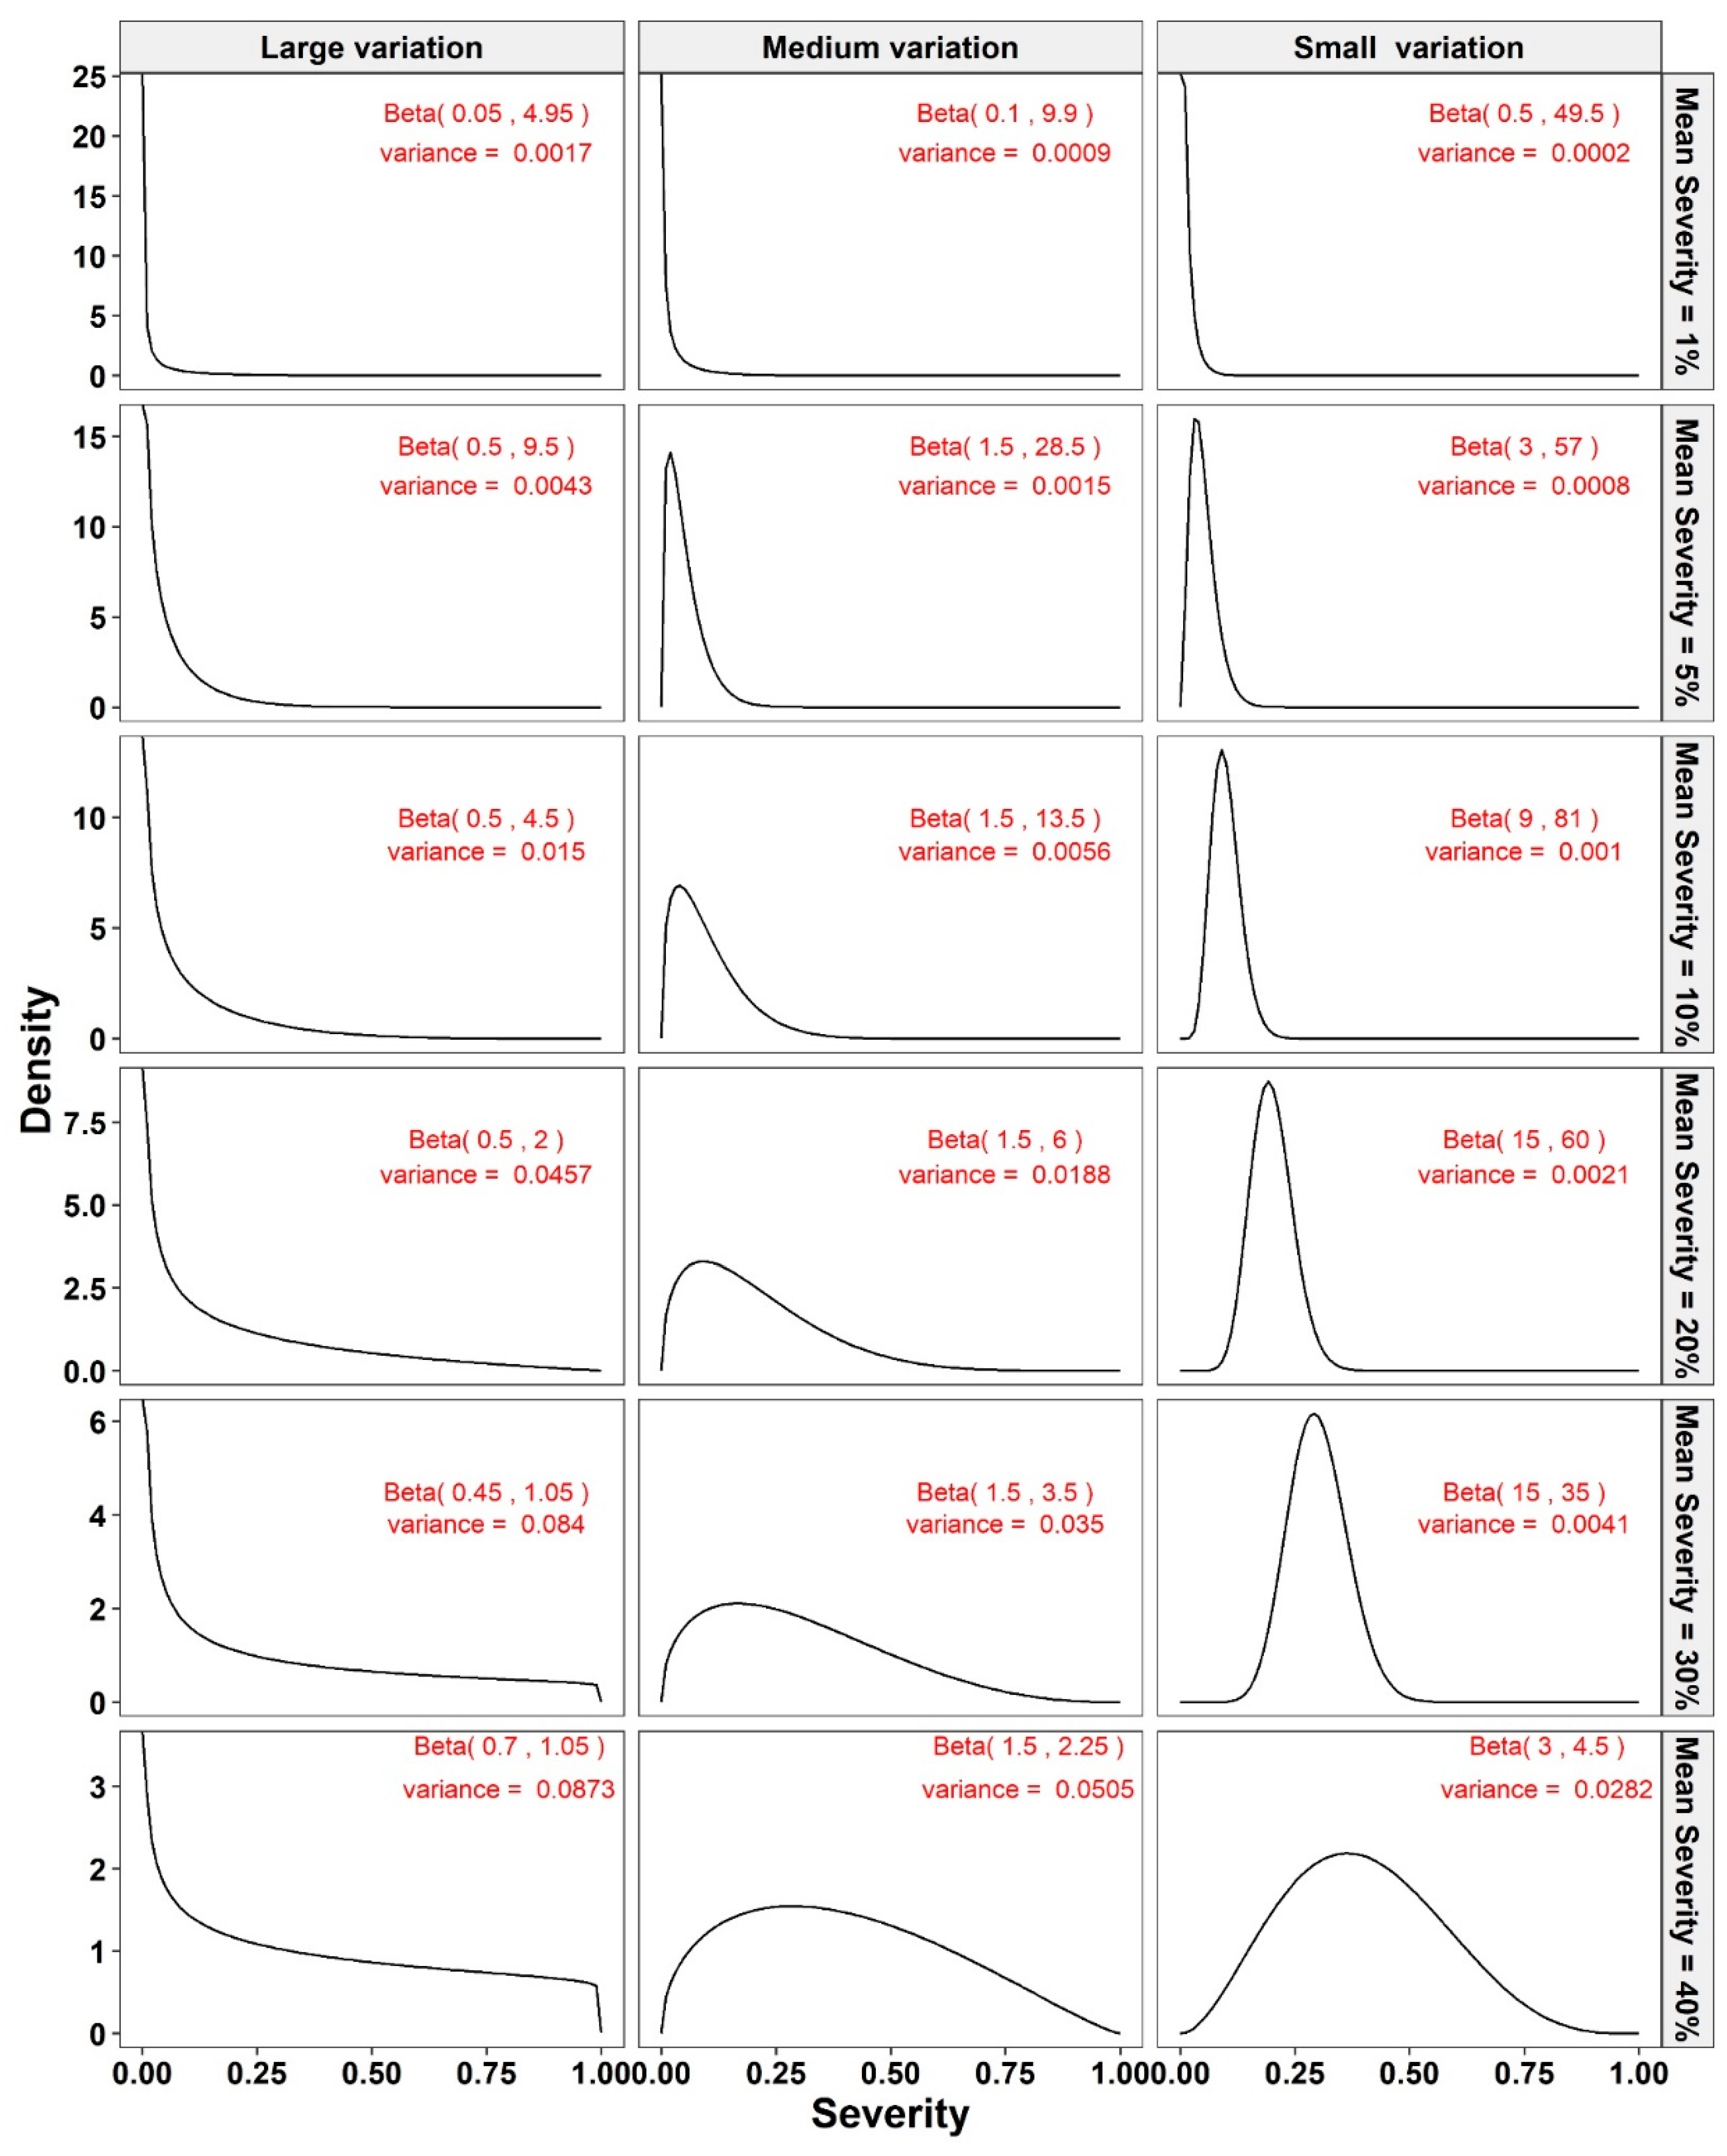
- We simulated n sample size values (from 10 to 100 in increments of 5) from a beta-distribution with the preselected specific mean severity and variance for that sample (which might represent a plot in a field). These n simulated values on the continuous percentage scale, defined by the beta distribution of a random variable on the closed unit interval 0–1, represent the NPEs.
- The resulting NPEs were converted to the appropriate classes for assessment methods 2–7. These scale data were subsequently converted to the appropriate midpoint value of each class for subsequent analysis [2].
- The MSEs of mean disease severity estimates for each of the different scales were calculated (Equation (1)).
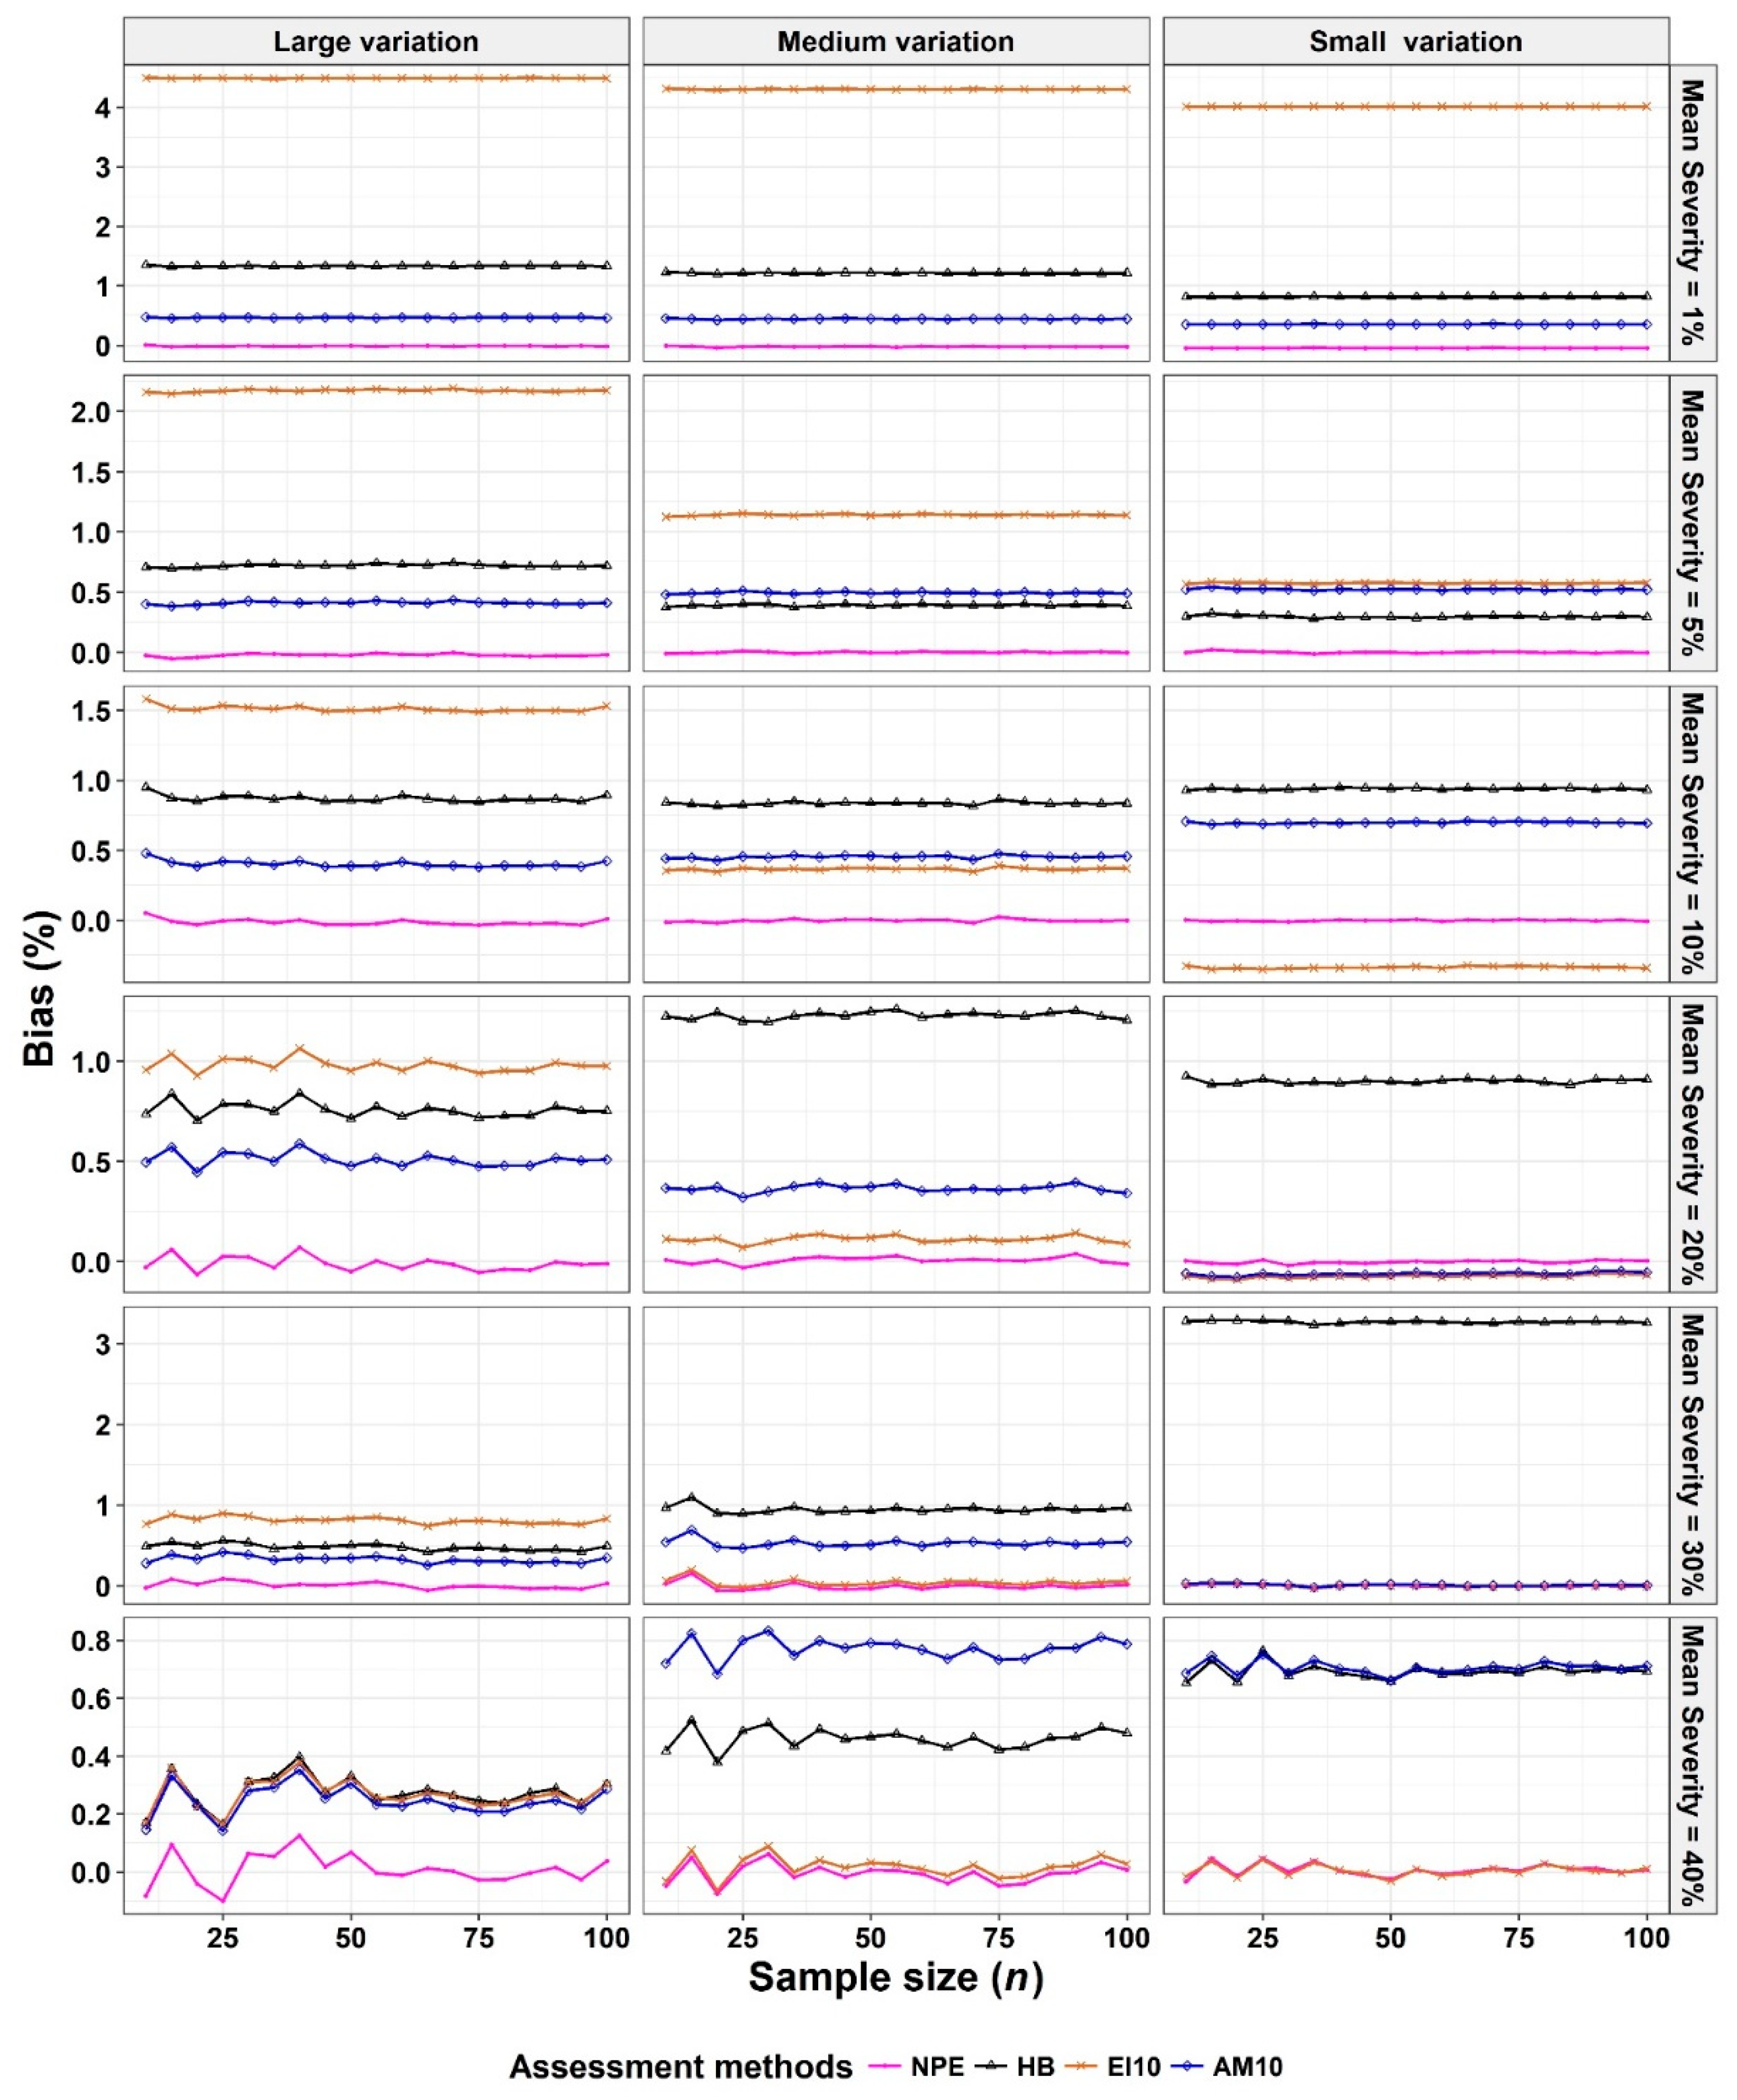
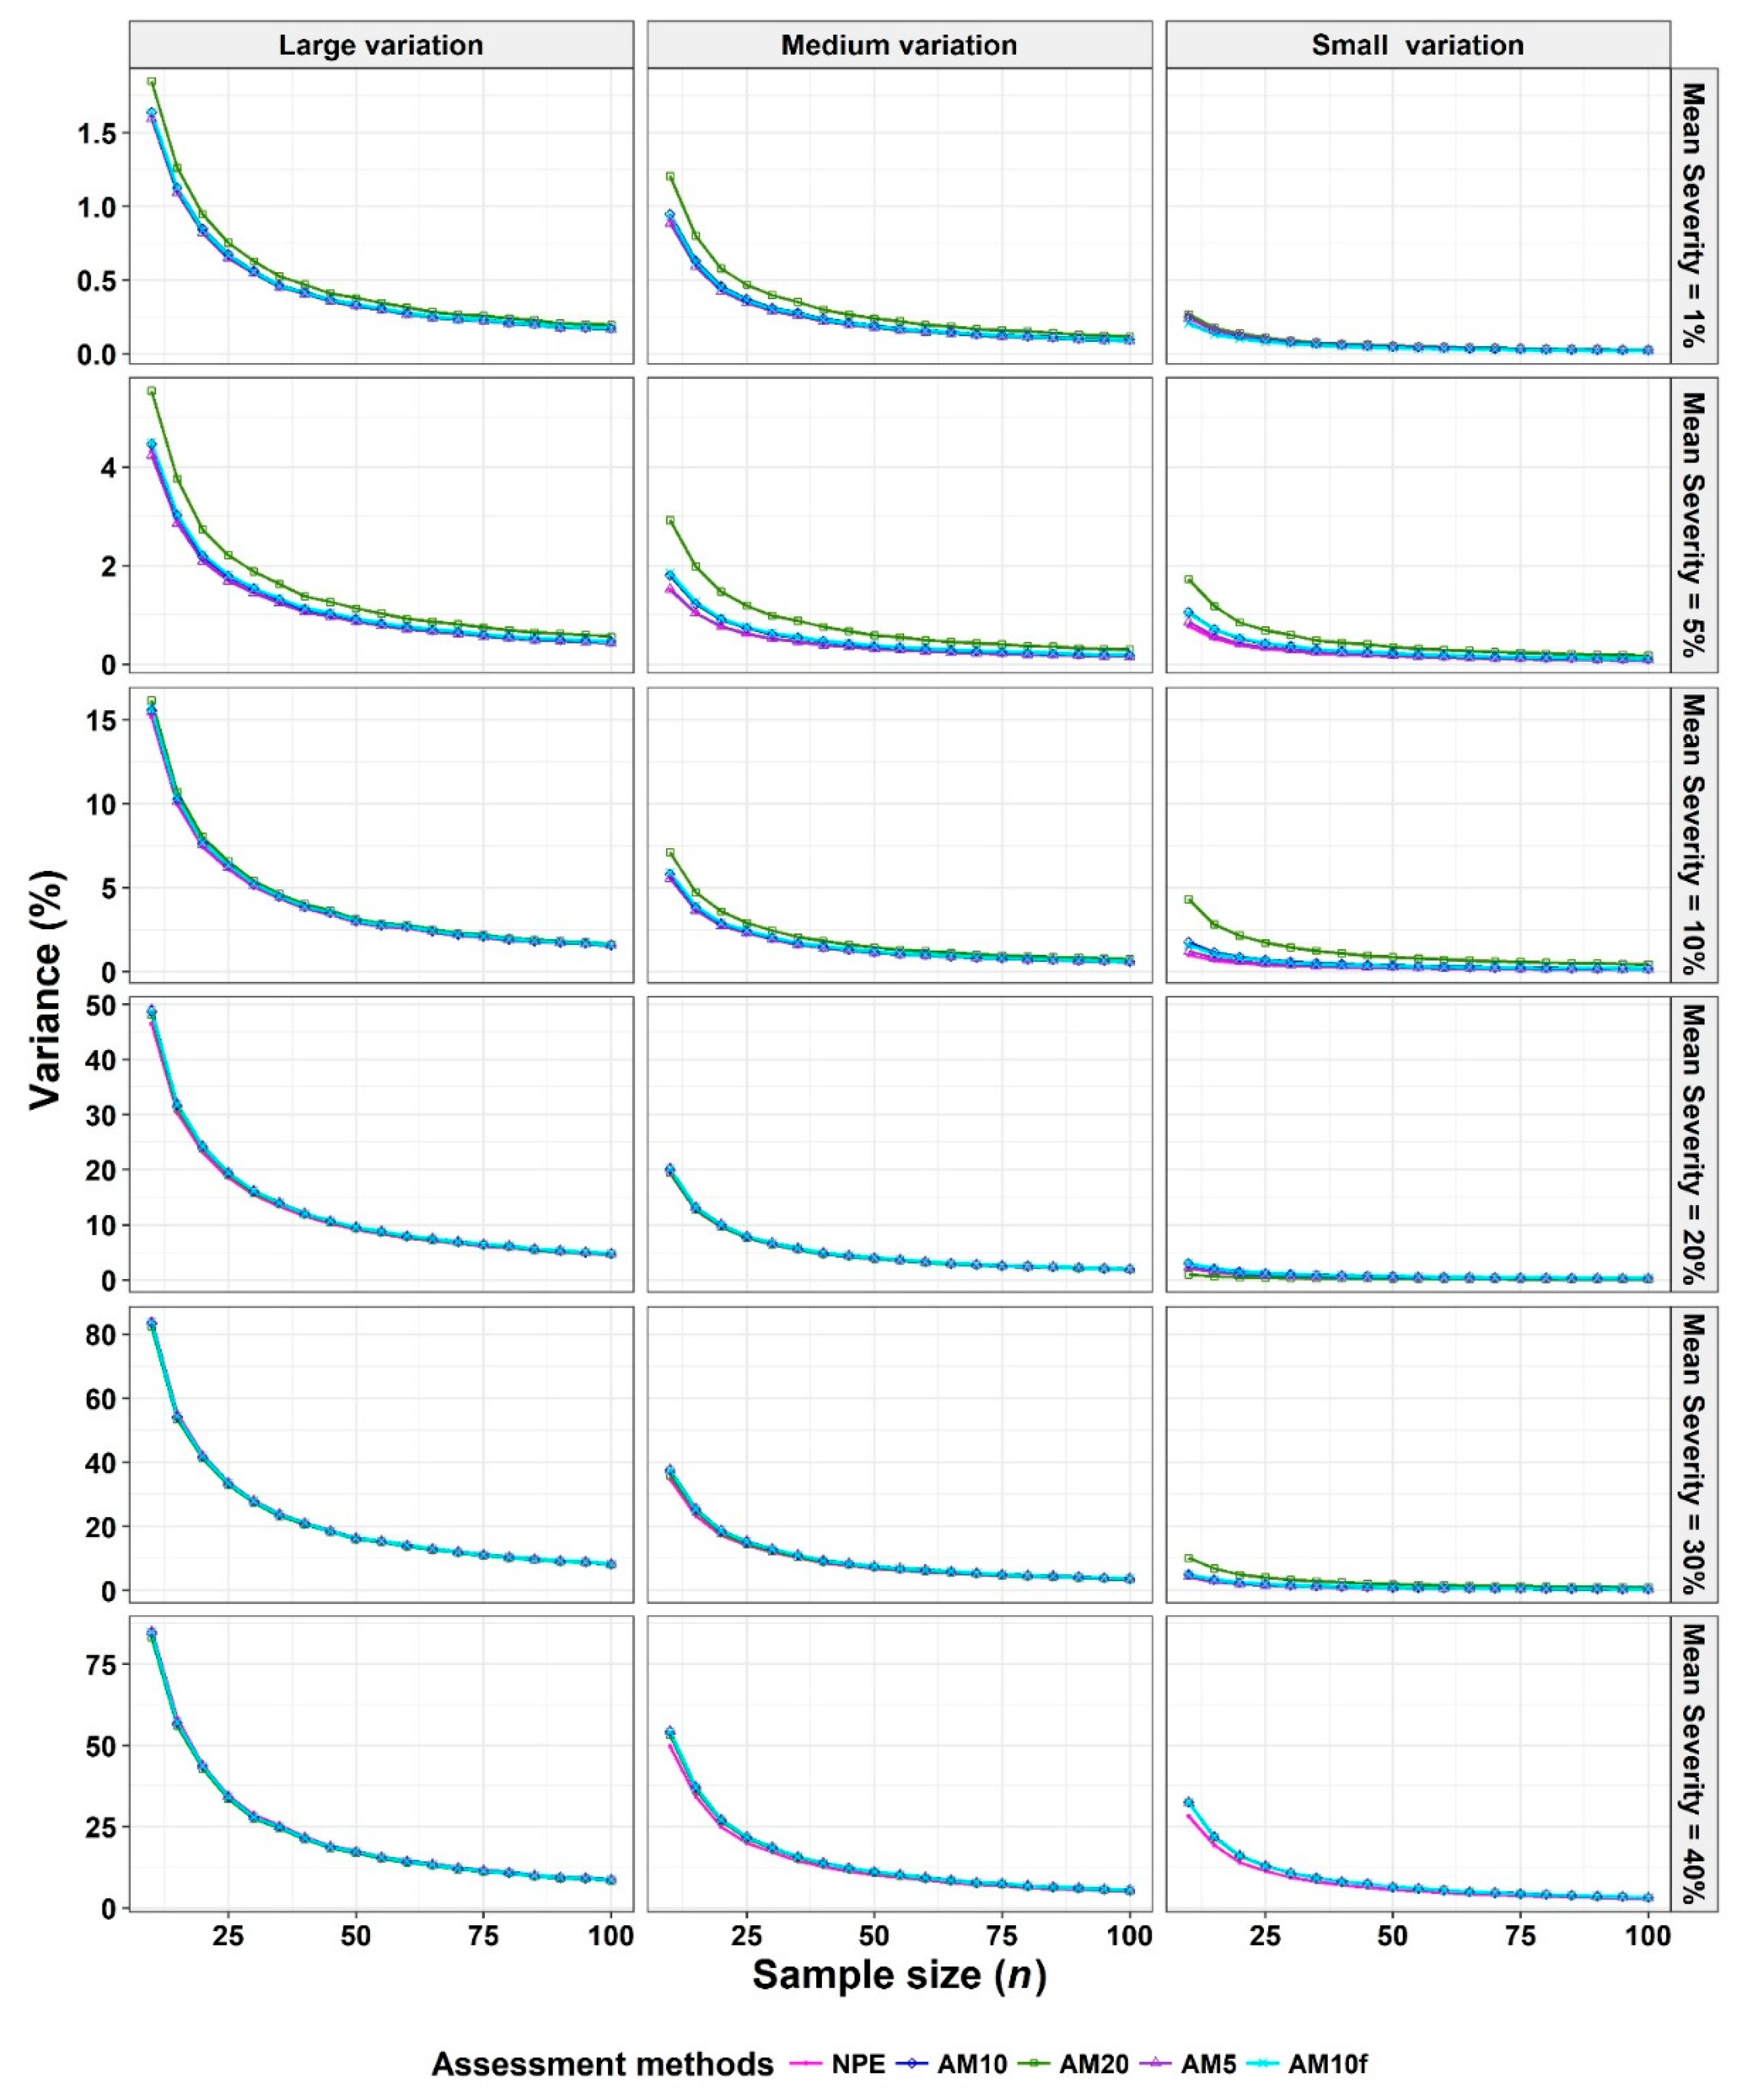
- The corresponding variances and biases were calculated (equations 2 and 3, respectively).
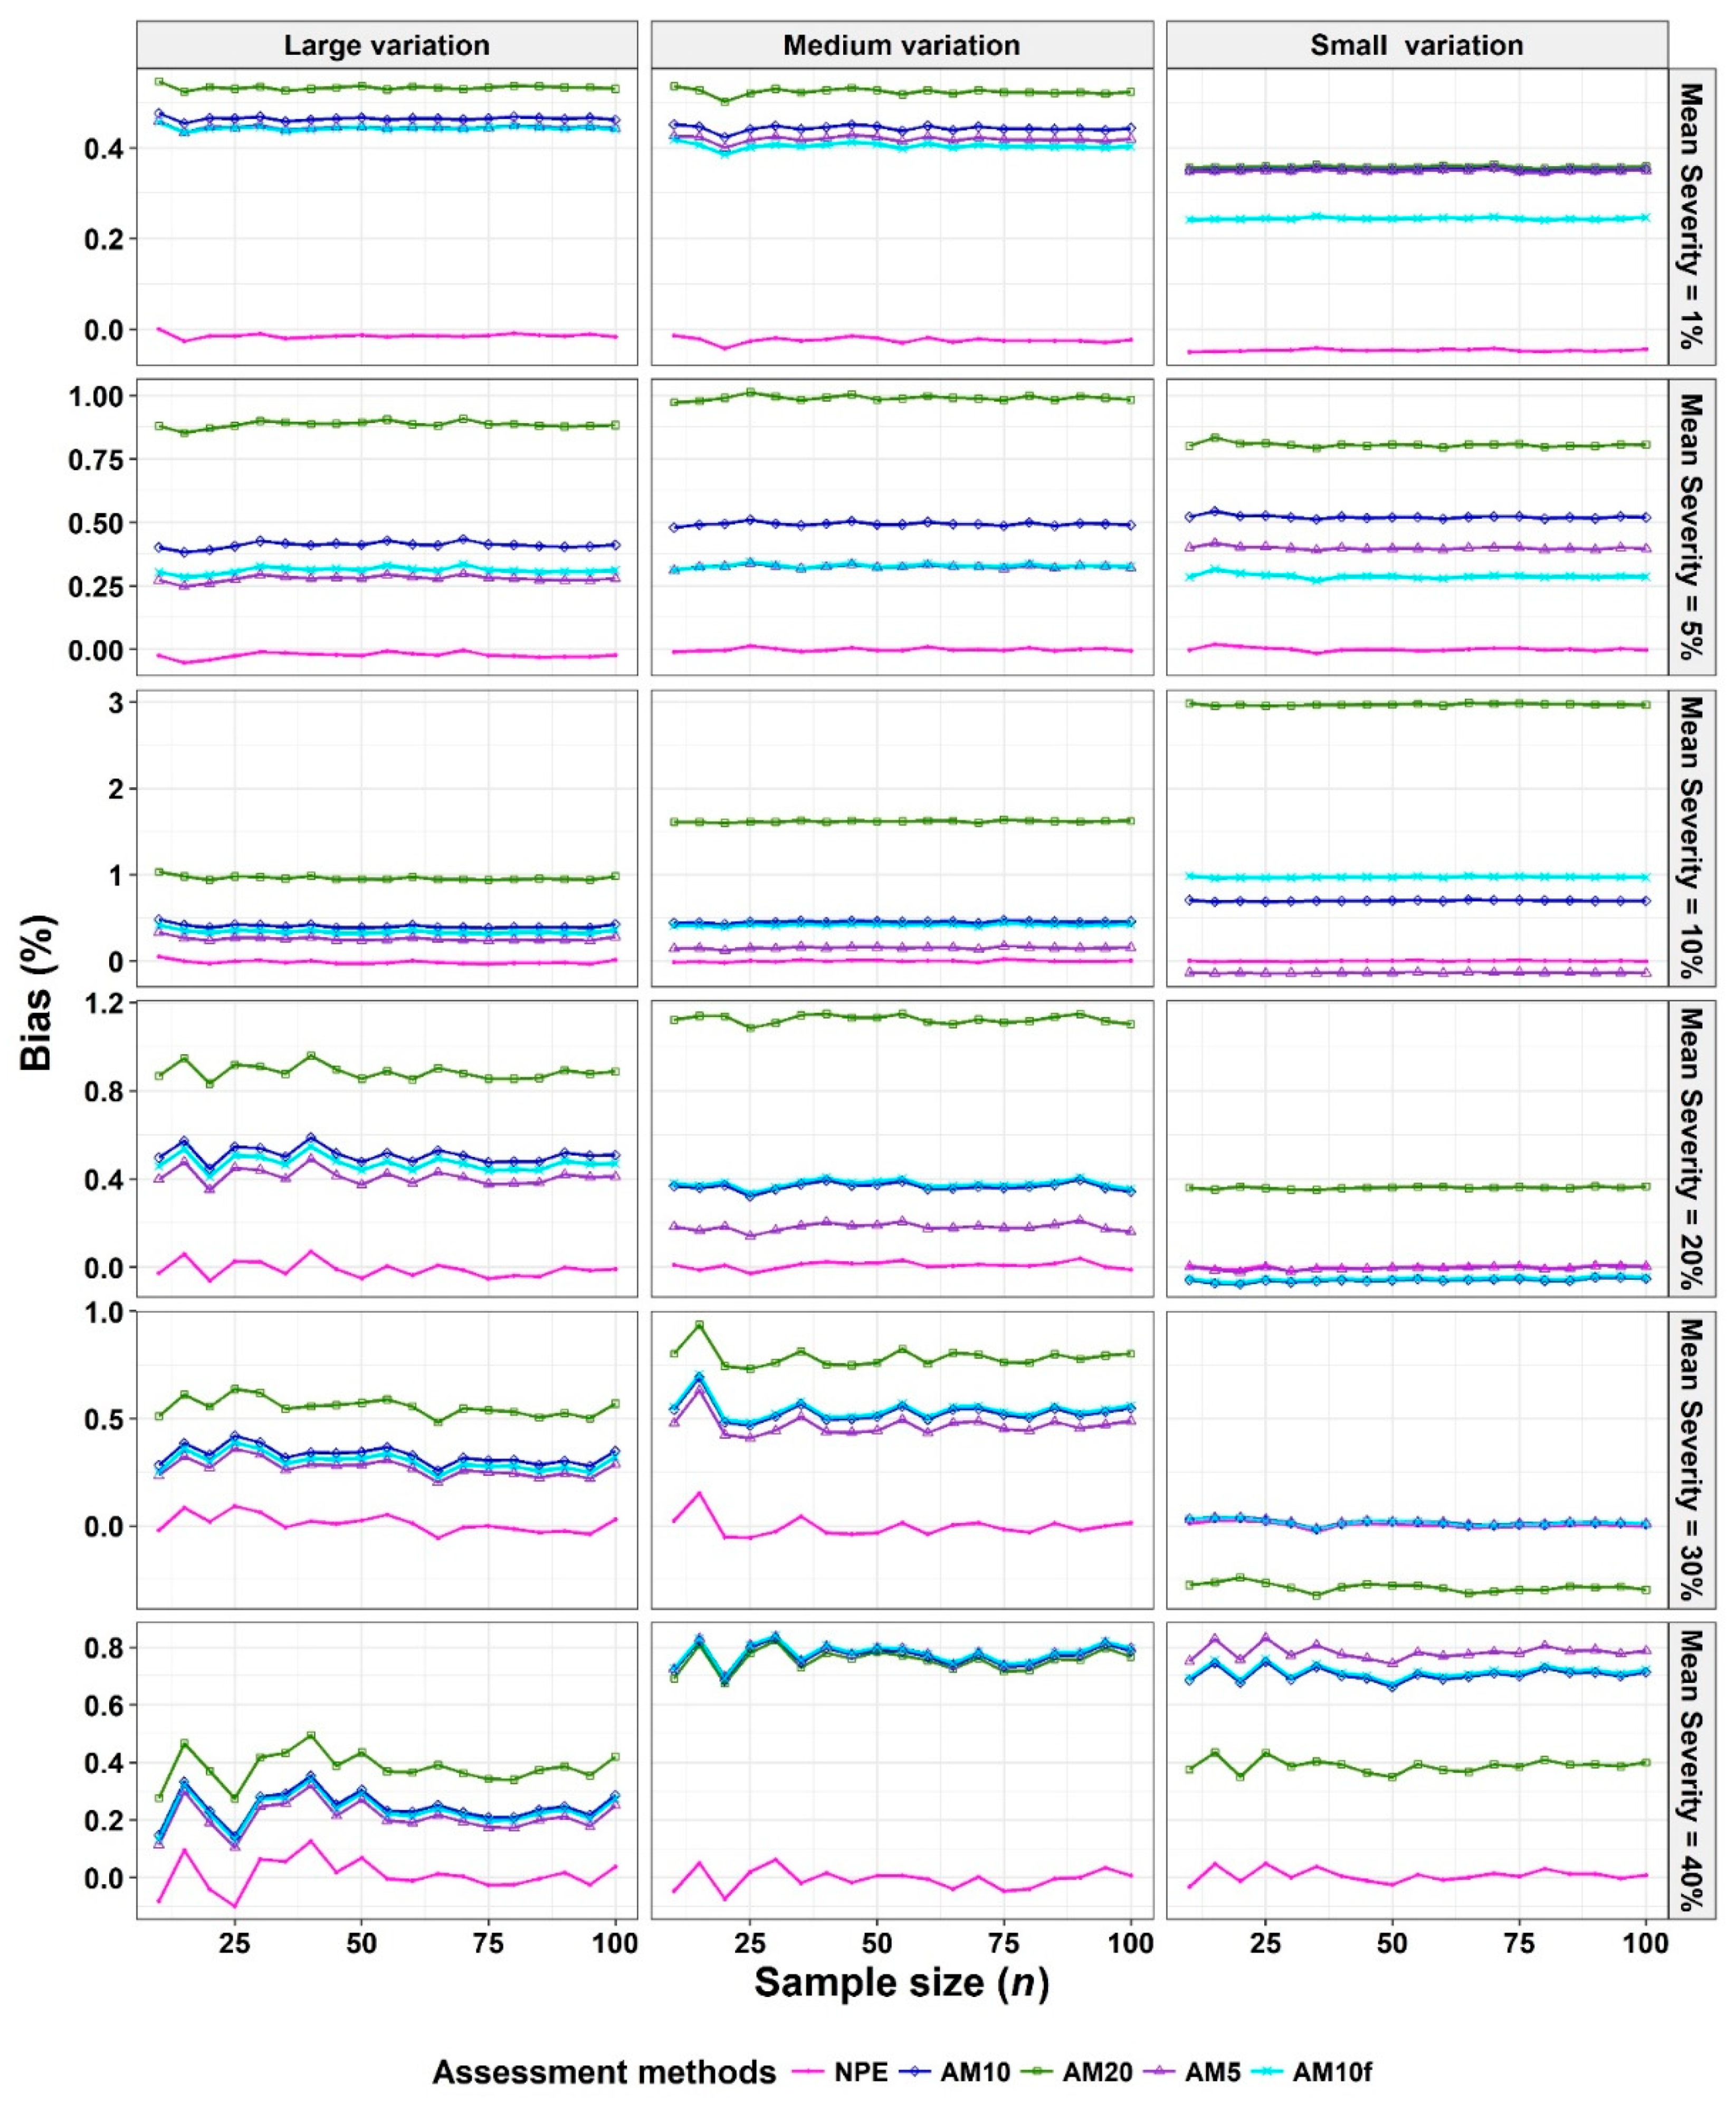
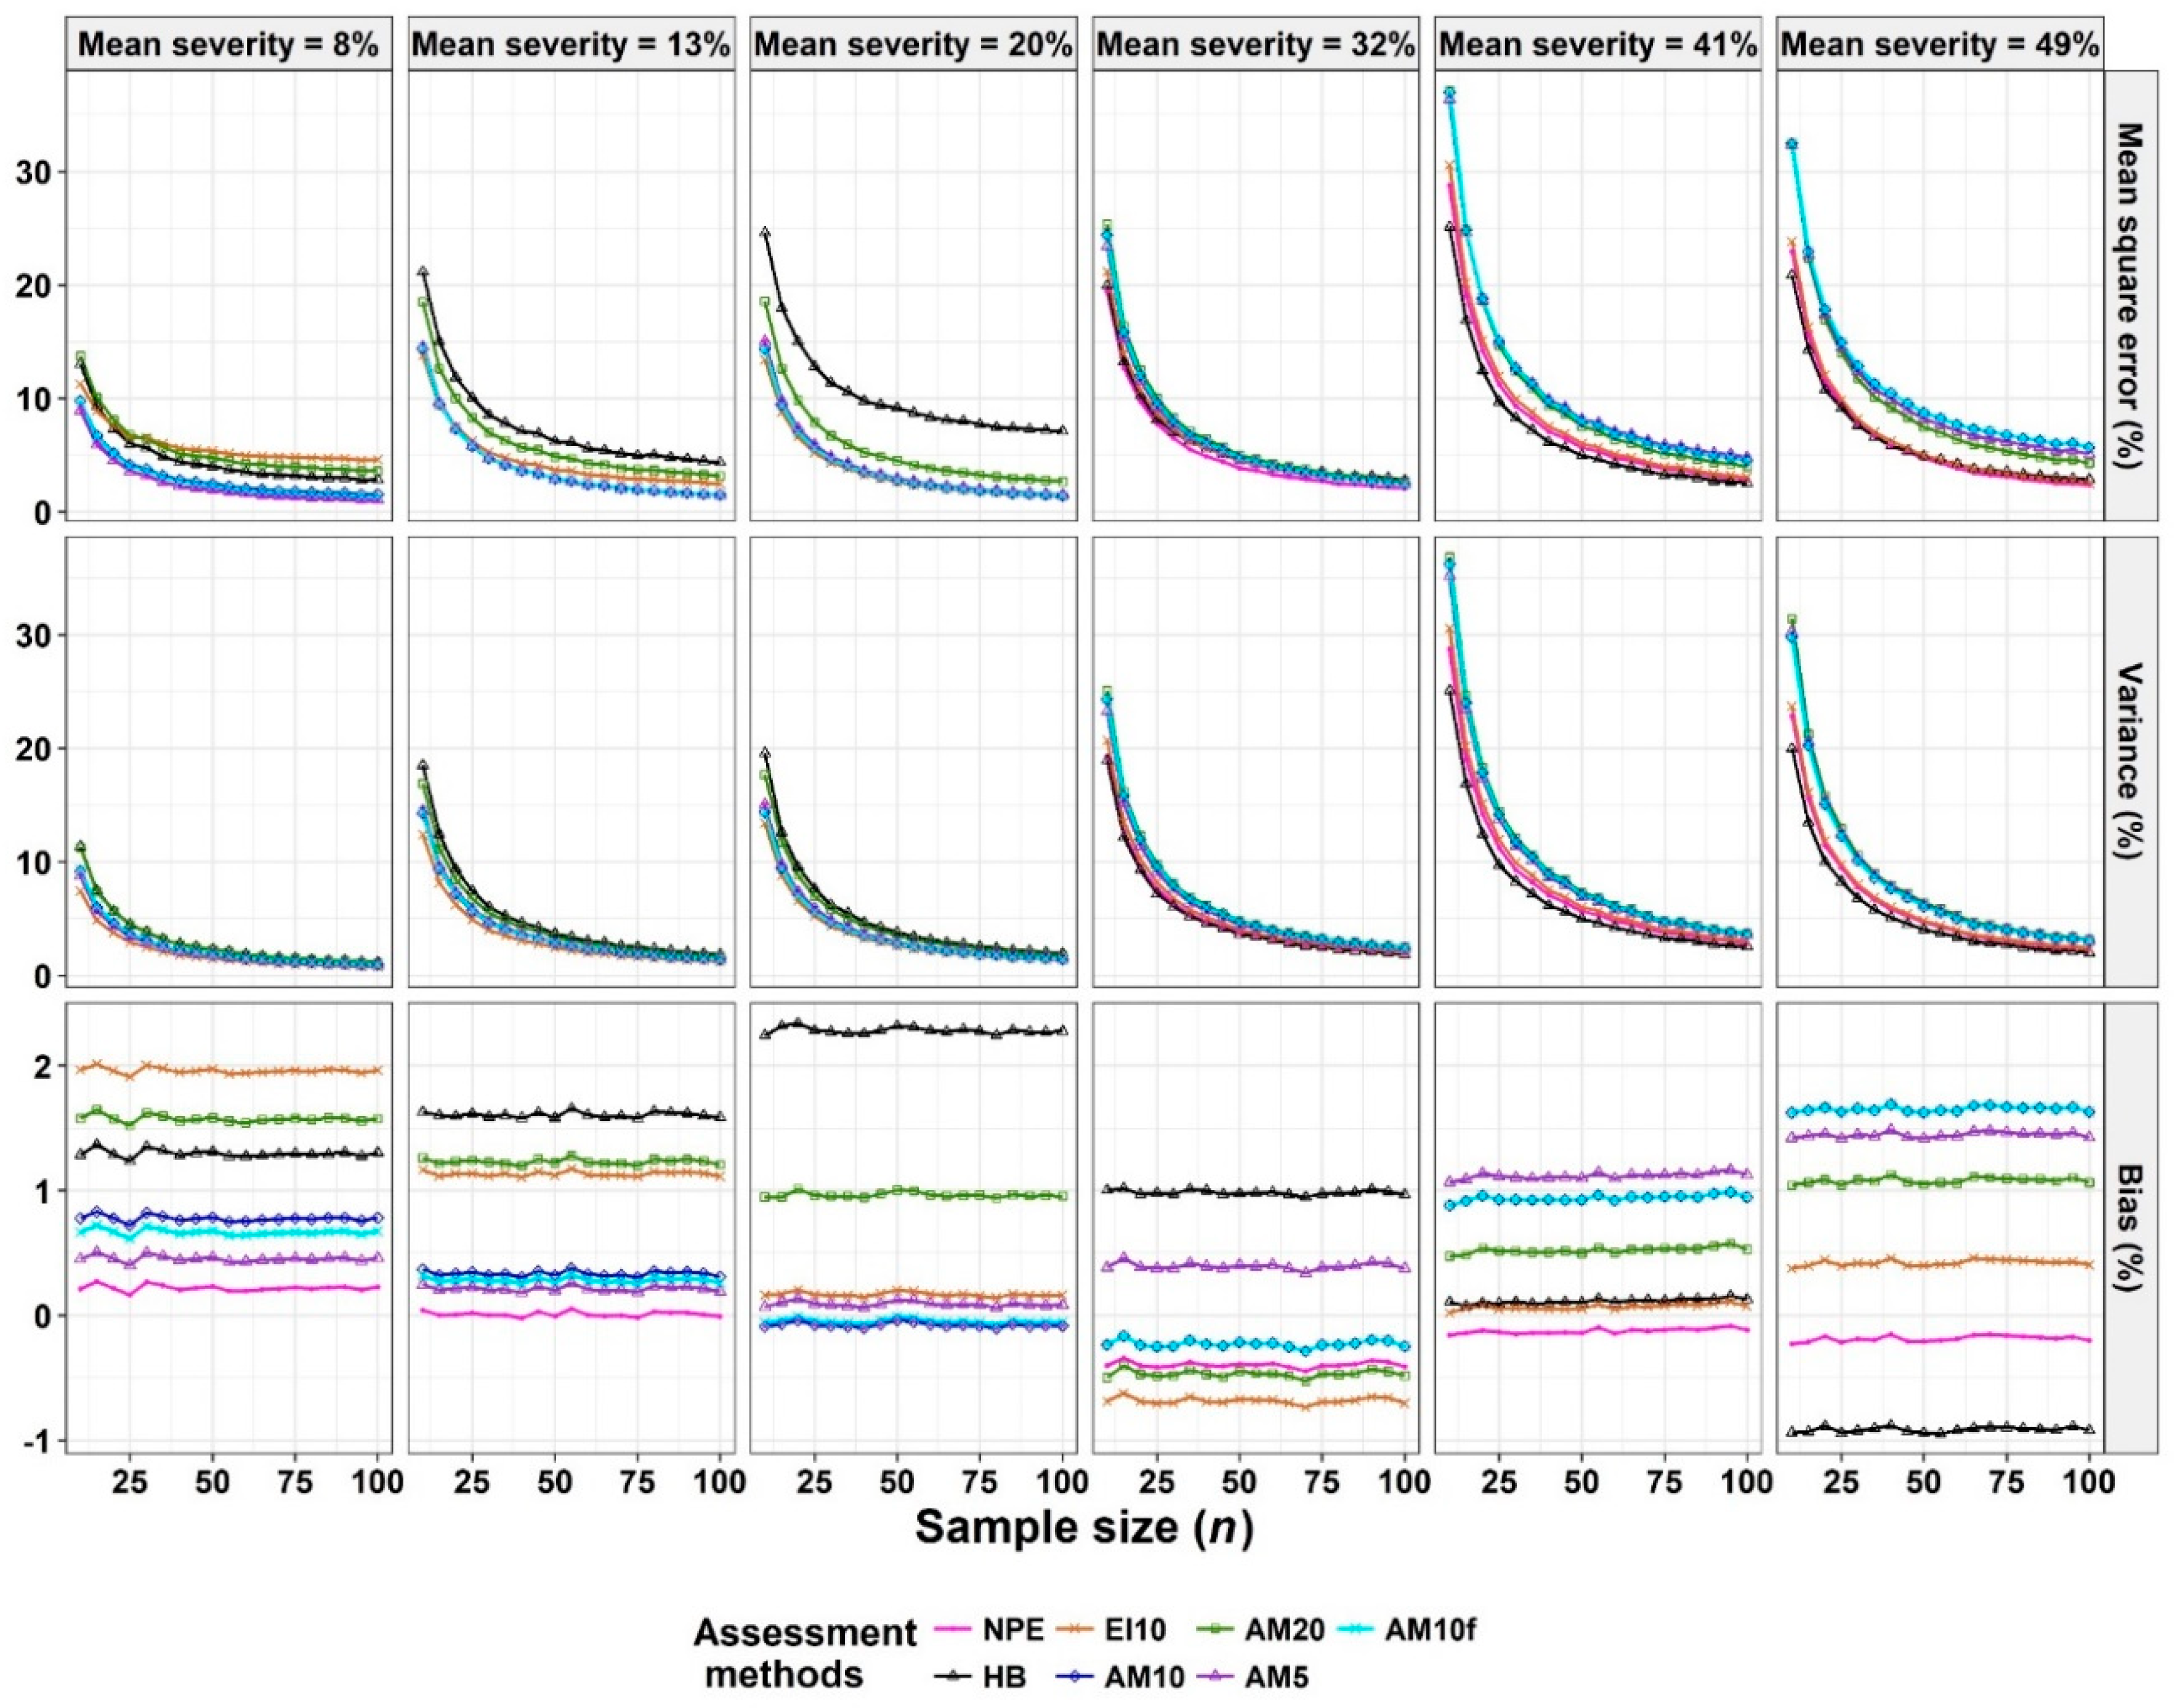
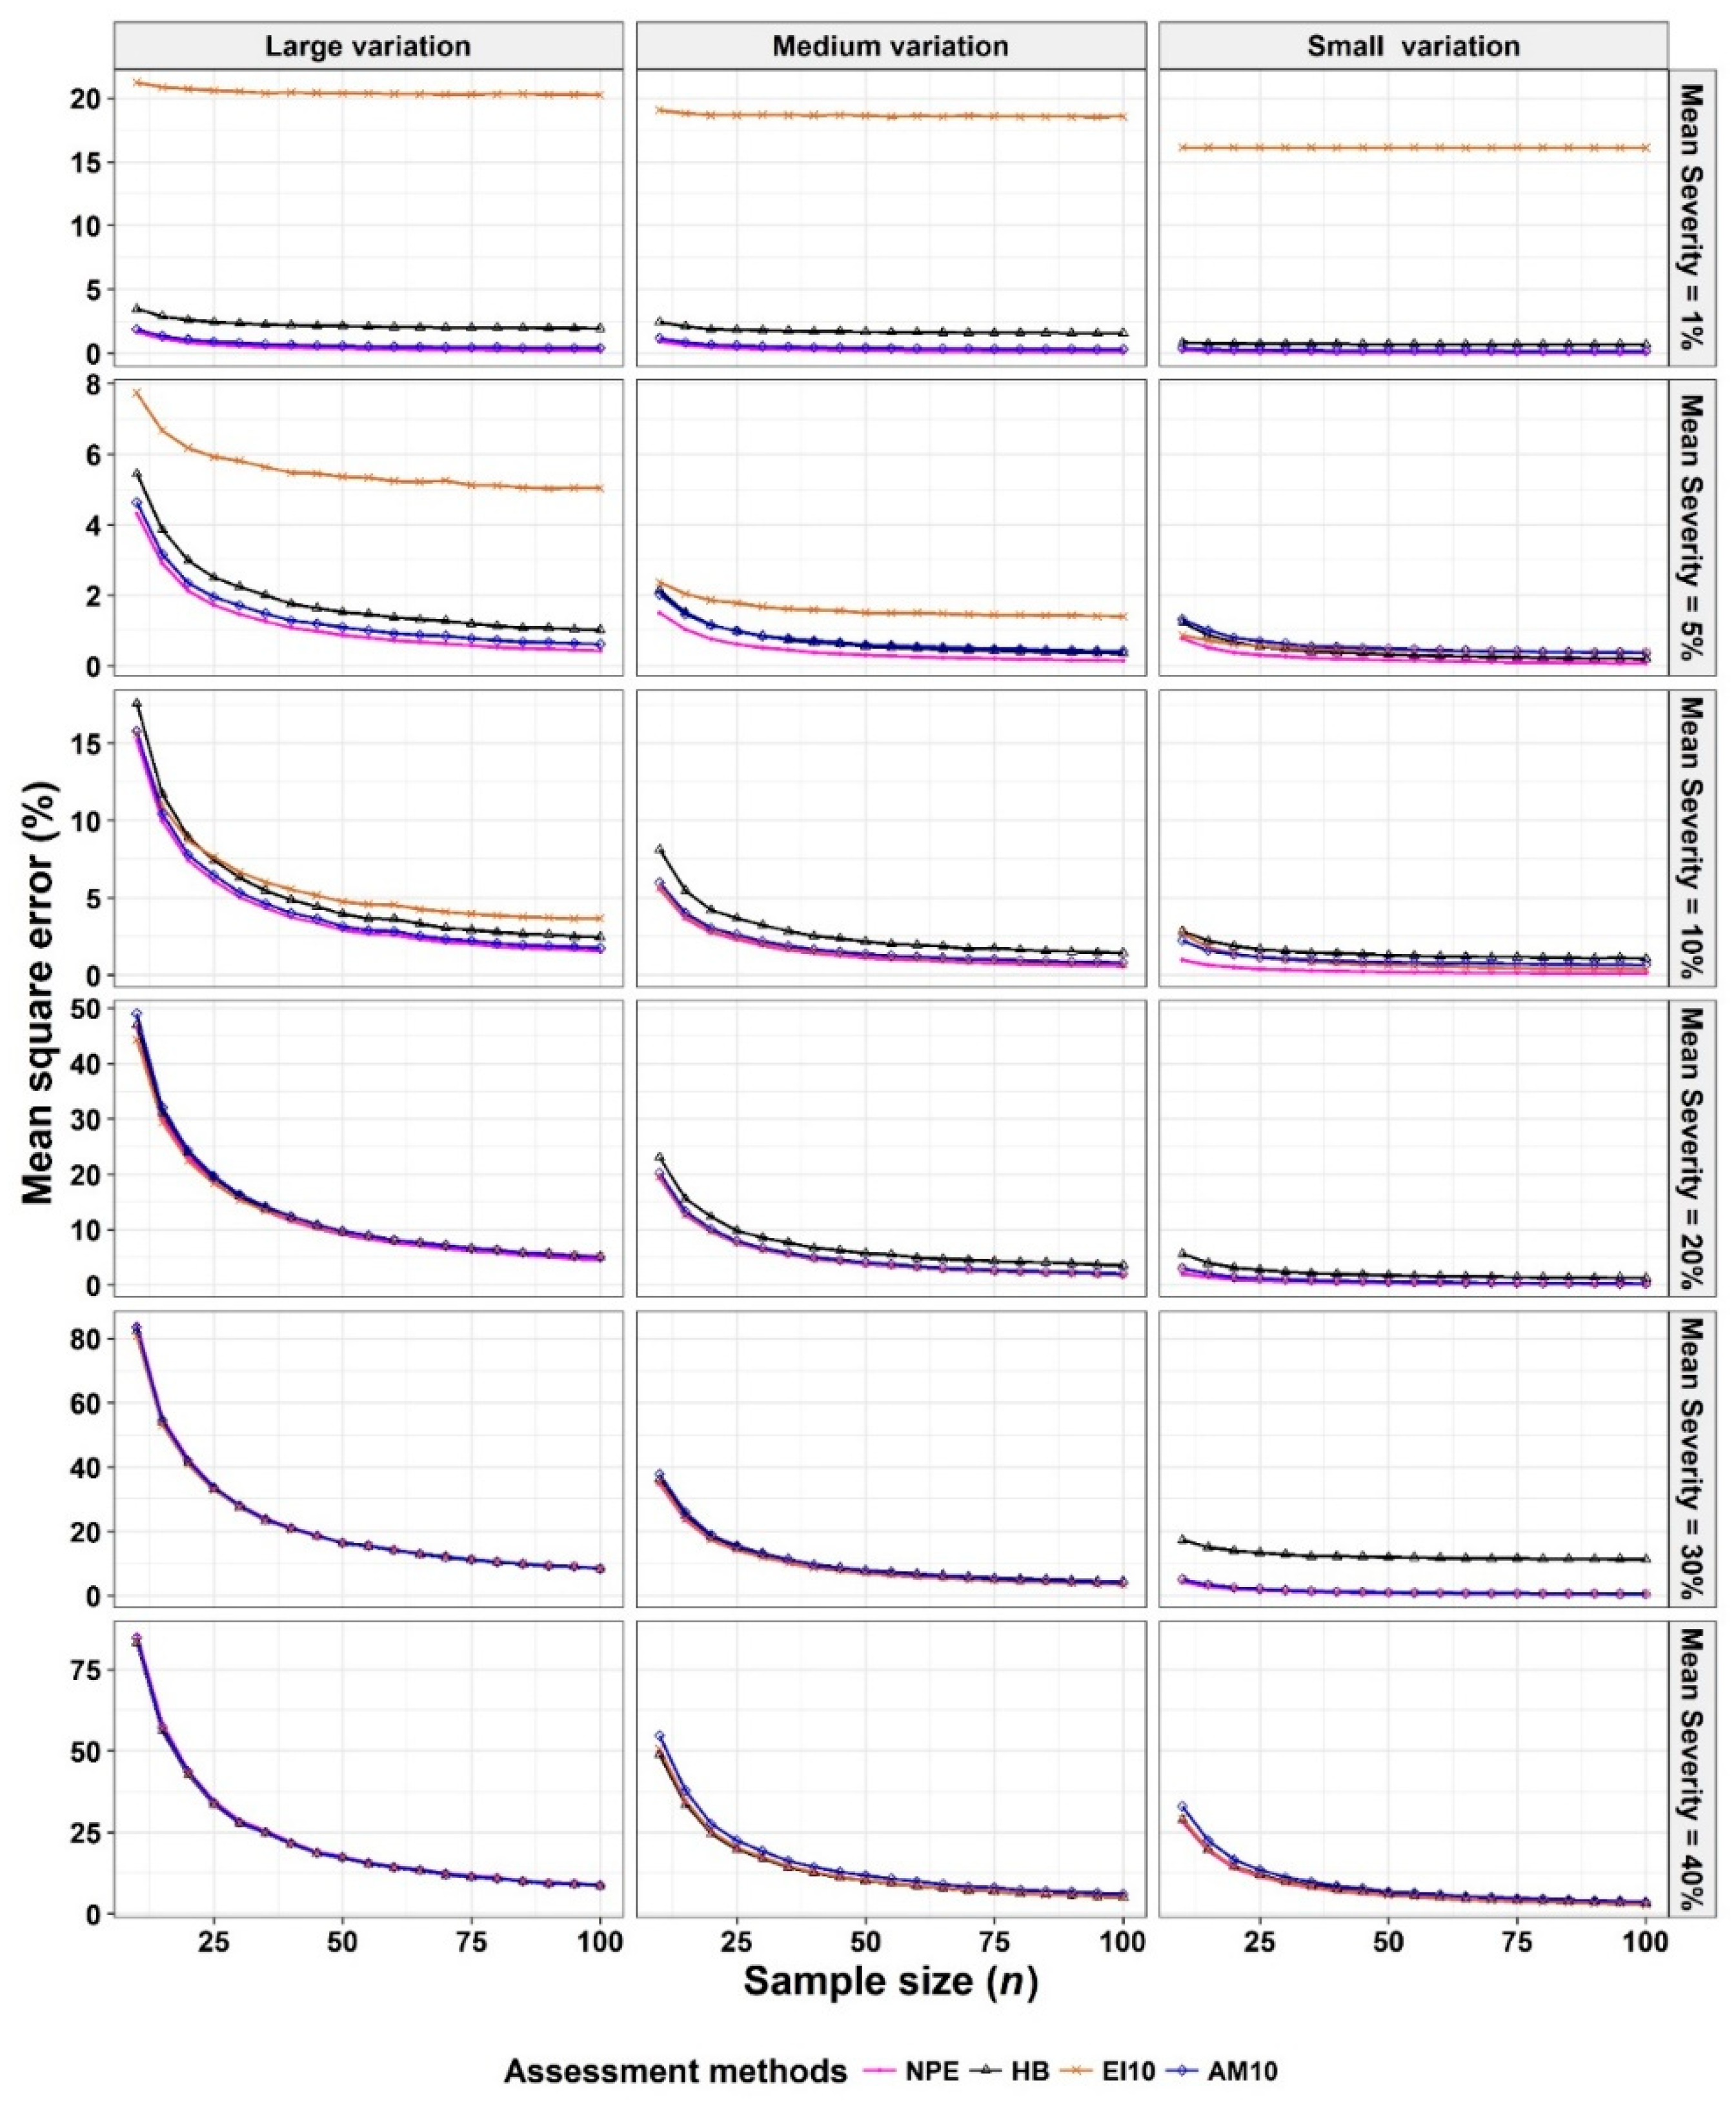
- The Monte Carlo simulation process was repeated 10,000 times. To present the results comparing assessment methods, we plot MSEs (or variance or bias) on the y-axis against sample size values (from n = 10 to 100 in n = 5 increments) on the x-axis at each of a range of “actual” mean disease severities (1%, 5%, 10%, 20%, 30%, and 40% [6 mean disease severities]) and disease severity variances (representing large, medium, and small variation [3 variances]). Thus, the results are presented in a montage (a 6 × 3 array of figures). For example, R1C2 (chart in row 1, column 2) indicates the chart in the second column in the first row, and presents the relationships between the MSE, variance, or bias of the mean disease severity estimates and sample size (n) for each of the different scales used, at an “actual” mean disease severity of 1%, and the medium variation.
2.5. Pear scab Assessment
3. Results
3.1. Comparison to Determine the Effect of Scale Structure
3.2. Comparison to Determine the Effect of Number of Classes
3.3. Analysis of Severity of Pear Scab Data
4. Discussion
4.1. “Optimal” Design for an Ordinal Scale
4.2. Effects of Statistical Distributions of Diseased Leaves
4.3. Properties of the AM10 Quantitative Ordinal Scale
4.4. Mean Squared Error (MSE), Variance, and Bias
4.5. Rationale for Simulation Studies
4.6. Direction for Future Studies
5. Conclusions
Author Contributions
Funding
Acknowledgments
Conflicts of Interest
References
- Bock, C.H.; Chiang, K.S.; Del Ponte, E.M. Accuracy of plant specimen disease severity estimates: Concepts, history, methods, ramifications and challenges for the future. CAB Reviews: Pers. Ag. Vet. Sci. Nutr. Nat. Res. 2016, 11, 1–13. [Google Scholar] [CrossRef]
- Madden, L.V.; Hughes, G.; van den Bosch, F. The Study of Plant. Disease Epidemics; APS Press: St. Paul, MN, USA, 2007. [Google Scholar]
- Nutter, F.W., Jr. Disease assessment terms and concepts. In Encyclopedia of Plant. Pathology; Maloy, O.C., Murray, T.D., Eds.; John Wiley and Sons: New York, NY, USA, 2001; pp. 312–323. [Google Scholar]
- Bock, C.H.; Poole, G.; Parker, P.E.; Gottwald, T.R. Plant disease severity estimated visually, by digital photography and image analysis, and by hyperspectral imaging. Crit. Rev. Plant. Sci. 2010, 29, 59–107. [Google Scholar] [CrossRef]
- Horsfall, J.G.; Barrat, R.W. An improved grading system for measuring plant disease. Phytopathology 1945, 35, 655. [Google Scholar]
- Hunter, R.E.; Roberts, D.D. A disease grading system for pecan scab. Pecan Q. 1978, 12, 3–6. [Google Scholar]
- Koitabashi, M. New biocontrol method for parsley powdery mildew by the antifungal volatiles-producing fungus Kyu-W63. J. Gen. Plant. Pathol. 2005, 71, 280–284. [Google Scholar] [CrossRef]
- Kobriger, K.M.; Hagedorn, D.J. Determination of bean root rot potential in vegetable production fields of Wisconsin’s central sands. Plant. Dis. 1983, 67, 177–178. [Google Scholar] [CrossRef]
- Kora, C.; McDonald, M.R.; Boland, G.J. Epidemiology of Sclerotinia rot of carrot caused by Sclerotinia sclerotiorum. Can. J. Plant. Pathol. 2005, 27, 245–258. [Google Scholar] [CrossRef]
- Lazarovits, G.; Hill, J.; Patterson, G.; Conn, K.L.; Crump, N.S. Edaphic soil levels of mineral nutrients, pH, organic matter, and cationic exchange capacity in the geocaulosphere associated with potato common scab. Phytopathology 2007, 97, 1071–1082. [Google Scholar] [CrossRef] [PubMed]
- Nitzan, N.; Cummings, T.F.; Johnson, D.A.; Miller, J.S.; Batchelor, D.L.; Olsen, C.; Quick, R.A.; Brown, C.R. Resistance to root galling caused by the powdery scab pathogen Spongospora subterranea in potato. Plant. Dis. 2008, 92, 1643–1649. [Google Scholar] [CrossRef] [PubMed]
- Slopek, S.W. An improved method of estimating percent leaf area diseased using a 1 to 5 disease assessment scale. Can. J. Plant. Pathol. 1989, 11, 381–387. [Google Scholar] [CrossRef]
- Vieira, R.F.; Paula, T.J., Jr.; Carneiro, J.E.S.; Teixeira, H.; Queiroz, T.F.N. Management of white mold in type III common bean with plant spacing and fungicide. Trop. Plant. Pathol. 2012, 37, 95–101. [Google Scholar]
- Bock, C.H.; Gottwald, T.R.; Parker, P.E.; Ferrandino, F.; Welham, S.; van den Bosch, F.; Parnell, S. Some consequences of using the Horsfall-Barratt scale for hypothesis testing. Phytopathology 2010, 100, 1030–1041. [Google Scholar] [CrossRef] [PubMed]
- Nutter, F.W., Jr.; Esker, P.D. The role of psychophysics in phytopathology:The Weber-Fechner law revisited. Eur. J. Plant. Pathol. 2006, 114, 199–213. [Google Scholar] [CrossRef]
- Hartung, K.; Piepho, H.P. Are ordinal rating scales better than percent ratings? A statistical and “psychological” view. Euphytica 2007, 155, 15–26. [Google Scholar] [CrossRef]
- Chiang, K.S.; Liu, S.C.; Bock, C.H.; Gottwald, T.R. What interval characteristics make a good categorical disease assessment scale? Phytopathology 2014, 104, 575–585. [Google Scholar] [CrossRef] [PubMed]
- Bock, C.H.; Wood, B.W.; van den Bosch, F.; Parnell, S.; Gottwald, T.R. The effect of Horsfall-Barratt category size on the accuracy and reliability of estimates of pecan scab severity. Plant. Dis. 2013, 97, 797–806. [Google Scholar] [CrossRef] [PubMed]
- Kranz, J. Schätzklassen für Krankheitsbefall. Phytopath. Z. 1970, 69, 131–139. [Google Scholar] [CrossRef]
- Kranz, J. Measuring plant disease. In Experimental Techniques in Plant. Disease Epidemiology; Kranz, J., Rotem, J., Eds.; Springer: New York, NY, USA, 1988; pp. 35–50. [Google Scholar]
- Hau, B.; Kranz, J.; Konig, R. Fehler beim Schätzen von Befallsstärken bei Pflanzenanzenkrankheiten. Z. Pflanzenkrankh. Pflanzenschutz 1989, 96, 649–674. [Google Scholar]
- Kranz, J. A study on maximum severity in plant disease. Travaux dédiés à G. Viennot-Bourgin 1977, 16, 9–73. [Google Scholar]
- Bock, C.H.; Parker, P.E.; Cook, A.Z.; Gottwald, T.R. Visual rating and the use of image analysis for assessing different symptoms of citrus canker on grapefruit leaves. Plant. Dis. 2008, 92, 530–541. [Google Scholar] [CrossRef] [PubMed]
- Bock, C.H.; Parker, P.E.; Cook, A.Z.; Riley, T.; Gottwald, T.R. Comparison of assessment of citrus canker foliar symptoms by experienced and inexperienced raters. Plant. Dis. 2009, 93, 412–424. [Google Scholar] [CrossRef] [PubMed]
- Forbes, G.A.; Korva, J.T. The effect of using a Horsfall-Barratt scale on precision and accuracy of visual estimation of potato late blight severity in the field. Plant. Pathol. 1994, 43, 675–682. [Google Scholar] [CrossRef]
- Nita, M.; Ellis, M.A.; Madden, L.V. Reliability and accuracy of visual estimation of Phomopsis leaf blight of strawberry. Phytopathology 2003, 93, 995–1005. [Google Scholar] [CrossRef] [PubMed]
- Chiang, K.S.; Liu, H.I.; Bock, C.H. A discussion on disease severity index values: I. warning on inherent errors and suggestions to maximize accuracy. Ann. Appl. Biol. 2017, 171, 139–154. [Google Scholar] [CrossRef]
- Chiang, K.S.; Bock, C.H.; El Jarroudi, M.; Delfosse, P.; Lee, I.H.; Liu, H.I. Effects of rater bias and assessment method on disease severity estimation with regard to hypothesis testing. Plant. Pathol. 2016, 65, 523–535. [Google Scholar] [CrossRef]
- Chiang, K.S.; Bock, C.H.; Lee, I.H.; El Jarroudi, M.; Delfosse, P. Plant disease severity assessment—How rater bias, assessment method and experimental design affect hypothesis testing and resource use efficiency. Phytopathology 2016, 106, 1451–1464. [Google Scholar] [CrossRef] [PubMed]
- Chiang, K.S.; Liu, H.I.; Tsai, J.W.; Tsai, J.R.; Bock, C.H. A discussion on disease severity index values. Part II: Using the disease severity index for null hypothesis testing. Ann. Appl. Biol. 2017, 171, 490–505. [Google Scholar] [CrossRef]
- Cho, E.K.; Cho, W.T.; Lee, E.J. The causal organism of pear scab in Korea. Korean J. Mycol. 1985, 13, 263–265. [Google Scholar]
- Li, B.; Zhao, H.; Li, B.; Xu, X.M. Effects of temperature, relative humidity and duration of wetness period on germination and infection by conidia of the pear scab pathogen (Venturia nashicola). Plant. Pathol. 2003, 52, 546–552. [Google Scholar] [CrossRef]
- Park, P.; Ishii, Y.; Adachi, Y.; Kanematsu, S.; Ieki, H.; Umemoto, S. Infection behavior of Venturia nashicola, the cause of scab on Asian pears. Phytopathology 2000, 90, 1209–1216. [Google Scholar] [CrossRef]
- Sun, S.K. Fruit Diseases in Taiwan; Shih Way Publishers: Taichung, Taiwan, 2001. [Google Scholar]
- Carlin, B.P.; Louis, T.A. Bayes and Empirical Bayes Methods for Data Analysis, 2nd ed.; Chapman and Hall/CRC Press: Boca Raton, FL, USA, 2000. [Google Scholar]
- Gelman, A.; Carlin, J.B.; Stern, H.S.; Rubin, D.B. Bayesian Data Analysis; Chapman and Hall/CRC Press: Boca Raton, FL, USA, 1995. [Google Scholar]
- Liu, S.C.; Chiang, K.S.; Lin, C.H.; Chung, W.C.; Lin, S.H.; Yang, T.C. Cost analysis in choosing group size when group testing for Potato virus Y in the presence of classification errors. Ann. Appl. Biol. 2011, 159, 491–502. [Google Scholar] [CrossRef]
- Bain, L.J.; Engelhardt, M. Introduction to Probability and Mathematical Statistics, 2nd ed.; Duxbury Press: Pacific Grove, CA, USA, 1992; pp. 283–284. [Google Scholar]
- Lamari, L. ASSESS: Image Analysis Software for Plant Disease Quantification; APS Press: St. Paul, MN, USA, 2002. [Google Scholar]
- R Core Team. R: A Language and Environment for Statistical Computing; R Foundation for Statistical Computing: Vienna, Austria, 2018. [Google Scholar]


| Data Set | Assessment Method 1 | Mean Disease Severities | Overall | Rank | |||||
| 0.01 | 0.05 | 0.10 | 0.20 | 0.30 | 0.40 | ||||
| Simulation study (large variance) | NPE | 8.54 | 22.55 | 78.35 | 239.49 | 437.87 | 451.96 | 1238.75 | 1 |
| HB | 42.39 | 35.98 | 100.32 | 250.65 | 429.65 | 438.37 | 1297.36 | 6 | |
| EI10 | 388.52 | 105.69 | 111.06 | 241.90 | 427.15 | 442.51 | 1716.84 | 7 | |
| AM10 | 12.78 | 26.60 | 83.61 | 255.08 | 434.88 | 445.73 | 1258.68 | 4 | |
| AM20 | 15.15 | 43.92 | 101.50 | 261.36 | 432.26 | 439.79 | 1293.98 | 5 | |
| AM5 | 12.19 | 23.62 | 81.04 | 254.71 | 435.83 | 447.02 | 1254.41 | 2 | |
| AM10f | 12.38 | 25.47 | 83.28 | 255.18 | 435.43 | 446.17 | 1257.90 | 3 | |
| Simulation study (medium variance) | NPE | 4.71 | 7.98 | 29.17 | 98.64 | 181.68 | 262.46 | 584.63 | 1 |
| HB | 32.69 | 13.50 | 51.56 | 139.14 | 201.28 | 259.75 | 697.92 | 5 | |
| EI10 | 354.06 | 30.54 | 31.62 | 100.54 | 184.71 | 265.91 | 967.38 | 7 | |
| AM10 | 8.61 | 14.12 | 34.26 | 105.27 | 202.16 | 296.57 | 661.00 | 4 | |
| AM20 | 11.40 | 34.03 | 86.93 | 123.69 | 200.86 | 290.04 | 746.96 | 6 | |
| AM5 | 7.91 | 10.08 | 29.40 | 104.11 | 202.57 | 297.94 | 652.01 | 2 | |
| AM10f | 7.91 | 11.77 | 34.21 | 105.50 | 202.25 | 296.62 | 658.27 | 3 | |
| Simulation study (small variance) | NPE | 1.12 | 4.08 | 5.18 | 10.96 | 21.54 | 147.22 | 190.10 | 1 |
| HB | 13.31 | 7.73 | 27.22 | 40.17 | 236.39 | 157.86 | 482.68 | 6 | |
| EI10 | 306.01 | 9.16 | 15.50 | 15.94 | 25.77 | 151.53 | 523.92 | 7 | |
| AM10 | 3.65 | 10.66 | 18.19 | 15.74 | 26.04 | 177.88 | 252.16 | 3 | |
| AM20 | 3.84 | 21.35 | 189.88 | 7.44 | 54.30 | 170.53 | 447.35 | 5 | |
| AM5 | 3.57 | 7.48 | 6.59 | 12.05 | 22.91 | 180.01 | 232.61 | 2 | |
| AM10f | 2.19 | 7.09 | 26.22 | 15.65 | 26.04 | 177.82 | 255.02 | 4 | |
| Mean disease severities | |||||||||
| 0.08 | 0.13 | 0.20 | 0.32 | 0.41 | 0.49 | ||||
| Based on estimates of pear scab | NPE | 48.74 | 77.60 | 77.90 | 103.34 | 151.03 | 122.66 | 581.27 | 1 |
| HB | 91.44 | 146.95 | 199.68 | 115.86 | 132.38 | 122.26 | 808.58 | 6 | |
| EI10 | 111.89 | 89.24 | 70.20 | 116.81 | 160.47 | 129.65 | 678.25 | 2 | |
| AM10 | 59.36 | 77.02 | 74.96 | 127.37 | 206.95 | 211.12 | 756.80 | 5 | |
| AM20 | 106.09 | 117.79 | 110.30 | 133.63 | 199.47 | 189.06 | 856.32 | 7 | |
| AM5 | 49.55 | 76.98 | 77.99 | 123.25 | 208.75 | 201.55 | 738.07 | 3 | |
| AM10f | 57.02 | 77.07 | 74.62 | 127.37 | 206.95 | 211.12 | 754.16 | 4 | |
© 2019 by the authors. Licensee MDPI, Basel, Switzerland. This article is an open access article distributed under the terms and conditions of the Creative Commons Attribution (CC BY) license (http://creativecommons.org/licenses/by/4.0/).
Share and Cite
Liu, H.I.; Tsai, J.R.; Chung, W.H.; Bock, C.H.; Chiang, K.S. Effects of Quantitative Ordinal Scale Design on the Accuracy of Estimates of Mean Disease Severity. Agronomy 2019, 9, 565. https://doi.org/10.3390/agronomy9090565
Liu HI, Tsai JR, Chung WH, Bock CH, Chiang KS. Effects of Quantitative Ordinal Scale Design on the Accuracy of Estimates of Mean Disease Severity. Agronomy. 2019; 9(9):565. https://doi.org/10.3390/agronomy9090565
Chicago/Turabian StyleLiu, Hung I., Jia Ren Tsai, Wen Hsin Chung, Clive H. Bock, and Kuo Szu Chiang. 2019. "Effects of Quantitative Ordinal Scale Design on the Accuracy of Estimates of Mean Disease Severity" Agronomy 9, no. 9: 565. https://doi.org/10.3390/agronomy9090565
APA StyleLiu, H. I., Tsai, J. R., Chung, W. H., Bock, C. H., & Chiang, K. S. (2019). Effects of Quantitative Ordinal Scale Design on the Accuracy of Estimates of Mean Disease Severity. Agronomy, 9(9), 565. https://doi.org/10.3390/agronomy9090565