Article

P and K Accumulation by Rapeseed as Affected by Biostimulant under Different NPK and S Fertilization Doses

by
Małgorzata Szczepanek
1,* and
Anetta Siwik-Ziomek
2
1
Department of Agronomy, UTP University of Science and Technology, Kaliskiego 7 str., 85-796 Bydgoszcz, Poland
2
Department of Biogeochemistry and Soil Science, UTP University of Science and Technology, Bernardyńska 6 str., 85-029 Bydgoszcz, Poland
*
Author to whom correspondence should be addressed.
Agronomy 2019, 9(9), 477; https://doi.org/10.3390/agronomy9090477
Submission received: 20 July 2019 / Revised: 13 August 2019 / Accepted: 19 August 2019 / Published: 23 August 2019
(This article belongs to the Section Soil and Plant Nutrition)

Abstract

:
Biostimulants are gaining growing importance among preparations used for plant production. They may cause increasing the effectiveness of nutrient uptake. The aim of the study was to assess P and K accumulation by winter rapeseed after the application of a biostimulant under conditions of varied NPK and S fertilization levels. The field experiment was established on Alfisol, and the factors were: Two levels of NPK fertilization (high 180 N, 70 P, 132 K (kg ha−1) or low 144 N, 35 P, 66 K (kg ha−1)); elementary S fertilization (36 or 0 kg ha−1) and application of seaweed biostimulant or without that treatment. Biostimulant caused an increase in P and K accumulation in the shoots of rapeseed during generative development. Application of biostimulant in rapeseed fertilized with lower NPK rates or not fertilized with S increased P and K accumulation in shoots to the level obtained at higher NPK and S rates without that treatment. Increased level of NPK fertilization caused an increase in P and K accumulation in both shoots and roots at flowering and ripening stages. At the fruit development stage, under higher NPK fertilization there was higher uptake of P and K in rapeseed shoots after presowing fertilization with S.

1. Introduction

Winter rapeseed (Brassica napus L.) is the most important oil crop in Europe. In recent years (2015–2017), this species was cultivated in the area of 8.1–8.8 mln ha, [1]. During this period, the average production yields (2.8–3.0 t∙ha−1) were 33–38% lower than potential yields [1]. Therefore, it is important to look for methods that can lead to higher rapeseed production and can increase its resilience to the pressure from changing environmental factors (drought, pressure of pathogens and pests, nutrient deficiency). Application of biostimulats, such as marine algae, is an alternative method that can support growth and hardiness a plant [2,3,4]. Beneficial effects of algae extracts indicate their usefulness not only for horticulture crops but also for grown on large-scale commodity crops [2,3]. After, applications of biostimulants plants are more resistant to stress [4,5]. It has also been proved that biostimulants improve the uptake and accumulation of macro and microelements [6,7,8,9,10,11,12,13], which may have a favorable effect on yields of cultivated crops. For winter rapeseed, K and P are important nutrients. Nutritional requirements of rapeseed for these macroelements are much higher than for cereal crops, but only a small part of them is removed with seeds [14,15]. Despite the high soil abundance of P and K, plants may be malnourished [16]. Potassium is taken up by rapeseed in the largest amounts [17,18]. Insufficient availability of this nutrient strongly limits the growth and yield of rapeseed [19,20]. According to Szczepaniak [18], the number of seeds in pods, as a prerequisite of the final yield, depends on the K management pattern in rapeseed canopy before and after the flowering stage. In turn, P deficiency restricts both aboveground biomass and root growth [20,21]. Increase of available P in soil have led to a significant increase in rapeseed yield [22]. Winter rapeseed demonstrates a high demand for S [23], but soil enrichment from atmospheric S pollution has been reduced by 85% in the last three decades [24]. Combined with an increased S removal by high yielding cultivars of rapeseed, and suboptimal S fertilization regimes, it appears that soil S deficiency has become a problem over the recent years [25].
Many researchers indicate the mutual relationship of nutrients (N, P, K and others) in affecting their accumulation, aboveground and belowground biomass production and seed yield of rapeseed [18,19,26,27]. Deficiency of any nutrient limits the growth and crop yield [14,15,16]. Increasing rates of one component, in turn, results in higher requirements for the others [15]. According to Wang et al. [21], a balanced application of nutrients should be considered with the aim to build an appropriate population structure with balanced plant density for optimum growth of every individual rapeseed plant.
The aim of this study was to assess P and K accumulation by the shoots and roots of winter rapeseed at successive stages of generative development: Flowering, fruit development and ripening, after the application of a seaweed biostimulant under varied NPK fertilization levels (high and low), as well as after and without fertilization with S.

2. Materials and Methods

2.1. Experimental Location and Treatment

The field experiment was conducted in Poland, in the Kuyavian-Pomeranian region (53°13′ N, 17°51′ E). The subject of the study was ‘Chagall’ winter rapeseed cultivar between 2011–2013 growing seasons. The experiment was establish on Alfisol (USDA), where the topsoil was characterized by a medium content of available P (64.0 mg kg−1) and high of K (126.0 mg kg−1) (both determined with the Egner-Riehm method) and a slightly acidic reaction (pH in 1 M KCL 5.7-6.1) (with the use of potentiometry). The content of organic carbon 7.55–7.80 g kg−1 and total N 0.69–0.75 g kg−1 in the soil was relatively low [28].
The experimental factors were: Two NPK fertilization rates (i); fertilization with S (ii) and the application of the biostimulant (iii) (Table 1). Low fertilization level, followed the standard NPK fertilization dose, commonly used at the location of the study. High fertilization level was determined, taking into consideration soil nutrient content, unit uptake and the expected yield. Mineral fertilization into soil, with P, K and S, was applied presowing in autumn, whereas N was applied in spring, at starting growth (100 kg ha−1), and the remaining amount after three weeks. The biostimulant Kelpak was applied in autumn after the formation of 4–5 leaves, and in spring 10–15 days after starting growth. This biostimulant is obtained from marine macroalga (Ecklonia maxima Osbeck) belonging to the division of brown algae (Phaeophyta), collected on the African coast. It contains phytohormones: Auxins and cytokinins, alginate, amino acids, as well as small amounts of macro and microelements (Table 2) [29,30]. The experiment was established in the randomized split-block design, with four replications, and area of each the plot was 13 m2.

2.2. Plant Sampling and Chemical Analysis

Plant samples were collected three times every 30 days at the following developmental stages: flowering, development of fruit and ripening, from the area of 0.5 m2. Accumulation of elements was expressed as a product of their content and the amount of the dry matter of the aboveground part (shoots) and the roots. Before determination of the macroelements content, mineralization was performed with the use of H2SO4 and H2O2. P content was determined with the vanadium-molybdenum method and K with the flame photometry [31,32,33].

2.3. Statistical Analysis

The obtained results were analyzed statistically using the statistical program Analysis of variance for orthogonal experiments by the UTP University of Science and Technology in Bydgoszcz, Poland. The differences between the values were verified with Tukey’s test. Internal nutrient efficiency (IE) (kg kg−1) is the seed yield divided by nutrient accumulation in the above-ground part. Reciprocal internal nutrient efficiency (RIE) (kg 1000 kg−1) is the nutrient uptake in above-ground part divided by seed yield ×1000 [34,35].

3. Results

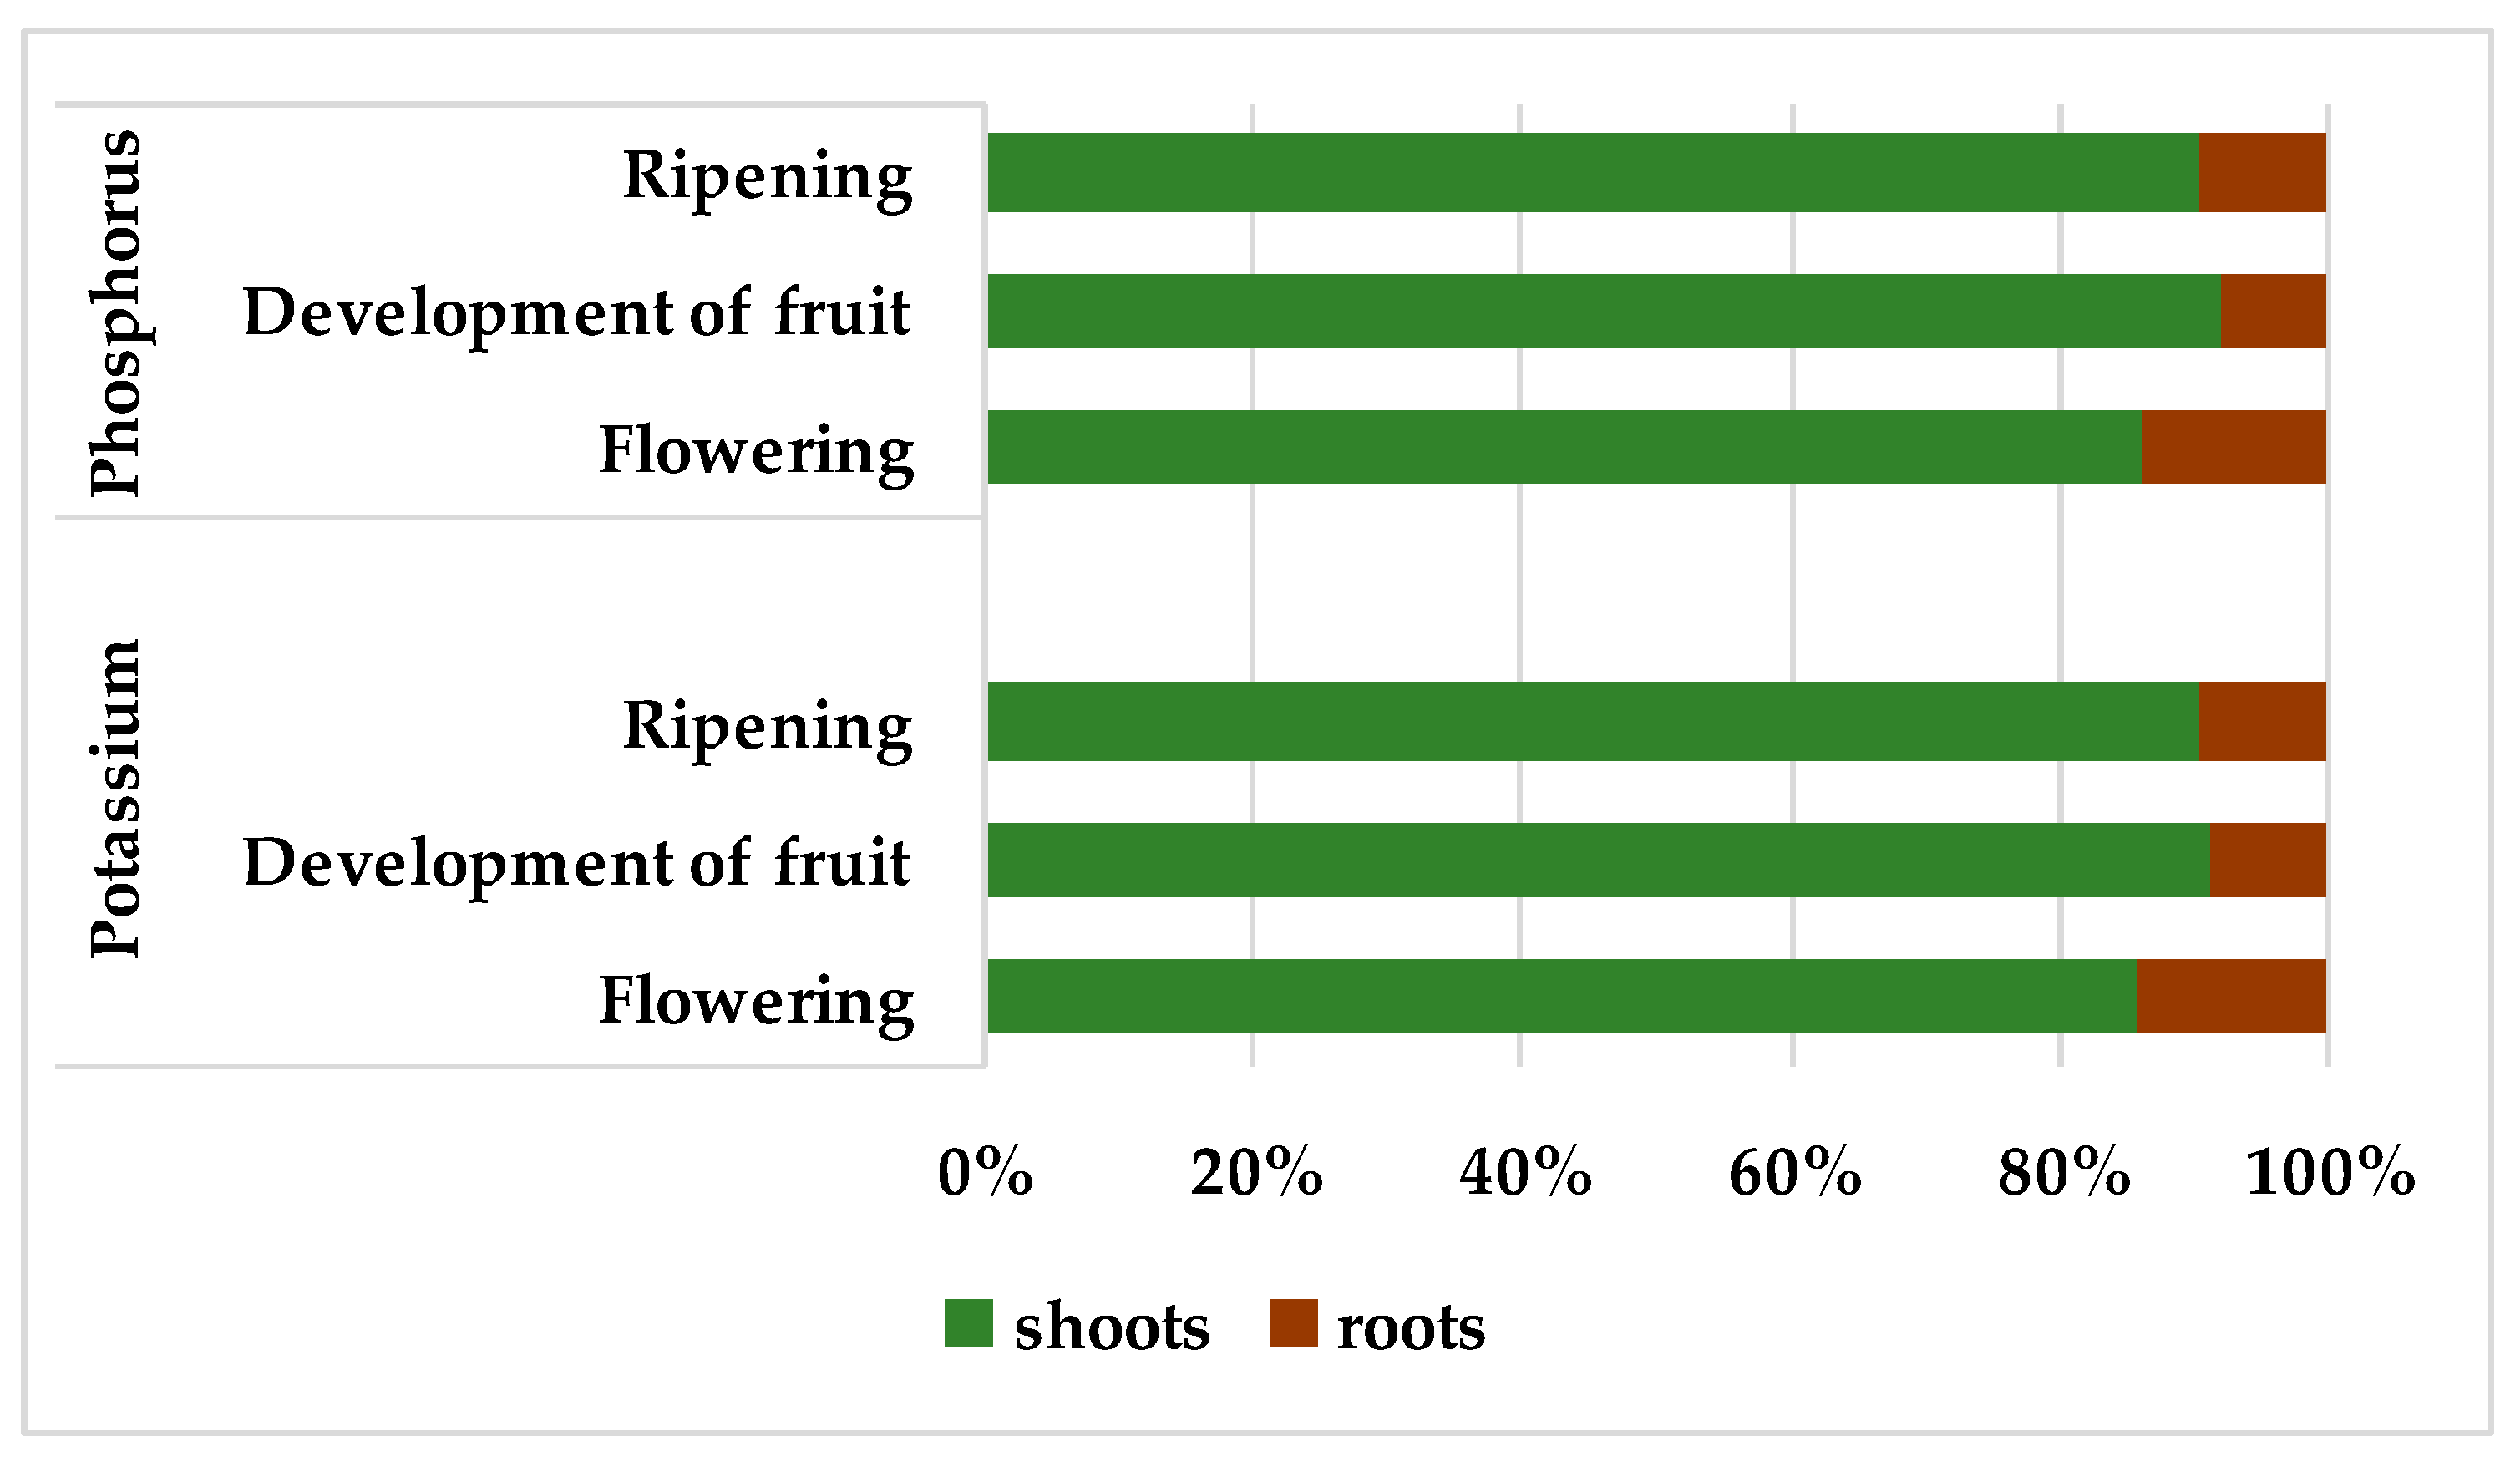
The percentage of shoots in the total P and K accumulation in the whole plant of winter rapeseed, accounted for approximately 89% for both macronutrients, on average across flowering, development of fruit and ripening stages (Figure 1). The accumulation of P and K in roots, on average for these three generative stages, accounted for 11%, and it was the highest (14%) at flowering.
The application of the seaweed biostimulant, on average for the other experimental treatments, increased P accumulation in shoots at each developmental stage (Table 3 and Table 4). Moreover, at all growing stages, after the biostimulant application, P uptake in the rapeseed shoots at the lower NPK fertilization level was similar to that after the use of higher fertilization rates without the biostimulant. A similar effect of the seaweed extract was found in treatments with varying S fertilization levels.
Accumulation of P in rapeseed shoots increased with crop development progression, and the increase was the highest between the flowering stage and fruit development (Table 4).
Favorable effect of the biostimulant on the averaged P accumulation, at the flowering and ripening stages, was also prominent in rapeseed roots (Table 3 and Table 5). Interaction of the biostimulant and S fertilization at flowering and ripening indicates that P uptake in the roots was higher after the biostimulant application only when rapeseed was fertilized with S.
On average, for the other factors, increased NPK fertilization level caused a significant increase in P accumulation in the shoots and roots at all developmental stages (Table 3, Table 4 and Table 5). Rapeseed fertilized with S accumulated significantly more P in the shoots only at the flowering and fruit development stages. However, no significant effect of S fertilization on P accumulation in roots was found. At the fruit development stage, however, a significant interaction of NPK and S fertilization on P accumulation in shoots and roots was indicated. Only at the higher NPK fertilization level rapeseed fertilized with S accumulated significantly more P, compared with the same treatment that did not receive S.
Application of the biostimulant, the use of the higher NPK fertilization level or fertilization with S caused an increase in K accumulation in shoots at each analyzed stage of generative development (Table 6 and Table 7). A significant interaction of NPK and S fertilization at the fruit development stage indicates that only at the higher NPK rates, the application of S caused an increase in K accumulation in shoots. Application of biostimulat resulted that K accumulation in shoots of rapeseed, at each development stage, under either lower NPK fertilization level or without fertilization with S was similar to treatments receiving higher NPK rates or S without biostimulat application.
Accumulation of K in winter rapeseed shoots was 2.7 times higher at the fruit development stage than at the flowering stage (Table 7). A further increase in accumulation of this nutrient until the ripening stage was slow—reaching only 14.5%.
In the case of rapeseed roots, the increase of K accumulation at the higher NPK fertilization level was recorded at each developmental stage and after the biostimulant application, but there were no reactions to S fertilization (Table 6 and Table 8).
On average in the period of generative growth, there was an increase in seed yield per 1 kg of the nutrient accumulated in the aboveground part (IE), amounted to 103 kg ha−1 for P and 20 kg ha−1 for K (Table 9). IE was lower at the higher cultivation technology level (after the application of high NPK rates, as well as after the application of S or the biostimulant).
Uptake of both nutrients (P and K) per seed yield unit (RIE) increased at successive stages of generative development. RIE of P during the ripening stage was close to 2 and K was 3.4 times higher compared with the flowering stage. RIE of P and K, on average at the generative developmental stages, was similar at a higher and lower level of NPK fertilization. Sulphur fertilization, in turn, caused an increase in RIE as compared with the lack of fertilization with that element by 7.6% and 6.2%, respectively. Similarly, after the biostimulant application, RIE of P and K was higher than without the application by 8.8% and 7.0%, respectively.

4. Discussion

Winter rapeseed accumulates the highest amount of nutrients in shoots, and only their small portion in roots [6]. In the present study, the proportion of aboveground part in the total P and K accumulation on average in the period of generative development accounted for about 90% (Figure 1). This proportion for both elements was slightly lower at the flowering stage as compared with the fruit development and ripening stages. In the study by Billard et al. [6], the proportion of P and K accumulation in the aboveground biomass of young (37 day) rapeseed plants were still lower and amounted to 74%.
P and K accumulation in shoots increased at the successive stages of generative development, and this increase was the highest between the flowering and fruit development stages (Table 4 and Table 7). Barłóg and Grzebisz [36] also report a considerable increase in P and K accumulation during that period. According to these authors, increasing the accumulation of nutrients during the generative growth results from a very intensive increase in dry matter production. Szczepaniak [18] reports that the pattern of K uptake by stems, since the onset of flowering significantly affected the structural yield components. This relationship can be explained by the requirements of growing seeds during plant ripening.
In our study, the application of the biostimulant increased P and K accumulation in the aboveground biomass of rapeseed at the flowering, fruit development and ripening stages (Table 4 and Table 7). Also, a favorable effect of the biostimulant on the accumulation of these elements in roots was recorded (P at the flowering and ripening stages, and K at each developmental stage) (Table 5 and Table 8). After the biostimulant application, P and K uptake in the aboveground part at the lower NPK fertilization level was similar to that after the use of higher rates without the preparation. Similar effect of the biostimulant was found in treatments with varied fertilization with S. Increase in P and K uptake after the application of biostimulants was also shown in the studies on different crops [9]. The effect of these preparations results from the stimulation of many physiological processes responsible for the growth and development of above- and underground biomass [37,38,39,40]. In the case of rapeseed, it was stated that the extract from algae increased the accumulation of P, as well as of N and Ca [6]. Those increases were explained by plant growth stimulation. The study by Jannin et al. [7] proved an increase in the expression of genes responsible for nutrient uptake of rapeseed after the application of preparations from algae. Whereas, Billard et al. [6] proved a decrease in the number of chloroplasts per leaf cell and root biomass production. According to Schnepf et al. [41], young parts of the roots system are responsible for most of the P uptake. Increase in NPK fertilization rate causes, on average for the biostimulant application and fertilization with S, an increase in P and K accumulation in the aboveground part and in the roots at all the studied developmental stages (Table 4, Table 5, Table 6, Table 7 and Table 8). Rapeseed fertilized with S accumulated significantly more K in the aboveground part at each stage of generative development and more P at the flowering and fruit development stages. Similar relationships are presented by Szczepaniak [18]. In his study, K accumulation in rapeseed at flowering and ripening was higher if the plants were fertilized with NPK as compared with the control. Zou et al. [35] proved an increase in K concentration in plants after the fertilization of rapeseed with this macronutrient. Wang et al. [21] report that the accumulation of nutrients in the plant changes depending on their concentration in plant and dry matter production, whereas the dry matter production is fundamentally important. Reduction in the rates of elements limits biomass production [14,19,21], as well as the element concentration [16,21], and thus, the degree of their accumulation [21]. According to Brennan and Bolland [26], the response of rapeseed to P and K fertilization also depends on the content of these elements in the soil. Similarly, Gaj [17] shows the essential role of soil resources of available K forms in the state of plant nutrition with this element.
At the fruit development stage, there was a significant interaction between NPK and S fertilization in P and K accumulation in the aboveground parts, as well as in P accumulation in the roots (Table 3 and Table 6). Only at the high NPK fertilization level rapeseed fertilized with S accumulated significantly more P and K as compared with that not fertilized. The literature data shows that the accumulation of the given nutrients by rapeseed depends on the availability of the other ones. Wang et al. [21] claim that P uptake is reduced by N and K deficiency, and K uptake is lower both at the lesser availability of K, and also the deficiency of N and P. According to Gaj [16], K deficiency limits N accumulation and transport, which leads to a reduction in growth and assimilation area. Szczepaniak [18] proved that N accumulation at the beginning of the flowering of rapeseed depended on K accumulation in the aboveground part. Application of some nutrients (e.g., N) has a strong effect on dry matter increase, which results in increased demand for the other elements. Therefore, balanced fertilization is essential for increasing the yield. Giovahi and Saffari [19] indicated K and S interaction in dry matter production. Brenan and Bolland [15,27] proved that for obtaining high yields of rapeseed at a growing level of fertilization with N, it is necessary to increase P and K rates.
Increase in seed yield per 1 kg of P and K accumulated in the aboveground part (IE) was reduced, and the uptake of those elements per 1000 kg ha−1 of seed yield (RIE) was greater at successive stages of generative development (Table 9). IE was smaller at the higher level of cultivation practices (after the application of higher NPK rates, as well as in the case of fertilization with S or application of the biostimulant). Similarly, Zou et al. [35] indicated a decrease in this indicator value at the increased fertilization value. When plants were well fertilized, with an additional uptake stimulation coming from biostimulant application, the nutrients accumulation in the plant increased; but, the increase in yield was not proportional. According to Ren et al. [34], P and K uptake by rapeseed increases linearly until the yield reaches 0.6–0.7 of the potential yield. However, when the target yield approaches the yield potential, a decrease in IE is detected.

5. Conclusions

Application of a seaweed biostimulant in the period of generative growth from flowering to ripening caused an increase in P and K accumulation in shoots of winter rapeseed both at a lower and higher NPK fertilization level, as well as after and without fertilization with S. Biostimulant application in rapeseed fertilized with lower NPK rates or not fertilized with S increased P and K accumulation up to the level reached at higher NPK rates and S fertilization, but without the biostimulant.
The seed yield per unit of P and K accumulated in shoots decreases at a higher input level (higher NPK rates, fertilization with S and the biostimulant application). The highest increase in P and K uptake per 1000 kg of seed yield was caused by the biostimulant application.

Author Contributions

Conceptualization, M.S.; methodology M.S.; validation M.S. and A.S.Z.; formal analysis, M.S.; investigation, M.S.; data curation, M.S.; writing—original draft preparation, M.S. and A.S.Z.; writing—review and editing, M.S. and A.S.Z.; visualization, M.S.

Funding

This research received no external funding.

Conflicts of Interest

The authors declare no conflict of interest.

References

  1. FAOSTAT. Available online: http://faostat3.fao.org/ (accessed on 15 July 2019).
  2. Craigie, J. Seaweed extract stimuli in plant science and agriculture. J. Appl. Phycol. 2011, 23, 371–393. [Google Scholar] [CrossRef]
  3. Khan, W.; Rayireth, U.; Subramanian, S.; Jithesh, M.; Rayoreth, P.; Hodges, M.; Critchley, A.; Craigie, J.; Norrie, J.; Prithiviraj, B. Seaweed extracts as biostimulants of plant growth and development. J. Plant. Growth Regul. 2009, 28, 386–399. [Google Scholar] [CrossRef]
  4. Sharma, S.H.S.; Fleming, C.; Selby, C.; Rao, J.R.; Trevor, M. Plant biostimulants: A review on the processing of macroalgae and use of extracts for crop management to reduce abiotic and biotic stresses. J. Appl. Phycol. 2014, 26, 465–490. [Google Scholar] [CrossRef]
  5. Stadnik, M.J.; de Freitas, M.B. Algal polysaccharides as source of plant resistance inducers. Trop. Plant. Pathol. 2014, 39, 111–118. [Google Scholar] [CrossRef] [Green Version]
  6. Billard, V.; Etienne, P.; Jannin, L.; Garnica, M.; Cruz, F.; Gracia-Mina, J.-M.; Yvin, J.-C.; Ourry, A. Two biostimulants delivered from algae or humic acid induce similar response in the mineral content and gene expression of winter oilseed rape. J. Plant. Growth Regul. 2014, 33, 305–316. [Google Scholar] [CrossRef]
  7. Jannin, L.; Arkoun, M.; Etienne, P.; Laine, P.; Goux, D.; Garnica, M.; Fuentes, M.; San Francisco, M.; Baigorri, R.; Cruz, F.; et al. Brassica napus growth is promoted by Ascophyllum nodosum (L.) Le Jol. seaweed extract: Microarray analysis and physiological characterization of N, C, and S metabolisms. J. Plant. Growth Regul. 2012, 32, 31–52. [Google Scholar] [CrossRef]
  8. Papenfus, H.B.; Kulkarni, M.G.; Stirk, W.A.; Finnie, J.F.; Van Staden, J. Effect of a commercial seaweed extract (Kelpak®) and polyamines on nutrient-deprived (N, P and K) okra seedlings. Sci. Hortic. 2013, 151, 142–146. [Google Scholar] [CrossRef]
  9. Shah, M.T.; Zodape, S.T.; Chaudhary, D.R.; Eswaran, K.; Chikara, J. Seaweed SAP as an alternative liquid fertilizer for yield and quality improvement of wheat. J. Plant. Nutr. 2013, 36, 192–200. [Google Scholar] [CrossRef]
  10. Szczepanek, M.; Wilczewski, E.; Pobereżny, J.; Wszelaczyńska, E.; Keutgen, A.; Ochmian, I. Effect of biostimulants and storage on macroelement content in storage roots of carrot. J. Elem. 2015, 20, 1021–1031. [Google Scholar] [CrossRef]
  11. Szczepanek, M.; Wilczewski, E.; Siwik-Ziomek, A. Effect of biostimulant on the accumulation of the Mg in winter oilseed rape under different mineral fertilization doses. J. Elem. 2017, 22, 1375–13858. [Google Scholar] [CrossRef]
  12. Siwik-Ziomek, A.; Szczepanek, M. Soil enzyme activity and sulphur uptake by oilseed rape depending on fertilization and biostimulant application. Acta Agri. Scan. B Soil Plant. Sci. 2018, 68, 50–56. [Google Scholar] [CrossRef]
  13. Karapouloutidou, S.; Gasparatos, D. Effects of Biostimulant and Organic Amendment on Soil Properties and Nutrient Status of Lactuca Sativa in a Calcareous Saline-Sodic Soil. Agriculture 2019, 9, 164. [Google Scholar] [CrossRef]
  14. Brennan, R.F.; Bolland, M.D.A. Comparing the nitrogen and phosphorus requirements of canola and wheat for grain yield and quality. Crop. Pasture Sci. 2009, 60, 566–577. [Google Scholar] [CrossRef]
  15. Brennan, R.F.; Bolland, M.D.A. Comparing the nitrogen and potassium requirements of canola and wheat for yield and grain quality. J. Plant. Nutr. 2009, 32, 2008–2026. [Google Scholar] [CrossRef]
  16. Gaj, R. Effect of diversified phosphorus and potassium fertilization on plant nutrition at the stage of initial main shoot development and the yield and oil content in the seeds of winter rapeseed. Acta Sci. Pol. Agric. 2011, 10, 57–68. [Google Scholar]
  17. Gaj, R. Effect of different level of potassium fertilization on winter oilseed rape nutritional status at the initiation of the main stem growth and on the seed yield. Oilseed Crop. 2010, 31, 115–124. [Google Scholar]
  18. Szczepaniak, W. The mineral profile of winter oilseed rape in critical growth stages—Potassium. J. Elem. 2014, 19, 203–215. [Google Scholar] [CrossRef]
  19. Giovahi, M.; Saffari, M. Effect of potassium and sulphur fertilizers on yield, yield components and seed quality of spring canola (Brassica napus L.) seed. J. Agron. 2006, 5, 577–582. [Google Scholar] [CrossRef]
  20. Grant, C.A.; Bailey, L.D. Fertility management in canola production. Can. J. Plant. Sci. 1993, 73, 651–670. [Google Scholar] [CrossRef]
  21. Wang, Y.; Liu, T.; Li, X.K.; Ren, T.; Cong, R.H.; Lu, J.W. Nutrient deficiency limits population development, yield formation, and nutrient uptake of direct sown oilseed rape. J. Integr. Agric. 2015, 14, 670–680. [Google Scholar] [CrossRef]
  22. Lickfett, T.; Mätthaus, B.; Velasco, L.; Möllers, C. Seed yield, oil and phytate concentration in the seeds of two oilseed rape cultivars as affected by different phosphorus supply. Eur. J. Agron. 1999, 11, 293–299. [Google Scholar] [CrossRef]
  23. Zhao, F.J.; McGrath, S.P.; Blake-Kalff, M.A.; Link, A.; Tucker, M. Crop response to sulphur fertilization in SP Europe. Fert. Fertil. 2003, 3, 26–47. [Google Scholar]
  24. Sarda, X.; Diquelou, S.; Abdallah, M.; Nesi, N.; Cantat, O.; Le Gouee, P.; Avice, J.C.; Ourry, A. Assessment of sulphur deficiency in commercial oilseed rape crops from plant analysis. J. Agric. Sci. 2014, 152, 616–633. [Google Scholar] [CrossRef]
  25. Malhi, S.S.; Gan, Y.; Raney, J.P. Yield, seed quality, and sulphfur uptake of Brassica oilseed crops in response to sulphur fertilization. Agron. J. 2007, 99, 570–577. [Google Scholar] [CrossRef]
  26. Brennan, R.F.; Bolland, M.D.A. Influence of potassium and nitrogen fertiliser on yield, oil and protein concentration of canola (Brassica napus L.) grain harvested in south-western Australia. Aust. J. Exp. Agric. 2007, 47, 976–983. [Google Scholar] [CrossRef]
  27. Brennan, R.F.; Bolland, M.D.A. Effect of fertiliser phosphorus and nitrogen on the concentrations of oil and protein in grain and the grain yield of canola (Brassica napus L.) grown in south-western Australia. Aust. J. Exp. Agric. 2007, 47, 984–991. [Google Scholar] [CrossRef]
  28. Mocek, A.; Drzymała, S.; Maszner, P. Genesis, Analysis and Classification of Soils; University Publisher Poznań University of Life Sciences: Poznań, Poland, 1997. [Google Scholar]
  29. Kelpak. Available online: http://kelpak.pl/ (accessed on 9 August 2019).
  30. Lötze, E.; Hoffman, E.W. Nutrient composition and content of various biological active compounds of three South African-based commercial seaweed biostimulants. J. Appl. Phycol. 2016, 28, 1379–1386. [Google Scholar] [CrossRef]
  31. Roussos, P.A.; Gasparatos, D.; Kechrologou, K.; Katsenos, P.; Bouchagier, P. Impact of organic fertilization on soil properties, physiology and yield in two newly planted Greek olive (Olea europaea L.) cultivars under Mediterranean conditions. Sci. Hortic. 2017, 220, 11–19. [Google Scholar] [CrossRef]
  32. Polish Committee for Standardization. Animal Feeding Stuffs-Determination of Phosphorus; PN-ISO 6491; Polish Committee for Standardization: Warsaw, Poland, 2000.
  33. Polish Committee for Standardization. Animal Feeding Stuffs-Determination of Calcium, Copper, Iron, Magnesium, Manganese, Potassium, Sodium and Zinc; PN-EN ISO 6869; Polish Committee for Standardization: Warsaw, Poland, 2002.
  34. Ren, T.; Zou, J.; Wang, Y.; Li, X.K.; Cong, R.H.; Lu, J.W. Estimating nutrient requirements for winter oilseed rape based on QUEFTS analysis. J. Agric. Sci. 2016, 154, 425–437. [Google Scholar] [CrossRef]
  35. Zou, J.; Lu, J.W.; Li, Y.S.; Li, X.K. Regional evaluation of winter rapeseed response to K fertilization, K use efficiency, and critical level of soil K in the Yangtze River Valley. Agric. Sci. China 2011, 10, 911–920. [Google Scholar] [CrossRef]
  36. Barłóg, P.; Grzebisz, W. Growth dynamics, yield and nutrient uptake by winter oilseed rape fertilized with three types of nitrogenous fertilizer and a method of the second nitrogen rate division. Oilseed Crop. 2000, 21, 85–96. [Google Scholar]
  37. Kocira, S.; Szparaga, A.; Kocira, A.; Czerwińska, E.; Wójtowicz, A.; Bronowicka-Mielniczuk, U.; Koszel, M.; Findura, P. Modeling biometric traits, yield and nutritional and antioxidant properties of seeds of three soybean cultivars through the application of biostimulant containing seaweed and amino acids. Front. Plant. Sci. 2018, 9, 388. [Google Scholar] [CrossRef] [PubMed]
  38. Kocira, S.; Szparaga, A.; Kuboń, M.; Czerwińska, E.; Piskier, T. Morphological and biochemical responses of Glycine max (L.) Merr. to the use of seaweed extract. Agronomy 2019, 9, 93. [Google Scholar] [CrossRef]
  39. Kurepin, L.; Zaman, M.; Pharis, R.P. Phytohormonal basis for the plant growth promoting action of naturally occurring biostimulators. J. Sci. Food Agric. 2014, 94, 1715–1722. [Google Scholar] [CrossRef] [PubMed]
  40. Tarakhovskaya, E.R.; Maslov, Y.I.; Shishova, M.F. Phytohormones in algae. Russ. J. Plant. Physiol. 2007, 54, 163–170. [Google Scholar] [CrossRef]
  41. Schnepf, A.; Leitner, D.; Klepsch, S. Modeling phosphorus uptake by a growing and exuding root system. Vadose Zone J. 2012, 11, 1–10. [Google Scholar] [CrossRef]
Figure 1. Participation of shoots and roots in the total P and K accumulation in rapeseed in generative development stages (%).
Agronomy 09 00477 g001
Table 1. Experimental treatments: NPK fertilization—nitrogen (N), phosphorus (P), and potassium (K); fertilization with sulphfur (S); biostimulant application.
Specification
Nutrient Doses (kg ha−1)
N180P70K132N144P35K66
N (ammonium nitrate)180144
P (triple superphosphate)7035
K (potash salt)13266
S36S0
S (Wigor S)360
Biostimulant doses (dm3 ha−1)
Seaweed extract Kelpak2 dm3 in autumn
+2 dm3 in spring
control
(without treatment)
Table 2. Composition of the biostimulant Kelpak.
Specification
Auxin 11 mg·dm−3Cytokinin 0.03 mg·dm−3
NPKCaMgNa
%mg·kg−1 fresh weight
0.0990.77163.3190.4337.21623.7
MnFeCuZnB
mg·kg−1 fresh weight
17.340.713.517.033.0
Free phosphateMannitolUronic acidsNeutral sugarsAlginate
mMmg·dm−3g·dm−3
1.722611.661.081.5
Amino acids mg·100 g−1
HistidineSerineArginineGlycineAspartic acidGlutamic acid
4.6–4.918.5–23.117.7–20.223.0–26.167.3–74.878.5–79.5
ThreonineAlanineProlineCysteineLysineTyrosine
19.6–22.960.9–70.219.9–21.30.3–0.418.3–20.56.9–9.2
MethionineValineIsoleucineLeucinePhenylalanineTotal
2.3–3.025.0–28.414.3–16.123.5–25.414.7–16.7436.7–441.3
Table 3. Accumulation of P. Significance of experimental factors and their interaction, * P ≤ 0.05; ** P ≤ 0.01, mean 2011–2013.
Growing StagePlant PartTreatment
NPK SBNPK × SNPK × BS × B
FloweringShoots*****n.sn.sn.s
Roots**n.s*n.sn.s*
Development of fruitShoots******n.sn.s
Roots**n.sns*n.sn.s
RipeningShoots**n.s**n.sn.sn.s
Roots**n.s**n.sn.s*
NPK—doses of nitrogen, phosphorus and potassium, S—fertilization with sulphur; B—biostimulant application.
Table 4. Accumulation of P in shoots of rapeseed in generative development stages depending on mineral fertilization doses and application of biostimulant, mean from 2011–2013 (kg ha−1).
TreatmentFertilization Doses
N180P70K132N144P35K66S36S0Mean
S36S0MeanS36S0Mean
Flowering
Biostimulant32.225.829.025.224.724.928.725.327.0
Control25.624.224.922.719.921.324.122.023.1
Mean28.925.027.023.922.323.126.423.725.0
Development of fruit
Biostimulant44.337.340.836.834.435.640.535.938.2
Control37.933.835.832.133.833.035.033.834.4
Mean41.135.638.334.534.134.337.834.836.3
Ripening
Biostimulant52.040.446.242.541.542.047.341.044.1
Control41.641.241.433.933.433.737.837.337.5
Mean46.840.843.838.237.537.842.539.240.8
Table 5. Accumulation of P in roots of rapeseed in generative development stages depending on mineral fertilization doses and biostimulant application, mean from 2011–2013 (kg ha−1).
TreatmentFertilization Doses
N180P70K132N144P35K66S36S0Mean
S36S0MeanS36S0Mean
Flowering
Biostimulant5.634.094.863.713.773.744.673.934.30
Control3.834.694.263.403.393.393.624.043.83
Mean4.734.394.563.563.583.574.143.984.06
Development of fruit
Biostimulant4.083.393.732.732.732.733.403.063.23
Control3.443.163.302.362.812.592.902.992.94
Mean3.763.273.522.552.772.663.153.023.09
Ripening
Biostimulant5.634.625.124.404.064.235.014.344.68
Control4.214.534.373.833.903.864.024.214.11
Mean4.924.574.744.113.984.054.514.284.40
Table 6. Accumulation of K. Significance of experimental factors and their interaction, * P ≤ 0.05; ** P ≤ 0.01, mean 2011–2013.
Growing StagePlant PartTreatment
NPK SBNPK × SNPK × BS × B
FloweringShoots***n.sn.sn.s
Roots**n.s*n.sn.sn.s
Development of fruitShoots********n.sn.s
Roots**n.s*n.sn.sn.s
RipeningShoots****n.sn.sn.s
Roots**n.s**n.sn.sn.s
NPK—doses of nitrogen, phosphorus and potassium, S—fertilization with sulphur; B—biostimulant application.
Table 7. Accumulation of K in shoots of rapeseed in generative development stages depending on mineral fertilization doses and biostimulant application, mean from 2011–2013 (kg ha−1).
TreatmentFertilization Doses
N180P70K132N144P35K66S36S0Mean
S36S0MeanS36S0Mean
Flowering
Biostimulant144115130107111109126113119
Control113111112106879610999104
Mean12811312110799103117106112
Development of fruit
Biostimulant388309348294289291341299320
Control323282302269272271296277287
Mean355296325282280281319288303
Ripening
Biostimulant469331400341337339405334370
Control360348354302288295331318325
Mean415339377321313317368326347
Table 8. Accumulation of K in roots of rapeseed in generative development stages depending on mineral fertilization doses and biostimulant application, mean from 2011–2013 (kg ha−1).
TreatmentFertilization Doses
N180P70K132N144P35K66S36S0Mean
S36S0MeanS36S0Mean
Flowering
Biostimulant27.618.623.116.917.717.322.218.120.2
Control18.319.018.717.015.416.217.717.217.4
Mean23.018.820.916.916.516.719.917.718.8
Development of fruit
Biostimulant36.930.833.828.425.627.032.628.230.4
Control30.628.329.424.827.025.927.727.627.6
Mean33.729.531.626.626.326.430.127.929.0
Ripening
Biostimulant47.939.043.537.634.436.042.836.739.7
Control37.136.636.930.733.131.933.934.934.4
Mean42.537.840.234.233.834.038.435.837.1
Table 9. Internal efficiency and reciprocal internal efficiency P and K, mean from 2011–2013 (kg ha−1).
Growing StageTreatmentsMean
N180P70K132N144P35K66S36S0BiostimulantControl
Internal P efficiency
Flowering136.3143.6136.9143.1134.6145.4140.0
Development of fruit92.995.592.995.592.296.294.2
Ripening89.298.492.894.887.5100.193.8
Internal K efficiency
Flowering34.737.935.037.634.438.336.3
Development of fruit12.412.712.212.912.212.812.6
Ripening10.111.310.411.010.311.010.7
Reciprocal P internal efficiency
Flowering7.77.68.07.48.07.37.7
Development of fruit11.511.911.911.512.111.311.7
Ripening14.815.515.514.015.914.515.2
Reciprocal K internal efficiency
Flowering34.634.335.433.536.132.834.5
Development of fruit89.586.090.285.389.785.887.8
Ripening117.4115.6120.3112.7121.0112.0116.5

