Article

Effect of Straw Biochar on Soil Properties and Wheat Production under Saline Water Irrigation

1
College of Agricultural Engineering, Hohai University, Nanjing 210098, China
2
College of Water Conservancy and Hydropower Engineering, Hohai University, Nanjing 210098, China
*
Author to whom correspondence should be addressed.
Agronomy 2019, 9(8), 457; https://doi.org/10.3390/agronomy9080457
Submission received: 5 July 2019 / Revised: 12 August 2019 / Accepted: 14 August 2019 / Published: 15 August 2019

Abstract

:
Use of saline water for irrigation is essential to mitigate increasing agricultural water demands in arid and semi-arid regions. The objective of this study is to address the potential of using straw biochar as a soil amendment to promote wheat production under saline water irrigation. A field experiment was conducted in a clay loam soil from eastern China during 2016/2017 and 2017/2018 winter wheat season. There were five treatments: freshwater irrigation (0.3 dS m−1), saline water irrigation (10 dS m−1), saline water irrigation (10 dS m−1) combined with biochar of 10, 20, 30 t ha−1. Saline water irrigation alone caused soil salinization and decreased wheat growth and yield. The incorporation of biochar decreased soil bulk density by 5.5%–11.6% and increased permeability by 35.4%–49.5%, and improved soil nutrient status. Biochar also reduced soil sodium adsorption ratio by 25.7%–32.6% under saline water irrigation. Furthermore, biochar alleviated salt stress by maintaining higher leaf relative water content and lower Na+/K+ ratio, and further enhanced photosynthesis and relieved leaf senescence during reproductive stages, leading to better grain formation. Compared to saline water irrigation alone, biochar application of 10 and 20 t ha−1 significantly increased wheat grain yield by 8.6 and 8.4%, respectively. High dose of biochar might increase soil salinity and limit N availability. In the study, biochar amendment at 10 t ha−1 would be a proper practice at least over two years to facilitate saline water irrigation for wheat production. Long-term studies are recommended to advance the understanding of the sustainable use of straw biochar.

1. Introduction

Winter wheat (Triticum aestivum L.) is one of the most crucial cereals for human consumption. In arid and semi-arid areas, the winter wheat production depends highly on additional irrigation since precipitations during the winter wheat growing season are regularly insufficient to meet the water requirements for achieving optimum yields [1,2,3]. Due to the increasing dry weather under the current climate changes and the aggravated competitions for water use in urban and industrial sectors, the freshwater shortage is becoming the main bottleneck for winter wheat production in these regions [4]. To cope with the scarcity of water resources, water-saving scheduling (e.g., deficit irrigation) has been widely adopted to optimize wheat yield with limited water supplies. On the other hand, the use of low-quality water resources such as saline water and brackish water to mitigate the increasing irrigation water demands in wheat production has gained significant attention.
Previous studies have reported that applying saline water irrigation during wheat drought-sensitive stages can achieve higher grain yield compared to skipping irrigation [5,6]. However, saline water irrigation could aggravate the risks of soil salinity and sodicity build-up, resulting in destabilized soil structure, surface crust, and infiltration problems [7]. Meanwhile, salt accumulation in the root zone could cause osmotic stress, ionic toxicity, nutritional deficiency in plants, and thereby reduce crop growth and yield [8]. Wheat is classified as moderately tolerant to salinity with soil salinity threshold of 6 dS m−1 and irrigation water salinity threshold of 4 dS m−1 [9,10]. Sharma and Rao [11] reported that using drainage water with a salinity of 6.0–18.8 dS m−1 for irrigation notably increased soil salinity and sodicity after harvest, causing a reduction of 4.2%–22.2% in wheat yield. Murtaza et al. [12] revealed that irrigation with saline-sodic water alone could induce soil secondary salinization, leading to higher soil bulk density, lower infiltration rate, as well as reduced wheat straw and grain yield. Studies also showed that as the irrigation water salinity and consequently soil salinity increased, the wheat production decreased significantly [1,9,13]. Therefore, proper agricultural management strategies should be adopted to alleviate these adverse impacts of saline water irrigation on soil health and crop yield. Soil application with organic materials has been considered as one of the effective practices to facilitate wheat production under saline-irrigated conditions [12,14,15,16].
Biochar is a carbon-rich organic material produced from the pyrolysis of biological matter under a low oxygen condition and possesses several advantages like porous structure, large surface area, and high ion exchange capability [17,18]. The application of biochar to agricultural soils can improve soil physical properties, e.g., bulk density, total porosity, aggregate stability, water holding capacity, permeability, and aeration [19,20]. Biochar also helps to increase soil organic matter content, mineral supply, and cation exchange capacity, leading to higher soil nutrient availability [21,22]. Furthermore, biochar application is conducive to promoting the rhizosphere biological environment, thus increasing soil enzyme activities and microbial growth [23,24]. In addition, a number of studies have shown several benefits of biochar on the plant growth under salt stress like improved plant water status, enhanced photosynthesis, decreased Na+ uptake, increased nutrient uptake, mitigation of oxidative stress, and regulation of stomatal conductance and phytohormones [25,26]. As a result, biochar has been increasingly used as a soil amendment to facilitate agricultural development under saline conditions. Studies have reported that biochar amendment effectively enhanced wheat growth and yield in salt-affected soils [23,27,28,29], and also increased yields of several crops under saline water irrigation such as potato, maize, tomato, soybean, and sweet melon [26,30,31,32,33].
Therefore, biochar application seems to be a reasonable practice to improve the utilization of saline water in wheat production. Nonetheless, most previous studies have been conducted under greenhouse conditions, particularly using pot experiments. Additional research in the field level is still needed to evaluate the effects of saline water irrigation and biochar on soil properties and wheat growth. Furthermore, the influences of biochar amendment could be closely related to its application rate [19]. Either neutral or even negative effects of biochar amendment on crops due to inappropriate application rates have been reported [27]. It is essential to explore reliable and suitable biochar application rates for wheat production under saline water irrigation. Thus, a field experiment was designed and conducted over two consecutive years to investigate: (i) soil physic-chemical properties changes, (ii) physiology responses of winter wheat during growing seasons, (iii) winter wheat yield and yield components, under saline water irrigation with different biochar application treatments.

2. Materials and Methods

2.1. Experimental Site

The experiment was conducted during 2016/2017 and 2017/2018, two growing seasons of winter wheat, under a mobile rain shelter at the Hohai University Water-saving Park (latitude 31°57′ N, longitude 118°50′ E). The experimental site has a subtropical humid monsoon climate, with annual average temperature 15.4 °C, annual evaporation rate 900 mm, annual sunshine duration 2017 h, and annual precipitation 1051 mm [34]. The growing season of winter wheat at the experiment site usually is from late October to early June. The field study was performed in 20 plots (length × width × depth = 2.5 × 2 × 2 m). Each plot was surrounded by a concrete panel and sealed with waterproof paint. The bottom was filled with coarse gravel (20 cm depth) to allow free drainage. The groundwater level during the experiment period was about 3 to 5 m below the ground surface. The topsoil (0–20 cm) had a pH of 7.7, an electrical conductivity (EC) of 1.1 dS m−1, a sodium adsorption ratio (SAR) of 3.4, and contained 20.8 g kg−1 soil organic matter, 0.78 g kg−1 total N, 15.2 mg kg−1 available P and 102.4 mg kg−1 available K. Table 1 shows the soil texture and hydraulic parameters.

2.2. Biochar Preparation and Characterization

Biochar was produced with the pyrolysis of wheat straw at approximately 550–600 °C for 4–6 h in an oxygen-free kiln (NYSWT-25KG, Yuzhongao Agricultural Technical Company, Zhengzhou, China). The biochar had a bulk density of 0.2 g cm−3, a pH of 10.1, an EC of 4.5 dS m−1, a specific surface area of 9.4 m2 g−1, a cation exchange capacity of 61.6 cmol kg−1, and contained 644 g kg−1 organic carbon, 17.3 g kg−1 total N, 10.1 g kg−1 available P, 56.6 g kg−1 available K, 32.2 mg kg−1 Ca, and 24.3 mg kg−1 Mg. The biochar mass was ground to pass through a 2 mm sieve before the field experiment.

2.3. Experimental Setup

The experiment was set up in a randomized complete block design with four replications. The treatments consisted of: freshwater irrigation alone (F0), saline water irrigation alone (B0), saline water irrigation and biochar application of 10 t ha−1 (B10), saline water irrigation and biochar application of 20 t ha−1 (B20), saline water irrigation and biochar application of 30 t ha−1 (B30). Biochar of 10, 20 and 30 t ha−1 were spread uniformly on the soil surface before sowing and thoroughly incorporated into the topsoil (0–20 cm) by rotary and moldboard ploughing. Biochar amendment was only applied in 2016. Agronomic management such as sowing density, fertilizers, and weed and disease control was the same in all plots across the two seasons according to local conventional practices. Winter wheat, a local cultivar of Sumai-10, was sown with a density of 200 seeds m−2 and a row spacing of 15 cm on October 22 in 2016 and October 25 in 2017. Basal fertilizer of diammonium phosphate, urea, potassium chloride was applied at 300 kg ha−1, 150 kg ha−1, and 150 kg ha−1, respectively. An additional 150 kg ha−1 of urea was top-dressed at the jointing stage. After harvest, all above ground materials were removed, and the soil was tilled to a depth of 20 cm before the following season.
The freshwater (0.3 dS m−1) was from the tap water system of the lab. Saline water was prepared by blending the tap water into the saline groundwater from a local well to a salinity of 10 dS m−1. The average quality of irrigation water during each growing season was measured (Table 2). For this saline irrigation study, the mobile rain shelter was used to eliminate rainfall effects during growing seasons. Pre-sowing irrigation of 80 mm using freshwater was implemented to grow seedlings. Irrigation scheduling was based on water depletion in the 60 cm soil profile using Time-domain reflectometer (TDR) from freshwater treatments. Each irrigation event was set to 70 mm to restore the root zone moisture to near field capacity when the soil water content of 60 cm depth approached about 70% of field capacity [35]. The saline water treatments were irrigated with an equal amount of saline water on the same day. Irrigation water was applied by surface irrigation using a plastic tube and a low-pressure pump. Five irrigation events were applied in 2016/2017 season (15 February, 3 April, 23 April, 1 May, and 13 May) and 2017/2018 season (12 February, 31 March, 18 April, 30 April and 10 May), respectively.

2.4. Observations, Sampling, and Sample Analysis

After harvest, three undisturbed soil cores (100 cm3) were randomly collected from the 0–20 soil layer in each plot to determine soil bulk density and saturated hydraulic conductivity. The means of the three replicate samples were calculated as one value per plot. Soil bulk density was measured as the ratio of the oven-dried weight (105 °C) and the volume of the soil core. Soil cores were fixed within a permeameter (CST-1, Nanjing Ningxi Soil Instrument Company, Nanjing, China). Soil saturated hydraulic conductivity was determined using the constant-head method [36]. The composite soil samples at 0–20 depth were collected using an auger and then mixed thoroughly. Soil electrical conductivity and sodium absorption rate were determined according to the method of Li et al. [37]. The composite samples were air-dried, ground, and passed through a 1 mm sieve. A 50 g soil sample was taken to prepare soil saturated extract with distilled water (1:1). Soil electrical conductivity was measured using a conductivity meter (DDBJ-350, INEAS Scientific Instrument Company, Shanghai, China). Soluble cation Na+, Ca2+, and Mg2+ contents were measured using ICP-MS (Perkin-Elmer, Waltham, MA, USA). Soil sodium absorption rate was calculated as the Na+ content divided by the square root of one-half of the Ca2+ + Mg2+ content. Total mineral N content in soil was measured by the potassium chloride extraction method [38]. Available P was determined by the Olsen method [39]. Available K was measured by the ammonium acetate extraction method [40].
Wheat physiological attributes were monitored with 7-day intervals after anthesis (1 May 2017 and 30 April 2018). On each measurement date, five uniform wheat plants were randomly collected in each plot to determine leaf area index. Leaf photosynthesis, water status, and ion content were determined on the first flag leaf of the selected plants. The means of the five replicate samples were calculated as one value per plot. Total leaf area was determined with Li-3100 (Li-Cor, Lincoln, NE, USA). Leaf area index (LAI) was calculated as the ratio between the total leaf area and the corresponding land area. Photosynthetic rate (Pn) was measured on the flag leaves by TPS-2 (PP Systems, Amesbury, UK) between 9:00 h to 11:00 h. Observations were made in the leaf chamber with an LED light intensity of 1000 to 1800 μmol m−2 s−1 and a CO2 concentration of 400 µmol mol−1. Then, flag leaf tissues were sampled to determine leaf relative water content (LRWC). Fresh weight (FW), turgid weight (TW), and oven-dried weight (DW) were obtained. Leaf relative water content was calculated as (FW − DW)/(TW − DW) ×100. Leaf ion content was assayed following the method of Fu et al. [41]. Oven-dried leaf tissues were ground and digested using sulfuric peroxide. Leaf Na+ and K+ content was measured by a flame photometer (FP6400A, Shanghai, China), and the leaf Na+/K+ ratio was recorded.
At harvest, plants were collected from a 1 m2 area in the center of each plot and air-dried to constant weight. The aboveground biomass and the spike numbers per 1 m2 were obtained. Then, plants were threshed using a thresher to measure grain yield per m2 and 1000-grain weight. Harvest index was defined as the ratio of grain yield and aboveground biomass. The kernel number per spike was counted by selecting additional 30 plants in each plot.

2.5. Statistical Analysis

Data were analyzed in SPSS 20.0 statistical program (SPSS, Chicago, IL, USA). The field experiment was a two-factor design with four replications. Year (2016/2017, 2017/2018) and treatment (F0, B0, B10, B20, B30) were considered as fixed effects. A two-way ANOVA was performed to test the main effects of year and treatment, as well as for their interactions on soil properties and crop parameters. Trait means were separated using Duncan’s multiple-range test at the 0.05 level of significance.

3. Results

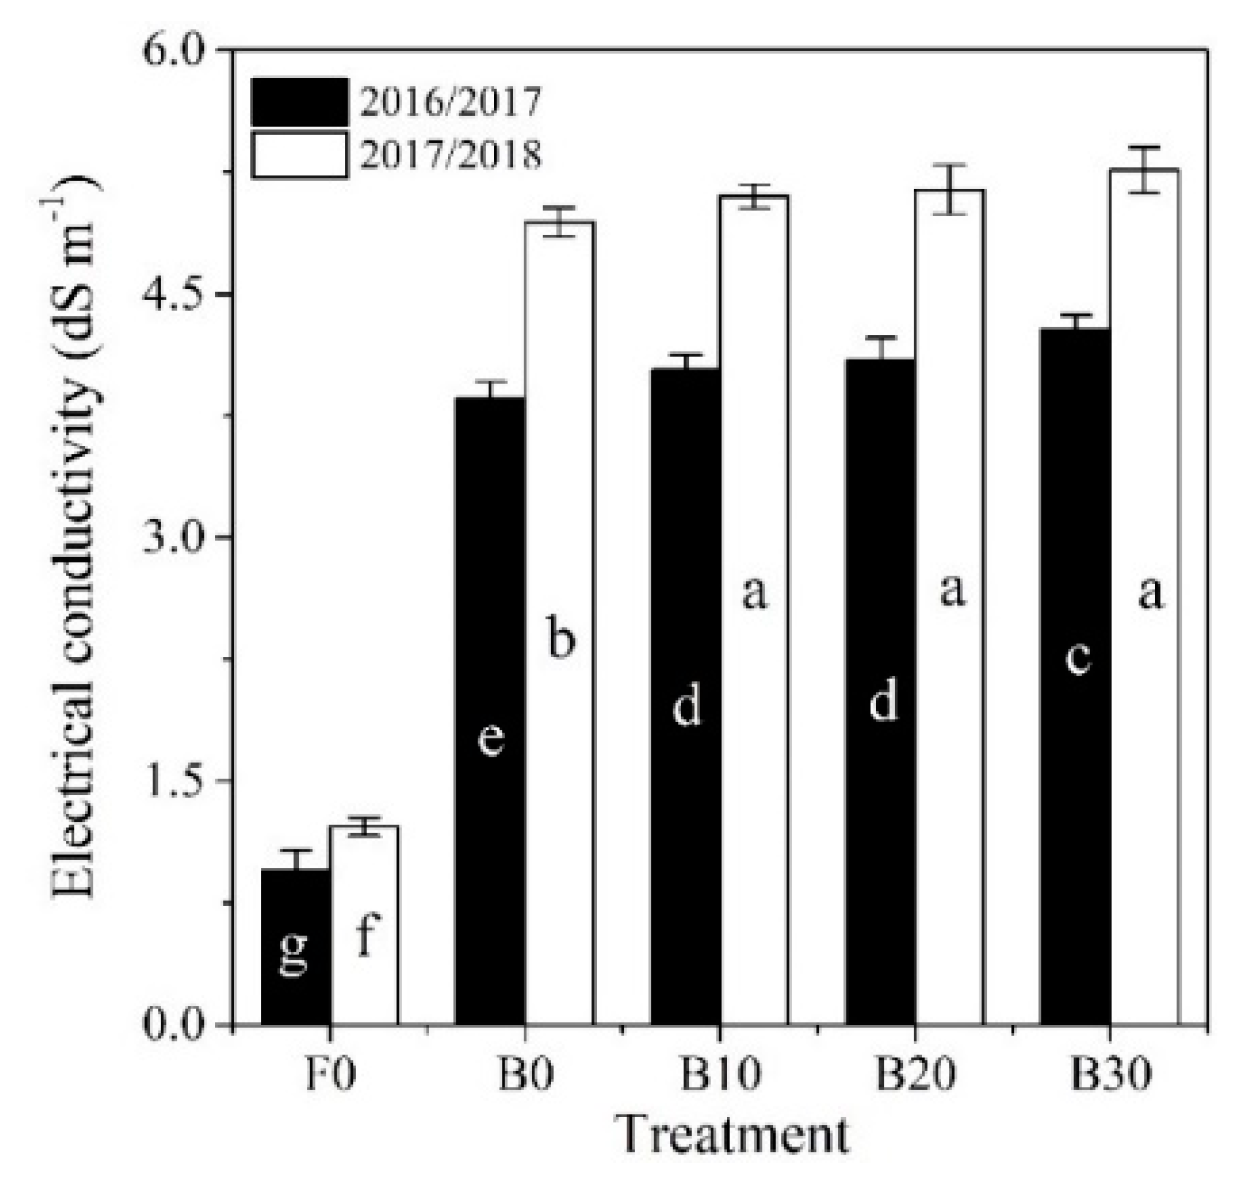
3.1. Altered Soil Physic-Chemical Properties

Year and treatment significantly affected selected soil physic-chemical properties, and their interaction was detected on electrical conductivity (Table 3). The average BD, EC, and SAR values were increased by 3.6, 25.9, 7.9% in 2017/2018 than that in 2016/2017, while Ks value was reduced by 10.8%. Compared to freshwater irrigation, bulk density significantly increased when saline water was used alone, while it decreased with the addition of biochar amendment. The average BD value of B0 was 4.0, 5.5, 8.3, and 11.6% higher than F0, B10, B20, and B30, respectively. Contrarily, the average Ks value of B0 was 31.1, 35.4, 42.7, and 49.5% lower than F0, B10, B20, and B30, respectively. Both EC and SAR values were significantly increased by saline water irrigation. The EC and SAR values of B0 were 305.2% and 207.0% higher than F0. Biochar amendment also increased soil EC values, especially at 30 t ha−1 application rate in 2016/2017 (Figure 1). The EC values of B10, B20, B30 were 4.6, 6.2, 11.1% higher than B0 in 2016/2017, and 3.2, 4.1, 6.5% higher in 2017/2018, respectively. However, biochar application remarkably reduced soil SAR values. Compared to B0, the SAR of B10, B20, B30 was decreased by 25.7, 29.7, 32.6%, respectively.

3.2. Improved Soil Nutrient Content

Soil total mineral N, available P, available K content was significantly affected by year and treatment (Table 4). The soil nutrient contents were generally higher in the first season. Biochar amendment evidently increased mineral N content, especially at low application rate. The highest mineral N content was observed at 10 t ha−1 level. The mineral N content of B10 was 111.3% higher than F0, and the corresponding increases in B20 and B30 were 54.2 and 11.0%, respectively. Both available P and K content were remarkably increased with the addition of biochar. The available P content of B10, B20, B30 was 22.0, 41.1, 52.2% higher than F0, respectively. The corresponding increases in available K content were 26.8, 42.9, 56.5%, respectively.

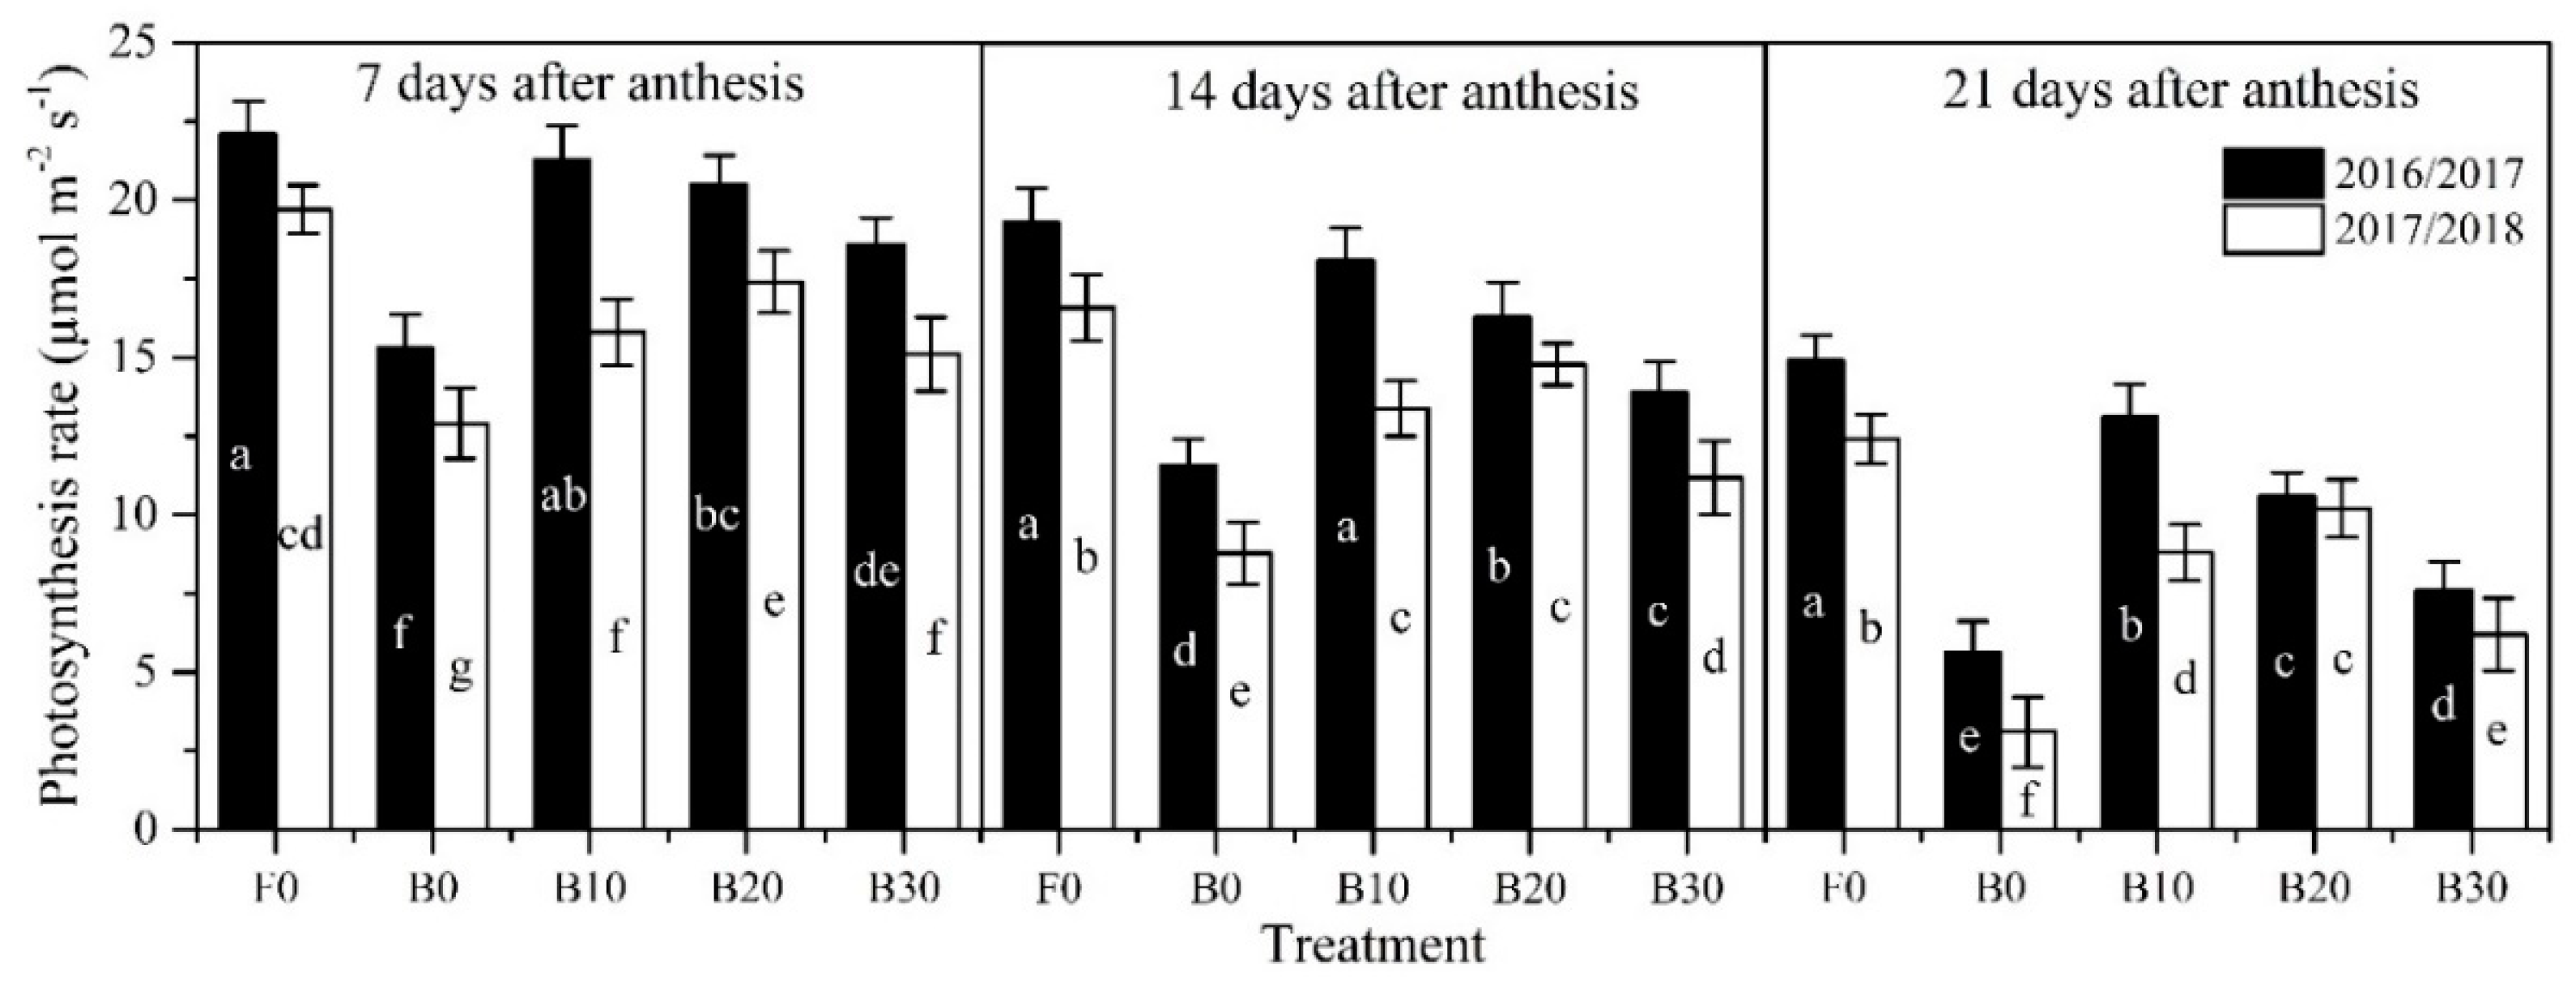
3.3. Changes in Leaf Area Index and Photosynthesis Rate

The leaf area index (LAI) was significantly affected by year and treatment (Table 5). The LAI value was decreased by 13.3 and 3.9% at 0 and 7 days after anthesis in 2017/2018 while increased by 3.9 and 16.6% at 14 and 21 days after anthesis, respectively. Saline water irrigation significantly reduced wheat leaf area index during reproductive stages. The LAI value of F0 was 33.1%–80.6% higher than B0 at 0–21 days after anthesis. Under saline water irrigation, biochar application treatments maintained higher LAI value, especially at 10 and 20 t ha−1 level. The LAI values of B10 and B20 after anthesis were 22.5%–46.9% and 23.0%–56.3% higher than B0, respectively. The corresponding increment in B30 was 9.0%–25.7%.
The main effects of year and treatment on wheat leaf photosynthesis rate (Pn) were significant (Table 6). The average Pn values during reproductive stages were decreased by 15.4%–21.4% in 2017/2018. The Pn value was notably decreased by saline water irrigation, and the reduction appeared more severe with leaf senescence. Compared to F0, the Pn value of B0 was remarkably reduced by 21.7, 32.5, 43.2, 68.1% at 0, 7, 14, 21 days after anthesis, respectively. On the other hand, biochar application treatments displayed higher Pn under saline water irrigation. Compared to B0, the Pn values of B10, B20, B30 at 0–21 days after anthesis were significantly increased by 22.0%–151.7%, 20.3%–139.1%, 8.4%–58.6%, respectively. The interactive effect on Pn was observed at 7, 14, and 21 days after anthesis (Figure 2). In 2016/2017, B10 generally performed higher Pn values during 7–21 days after anthesis under saline water irrigation. However, higher Pn values were observed at B20 treatment in 2017/2018.

3.4. Altered Leaf Water and Ion Status

Leaf relative water content (LRWC) was significantly affected by year and treatment (Table 7). The LRWC values were higher at 7–21 days after anthesis in 2016/2017 than that in 2017/2018. The saline water irrigation treatments displayed lower LRWC than freshwater irrigation one, especially at the late of the reproductive stage. The LRWC of B0 at 0, 7, 14, 21 days after anthesis was 13.4, 24.5, 43.7, 81.1% lower than F0, respectively. Biochar application remarkably increased leaf relative water content with higher increases at 10 and 20 t ha−1 level. The LRWC values of B10, B20, B30 at 0–21 days after anthesis were 7.1%–228.6%, 8.7%–285.0%, 3.1%–104.5% higher than B0, respectively.
Year and treatment significantly affected leaf Na+/K+ ratio (Table 8). The leaf Na+/K+ ratio during reproductive stages in 2017/2018 was 16.7%–33.4% higher than that in 2016/2017. Saline water irrigation significantly increased leaf Na+/K+ ratio, and the increments appeared more intense along with leaf senescence. Compared to F0, the leaf Na+/K+ ratio of B0 was notably increased by 160.3, 193.1, 207.0, 252.1% at 0, 7, 14, 21 days after anthesis, respectively. Nonetheless, saline water irrigation combined with biochar remarkably reduced leaf Na+/K+ ratio than using saline water alone. B20 generally displayed lower leaf Na+/K+ ratio under saline water irrigation, which was 37.9%–54.6% lower than B0. The corresponding decreases of B10 and B30 compared to B0 were 26.3%–45.0% and 32.4%–46.3%, respectively.

3.5. Wheat Yield and Yield Components

The average values of aboveground biomass, grain yield, kernel number, and 1000-grain weight were notably reduced by 4.3, 5.5, 2.0, and 2.6% in 2017/2018, respectively. The main effect of treatment was significant on all wheat yield parameters, while no interactive effect was tested (Table 9). Saline water irrigation significantly reduced wheat production. Compared to F0, the aboveground biomass, grain yield, and harvest index of B0 were remarkably reduced by 7.2, 13.9, 7.1%, respectively. The spike number, kernel number, and 1000-grain weight of B0 were 5.9, 8.1, 5.9% lower than F0, respectively. Saline water irrigation with biochar application achieved higher wheat grain yield than that with saline water alone, especially at 10 and 20 t ha−1 application rates. The grain yield of B10, B20, B30 were 8.6, 8.4, 2.2% higher than B0, respectively. The grain yield increment was associated with biochar-induced higher kernel number, 1000-grain weight, and harvest index. Compared to B0, the kernel number of B10 and B20 were significantly increased by 6.4 and 8.2%, respectively. The corresponding increases in 1000-grain weight were 6.6 and 6.1%, respectively. The harvest index of B10 and B20 were 6.8 and 5.4% higher than B0, respectively.

4. Discussion

4.1. Changes in Soil Properties

In the field study, the topsoil salinity (EC) after harvest was increased with saline water irrigation. The saline water containing considerable Na+ amounts also elevated soil sodicity at the surface layer (higher SAR values). The salinity and sodicity build-up can lead to soil structure deterioration and infiltration problems through slaking, swelling, and dispersion effects of excessive Na+ [7]. Compared to freshwater irrigation, increased soil bulk density and reduced saturated hydraulic conductivity was observed after saline water irrigation, perhaps indicating the soil degradation due to secondary salinization.
The incorporation of straw biochar notably reduced soil bulk density and increased permeability. It is consistent with previous studies [19,42,43] that biochar can improve soil physical properties including soil structure, porosity, aggregation stability, and hydraulic properties, due to its porous structure and high specific surface area. Furthermore, biochar amendment induced remarkable declines in soil SAR values under saline water irrigation. Soil application with organic materials has been reported to effectively mitigate the adverse impacts of low-quality water irrigation on soil sodicity [15,44]. In the study, the straw biochar contained a certain content of Ca2+ and Mg2+, directly reducing soil SAR by providing Ca2+ and Mg2+ into the soil solution. In addition, biochar amendment increased soil cation exchange capacity, and thus decreased Na+ content in soil solution by absorbing Na+ in the new available exchange sites. On the other hand, the Ca2+ supplied from biochar can promote Na+ displacement from exchange sites, and further facilitate Na+ leaching in percolating water [24,27,42]. Nonetheless, the EC values of biochar-amended soil were higher than that without biochar due to the added minerals from biochar application. The soil salinity and sodicity problems also aggregated in the second season due to consecutive saline water irrigation. Therefore, although the biochar amendment improved soil physical properties and mitigated sodium hazard under saline water irrigation, adequate salt leaching is still needed to ensure sustainable land use. Except for using pre-sowing irrigation, substantial rainfall during monsoon periods can take a crucial role in salt leaching and contribute to long-term use of saline water irrigation. Several studies [1,11,45] have also reported that most of the salts accumulated during the previous wheat season can be leached out by off-season rains before the next growing season.
Furthermore, wheat straw biochar has been considered as an additional source of nutrients such as N, P and K, which could directly improve soil nutrient levels [27,46]. Meanwhile, a number of studies have reported that biochar application can enhance soil nutrient availability and nutrient retention due to the increased soil cation exchange capacity and surface area [17,19,21,22]. In the field trial, the incorporation of straw biochar significantly improved the soil available N, P, K content, and the elevated soil nutrient level maintained at least over two years. However, high rates of biochar application could result in N immobilization due to the elevated soil C/N ratio [47,48]. In the study, total mineral N content decreased when biochar application increased from 10 to 30 t ha−1, probably indicating the limitation effect of substantial biochar amounts on N availability. Similar results were also reported by Agbna et al. [49] that over 25 t ha−1 wheat straw biochar application significantly reduced both nitrate N and ammonium N content.

4.2. Alleviated Salt Stress

The reproductive stage is a crucial period for winter wheat to determine final yield, and leaf photosynthetic capacity during this stage is the most sensitive parameter to achieve high yield [50,51]. In the study, saline water irrigation significantly reduced wheat leaf area index and photosynthesis rate during the after anthesis stage, resulting in limited wheat growth and accelerated leaf senescence. This was mainly associated with disturbed plant water and ionic status due to salt stress [52]. Saline water irrigation might decrease soil solution osmotic potential, and thus limit root water uptake, causing an evident decline in leaf relative water content. Physiological water deficit in wheat plants can lead to stomatal closure, photosynthesis inhibition, and stunted growth [8]. Saline water irrigation might also increase Na+ accumulation in mature leaves while decreased K+ uptake, and therefore increase wheat leaf Na+/K+ ratio. This salt-induced ionic stress can involve severe physiological injuries and aggravate senescence of mature leaves or death, causing sharp decreases in wheat growth and photosynthetic CO2 assimilation [52,53]. However, the addition of biochar effectively alleviated adverse effects of saline water irrigation by maintaining higher leaf relative water content and lower leaf Na+/K+ ratio, and thereby increased leaf area index and photosynthesis rate during the reproductive stage, which to some extent relieved wheat leaf senescence under salt stress.
Biochar-induced promotions in plant growth could be ascribed to the improvement in soil physic-chemical properties and nutrient level [24,25]. In the study, biochar amendment remarkably reduced soil bulk density and increased permeability, which might promote soil aeration and water infiltration, providing a more favorable plant growth condition. Meanwhile, biochar application evidently elevated soil available N, P, K content during the two seasons. The improved soil environment and increased nutrient level could be conducive to root growth, and consequently facilitate plant water absorption and nutrient uptake [19,54]. A better nutrient status (especially K) in wheat plants can play a crucial role to overcome salt stress by promoting photosynthesis, protein biosynthesis, water regulation and ionic balance [55,56]. Furthermore, biochar amendment remarkably mitigated soil sodicity build-up under saline water irrigation (lower SAR values). The diminished Na+ content in soil solution could directly reduce plant Na+ uptake and enhance other essential minerals uptake, resulting in the amelioration of salinity injuries [24,25,27,28]. In addition, the transient Na+ adsorption capacity of biochar may be another underlying mechanism responsible for the enhanced growth of wheat plants. It has been widely reported that biochar addition can absorb Na+ from the soil solution, and thus to some degree improve soil water availability and relieve ionic hazards [23,26,32,57]. Nonetheless, the advantageous effect of biochar application on wheat growth was more pronounced at the low and medium rate (i.e., 10 and 20 t ha−1). This might be attributed to the fact that substantial biochar amendment increased soil salinity due to its high mineral content, as well as the limited N availability caused by high soil C/N ratio.

4.3. Improved Wheat Production

The photosynthesis depression and accelerated leaf senescence due to salt stress could be major causes reducing grain yield in wheat [51]. In the study, saline water irrigation (10 dS m−1) decreased grain yield by 13.9% compared to freshwater irrigation. It is similar to the observations by Sharma et al. [45] and Sharma and Rao [11] that use of 9–12 dS m−1 salinity water led to 9.2%–16.3% yield loss. Salinity also reduced wheat yield components such as aboveground biomass, harvest index, spike number, kernel number, and 1000-grain weight, which is in line with the findings by Saqib et al. [58] and Mostafazadeh-Fard et al. [13]. Saline water irrigation with biochar application significantly increased grain yield compared to using saline water alone. This biochar-induced increase of wheat production could mainly be attributed to the better grain formation, i.e., higher grain number per spike and larger 1000-grain weight. Lashari et al. [27] and Lin et al. [28] also reported that straw biochar effectively enhanced wheat spike weight, grain per spike, and grain weight under saline conditions, probably due to the increased nutrient uptake and improved soil properties. In the present study, biochar application increased leaf area and photosynthesis during the reproductive stage, which could help to capture more light energy, consequently supplying more CO2 assimilates to promote grain formation [50]. Furthermore, the remobilization of assimilates from wheat vegetative organs to kernels during grain filling could buffer the yield reduction when subjected to abiotic stresses [59]. Biochar application alleviated the accelerated leaf senescence under saline water irrigation. This may prolong the duration of assimilates translocation process and cause higher rates of assimilates partitioning into kernels, thus increasing grain weight and harvest index [60].
Generally, saline water irrigation in conjunction with biochar amendment could be an effective practice to alleviate the freshwater shortage and stabilize winter wheat production. Compared to using saline water alone, wheat grain yield was remarkably increased by 8.6%–8.9% with 10 and 20 t ha−1 biochar application. However, the yield increment under 30 t ha−1 biochar amendment was smaller, mainly due to the high salinity and immobilization of N. Thus, it may not be economically feasible to implement high dose of straw biochar when using low-quality water for irrigation. During the two growing seasons, the difference between grain yield under 10 and 20 t ha−1 biochar application was not evident. Considering the economic issue, 10 t ha−1 could be a proper biochar amendment rate for wheat production using saline water irrigation. It is in line with the findings by Zhang et al. [61] that 10 t ha−1 wheat straw biochar amendment achieved the highest multiple benefits in rice crop production. Nonetheless, the high cost of straw biochar is still the major obstacle for the profits of biochar application [43]. Developing low-cost techniques for biochar production from agricultural waste materials seems to be essential to facilitate the wide-spreading use of biochar. Furthermore, the positive effects of biochar amendment may weaken over time. For example, leaf photosynthesis rate of 10 t ha−1 treatment appeared lower than 20 t ha−1 ones at the second season, and the average soil nutrient contents were remarkably decreased compared to the first season. Thus, although the promising grain yield was achieved for two consecutive seasons in the present study, long-term field trials are still recommended to gain a better understanding of the sustained use of straw biochar.

5. Conclusions

The incorporation of straw biochar caused lower soil bulk density and higher permeability and also increased total mineral N, available P, and available K content in the mixed soil layer. Furthermore, biochar amendment was conducive to the mitigation of soil sodicity build-up under saline water irrigation. As a result, biochar application relieved adverse effects of saline water irrigation on wheat plants, leading to higher leaf area index and photosynthesis during reproductive stages. Under saline water irrigation, 10 and 20 t ha−1 biochar amendment significantly increased grain yield compared to 0 and 30 t ha−1 treatments in both growing seasons. The results showed that straw biochar at 10 t ha−1 would be a proper strategy to facilitate saline water irrigation in wheat production.

Author Contributions

Conceptualization, M.H. and Z.Z.; Methodology, M.H. and C.Z.; Software, M.H. and P.L.; Validation, M.H., Z.Z., and C.Z.; Formal Analysis, M.H. and P.L.; Investigation, M.H. and P.L.; Writing—Original Draft Preparation, M.H.; Writing—Review and Editing, M.H., C.Z., and Y.Z.; Supervision, Y.Z.; Project Administration, Z.Z. and C.Z.; Funding Acquisition, Z.Z., Y.M., and C.Z.

Funding

This research was funded by the National Key Research and Development Program of China, grant number 2016YFC0400208; the National Natural Science Foundation of China, grant number 51579069 and 51879071; the Fundamental Research Funds for the Central Universities, grant number B19020180.

Acknowledgments

We are grateful to the reviewers and editors for their insightful reviews and valuable comments that helped to improve the manuscript.

Conflicts of Interest

The authors declare no conflict of interest.

References

  1. Wang, X.; Yang, J.; Liu, G.; Yao, R.; Yu, S. Impact of irrigation volume and water salinity on winter wheat productivity and soil salinity distribution. Agric. Water Manag. 2015, 149, 44–54. [Google Scholar] [CrossRef]
  2. Attia, A.; Rajan, N.; Xue, Q.; Nair, S.; Ibrahim, A.; Hays, D. Application of DSSAT-CERES-Wheat model to simulate winter wheat response to irrigation management in the Texas High Plains. Agric. Water Manag. 2016, 165, 50–60. [Google Scholar] [CrossRef]
  3. Tari, A.F. The effects of different deficit irrigation strategies on yield, quality, and water-use efficiencies of wheat under semi-arid conditions. Agric. Water Manag. 2016, 167, 1–10. [Google Scholar] [CrossRef]
  4. Zhang, X.; Qin, W.; Chen, S.; Shao, L.; Sun, H. Responses of yield and WUE of winter wheat to water stress during the past three decades—A case study in the North China Plain. Agric. Water Manag. 2017, 179, 47–54. [Google Scholar] [CrossRef]
  5. Hamdy, A.; Sardo, V.; Ghanem, K.F. Saline water in supplemental irrigation of wheat and barley under rainfed agriculture. Agric. Water Manag. 2005, 78, 122–127. [Google Scholar] [CrossRef]
  6. Chauhan, C.; Singh, R.; Gupta, S. Supplemental irrigation of wheat with saline water. Agric. Water Manag. 2008, 95, 253–258. [Google Scholar] [CrossRef]
  7. Basile, A.; Buttafuoco, G.; Mele, G.; Tedeschi, A. Complementary techniques to assess physical properties of a fine soil irrigated with saline water. Environ. Earth Sci. 2012, 66, 1797–1807. [Google Scholar] [CrossRef]
  8. Darko, E.; Janda, T.; Majláth, I.; Szopkó, D.; Dulai, S.; Molnár, I.; Türkösi, E.; Molnár-Láng, M. Salt stress response of wheat–barley addition lines carrying chromosomes from the winter barley “Manas”. Euphytica 2015, 203, 491–504. [Google Scholar] [CrossRef]
  9. Jiang, J.; Huo, Z.; Feng, S.; Zhang, C. Effect of irrigation amount and water salinity on water consumption and water productivity of spring wheat in Northwest China. Field Crop. Res. 2012, 137, 78–88. [Google Scholar] [CrossRef]
  10. Abbas, G.; Chen, Y.; Khan, F.; Feng, Y.; Palta, J.; Siddique, K. Salinity and Low Phosphorus Differentially Affect Shoot and Root Traits in Two Wheat Cultivars with Contrasting Tolerance to Salt. Agronomy 2018, 8, 155. [Google Scholar] [CrossRef]
  11. Sharma, D.; Rao, K. Strategy for long term use of saline drainage water for irrigation in semi-arid regions. Soil Tillage Res. 1998, 48, 287–295. [Google Scholar] [CrossRef]
  12. Murtaza, G.; Ghafoor, A.; Qadir, M. Irrigation and soil management strategies for using saline-sodic water in a cotton–wheat rotation. Agric. Water Manag. 2006, 81, 98–114. [Google Scholar] [CrossRef]
  13. Mostafazadeh-Fard, B.; Mansouri, H.; Mousavi, S.-F.; Feizi, M. Effects of different levels of irrigation water salinity and leaching on yield and yield components of wheat in an arid region. J. Irrig. Drain. Eng. 2009, 135, 32–38. [Google Scholar] [CrossRef]
  14. Minhas, P. Saline water management for irrigation in India. Agric. Water Manag. 1996, 30, 1–24. [Google Scholar] [CrossRef]
  15. Kahlown, M.A.; Azam, M. Effect of saline drainage effluent on soil health and crop yield. Agric. Water Manag. 2003, 62, 127–138. [Google Scholar] [CrossRef]
  16. Ahmed, B.O.; Inoue, M.; Moritani, S. Effect of saline water irrigation and manure application on the available water content, soil salinity, and growth of wheat. Agric. Water Manag. 2010, 97, 165–170. [Google Scholar] [CrossRef]
  17. Lehmann, J.; da Silva, J.P.; Steiner, C.; Nehls, T.; Zech, W.; Glaser, B. Nutrient availability and leaching in an archaeological Anthrosol and a Ferralsol of the Central Amazon basin: Fertilizer, manure and charcoal amendments. Plant Soil 2003, 249, 343–357. [Google Scholar] [CrossRef]
  18. Joseph, S.; Husson, O.; Graber, E.; Van Zwieten, L.; Taherymoosavi, S.; Thomas, T.; Nielsen, S.; Ye, J.; Pan, G.; Chia, C. The electrochemical properties of biochars and how they affect soil redox properties and processes. Agronomy 2015, 5, 322–340. [Google Scholar] [CrossRef]
  19. Xiao, Q.; Zhu, L.; Shen, Y.; Li, S. Sensitivity of soil water retention and availability to biochar addition in rainfed semi-arid farmland during a three-year field experiment. Field Crop. Res. 2016, 196, 284–293. [Google Scholar] [CrossRef]
  20. de Jesus Duarte, S.; Glaser, B.; Cerri, P.; Eduardo, C. Effect of Biochar Particle Size on Physical, Hydrological and Chemical Properties of Loamy and Sandy Tropical Soils. Agronomy 2019, 9, 165. [Google Scholar] [CrossRef]
  21. Glaser, B.; Lehmann, J.; Zech, W. Ameliorating physical and chemical properties of highly weathered soils in the tropics with charcoal—A review. Biol. Fertil. Soils 2002, 35, 219–230. [Google Scholar] [CrossRef]
  22. Haider, G.; Steffens, D.; Moser, G.; Müller, C.; Kammann, C.I. Biochar reduced nitrate leaching and improved soil moisture content without yield improvements in a four-year field study. Agric. Ecosyst. Environ. 2017, 237, 80–94. [Google Scholar] [CrossRef]
  23. Akhtar, S.S.; Andersen, M.N.; Liu, F. Residual effects of biochar on improving growth, physiology and yield of wheat under salt stress. Agric. Water Manag. 2015, 158, 61–68. [Google Scholar] [CrossRef]
  24. Dahlawi, S.; Naeem, A.; Rengel, Z.; Naidu, R. Biochar application for the remediation of salt-affected soils: Challenges and opportunities. Sci. Total Environ. 2018, 625, 320–335. [Google Scholar]
  25. Ali, S.; Rizwan, M.; Qayyum, M.F.; Ok, Y.S.; Ibrahim, M.; Riaz, M.; Arif, M.S.; Hafeez, F.; Al-Wabel, M.I.; Shahzad, A.N. Biochar soil amendment on alleviation of drought and salt stress in plants: A critical review. Environ. Sci. Pollut. Res. 2017, 24, 12700–12712. [Google Scholar] [CrossRef]
  26. Farhangi-Abriz, S.; Torabian, S. Biochar improved nodulation and nitrogen metabolism of soybean under salt stress. Symbiosis 2018, 74, 215–223. [Google Scholar] [CrossRef]
  27. Lashari, M.S.; Liu, Y.; Li, L.; Pan, W.; Fu, J.; Pan, G.; Zheng, J.; Zheng, J.; Zhang, X.; Yu, X. Effects of amendment of biochar-manure compost in conjunction with pyroligneous solution on soil quality and wheat yield of a salt-stressed cropland from Central China Great Plain. Field Crop. Res. 2013, 144, 113–118. [Google Scholar] [CrossRef]
  28. Lin, X.; Xie, Z.; Zheng, J.; Liu, Q.; Bei, Q.; Zhu, J. Effects of biochar application on greenhouse gas emissions, carbon sequestration and crop growth in coastal saline soil. Eur. J. Soil Sci. 2015, 66, 329–338. [Google Scholar] [CrossRef]
  29. Kanwal, S.; Ilyas, N.; Shabir, S.; Saeed, M.; Gul, R.; Zahoor, M.; Batool, N.; Mazhar, R. Application of biochar in mitigation of negative effects of salinity stress in wheat (Triticum aestivum L.). J. Plant Nutr. 2018, 41, 526–538. [Google Scholar] [CrossRef]
  30. Akhtar, S.S.; Andersen, M.N.; Liu, F. Biochar mitigates salinity stress in potato. J. Agron. Crop Sci. 2015, 201, 368–378. [Google Scholar] [CrossRef]
  31. Akhtar, S.S.; Andersen, M.N.; Naveed, M.; Zahir, Z.A.; Liu, F. Interactive effect of biochar and plant growth-promoting bacterial endophytes on ameliorating salinity stress in maize. Funct. Plant Biol. 2015, 42, 770–781. [Google Scholar] [CrossRef]
  32. Usman, A.R.A.; Al-Wabel, M.I.; Abdulaziz, A.-H.; Mahmoud, W.-A.; El-Naggar, A.H.; Ahmad, M.; Abdulelah, A.-F.; Abdulrasoul, A.-O. Conocarpus biochar induces changes in soil nutrient availability and tomato growth under saline irrigation. Pedosphere 2016, 26, 27–38. [Google Scholar] [CrossRef]
  33. Elbashier, M.; Xiaohou, S.; Ali, A.; Mohmmed, A. Effect of digestate and biochar amendments on photosynthesis rate, growth parameters, water use efficiency and yield of Chinese melon (Cucumis melo L.) under Saline Irrigation. Agronomy 2018, 8, 22. [Google Scholar] [CrossRef]
  34. Wang, M.; Yu, S.; Shao, G.; Gao, S.; Wang, J.; Zhang, Y. Impact of Alternate Drought and Flooding Stress on Water Use, and Nitrogen and Phosphorus Losses in a Paddy Field. Pol. J. Environ. Stud. 2018, 27, 345–355. [Google Scholar] [CrossRef]
  35. Kang, S.; Zhang, L.; Liang, Y.; Hu, X.; Cai, H.; Gu, B. Effects of limited irrigation on yield and water use efficiency of winter wheat in the Loess Plateau of China. Agric. Water Manag. 2002, 55, 203–216. [Google Scholar] [CrossRef]
  36. Wang, L.; Wang, Q.; Wei, S.; Shao, M.a.; Li, Y. Soil desiccation for Loess soils on natural and regrown areas. For. Ecol. Manag. 2008, 255, 2467–2477. [Google Scholar] [CrossRef]
  37. Li, X.; Kang, Y.; Wan, S.; Chen, X.; Liu, S.; Xu, J. Response of a salt-sensitive plant to processes of soil reclamation in two saline–sodic, coastal soils using drip irrigation with saline water. Agric. Water Manag. 2016, 164, 223–234. [Google Scholar] [CrossRef]
  38. Mulvaney, R. Nitrogen—Inorganic forms. In Methods Soil Analysis Part 3—Chemical Methods; American Society of Agronomy-Soil Science Society of America: Madison, WI, USA, 1996; pp. 1123–1184. [Google Scholar]
  39. Olsen, S.R. Estimation of Available Phosphorus in Soils by Extraction with Sodium Bicarbonate; United States Department of Agriculture: Washington, DC, USA, 1954. [Google Scholar]
  40. Helmke, P.A.; Sparks, D. Lithium, sodium, potassium, rubidium, and cesium. In Methods Soil Analysis Part 3—Chemical Methods; American Society of Agronomy-Soil Science Society of America: Madison, WI, USA, 1996; pp. 551–574. [Google Scholar]
  41. Fu, J.; Liu, Z.; Li, Z.; Wang, Y.; Yang, K. Alleviation of the effects of saline-alkaline stress on maize seedlings by regulation of active oxygen metabolism by Trichoderma asperellum. PLoS ONE 2017, 12, e0179617. [Google Scholar] [CrossRef]
  42. Chaganti, V.N.; Crohn, D.M.; Šimůnek, J. Leaching and reclamation of a biochar and compost amended saline–sodic soil with moderate SAR reclaimed water. Agric. Water Manag. 2015, 158, 255–265. [Google Scholar] [CrossRef]
  43. Jin, Z.; Chen, C.; Chen, X.; Jiang, F.; Hopkins, I.; Zhang, X.; Han, Z.; Billy, G.; Benavides, J. Soil acidity, available phosphorus content, and optimal biochar and nitrogen fertilizer application rates: A five-year field trial in upland red soil, China. Field Crop. Res. 2019, 232, 77–87. [Google Scholar] [CrossRef]
  44. Choudhary, O.; Ghuman, B.; Thuy, N.; Buresh, R. Effects of long-term use of sodic water irrigation, amendments and crop residues on soil properties and crop yields in rice–wheat cropping system in a calcareous soil. Field Crop. Res. 2011, 121, 363–372. [Google Scholar] [CrossRef]
  45. Sharma, D.; Singh, K.; Rao, K.; Kumbhare, P. Irrigation of wheat with saline drainage water on a sandy loam soil. Agric. Water Manag. 1991, 19, 223–233. [Google Scholar] [CrossRef]
  46. Naeem, M.A.; Khalid, M.; Aon, M.; Abbas, G.; Tahir, M.; Amjad, M.; Murtaza, B.; Yang, A.; Akhtar, S.S. Effect of wheat and rice straw biochar produced at different temperatures on maize growth and nutrient dynamics of a calcareous soil. Arch. Agron. Soil Sci. 2017, 63, 2048–2061. [Google Scholar] [CrossRef]
  47. Lehmann, J.; Joseph, S. Biochar for environmental management: An introduction. In Biochar for Environmental Management; Routledge: London, UK, 2015; pp. 33–46. [Google Scholar]
  48. Nguyen, T.T.N.; Xu, C.-Y.; Tahmasbian, I.; Che, R.; Xu, Z.; Zhou, X.; Wallace, H.M.; Bai, S.H. Effects of biochar on soil available inorganic nitrogen: A review and meta-analysis. Geoderma 2017, 288, 79–96. [Google Scholar] [CrossRef] [Green Version]
  49. Agbna, G.H.; Dongli, S.; Zhipeng, L.; Elshaikh, N.A.; Guangcheng, S.; Timm, L.C. Effects of deficit irrigation and biochar addition on the growth, yield, and quality of tomato. Sci. Hortic. 2017, 222, 90–101. [Google Scholar] [CrossRef]
  50. Zheng, Y.; Wang, Z.; Sun, X.; Jia, A.; Jiang, G.; Li, Z. Higher salinity tolerance cultivars of winter wheat relieved senescence at reproductive stage. Environ. Exp. Bot. 2008, 62, 129–138. [Google Scholar] [CrossRef]
  51. Zheng, C.; Jiang, D.; Liu, F.; Dai, T.; Jing, Q.; Cao, W. Effects of salt and waterlogging stresses and their combination on leaf photosynthesis, chloroplast ATP synthesis, and antioxidant capacity in wheat. Plant Sci. 2009, 176, 575–582. [Google Scholar] [CrossRef]
  52. Munns, R.; James, R.A.; Läuchli, A. Approaches to increasing the salt tolerance of wheat and other cereals. J. Exp. Bot. 2006, 57, 1025–1043. [Google Scholar] [CrossRef] [Green Version]
  53. El-Hendawy, S.; Al-Suhaibani, N.; Dewir, Y.H.; Elsayed, S.; Alotaibi, M.; Hassan, W.; Refay, Y.; Tahir, M.U. Ability of Modified Spectral Reflectance Indices for Estimating Growth and Photosynthetic Efficiency of Wheat under Saline Field Conditions. Agronomy 2019, 9, 35. [Google Scholar] [CrossRef]
  54. Zheng, H.; Wang, X.; Chen, L.; Wang, Z.; Xia, Y.; Zhang, Y.; Wang, H.; Luo, X.; Xing, B. Enhanced growth of halophyte plants in biochar-amended coastal soil: Roles of nutrient availability and rhizosphere microbial modulation. Plant Cell Environ. 2018, 41, 517–532. [Google Scholar] [CrossRef]
  55. Hu, Y.; Schmidhalter, U. Drought and salinity: A comparison of their effects on mineral nutrition of plants. J. Plant Nutr. Soil Sci. 2005, 168, 541–549. [Google Scholar] [CrossRef]
  56. Liu, M.; Wang, C.; Wang, F.; Xie, Y. Vermicompost and humic fertilizer improve coastal saline soil by regulating soil aggregates and the bacterial community. Arch. Agron. Soil Sci. 2019, 65, 281–293. [Google Scholar] [CrossRef]
  57. Thomas, S.C.; Frye, S.; Gale, N.; Garmon, M.; Launchbury, R.; Machado, N.; Melamed, S.; Murray, J.; Petroff, A.; Winsborough, C. Biochar mitigates negative effects of salt additions on two herbaceous plant species. J. Environ. Manag. 2013, 129, 62–68. [Google Scholar] [CrossRef]
  58. Saqib, M.; Akhtar, J.; Qureshi, R.H. Pot study on wheat growth in saline and waterlogged compacted soil: I. Grain yield and yield components. Soil Tillage Res. 2004, 77, 169–177. [Google Scholar] [CrossRef]
  59. Ma, S.-C.; Duan, A.-W.; Wang, R.; Guan, Z.-M.; Yang, S.-J.; Ma, S.-T.; Shao, Y. Root-sourced signal and photosynthetic traits, dry matter accumulation and remobilization, and yield stability in winter wheat as affected by regulated deficit irrigation. Agric. Water Manag. 2015, 148, 123–129. [Google Scholar] [CrossRef]
  60. Poustini, K.; Siosemardeh, A. Ion distribution in wheat cultivars in response to salinity stress. Field Crop. Res. 2004, 85, 125–133. [Google Scholar] [CrossRef]
  61. Zhang, A.; Bian, R.; Pan, G.; Cui, L.; Hussain, Q.; Li, L.; Zheng, J.; Zheng, J.; Zhang, X.; Han, X. Effects of biochar amendment on soil quality, crop yield and greenhouse gas emission in a Chinese rice paddy: A field study of 2 consecutive rice growing cycles. Field Crop. Res. 2012, 127, 153–160. [Google Scholar] [CrossRef]
Figure 1. Interaction effect of year and treatment on topsoil (0–20 cm) electrical conductivity. Values are average of four replications. Bars with different letters significantly different at 0.05. F0: freshwater irrigation. B0, B10, B20, B30: saline water irrigation combined with biochar application of 0, 10, 20, 30 t ha−1.
Agronomy 09 00457 g001
Figure 2. Interaction effect of year and treatment on photosynthesis rate at 7, 14, 21 days after anthesis. Values are average of four replications. Bars with different letters significantly different at 0.05. F0: freshwater irrigation. B0, B10, B20, B30: saline water irrigation combined with biochar application of 0, 10, 20, 30 t ha−1.
Agronomy 09 00457 g002
Table 1. Soil texture and hydraulic parameters at the plots.
Depth (cm)TextureBulk Density (g cm−3)Field Capacity (cm3 cm−3)Saturated Hydraulic Conductivity (cm h−1)
0–20Clay loam1.360.383.7
20–40Clay loam1.390.402.7
40–60Clay loam1.410.393.2
60–90Clay1.490.411.0
90–120Clay1.520.430.7
Table 2. Average quality of irrigation water during 2016/2017 and 2017/2018 season.
EC
(dS m−1)
SAR
(mmol1/2 L−1/2)
Ca2+
(mmol L−1)
Mg2+
(mmol L−1)
Na+
(mmol L−1)
HCO3
(mmol L−1)
Cl
(mmol L−1)
SO42−
(mmol L−1)
2016/2017 season
0.31.01.20.50.90.70.61.6
10.011.617.614.046.25.070.816.6
2017/2018 season
0.31.31.10.61.20.60.81.8
10.111.918.115.048.52.576.218.1
Table 3. Main effects of year and treatment on topsoil (0–20 cm) bulk density (BD), saturated hydraulic conductivity (Ks), electrical conductivity (EC), and sodium adsorption ratio (SAR).
VariableBD (g cm−3)Ks (cm h−1)EC (dS m−1)SAR (mmol1/2 L−1/2)
Year
2016/20171.34 ± 0.06 b 14.16 ± 0.89 a3.44 ± 1.29 b5.80 ± 1.98 b
2017/20181.39 ± 0.05 a3.72 ± 0.88 b4.33 ± 1.60 a6.26 ± 2.04 a
Treatment
F01.39 ± 0.04 b 23.70 ± 0.29 c1.09 ± 0.17 d2.85 ± 0.66 c
B01.44 ± 0.03 a2.55 ± 0.47 d4.40 ± 0.59 c8.75 ± 0.84 a
B101.37 ± 0.03 b3.95 ± 0.24 c4.57 ± 0.58 b6.50 ± 0.44 b
B201.33 ± 0.03 c4.45 ± 0.21 b4.62 ± 0.58 b6.15 ± 0.68 b
B301.29 ± 0.04 d5.05 ± 0.43 a4.77 ± 0.54 a5.90 ± 0.35 b
ANOVA
Year*******
Treatment********
Year × Treatment0.880.50**0.80
1 Values are means averaged across treatments. 2 Values are means averaged across years. Means followed by different letters within each column are significantly different at 0.05. *: Significant at the 0.05 probability level. **: Significant at the 0.01 probability level. F0: freshwater irrigation. B0, B10, B20, B30: saline water irrigation combined with biochar application of 0, 10, 20, 30 t ha−1.
Table 4. Main effects of year and treatment on topsoil (0–20 cm) total mineral N, available P, available K content.
VariableTotal Mineral N (mg kg−1)Available P (mg kg−1)Available K (mg kg−1)
Year
2016/201724.92 ± 8.16 a 121.64 ± 4.08 a143.24 ± 26.90 a
2017/201822.14 ± 7.56 b20.28 ± 3.76 b129.40 ± 23.59 b
Treatment
F017.25 ± 0.85 c 217.05 ± 0.80 d108.25 ± 4.61 d
B018.20 ± 1.20 c16.95 ± 0.97 d112.00 ± 5.96 d
B1036.45 ± 3.68 a20.80 ± 2.41 c137.30 ± 14.07 c
B2026.60 ± 5.01 b24.05 ± 1.07 b154.65 ± 10.43 b
B3019.15 ± 2.29 c25.95 ± 1.57 a169.40 ± 13.18 a
ANOVA
Year******
Treatment******
Year × Treatment0.480.110.37
1 Values are means averaged across treatments. 2 Values are means averaged across years. Means followed by different letters within each column are significantly different at 0.05. **: Significant at the 0.01 probability level. F0: freshwater irrigation. B0, B10, B20, B30: saline water irrigation combined with biochar application of 0, 10, 20, 30 t ha−1.
Table 5. Main effects of year and treatment on leaf area index at 0, 7, 14, 21 days after anthesis.
VariableLeaf Area Index
Days after Anthesis
071421
Year
2016/20173.86 ± 0.40 a 13.55 ± 0.45 a2.60 ± 0.40 b1.45 ± 0.33 b
2017/20183.35 ± 0.40 b3.41 ± 0.46 b2.70 ± 0.51 a1.70 ± 0.36 a
Treatment
F04.08 ± 0.25 a 24.04 ± 0.13 a3.26 ± 0.16 a2.01 ± 0.20 a
B03.07 ± 0.26 d2.87 ± 0.17 e2.04 ± 0.15 e1.11 ± 0.17 d
B103.76 ± 0.41 b3.75 ± 0.18 b2.69 ± 0.17 c1.63 ± 0.15 b
B203.77 ± 0.29 b3.59 ± 0.18 c2.90 ± 0.16 b1.74 ± 0.28 b
B303.34 ± 0.35 c3.15 ± 0.13 d2.36 ± 0.17 d1.40 ± 0.18 c
ANOVA
Year*******
Treatment********
Year × Treatment0.080.490.200.06
1 Values are means averaged across treatments. 2 Values are means averaged across years. Means followed by different letters within each column are significantly different at 0.05. *: Significant at the 0.05 probability level. **: Significant at the 0.01 probability level. F0: freshwater irrigation. B0, B10, B20, B30: saline water irrigation combined with biochar application of 0, 10, 20, 30 t ha−1.
Table 6. Main effects of year and treatment on photosynthesis rate at 0, 7, 14, 21 days after anthesis.
VariablePhotosynthesis Rate (μmol m−2 s−1)
Days after Anthesis
071421
Year
2016/201723.12 ± 2.39 a 119.56 ± 2.64 a15.84 ± 3.00 a10.36 ± 3.60 a
2017/201819.56 ± 2.08 b16.18 ± 2.51 b12.96 ± 2.93 b8.14 ± 3.42 b
Treatment
F023.55 ± 1.75 a 220.90 ± 1.54 a17.95 ± 1.75 a13.65 ± 1.52 a
B018.45 ± 1.65 d14.10 ± 1.64 d10.20 ± 1.72 d4.35 ± 1.66 d
B1022.50 ± 3.17 ab18.55 ± 3.10 b15.75 ± 2.66 b10.95 ± 2.47 b
B2022.20 ± 2.08 b18.95 ± 1.88 b15.55 ± 1.17 b10.40 ± 0.80 b
B3020.00 ± 2.37 c16.85 ± 2.09 c12.55 ± 1.75 c6.90 ± 1.22 c
ANOVA
Year*******
Treatment********
Year × Treatment0.07****
1 Values are means averaged across treatments. 2 Values are means averaged across years. Means followed by different letters within each column are significantly different at 0.05. *: Significant at the 0.05 probability level. **: Significant at the 0.01 probability level. F0: freshwater irrigation. B0, B10, B20, B30: saline water irrigation combined with biochar application of 0, 10, 20, 30 t ha−1.
Table 7. Main effects of year and treatment on leaf relative water content at 0, 7, 14, 21 days after anthesis.
VariableLeaf Relative Water Content (%)
Days after Anthesis
071421
Year
2016/201780.38 ± 5.31 b 169.00 ± 7.51 a47.26 ± 8.59 a23.02 ± 11.24 a
2017/201875.74 ± 5.08 a65.06 ± 7.30 b43.08 ± 10.04 b18.14 ± 9.96 b
Treatment
F084.30 ± 4.11 a 276.20 ± 3.65 a57.05 ± 3.26 a35.20 ± 4.27 a
B073.05 ± 3.72 d57.55 ± 3.75 d32.10 ± 3.95 d6.65 ± 2.51 e
B1078.25 ± 5.27 bc69.85 ± 5.69 b47.55 ± 5.31 b21.85 ± 5.65 c
B2079.40 ± 4.07 b69.00 ± 3.24 b48.75 ± 3.50 b25.60 ± 4.80 b
B3075.30 ± 4.27 c d62.55 ± 3.80 c40.40 ± 5.34 c13.60 ± 3.80 d
ANOVA
Year*******
Treatment********
Year × Treatment0.590.240.060.23
1 Values are means averaged across treatments. 2 Values are means averaged across years. Means followed by different letters within each column are significantly different at 0.05. *: Significant at the 0.05 probability level. **: Significant at the 0.01 probability level. F0: freshwater irrigation. B0, B10, B20, B30: saline water irrigation combined with biochar application of 0, 10, 20, 30 t ha−1.
Table 8. Main effects of year and treatment on leaf Na+/K+ ratio at 0, 7, 14, 21 days after anthesis.
VariableLeaf Na+/K+ Ratio
Days after Anthesis
071421
Year
2016/20170.53 ± 0.21 b 10.76 ± 0.32 b1.29 ± 0.52 b2.17 ± 0.87 b
2017/20180.71 ± 0.24 a1.01 ± 0.39 a1.55 ± 0.64 a2.53 ± 1.02 a
Treatment
F00.37 ± 0.11 d 20.51 ± 0.10 c0.79 ± 0.10 d1.10 ± 0.15 e
B00.95 ± 0.13 a1.48 ± 0.24 a2.41 ± 0.31 a3.86 ± 0.36 a
B100.70 ± 0.18 b0.87 ± 0.15 b1.33 ± 0.19 b2.23 ± 0.30 c
B200.59 ± 0.15 bc0.77 ± 0.16 b1.10 ± 0.17 c1.98 ± 0.25 d
B300.51 ± 0.16 c0.82 ± 0.29 b1.49 ± 0.24 b2.61 ± 0.30 b
ANOVA
Year********
Treatment********
Year × Treatment0.630.080.170.15
1 Values are means averaged across treatments. 2 Values are means averaged across years. Means followed by different letters within each column are significantly different at 0.05. **: Significant at the 0.01 probability level. F0: freshwater irrigation. B0, B10, B20, B30: saline water irrigation combined with biochar application of 0, 10, 20, 30 t ha−1.
Table 9. Effect of year and treatment on aboveground biomass, grain yield, harvest index, spike number, kernel number, and 1000-grain weight.
VariableAboveground Biomass (t ha−1)Grain Yield (t ha−1)Harvest IndexSpike Number (m−2)Kernel Number (spike−1)1000-Grain Weight (g)
Year
2016/201712.75 ± 0.52 a 15.74 ± 0.33 a0.46 ± 0.02 a496.98 ± 15.96 a24.10 ± 1.07 a46.98 ± 1.71 a
2017/201811.87 ± 0.45 b5.42 ± 0.32 b0.46 ± 0.02 a500.12 ± 16.15 a23.62 ± 0.83 b45.78 ± 1.52 b
Treatment
F012.75 ± 0.36 a 26.05 ± 0.16 a0.47 ± 0.01 a524.80 ± 7.52 a24.70 ± 0.80 a47.25 ± 1.25 a
B011.84 ± 0.35 b5.21 ± 0.25 d0.44 ± 0.01 b494.05 ± 8.02 b c22.70 ± 0.39 b44.45 ± 0.95 b
B1012.02 ± 0.65 b5.66 ± 0.26 b0.47 ± 0.02 a485.85 ± 8.74 c24.15 ± 0.84 a47.40 ± 1.48 a
B2012.17 ± 0.50 b5.65 ± 0.23 b0.46 ± 0.01 a491.10 ± 6.71 bc24.55 ± 0.57 a47.15 ± 1.39 a
B3011.94 ± 0.41 b5.35 ± 0.15 c0.45 ± 0.02 b496.95 ± 10.47 b23.20 ± 0.21 b45.65 ± 1.47 b
ANOVA
Year****0.170.27***
Treatment************
Year × Treatment0.870.530.970.990.550.47
1 Values are means averaged across treatments. 2 Values are means averaged across years. Means followed by different letters within each column are significantly different at 0.05. *: Significant at the 0.05 probability level. **: Significant at the 0.01 probability level. F0: freshwater irrigation. B0, B10, B20, B30: saline water irrigation combined with biochar application of 0, 10, 20, 30 t ha−1.

