1. Introduction
Adoption of conservation tillage for crop production in the arid southwestern USA has become necessary, due to the increasing soil degradation of farm fields. Continued and systematic degradation of the soil quality due to intensive tillage has led to increased farm inputs, threatening farm profit and the sustainability of cropping systems in arid and semiarid southwestern USA [
1].
Conservation tillage systems include a wide range of tillage operations practiced with the goal of protecting the soil from water and wind erosion by maintaining the surface residue cover and promoting water infiltration into the soil [
2]. While the implementation practices of various conservation tillage methods may differ from region to region based on soil type and cropping systems, the basic objectives of such tillage practices remain the same—which is to minimize soil disturbance and maintain surface residue cover, in order to prevent soil degradation through erosion and to improve soil quality.
In the irrigated desert southwestern USA, the conventional tillage method for land preparation often involves moldboard plowing, subsoiling, disking, and harrowing. While plowing and subsoiling are regarded as primary tillage practices in this region, disking and harrowing are considered to be secondary tillage operations to achieve good soil tilth for better emergence and stand establishment. Depending on the condition of the soil during the land preparation, it is not unusual in this region to have agricultural lands disked 2–3× after plowing and/or subsoiling, to control weeds and create optimal seedbeds for crops. Such intensive disturbance of the soil can enhance rapid degradation of agricultural lands and lead to soil erosion by wind which is common in this region.
The conventional tillage practices traditionally offer some essential short-term benefits such as loosening of the topsoil [
3], improved soil aeration [
4], increased soil water infiltration [
5], higher release of nutrient from the soil organic matter through enhanced mineralization [
6] and the breaking of the subsurface compaction which helps in promoting adequate drainage and root growth [
7,
8]. Intensive tillage practices can also aid in weed control by suppressing weed seed germination, dislodging the emerged weed seedlings, and damaging the mature weed plants [
9]. While all the benefits mentioned above can be obtained from the conventional tillage systems, many problems arise from continuous, yearly intensive tillage of agricultural soils in the region. Intensive disturbances of the soil due to conventional tillage practices can leave the topsoil exposed to erosion by wind and water. In the arid southwestern USA, the beginning of the spring season is often accompanied by strong, continuous, and highly erosive winds blowing across the landscape [
10]. This usually occurs at a timing when farmers prepare their land using conventional tillage practices, thus leaving the bare surface soil more easily subject to detachment and transport of soil particles. During the spring season in the study region, it is not unusual to experience dust storms which causes environmental pollution and health hazards [
11]. In New Mexico State, where the current study was conducted, the average annual soil loss due to wind erosion from cultivated croplands increased from 35.7 Mg ha
−1 per year in 1982 to 51.5 Mg ha
−1 per year in 2015 [
12]. These soil loss rates far exceed the soil loss tolerance rate (2.2–11.2 Mg ha
−1 per year) [
13]. Li, et al. [
14] indicated that the significant impacts of wind erosion on soil organic matter and nutrient losses occurred during aeolian transport events in southern New Mexico. Based on field measurements from bare soil, they also reported that wind erosion removed up to 25% of the total organic carbon and total nitrogen from the top 5 cm of the soil over three windy seasons.
Conservation tillage systems such as strip tillage and no-tillage can help address the problems of wind erosion that is often severe in the arid southwestern region of the United States. Some of the benefits that conservation tillage can deliver in arid and semi-arid regions include protection of the soil surface from nutrient losses through residue cover [
15], improved moisture retention in the soil [
16], increased carbon sequestration [
17], and reduced impact of high solar radiation that causes excessive soil temperature during the summer months [
18].
Converting fields from conventional tillage practices to conservation tillage, especially to no-tillage, may negatively impact crop yields especially in the early years of transition [
19,
20,
21]. The reason for the lower yields in conservation tillage during the transition period may be due to soil compaction [
19], lower soil temperature during plant establishment [
22], lower nutrient availability and lower water use efficiency [
20]. The better performance of conventionally tilled soils compared to conservation tillage systems as regards yields can be related to soil texture, with fine-textured soils yielding lower than coarse-textured soils in the conservation tillage [
8]. However, some studies have reported no difference in corn yields between conservation tillage systems and conventional moldboard plow tillage [
23]. As long as equal plant densities and sufficient weed control are maintained, corn grain yields remain uniquely insensitive to tillage over a wide array of soil types, cropping systems, climate, and duration [
24].
Al-Darby and Lowery [
25] reported that corn grain yields between the conservation tillage and conventional moldboard-plowed systems were not significantly different in coarse textured (sandy) soils. Another study in Greece did not find significant differences between conservation tillage and conventional tillage treatments over four seasons in corn plant emergence and silage yields, except for one year where a reduction in corn biomass by 13% was recorded with no-tillage compared with conventional tillage [
26]. Also, according to Lithourgidis, Tsatsarelis, and Dhima [
26], there was an average of 36.0% savings each in total time and total fuel with no-tillage compared to conventional tillage. This study was conducted to evaluate the performance of two conservation tillage systems (strip tillage and no-tillage) in irrigated arid southwestern USA, which is highly sensitive to soil degradation and erosion, compared to the conventional moldboard plow based tillage system in this region. The adoption of conservation tillage in this region can help the farmers to mitigate the environmental issues associated with the degradation of farmlands, to reduce the cost of tillage operations, and to enhance farm profit.
Therefore, the objectives of this study were:
To compare plow based conventional tillage to conservation tillage systems (strip tillage and no-tillage) in how they affect the growth and yield of irrigated silage corn grown in the arid Southwest, and
To compare how these tillage systems affect selected soil quality measurements assessed both in the field and in the laboratory.
2. Materials and Methods
2.1. Study Site and Treatments
A tillage trial was established with corn silage (
Zea mays L.) as the test crop at the New Mexico State University Leyendecker Plant Science and Research Center in Las Cruces, NM (Longitude 32.20595 N and Latitude 106.74951 W). The soil type of the treatment plots is Glendale series described as thermic Typic Torrifluvents according to USDA soil classification [
27]. The elevation of the study site is 1205 m above sea level, while the mean annual precipitation and the mean annual temperature are approximately 250 mm and 17 °C, respectively. The site mean minimum and maximum annual temperatures in Las Cruces are approximately 8 °C and 25 °C, respectively.
Land preparation included planting winter wheat (Triticum aestivum L.) cover crop in the fall (October) of 2016, before the establishment of the tillage treatments in the spring of 2017. Prior to the establishment of the winter wheat cover crop, the land had been in alfalfa (Medicago sativa L.) for 4 years. After the last cut of the alfalfa, the land was disked to a depth of 0.15 m and winter wheat was planted into the ground with a John Deere seed drill. The winter wheat cover crop was mowed in the middle of March 2017, leaving 20 cm tall wheat stubble in the field. The mowed biomass excess materials were baled and removed from the field to be used as forage. In 2018, an oat (Avena sativa L.) cover crop was established in February 2018 and allowed to grow until the end of April 2018, before being terminated by applying Roundup® (Glyphosate) herbicide. By the time of termination in 2018, the cover crop was approximately 20 cm tall. The standing stubble was allowed to dry down for a month before establishing the different tillage treatments. The amount of biomass left in the field by the stubble was measured using a quadrat (0.25 m2). Two quadrat samples were placed in each of the experimental plot and all the biomass within the quadrat was harvested and the dry biomass weight was determined after drying the samples in an oven at 65 °C to a constant weight. On an average for each year, the amount of stubble was about 3.63 Mg ha−1. The experimental design was a randomized complete block design with three tillage treatments ((plow tillage (PT), strip tillage (ST), and no-tillage (NT)) replicated four times. Plow tillage (PT) consists of five tillage passes, plowing with a moldboard plow, subsoiling and disking thrice with a tandem disk harrow. The second tillage treatment was the strip tillage (ST), which involved a single pass tillage system using the 1tRIPr strip tillage equipment (Orthman Manufacturing, Lexington, NE, USA), leading to the establishment of 0.2 m wide planting strips in the field. The third tillage treatment was no-tillage (NT), in which corn was planted by directly drilling the seeds into the undisturbed soil with no follow-up disturbance of the soil. The experimental plots were 12 m by 4 m with four rows per plot.
Hybrid Corn Mycogen TMF2H918 cultivar was planted on 13 June, 2017 and on 22 May, 2018 at a seeding rate of 11 kg/ha, using a John Deere four-row Max Emerge planter with a between-row spacing of 1 m and within row spacing of 0.091 m, and the expected plant population was approximately 110,000 plants/ha. Harvests were performed manually on 20 September, 2017 and on 7 September, 2018 by measuring an area of 6 m2 within the two inner rows and removing all the aboveground biomass. The harvested biomass was weighed in the field using a field scale. A subsample of the harvested material was later oven dried at 65 °C to a constant weight to estimate the total dry matter yield and the biomass moisture content at harvest. After obtaining the yield samples, the whole experimental plot was harvested mechanically and silage was removed from the field. However, the plots were still maintained with their respective tillage treatment for the duration of the second year. The field was left bare in the fall of 2017 until February 2018, when oat cover crop was established until termination in April of 2018. The experimental plots were flood irrigated during the growing season with approximately 380 mm of irrigation water during both trial seasons. Additionally, 162 mm of precipitation occurred during the growing period in 2017, and 115 mm in 2018. Nitrogen fertilizers were applied through the irrigation water (fertigation) throughout the growing season in the form of liquid nitrogen (Uran, 32-0-0) at the rate of 168 kg N ha−1. Phosphorus and potassium were not applied to plots since the soil test conducted indicated sufficient amounts of these nutrients. For the weed control, Roundup® was the primary herbicide used at a rate of 510 g ai L−1 per application, as this corn cultivar was Roundup-Ready. Three applications of Roundup herbicide took place during the growing season. The first application occurred at preplant stage, just after the termination of the cover crops. The second application occurred at one month after planting, while the final application occurred at about 2.5 months after planting.
2.2. Plant Measurements
Crop growth parameters assessed included the plant population and plant height. Plant population was estimated after crop establishment by counting the number of corn plants within 1 m row length, at three random locations per plot. For the plant height, five random but representative plants were flagged and measurements were taken at 30, 50, 70, 90, and 100 days after planting (DAP). Plant height was computed from the average height of five plants per plot, as measured by a meter stick. In 2017, dry biomass samples were sent to a commercial laboratory for forage analysis. Measurements obtained from forage analysis included the dry matter percent, crude protein, acid detergent fiber and total digestible nutrients.
2.3. Soil Measurements
Representative soil samples were collected from each treatment plot with an auger from 0.15 m soil depth before planting and after harvest during 2017 and 2018. Soil samples collected from the field were air-dried in the laboratory before they were analyzed.
Physical measurements assessed on the air-dried soil samples included the dry aggregate size distribution (DASD) and the wet aggregate stability (WSA). The DASD was determined using a Ro-Tap sieve shaker (W. S. Tyler
®) according to the procedure described by Idowu and Kircher [
28], leading to the estimation the mean weight diameter (MWD) of dry aggregates. The MWD of dry aggregates is an indicator of the susceptibility of the soil to wind erosion, and the higher the MWD value, the more the larger aggregate fractions in the soil capable of withstanding soil erosion by wind [
29]. Wet aggregate stability was measured using the Cornell Rainfall Simulator [
30]. The rainfall simulator was set to deliver a storm of 2.5 J of energy applied for 300 s on air-dried soil aggregates > 2–4 mm in size, spread on top of a 2 mm sieve. The relative amount of aggregates left on the sieve after the storm application was regarded as the wet aggregate stability after correcting for moisture content and particles > 2 mm. Other laboratory measurement assessed included the permanganate oxidizable carbon (POXC), an indicator of labile carbon in the soil, which was measured using the technique developed by Weil et al. [
31].
One of the measurements that took place in the field was the soil penetration resistance assessed using FieldScout SC 900 Soil Compaction Penetrometer (Spectrum Technologies, Inc., Aurora, IL, USA). Penetrometer equipment was pushed into the soil at three random in-row positions for each treatment plot, and the penetration resistance at every 0.025 m was logged by the equipment until a depth of 0.3 m. After the field penetration resistance measurements, the data was downloaded from the equipment into a spreadsheet and the average measurements were calculated for three depths (0–0.1, 0.1–0.2 and 0.2–0.3 m depths). Penetration resistance measurements were taken prior to planting immediately after the tillage establishment, during the mid-season, and at harvest.
Volumetric soil moisture content (VMC) was also measured at 0–0.05 m depth during the growing season using a Hydra Probe (Stevens Water Monitoring Systems Inc. Portland, OR, USA). In 2017, the VMC was measured between 40 and 90 DAP, while in 2018, it was measured between 10 and 70 DAP. Soil moisture readings were taken at three random locations within each treatment plot and the three readings were averaged per plot.
At the end of the second year of trial after harvest, representative soil samples were collected from each plot and sent to the laboratory for soil biological assessment using Phospholipid Fatty Acid (PLFA) analysis to estimate the total microbial biomass, diversity index, total bacteria biomass, total fungi biomass, arbuscular mycorrhizae fungi and total saprophytes [
32].
2.4. Statistical Analysis
Analysis of variance (ANOVA) was performed on the data collected from the experimental trials using PROC GLM procedure in SAS 9.4 statistical package [
33] (SAS Institute Inc. 2013), to assess the significance of the treatment effects. However, for the soil penetration resistance, soil moisture contents measured from each treatment plot were included in the model as covariates. When F-test is significant for any fixed effects, a subsequent mean separation was conducted using PDIFF and PDMIX 800 options on LSMEANS at 5% significance level. Data was reported by year due to variable weather and growing conditions among 2017 and 2018 site-years. The non-combined analysis was also supported by significant year × treatment interaction effect in all variables in the ANOVA (data not shown). Apart from ANOVA test, a nonparametric procedure (Kruskal-Wallis Test) was performed to test the treatment differences for measurements in this study due the small sample size, and it was observed that the interpretation of results were mostly not different between the two statistical methods of analysis.
3. Results
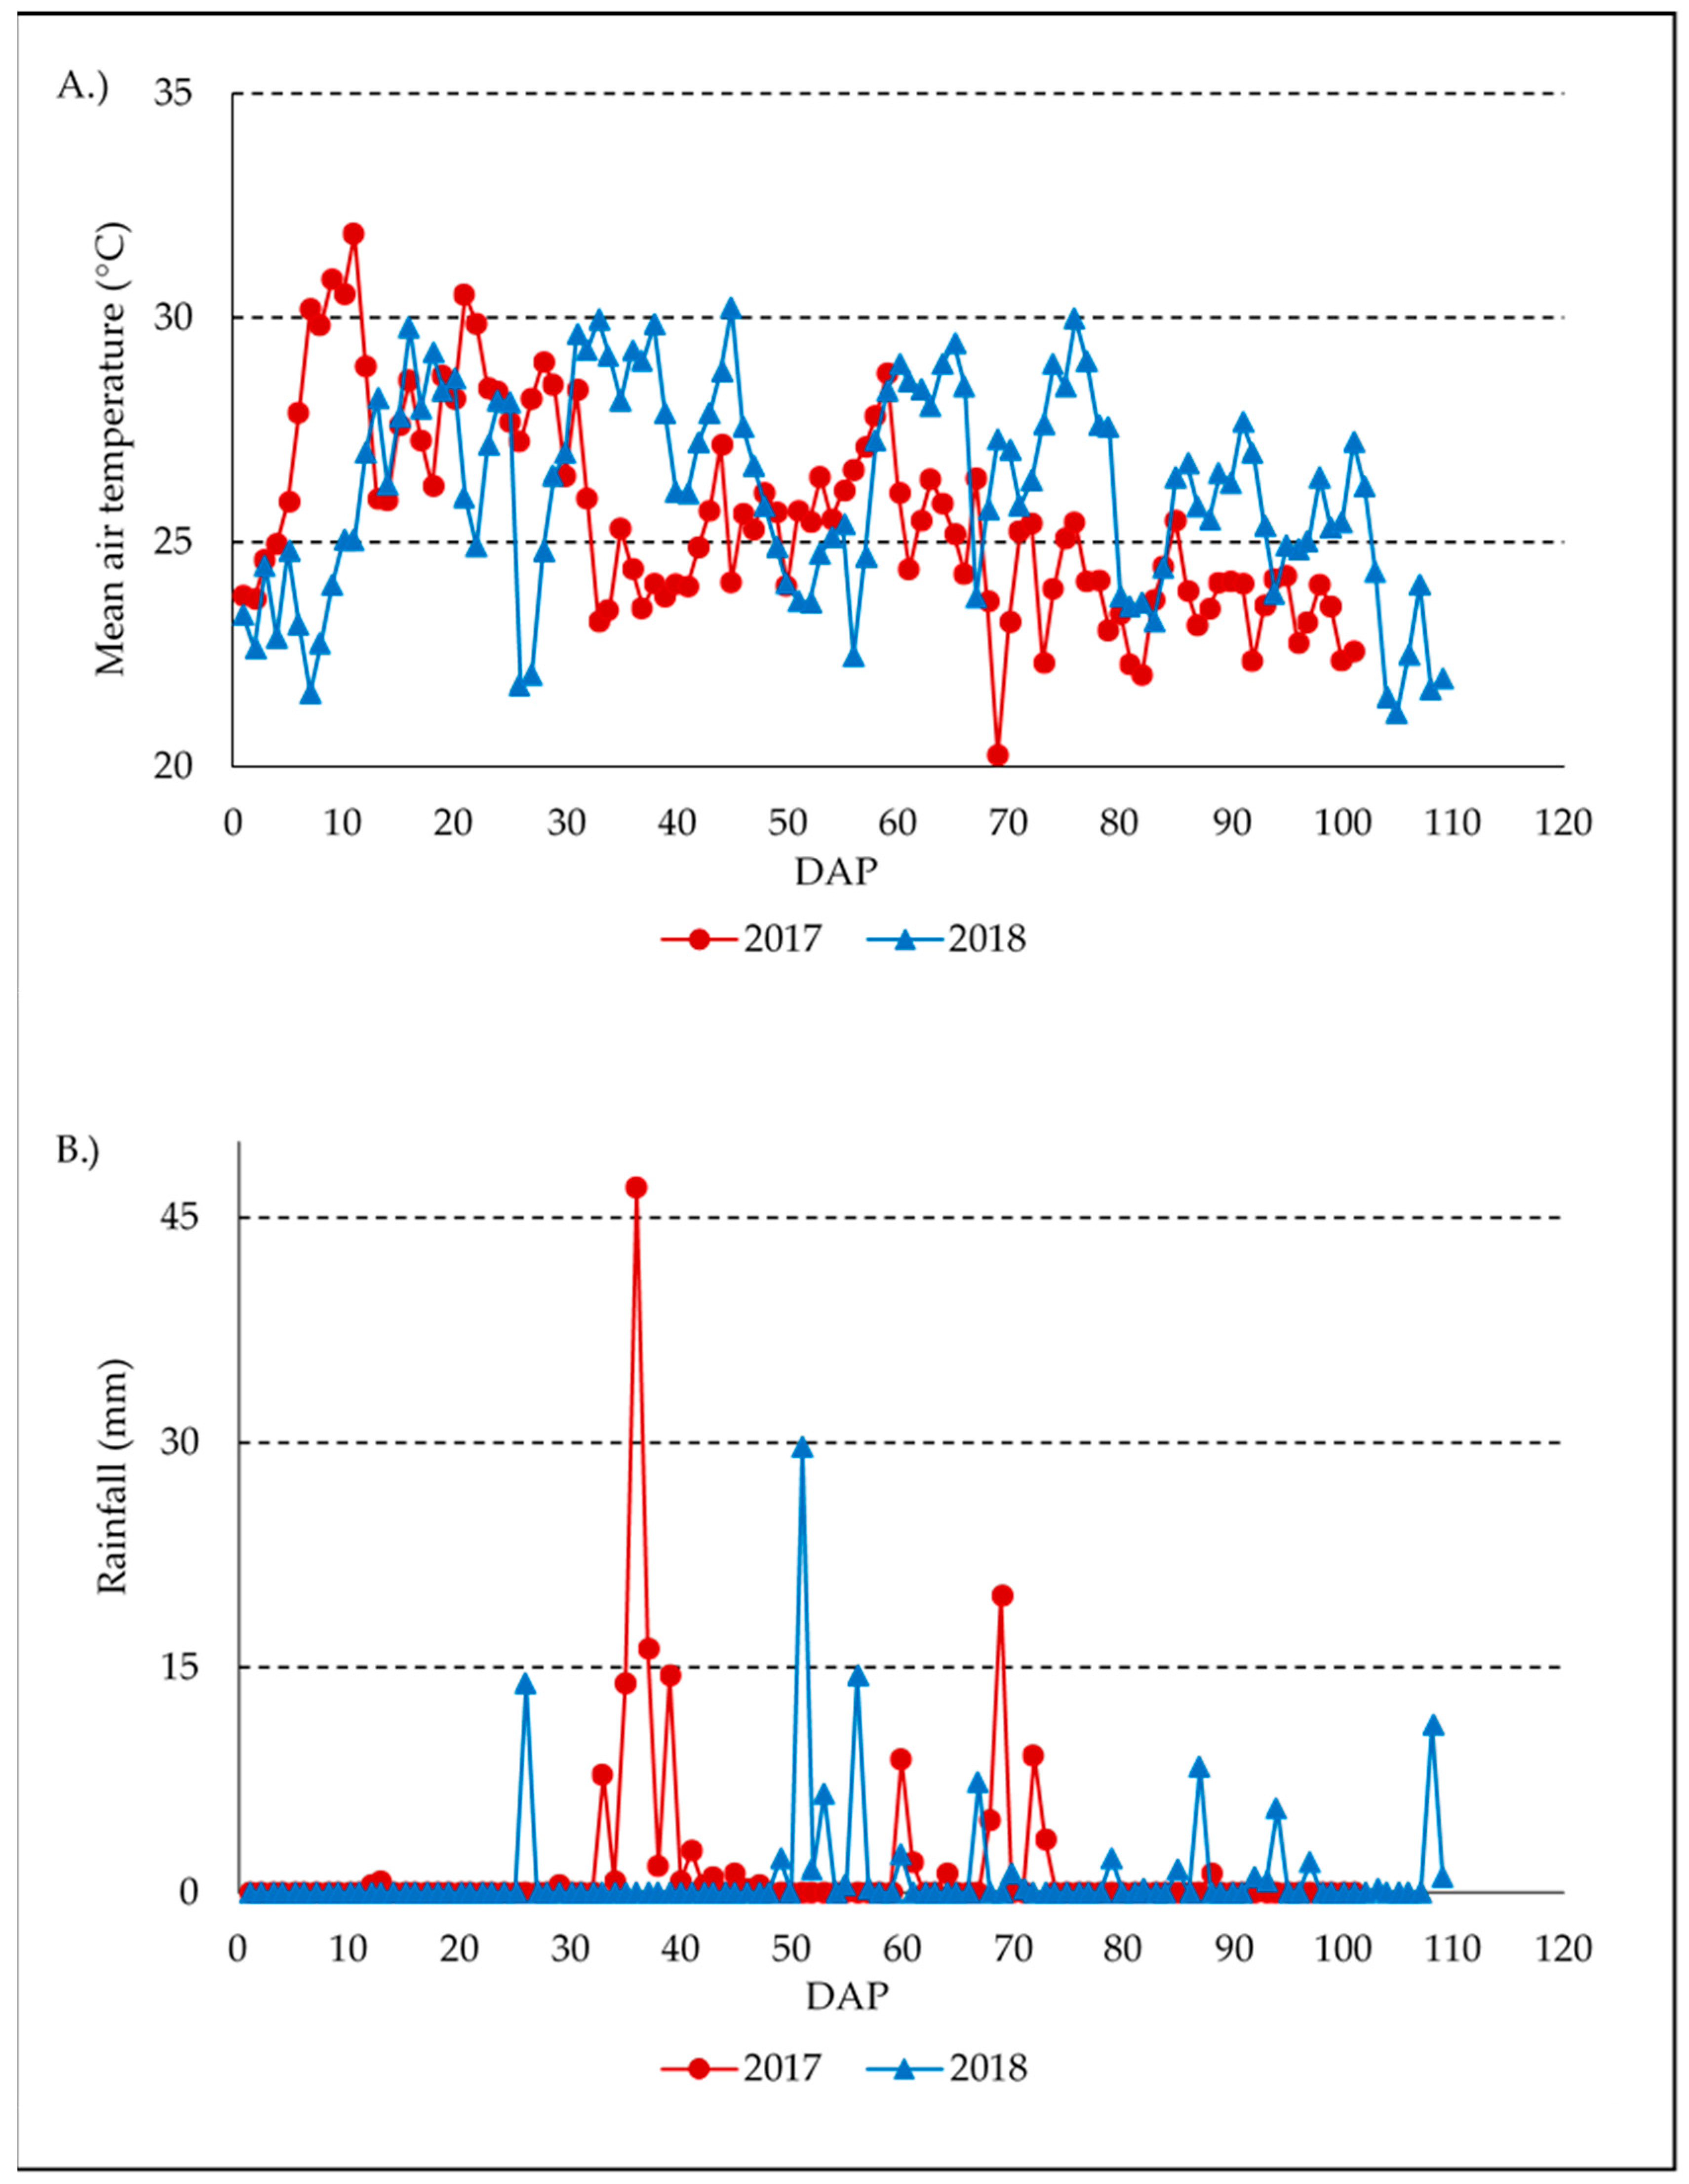
The results were presented by year due to variable weather conditions that existed in 2017 and 2018. Mean minimum and maximum temperatures of the growing season (May–September) were 17.6 °C and 34.4 °C for 2017, and 17.5 °C and 35.3 °C for 2018, respectively (
Figure 1A). The average growing season temperatures were 26 and 27 °C in 2017 and 2018, respectively. The average precipitation occurred during the 2017 growing season was about 162 mm, which was 47mm greater than the 2018 growing season (115 mm) (
Figure 1B). Overall, the 2017 growing season was characterized by cooler and wetter weather compared to the 2018 growing season.
Plant population did not differ with tillage treatments in 2017 and 2018 (
Table 1).
The expected plant population based on planting density was about 110,000 plants/ha. However, plant population after establishment, ranged from 86,111 plants/ha in strip tillage to 107,639 plants/ha in plow tillage in 2017 and from 93,287 plants/ha in strip tillage to 101,360 plants/ha in plow tillage in 2018 (
Table 1).
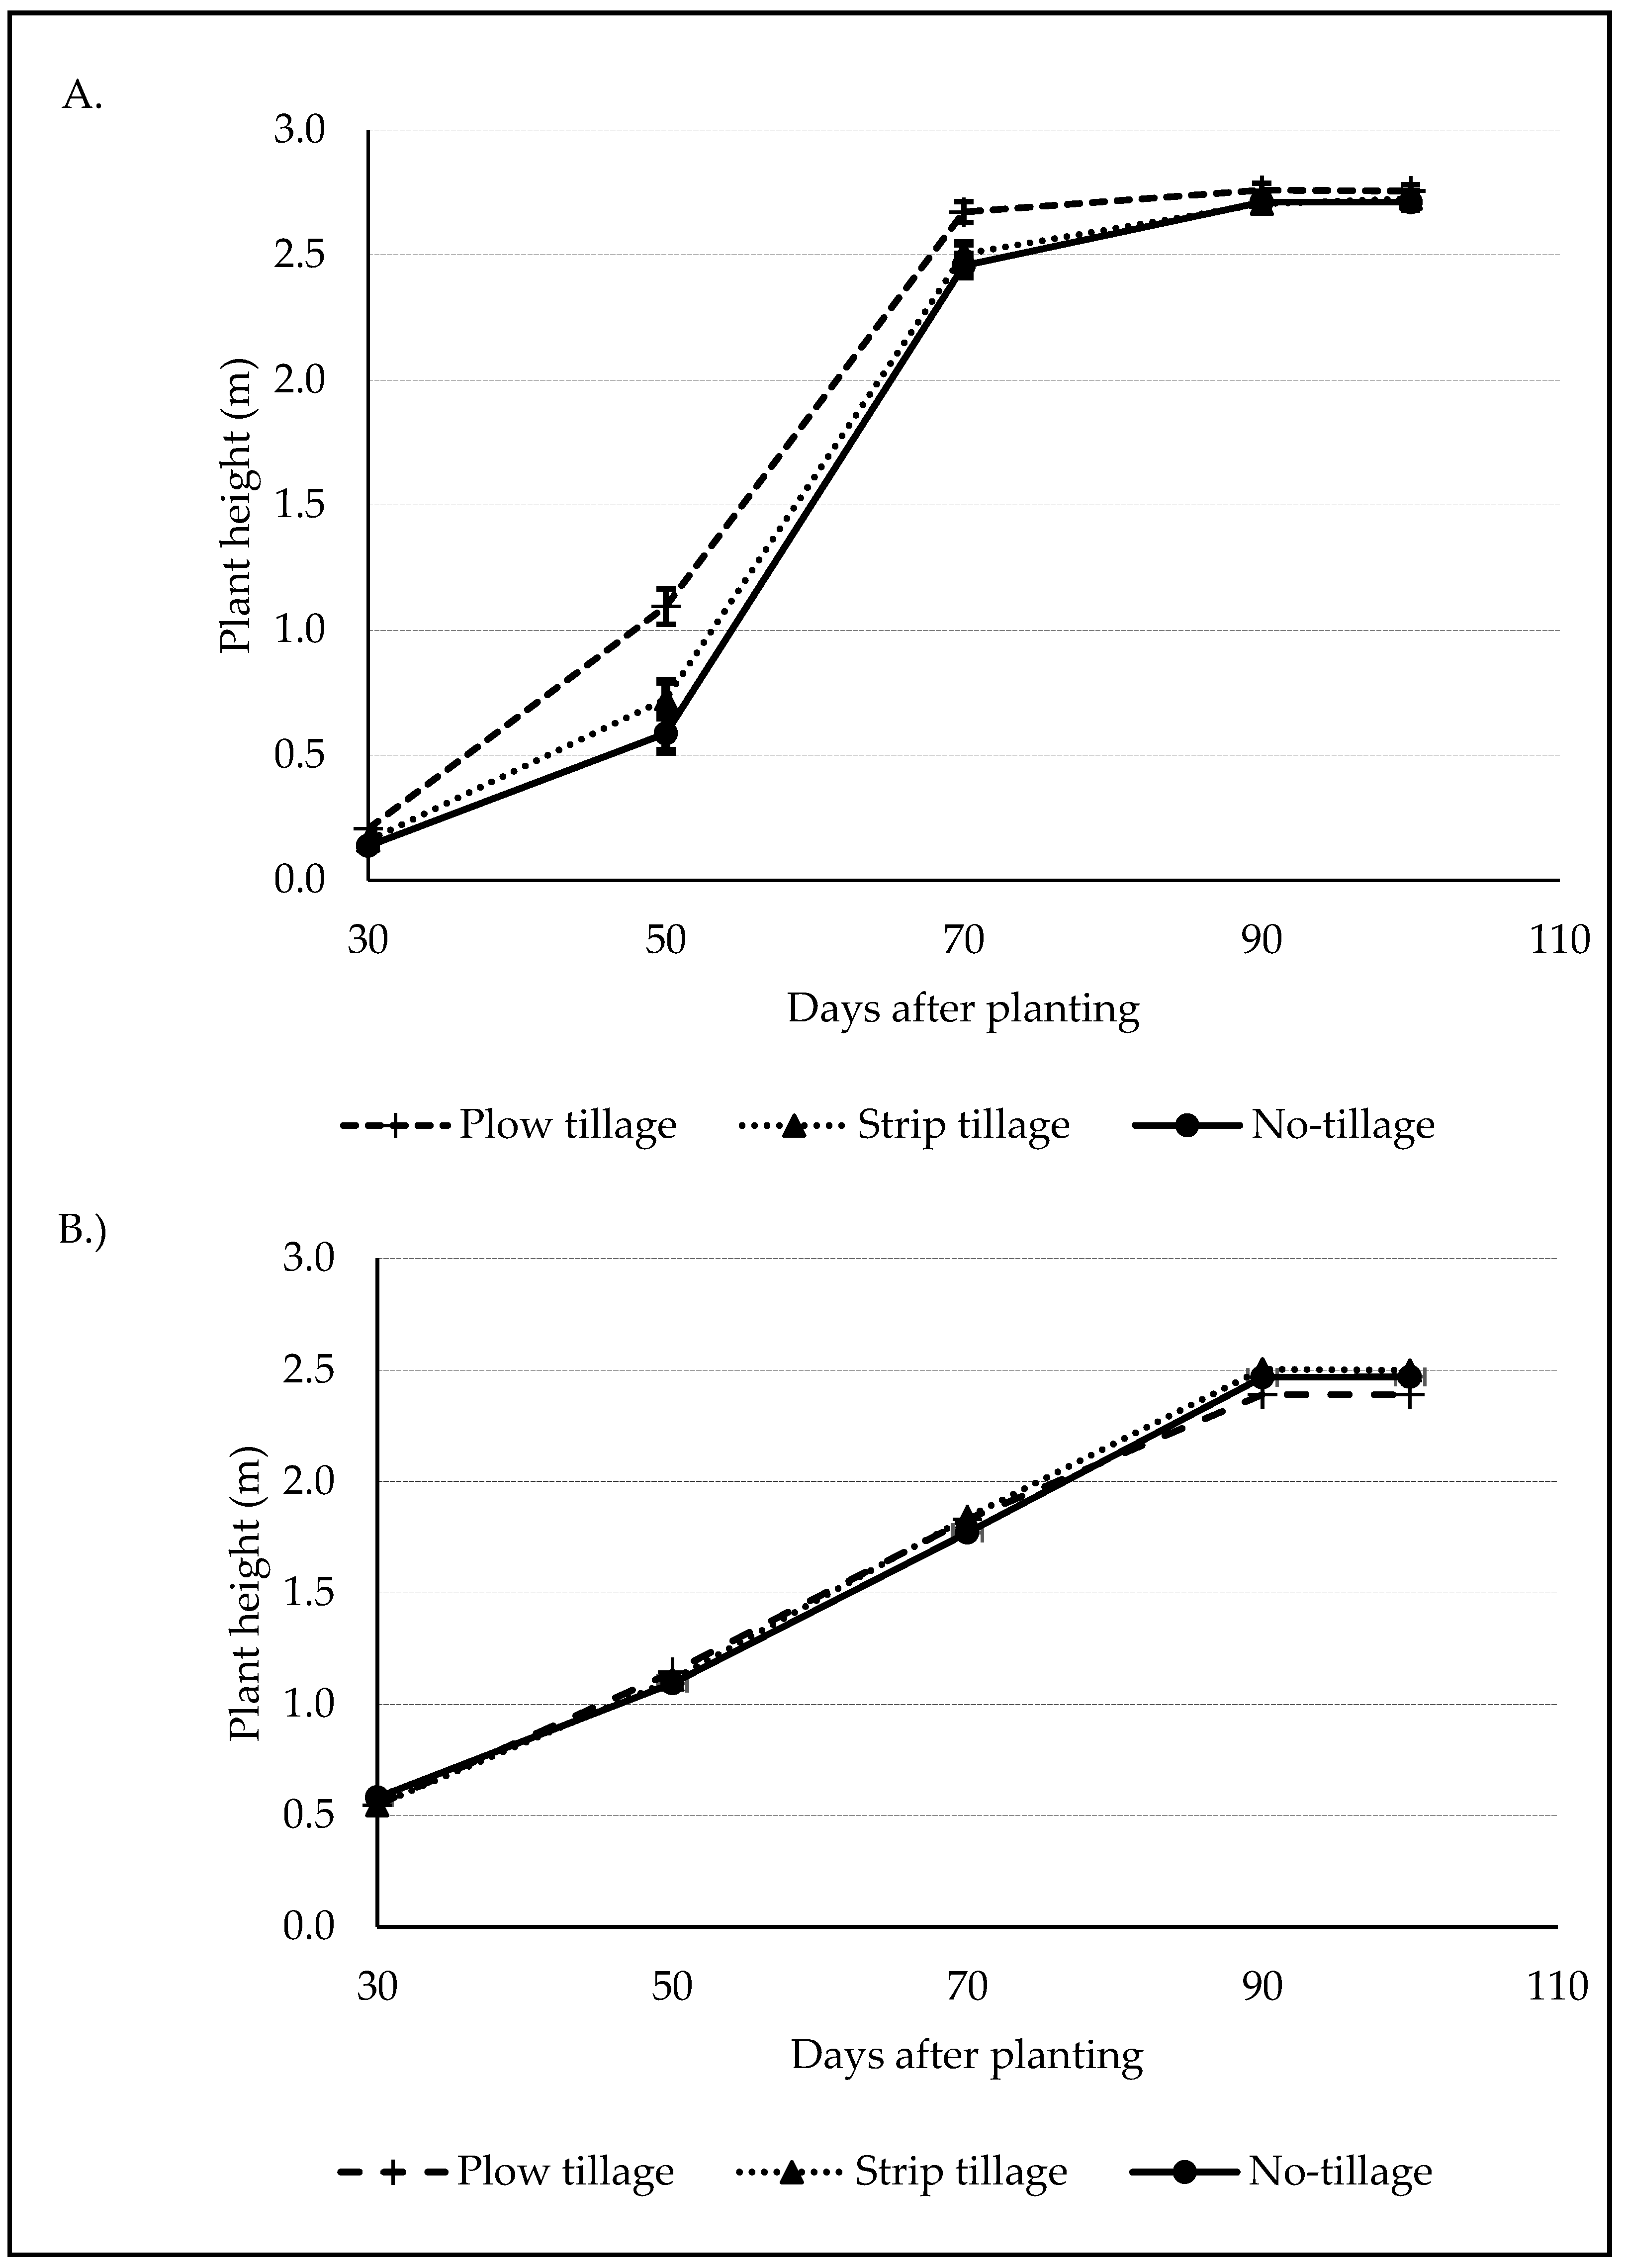
The results of corn plant height during 2017 and 2018 growing season are presented in
Figure 2A,B.
Corn plant height increased rapidly from 30 DAP to until 70 DAP under all tillage systems in 2017, plateaued thereafter till the end of the season. Between 30 and 70 DAP in 2017, the PT treatment had significantly taller plants compared to ST and NT (
Figure 2A), but by 90 and 100 DAP, plant height were not significantly different between the three tillage treatments tested. In 2018, plant height was not significantly different between the tillage treatments at all measurement dates (
Figure 2B). In contrast to 2017, the rate of growth in 2018 was slower as indicated by a gentler slope. In 2018, it took up to 90 DAP before the plant height plateaued in contrast to 70 DAP during 2017 (
Figure 2A,B).
The yields of corn silage at harvest under all the tillage treatments in 2017 and 2018 are presented in
Table 2.
In 2017, there were significant yield differences in the fresh silage yield and moisture content of the silage, while silage yields at 65% moisture content (MC) were not significantly different between the tillage treatments. Significantly higher fresh corn silage yield was recorded for NT compared to PT, while ST was not significantly different from NT and PT (
Table 2). Also, the moisture content of the fresh corn silage was significantly higher in NT compared to both ST and PT (
Table 2).
Selected forage quality results measured in 2017 showed that there was no significant tillage effect on crude protein, acid detergent fiber and total digestible nutrients (
Table 3).
Tillage effect was significant only for the dry matter content with PT having significant lower dry matter content compared to NT and ST (
Table 3).
Soil penetration resistance (SPR) results for 2017 and 2018 are presented in
Table 4 and
Table 5, respectively. The pre-plant SPR measured in 2017 showed that the NT treatments had significantly higher PR compared to ST and PT at all depths of measurement, and while PT and ST were not significantly different at 0–10 cm, they were significantly different at 10–20 cm and 20–30 cm depths with ST having higher SPR than PT (
Table 4). During the mid-season measurement in 2017, the SPR was not significantly different with tillage at 0–10 cm and 20–30 cm depths, but was significant with tillage treatment at 10–20 cm depth, with PT having lower SPR than NT and ST (
Table 4).
The measurement at harvest were not significantly different with tillage treatments at 0–10 cm and 10–20 cm depths, however, for the measurements at 20–30 cm depth, the SPR could not be measured due to very high resistance of the soil to the penetrating probe (
Table 4). In 2018, all the SPR measured at all sampling dates did not show any significant difference with tillage treatments (
Table 5).
Results of the pre-plant and post-harvest soil parameters measured in the laboratory and field are presented in
Table 6.
Mean weight diameter of dry aggregates, wet aggregate stability, and permanganate oxidizable carbon measured at pre-plant and post-harvest periods were not significantly different with tillage treatments both in 2017 and 2018 (
Table 6).
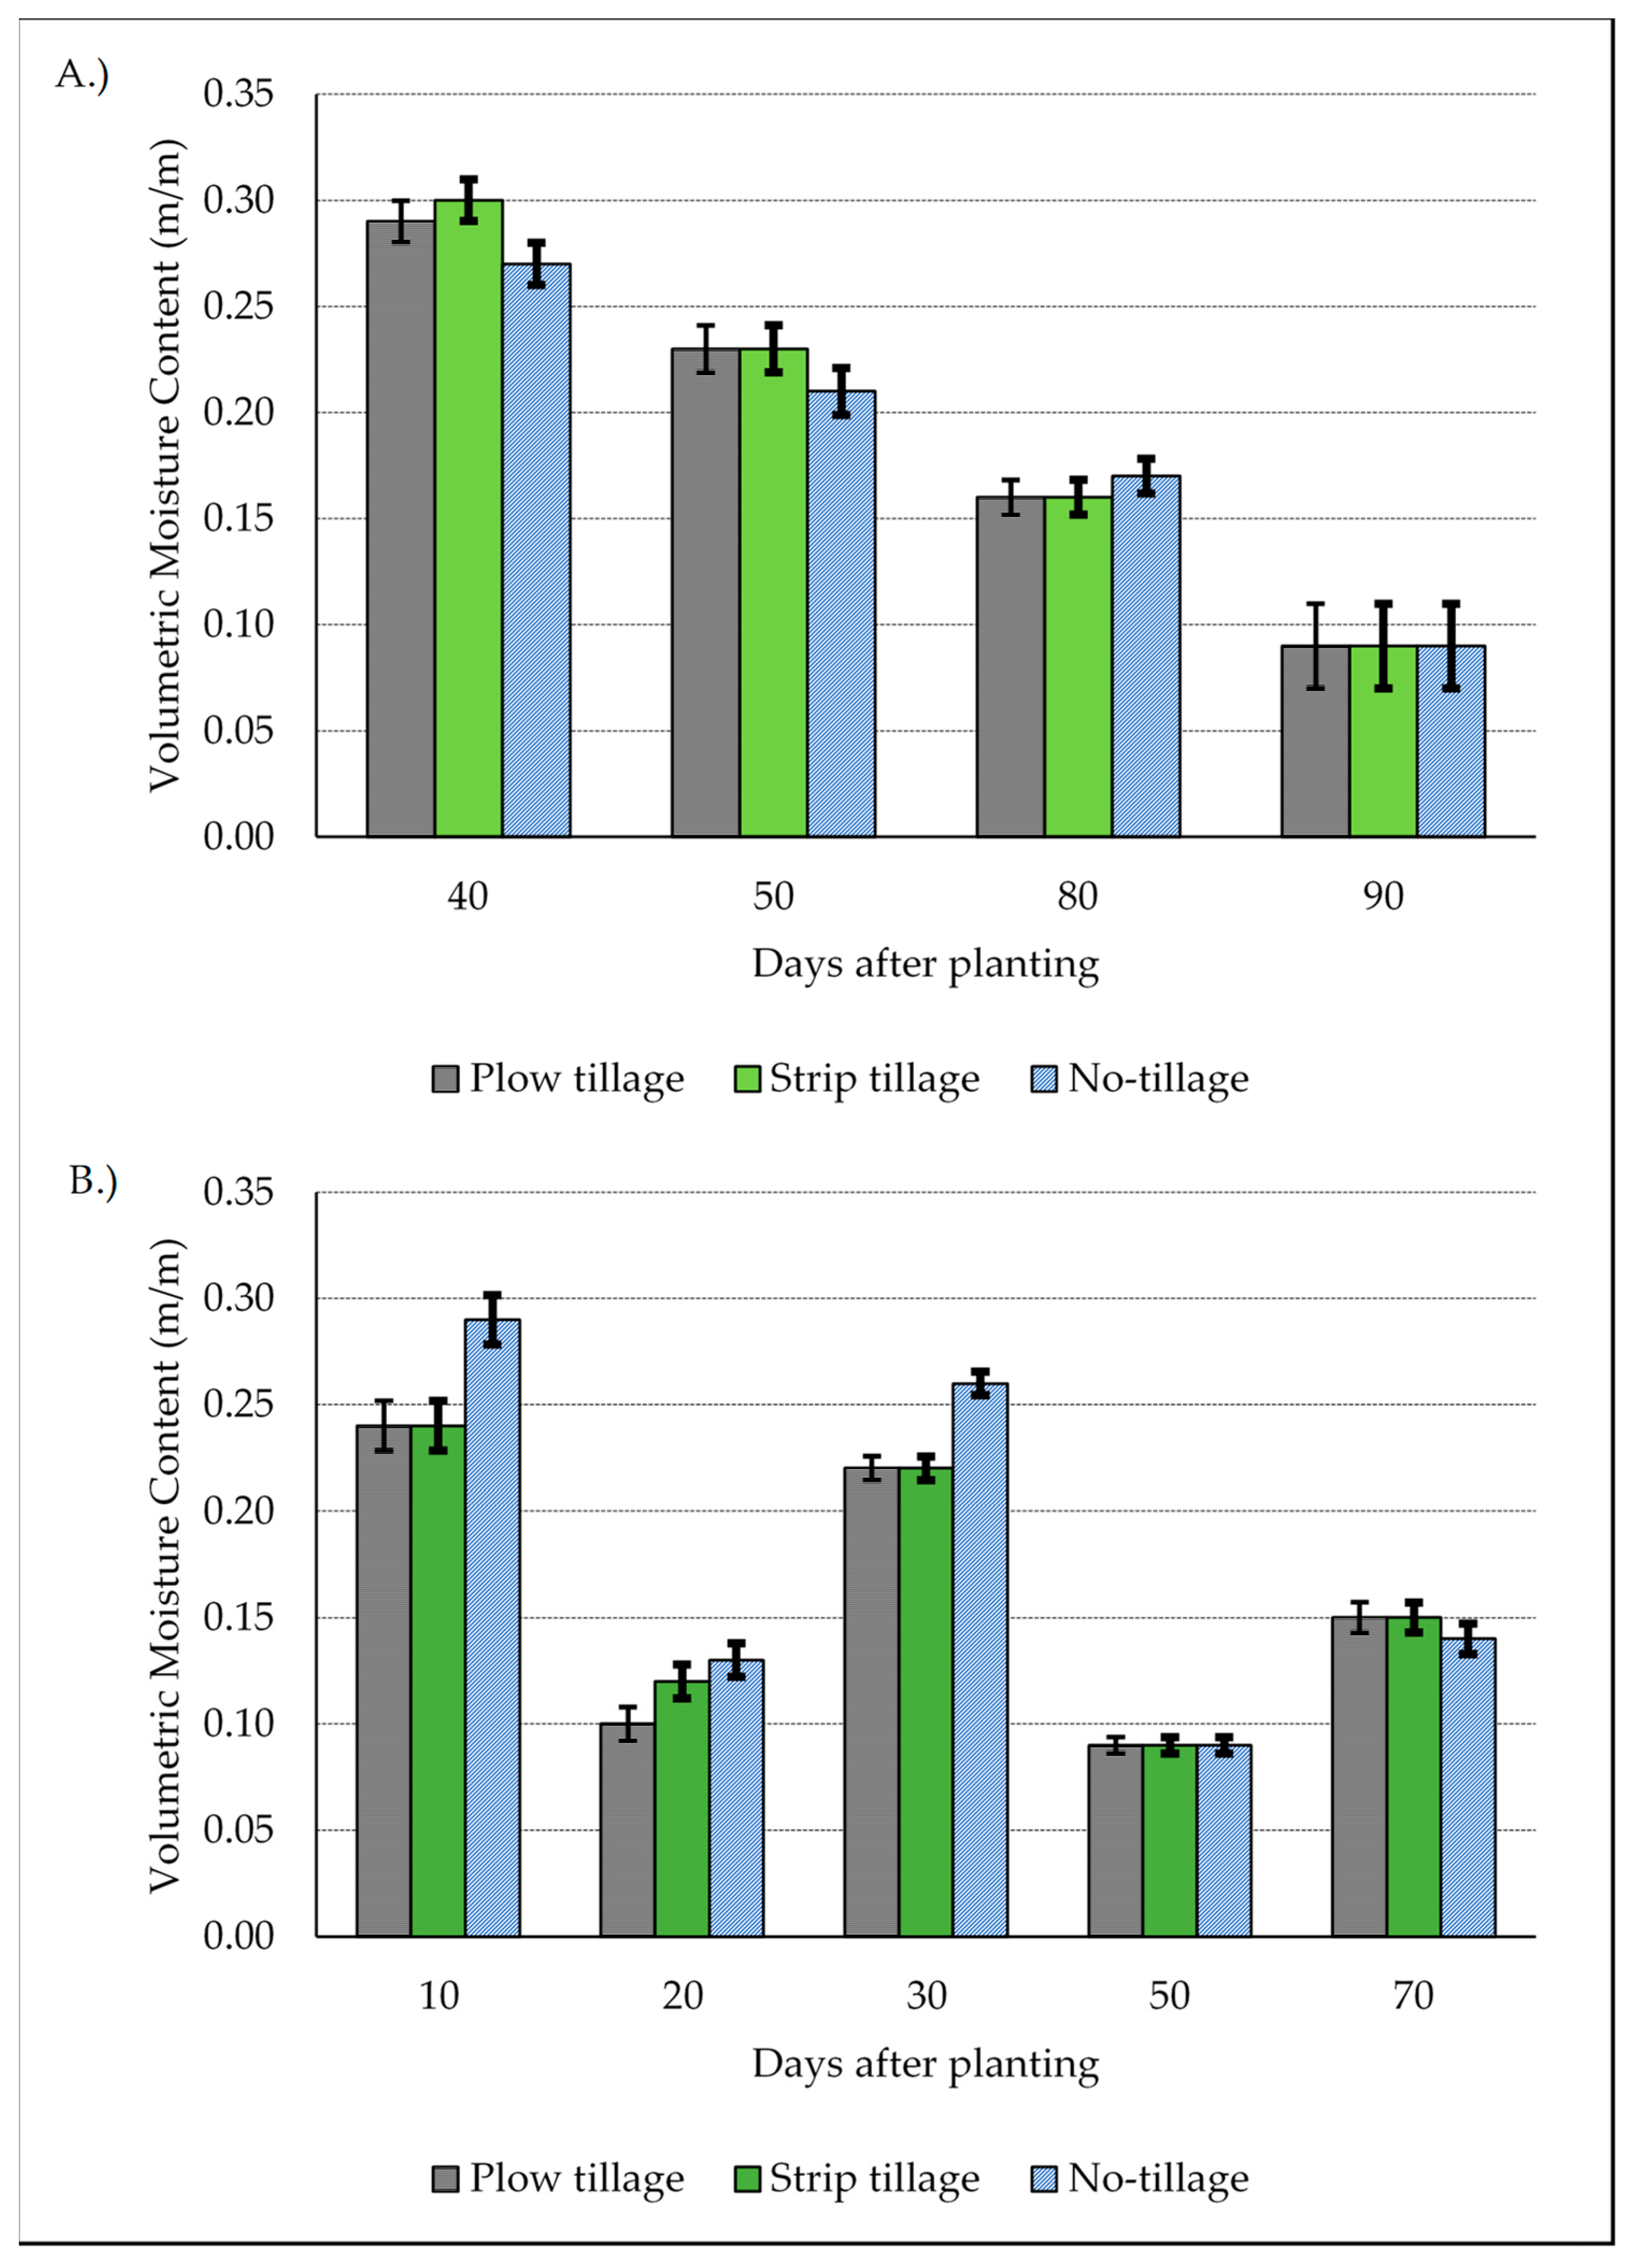
Volumetric moisture content (VMC) measured at 0–0.05 m at different dates are presented in
Figure 2A,B. Results of 2017 showed no significant difference among the tillage treatments at all measurement dates (
Figure 3A), however, the 2018 results showed significant differences for measurements taken at 10 and 30 DAP (
Figure 3B), and for both dates, the NT treatment had significantly higher VMC than both the PT and ST.
Results of selected soil biological measurements assessed at the end of two years of trial are presented in
Table 7.
While the total microbial biomass, total bacteria biomass, and total saprophytes were not significantly different with tillage treatments, the diversity index (DI), total fungi biomass (TFB) and arbuscular mycorrhizae fungi (AMF) were significant different with tillage treatments. While DI and TFB were significantly higher in the NT than ST, there were no significant differences for these measurements between NT and PT (
Table 7). While AMF was significantly higher in PT compared to ST, there was no significant difference in AMF between PT and NT (
Table 7).
4. Discussion
The results of the trial have been separated into two different years since different weather patterns were observed which influenced crop growth and yields during the two years of trial. The year 2017 was characterized by relatively lower temperatures in the mid-season and a greater amount of rainfall compared to 2018 (
Figure 1A,B). In contrast, the majority of the growing season in 2018 was characterized by hot, dry conditions, ample amounts of sunshine with less precipitation compared to 2017 (
Figure 1A,B).
The plant population was below the targeted seeding density (110,000 seeds/ha) in all the tillage treatments. The reduction was more pronounced in ST treatment during both years. In 2017, under the ST treatment, there was a reduction of 22% in plant population after establishment, compared to the expected plant population based on the seeding rate. However, during 2018, the ST plant population was reduced by about 15%. The PT treatment had the least reduction in plant population relative to the seeding density with a reduction of about 2% in 2017 and 8% in 2018. The reduction in the plant population of the NT treatment relative to the seeding density was about 14% in 2017 and 13% for 2018. However, the lack of significant difference in plant population after establishment between the tillage treatments during both years (
Table 1) is an indication that the conservation tillage treatments did not impact emergence of corn seedlings negatively. Plant populations in the conservation tillage system were still within the acceptable range that will not negatively impact silage corn yields and forage quality [
34].
Many trials, especially in humid temperate regions, have reported reduced crop emergence and establishment in no-tillage [
35]. Factors often cited for such problems include the lower soil temperatures at planting in the spring within the CT seedbed, as well as subsurface compaction due to lack of tillage in NT. Low soil temperature was not an issue in this study because the soil temperature at planting in 2017 was 23.8 °C, while in 2018 it was 23.4 °C. These soil temperatures far exceeded the threshold soil temperature (10 °C) required for corn germination and emergence. Early-season compaction was also not an issue across the tillage treatments as shown by the penetration resistance (SPR) results (
Table 4 and
Table 5). Pre-plant SPR in 2017 and 2018 showed that all the measurements across all the tillage treatments, and at all measured depths (0–30 cm), were under the 2000 kPa threshold regarded as resistive to root growth [
36].
The NT treatment, despite lacking in tillage, had good PR (<2000 kPa) at the beginning of the season for both years (
Table 4 and
Table 5). Each of the tillage treatments in this trial were planted following cover crops (winter wheat in 2017 and oat in 2018), to provide residue for soil quality improvement prior to corn establishment. While the cover crops were incorporated in the PT treatment and partially incorporated in ST seedbed rows, the NT had a standing stubble that persisted for most of the season. It is possible that the roots of the cover crops were able to modify the soil by breaking up the compaction, thus resulted in less compacted soil layers that benefited corn growth and development in the NT treatment [
37]. In 2017, by the end of the season, the PR was very high at the depth of 20–30 cm such that the equipment was too hard to push through the soil without risking the bending of the measuring probe (
Table 4). However, in the same plots at the beginning of 2018 season, the NT treatment had reduced to 1194 kPa at 20–30 cm depth during the pre-plant measurements after oat cover crop. This result highlights the importance of combining cover crops with NT systems in the arid Southwest. A previous study [
38], showed that oat cover crop in NT systems led to reduced penetration resistance of the soil relative to the conventional tillage system. Cover crops can serve multiple purposes in the arid southwest. Cover crops provide ground cover during the winter and spring, protecting the soil from erosion, especially during strong wind events that occur early in the spring season [
10,
11]. Another benefit of cover crops is weed suppression during the off-season period. Winter wheat and oat, the cover crops used in this study have been shown to be effective in weed suppression when grown as a cover crop [
39,
40]. While cover crops is highly recommended for this region, the practice of cover cropping is not very common due to cost of water application during the off-season period. Some farmers engage in cropping during the fall/winter season by growing small grains as forage to be harvested in late spring. They are often unwilling to treat these fall planted small grains as cover crops. A compromise solution is to encourage farmers to harvest these crops as forage, but leave 15–20 cm stubble in the field to protect the soil from erosion pending the time that the summer crops will be planted. In addition, significant amounts of organic materials could be added to the soil through the stubble that is left in the field and this can help with soil quality improvement [
41].
Soil moisture conservation in NT systems relative to PT systems has been reported in other research studies [
16,
42]. While there were no significant differences in VMCs measured at all dates in 2017, there was significant impact of tillage treatments on VMC measured in two out of the five measurement dates in 2018. It is possible that the residue cover in the NT treatment reduced soil water evaporation relative to the PT and ST treatments, especially in 2018 due to higher mean seasonal temperatures compared to 2017 (
Figure 1A), leading to significantly higher VMC in NT at these two measurement dates in 2018.
In 2017, plant growth was more rapid under the PT treatment compared to NT and ST (
Figure 2A). This early surge in plant development under the PT treatment may be an indicator that the soil conditions were more favorable under the PT treatment at the beginning of the season, leading to a better crop development in the PT treatment. Since the soil temperature and compaction were not problematic in the NT and ST treatments based on the values of these measurements, the rapid early growth of corn in PT treatment may have resulted from higher mineralization rate due to intensive tillage, thus causing a flush of nutrients that were made available for crop uptake [
43]. Because the cover crop was incorporated into the soil following termination in the PT treatments, a higher mineralization could have occurred compared to the ST and NT treatments, where most or all the crop residues were left as stubble on the ground [
6]. However, by the end of the season, plant height under both NT and ST treatments had reached the same level as in PT treatment (
Figure 2A), indicating that that the early delay in the growth of NT and ST was temporary. The difference observed in plant height during 2017 was not repeated in 2018, as crop growth followed the same pattern irrespective of tillage treatment. Another observation made on the difference in growth pattern between both trial years was the duration it took the plants to reach the maximum height. This typically coincides with the VT stage, when the last branch of the tassel is completely visible. It took about 70 days in 2017 for all the corn to reach VT stage irrespective of the tillage treatments, whereas in 2018, it took about 90 days (
Figure 2A,B). A closer look at this developmental pattern showed that the rapid growth phase as shown by the plant height occurred between 50–70 DAP in 2017 compared to 2018 (
Figure 2A,B). This could have been as a result of the air temperatures during this period of growth for both years (
Figure 1 A,B). Some studies have shown that corn photosynthetic rates are drastically reduced above the temperature of 38 °C [
44,
45]. In 2017, between 50 and 70 DAP, the maximum daily temperature recorded were all under 38 °C, while during the equivalent period in 2018, seven days had maximum daily temperature above 38 °C. It is possible that a more favorable air temperature for photosynthesis led to faster corn growth in 2017 between 50–70 DAP compared to 2018. However, at the end of the growing season, the accumulated growing degree days in 2017 (2480) was lower than in 2018 (2697), with higher yields generally recorded during 2018 trial (
Table 2).
Most of the pre-plant and post-harvest laboratory soil measurements were not significantly affected by the tillage treatment. Although many authors have demonstrated improvement of many soil quality indicators due to the conservation tillage systems, but such improvements often occur after a longer period of time [
46]. For the soil biological measurements assessed after 2 years of study, the NT system showed more favorable soil measurements by having the highest values in five out of the six measurements (
Table 7). However, only three of the biological measurements gave statistically significant responses. Significant improvement in soil microbial diversity and total fungi biomass in NT treatment observed in this study is in line with previous observations in literature [
47,
48]. This result indicate that the soil biological measurements may serve as better indicators of directional change in soil quality in response to soil/crop management, as they appear to be more sensitive compared to the physical and chemical measurements.
The absence of significant differences in yield for the tillage treatments during both years of trial indicate that they were equally effective for yield performance, although the PT treatment still remained quantitatively lower than the rest of the treatments. This observation suggests that transitioning to no-tillage did not affect corn silage yields in this 2-year trial. A factor that may have contributed to the success of the NT treatment could be the previous alfalfa crop that was in the land for 4 years prior to the establishment of the tillage experiment. A previous study has shown the significant impact of alfalfa roots on soil hydraulic properties and aggregation [
49] and this effect can carry over into and impact the subsequent crop grown after alfalfa. With no-tillage, the positive, soil quality effect of alfalfa will be better preserved for a longer period, compared to when an intensive tillage operation for land preparation is used after alfalfa [
50]. Some studies have shown that NT systems can deliver comparable yield to PT even in the first year [
23,
25], while others have highlighted that NT may deliver lower yields than PT [
19,
51]. Also, the forage analysis conducted in 2017 shows that most of the quality parameters of the silage corn were unaffected by the tillage except the dry matter percent which was very slightly higher in NT and ST treatments compared to PT (
Table 3). This study demonstrates that growers can transition to conservation tillage systems for silage corn in the arid Southwest without losses in yield or forage quality, and could benefit from the soil moisture conservation and other soil quality improvements which will accrue over time. However, there may be need to investigate how cropping sequence can affect the transition into no-tillage system. Alfalfa planted for 4 years before the establishment of the tillage treatment could have impacted the results, especially the performance of the NT system. A similar soil that has been in long-term annual crop production with intensive tillage may not necessarily produce the same result for NT as was observed in this study. Previous soil quality before the establishment of conservation tillage may influence crop yields in the early years of transition.
An aspect related to cultural management worth mentioning is the weed control strategy used in this study. Although we have used glyphosate as prescribed for Roundup Ready corn as the weed management strategy, however, this method of weed control is gradually becoming unsustainable with the problem of resistance of some weed species to glyphosate [
52]. Weed control is particularly challenging in the conservation tillage systems, since mechanical weed cultivation is often not an option in such systems. Weed control in conservation tillage systems will have to rely on measures such as the use of cover crops, crop rotation, residue management, appropriate planting density, precision fertilization, in addition to the use of herbicides to build a sustainable weed control program. There is need for research in arid agroecosystems to address the weed control issues that are suitable for conservation tillage systems, to avoid overreliance on the use of herbicides as the sole weed control option.
Another important aspect of this study to consider is the economic benefit that the conservation tillage systems can deliver to farmers. Higher or similar yields obtained for NT and ST compared to PT treatment indicates that the net return will be higher under the conservation tillage systems compared to the PT system associated with multiple field passes, leading to a higher fuel and labor costs for land preparation. Due to reduced number of field passes, fuel and labor, significant economic benefit can accrue to farmers in the arid Southwest by adopting conservation tillage systems.


