1. Introduction
Advances in agricultural technologies such as genetically engineered (GE) crops have helped producers increase production and improve resource-use efficiency; accordingly, these advancements may be some of humanity’s greatest assets in minimizing food insecurity and meeting the growing food demand [
1]. However, due to government regulatory prohibitions and consumer opposition to GE crops, biotechnology solutions involving GE crops have been limited mainly to maize, soybeans, and cotton. In most cases, these crops are not consumed in their unprocessed form but rather processed into food ingredients or used in the fiber or fodder industry. By contrast, the staple crops of wheat and rice, often known as field-to-plate crops, have not seen commercially released cultivars with GM traits, which put wheat and rice at a disadvantage, relative to other staple crops that are non-field-to-plate, in terms of battling weed and insect pressure. This could be problematic, as supporters of agricultural intensification claim that solving food insecurity will require improving technologies of production to create more productive, resilient, and efficient crops that could expand food supply without advancing the agricultural frontier or the environmental footprint of agriculture [
2,
3,
4].
There is evidence that agricultural productivity growth is beginning to slow [
5,
6,
7] and fall behind the growth needed to meet the projected demand by 2050 [
4]. At current yield growth rates, only a 42% expansion in the supply of rice, a staple food for more than half of the world’s population, is possible—instead of the 100% expansion needed to meet the projected demand by 2050 [
4]. Compounding the problem, producers in Asia, where 90% of the global rice production occurs, are shifting away from transplanting rice to direct seeding [
8,
9]. This shift in production systems eliminates the weed suppression advantages of transplanted rice and exposes rice producers to potentially higher yield losses due to weed competition from red rice, in particular. One of the main advantages of transplanted rice (placing a rice plant directly into a flooded paddy) is that it allows for better weed control due to the suppressant effect of water. This is one of the reasons why red rice is an emerging constraint to global rice production [
10]. Again, combating weeds in rice production can oftentimes be more challenging than in other crops such as soybeans and corn, given there is no commercially released herbicide-tolerant GM rice.
Red rice (
O. sativa) is one of the most prevalent and damaging weed problems in direct seeding rice systems worldwide [
11]. Red rice was reported as a problem in the United States as early as the mid-19th century [
12] and is presently a prevalent weed in the Mid-South area comprising Arkansas, Louisiana, Missouri, and Mississippi [
10]. Red rice is problematic primarily because it competes with cultivated rice for light and nutrients, which reduces rice yields. Moreover, red rice tends to shatter more seeds, and does so earlier than commercial rice [
13] and can viably survive in the soil bank for very long periods much better than cultivated rice [
14], all of which makes control and eradication from infested paddy fields very difficult.
The presence of red rice in commercial paddy fields can also generate quality losses due to the presence of abnormal colored kernels in the milled rice. Reported yield losses due to red rice infestation vary from 16% in Vietnam [
15], 50% in Italy [
16], 46% to 58% in Greece [
17], 27% to 45% in the U.S. [
18]-with up to an 88% rice yield loss in Arkansas [
19], and from 60% to 100% in Malaysia [
20]. Red rice infestation can ultimately lead to the abandonment of rice fields due to the prohibitively high yield losses [
11].
Red rice is distinct among weedy rice varieties for having a red pericarp instead of the tan or beige pericarp of cultivated varieties [
21], which diminishes the visual quality of milled rice and can negatively affect the reputation of the rice industry. Rice mills in the U.S. commonly rely on color-sorting equipment to remove red rice kernels from commercial milled rice, which increases milling costs that are partially passed down to the producers in the form of dockage penalties. Another option is to overmill the rice to remove the red bran from the red rice kernels, which increases breakage and reduced mill turnout and grade, which ultimately affects the competitiveness of the rice supply chain.
Control of red rice in commercial rice fields is difficult, because red rice and cultivated rice descend from a common ancestor and therefore are genetically similar [
22,
23,
24,
25]. The physiological and morphological resemblance of red rice and cultivated varieties is a major challenge for the development of selective herbicides to control red rice in paddy fields [
26]. Moreover, although rice (
O. sativa) varieties, including red rice, are considered self-pollinating, they are genetically compatible and, although infrequently, there is some outcrossing among them. A seminal study by Beachell et al. [
27] found that the extent of natural crossing between red rice and commercial rice in the U.S. ranged from 0.00% to 3.39%, with an average of 0.45% for all locations (California, Texas, Louisiana, and Arkansas). The hybrids from the outcrosses present most of the morphological and physiological traits that characterize red rice (e.g., the red pericarp, pubescence, early and heavy shattering, and intense and persistent dormancy) [
21].
Research on the development of herbicide-tolerant (HT) rice resulted in the commercial release of the first Clearfield
® (CL) rice varieties (CL121 and CL141) in the U.S. in 2002. CL rice was obtained through induced mutation in the genes, a non-GM process, that synthesize the acetolactate synthase (ALS) enzyme, making it tolerant to imidazolinone (IMI) herbicides. As such, CL rice is not considered to be GM globally. IMI herbicides inhibit the production of ALS in non-CL varieties and red rice but not in CL varieties, thus serving as an effective red rice management tool [
26]. The yield potential and IMI tolerance of the first generation of CL rice varieties (e.g., CL121 and CL141) improved over the years through further selection of mutant plants and introduction of the CL trait into more productive rice lines. More than 20 CL rice varieties (conventional and hybrid) have been released in the U.S. since 2002, and the adoption by farmers in the Mid-South increased rapidly and reached 650,000 ha or 40% of the area planted to long grain rice in 2010 and has maintained that share since. Globally, Brazil is the largest adopter of CL rice, with an estimated 872,000 ha in 2017–2018 [
28]. More recently, the first Provisia
® rice variety PVL01, which is tolerant to Accase-inhibitor herbicides, was released in the U.S. Provisia
® rice is developed using classical breeding methods from a population of mutants resistant to the herbicide quizalofop, the active ingredient in Provisia
® herbicide.
Most of the HT crops planted globally are genetically modified to tolerate glyphosate (Monsanto’s Roundup Ready
®) and glufosinate (Bayer CropScience’s Liberty Link
®), but to date, no genetically modified rice has been approved for commercial production. In part because of the lag in GM rice development, there are few studies looking at the economic benefits of HT rice. Demont, Rodenburg, Diagne, and Diallo [
29] used a cost of production survey data to estimate ex-ante the benefits of HT rice in the Senegal River Valley and found that this technology could generate a 4% cost reduction (10,000 FCFA or €16 ha
−1) associated with herbicide and labor cost savings to control weeds. One implicit assumption of their study is that rice yields are the same for both conventional and HT rice, and therefore, the benefits to farmers come exclusively from lower production costs. Hareau, Mills, and Norton [
30] estimated ex-ante the economic benefits of deploying HT rice in Uruguay, considering the potential cost savings and yield benefits of such a strategy. They estimate that HT rice has the potential to increase the gross margin by an average of
$32 per hectare. Annou, Wailes, and Cramer [
31] estimated that HT rice adoption in the U.S. may increase net returns by
$29.6–
$98.8 per hectare by lowering the production costs through lower herbicide use and improving rice quality from reducing red rice contamination in harvested rice.
While GM rice is currently not available commercially in the United States, Durand-Morat, Nalley, and Thoma [
32] found that the adoption of CL rice in the United States expanded rice supply by 5.7 million tons or 6% from 2002 to 2014 and generated environmental benefits of around
$457 million. That being said, there is no literature about the cost-benefit of CL adoption for rice producers in the United States. Like most improved seed technologies, CL comes with a premium price associated with it. This study sets out to estimate both the quantity (paddy yield) and quality (presence of red rice kernels) losses associated with various levels of red rice infestation. We then compare the loss value per hectare with the yearly premiums associated with both CL conventional and CL hybrid rice to obtain a CL profit margin over their non-CL alternatives. The results of this study will provide agricultural scientists, producers, and agribusinesses with insight into the value of the CL rice technology and the ability to combat red rice. Furthermore, the results of this study are important given that BASF (the proprietors of the CL technology) has a stewardship agreement with rice producers that states that CL rice cannot be planted in the same field in two consecutive seasons. Given the high infestation rates and large area that red rice affects, many producers are violating this agreement. As such, herbicide-resistant red rice is now becoming a reality in Mid-South rice production. While our study estimates the total value of the CL trait through the counterfactual situation of CL not being commercially released, the alternative way of assessing the impact of the technology is through the progressive loss of protection due to gradual red rice resistance. While outside the scope of our study, an alternative method would be to calculate the economic losses in CL rice as outcrossing rates increase between rice and red rice and the mutation rate is established for the weed population for the ALS gene. Regardless of how losses are calculated, they would converge at the estimates of this study when CL is no longer a viable method to control red rice. Our hope for this study is that providing the entire rice industry with the value of red rice mitigation both at the producer and industry level could inform the ongoing discussion about the importance of protecting the existing CL and Provisia
® technologies, and continuing investing in the development of new tools for the control of red rice.
2. Materials and Methods
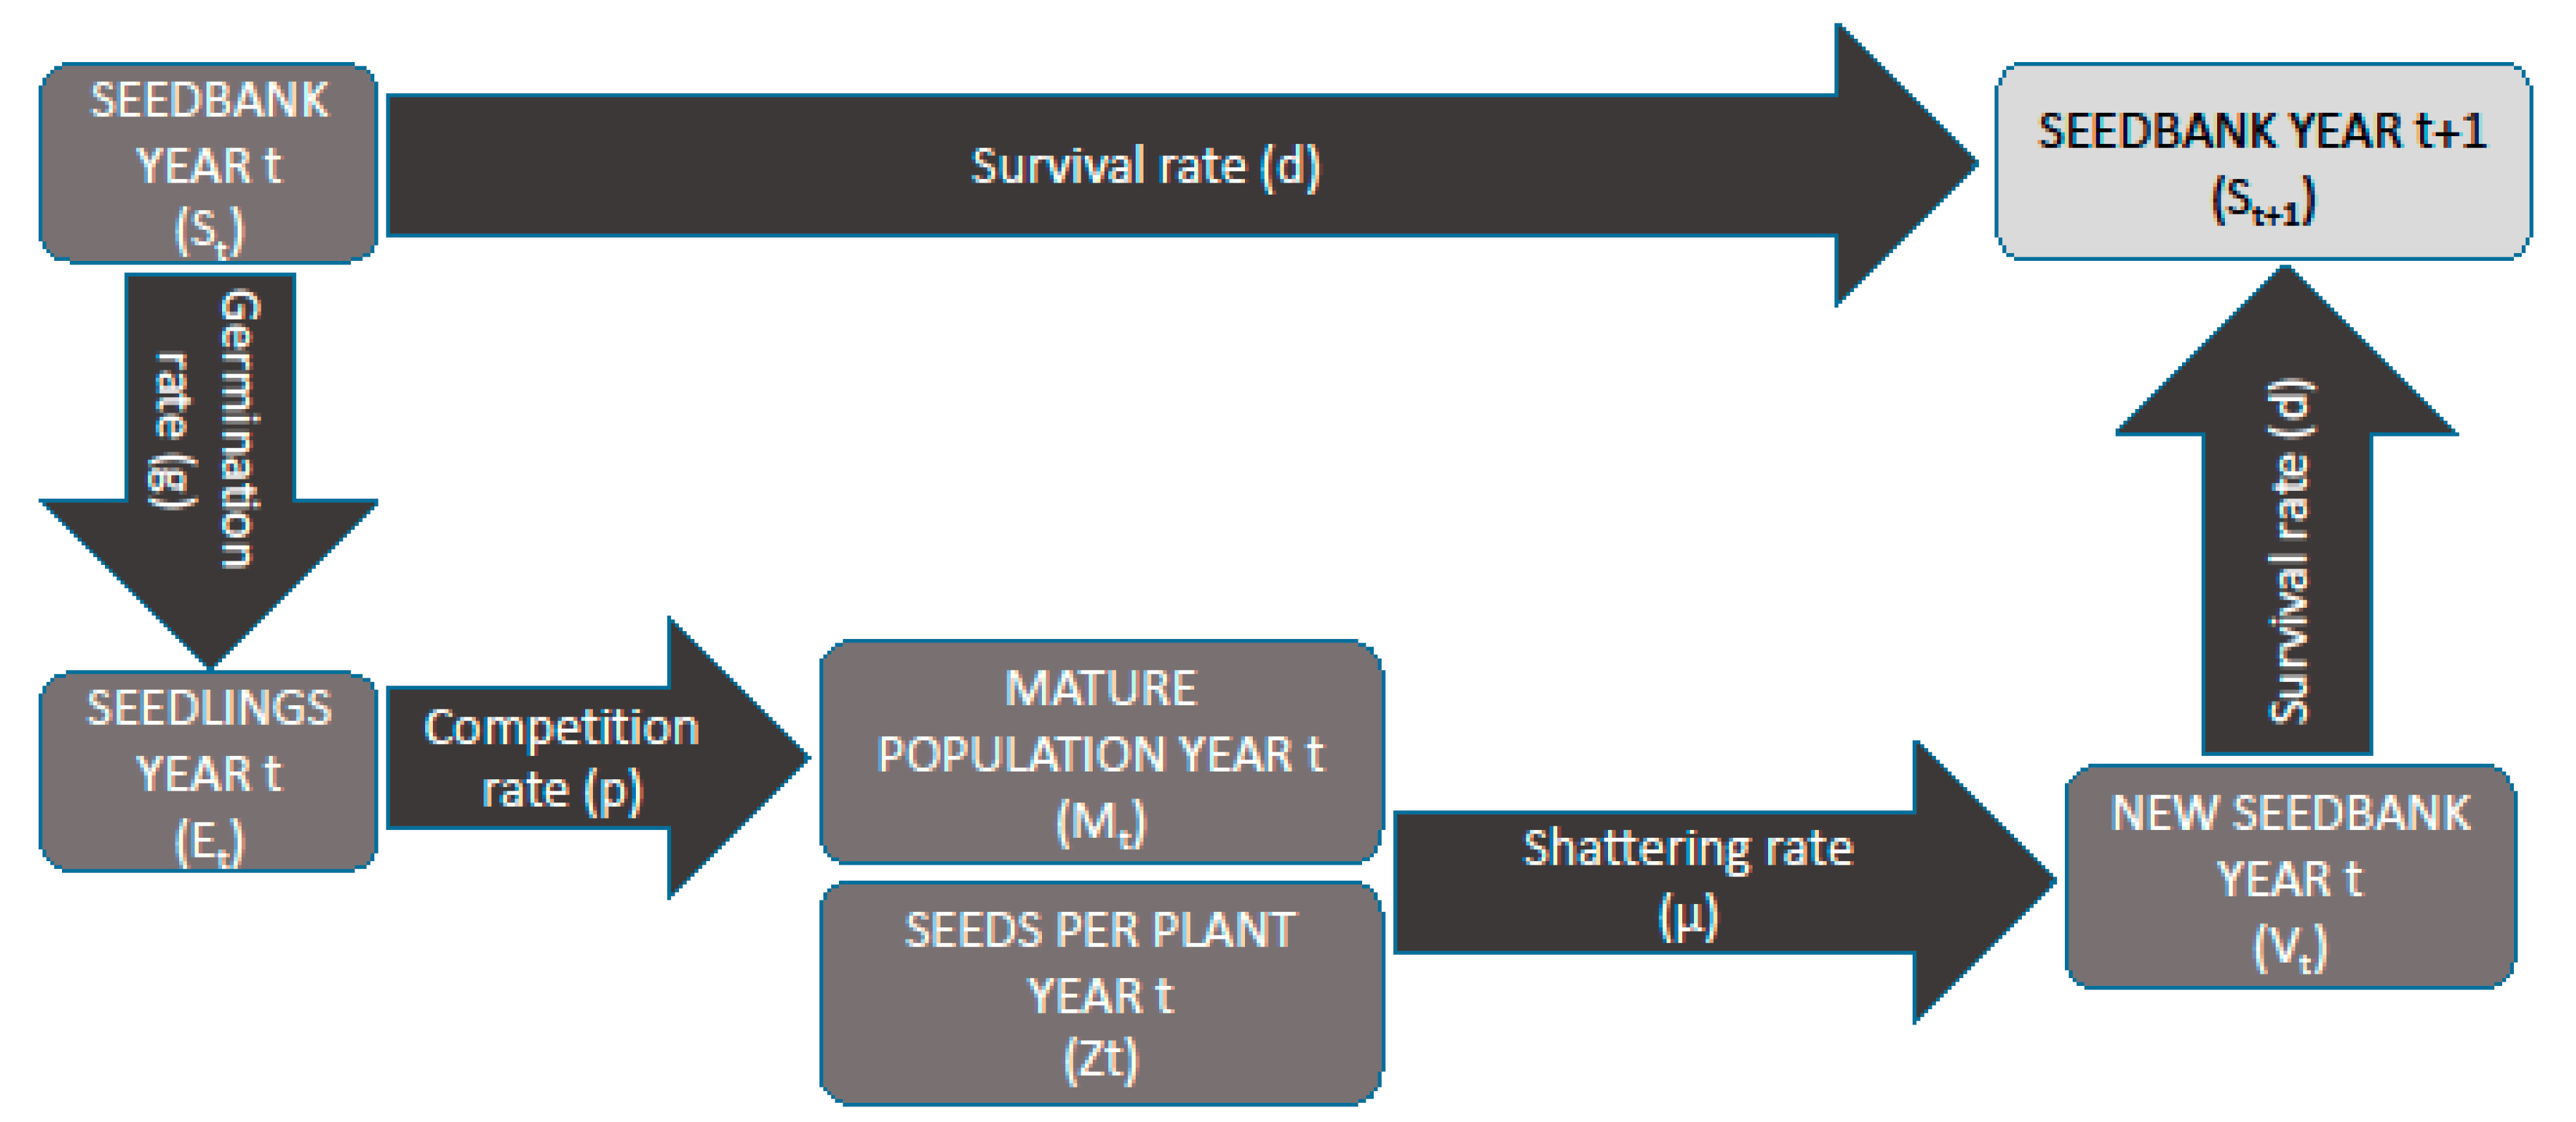
Red rice affects profitability on two fronts: yield reduction through competition with cultivated rice; and quality dockage when taken to the mill (due to the presence of red rice kernels). As such, this study sets out to estimate both the yield losses attributed to an established red rice seed bank as well as estimate the percentage of red rice kernels in commercial rice. We follow the red rice seed bank and rice crop infestation dynamic model put forth by Zhang, Dai, Song, and Qiang [
33] to estimate rice yield loss.
Appendix B provides a brief description of the model. The yield loss function is described as
where
YLt represents the percentage rice yield loss and
Mt is the density of mature red rice per square meter (m
−2) in year
t. Following Zhang, Dai, Song, and Qiang [
33], we dynamically model
Mt as a function of the initial red rice seed bank in year
t that germinates and survives competition. The contribution of mature red rice plants in year t to the initial seed bank in year
t + 1 is a function of the shattering rate, the number of seeds produced per red rice plant, and the dormancy rate. The initial seed bank in year
t + 1 equals the contribution of new red rice seeds in year
t and the proportion of seeds in the initial seed bank in year t that develop dormancy. When rice yield losses increase over time due to the increasing presence of red rice, a producer must decide what action to take to mitigate profit losses. Producers can use pre-seeding herbicide and planting directly into a stale seedbed [
11,
34]. Another option is to rotate crops and herbicide modes of action to control red rice and, subsequently, its seed bank. In the U.S., rice producers typically rotate with soybean (Glycine max (L.) Merr). Another option is to allow a field to go fallow for a certain period with multiple herbicide burndowns, often with glyphosate, in an effort to reduce the red rice seed bank.
Following Durand-Morat, Nalley and Thoma [
32], we estimate the benefit of the CL technology via a counterfactual scenario in which there is no regimen to control red rice. We assume that a rice producer will rotate into another crop when the red rice infestation is such that producing rice is no longer economically profitable (a producer cannot cover their variable costs), which is associated with a yield loss of 38% or more based on the University of Arkansas’ Cooperative Extension cost of rice production for 2002–2014 [
35].
2.1. Yield Loss
Yield loss and milling dockage penalties are a function of the initial infestation rate of red rice in a producer’s field. We follow Durand-Morat, Nalley, and Thoma [
32] and use three different initial red rice infestation rates
r: light, moderate, and heavy, obtained from Burgos et al. [
36] and associated with the presence of 1, 4, and 10 mature red rice plants m
−2, respectively.
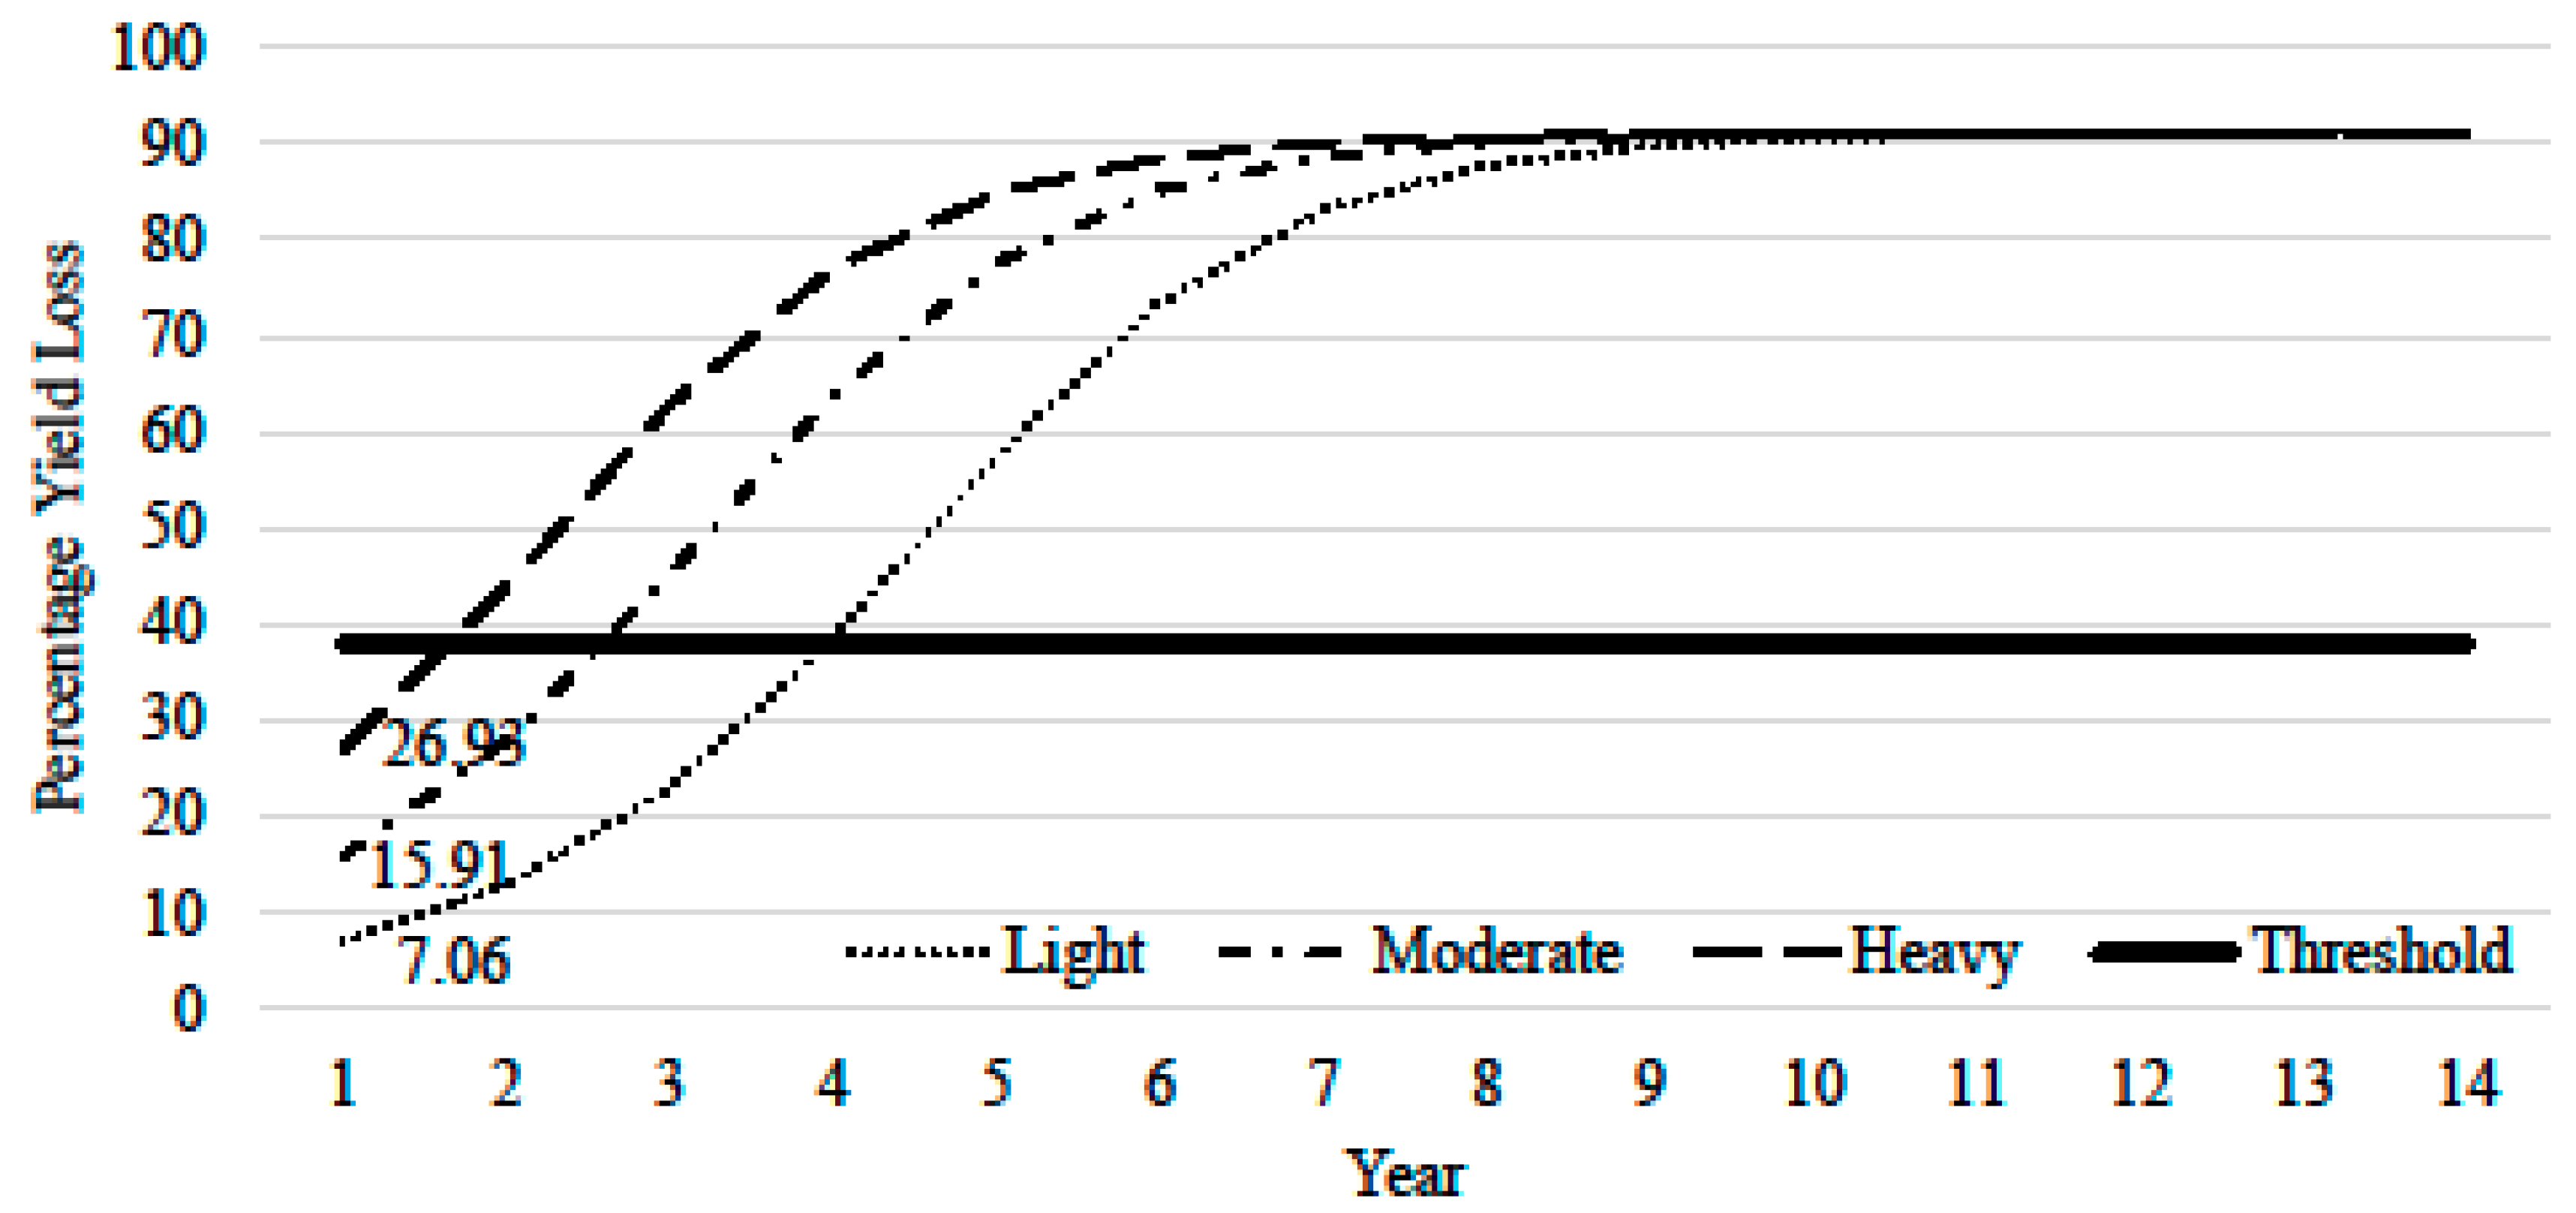
Figure 1 illustrates the three-yield loss (
YLtr) scenarios by initial infestation rates
r over time and highlights how quickly (in growing seasons) a producer would reach the 38% yield loss threshold, which we assume would trigger rotation out of rice because they could not cover their variable costs.
We assume that all producers who use CL technology do so to help mitigate red rice, as it has no other embedded seed technology or inherent yield advantage. What is unknown is the year, after initial infestation, that a producer adopted the CL technology, which will affect the associated yield loss due to red rice. That is, if a producer does not adopt CL technology after the first year of a light, moderate, or heavy red rice infestation, they are estimated to lose 7.06%, 15.91%, or 26.93% of their non-CL rice yield, respectively (
Figure 1). Under the same logic, if a producer does not adopt CL after the second year of a light, moderate, or heavy red rice infestation, they are estimated to lose 12.90%, 27.89%, or 43.91% of their non-CL rice yield, respectively. This would continue until the time (in years) a producer would lose 38% of their yield (e.g., year 2 for the heavy infestation scenario), at which point they would rotate out of rice because they could not cover their variable costs. Equation (1) was used to determine the minimum, mean, and maximum yield loss associated with each of the three infestation scenarios: light (7.06%, 20.35%, 38%), moderate (20.35%, 27.27%, 38%) and heavy (26.93%, 32.45%, 38%). Because the timing of CL adoption under each red rice infestation scenario has a direct impact on the magnitude of the yield loss, we simulate the time of adoption and its associated yield with the triangular distributions defined by the minimum, mean, and maximum values presented above.
Part of the discussion about the productivity impact of bioengineered crops is caused by the confounding information generated by the inappropriate use of production data, more specifically data aggregation and omission of relevant explanatory variables. Following Lusk, Tack, and Hendricks [
37], we use historical panel data of rice production by rice variety and year at the county level. A total of 5101 yield observations of dry-seeded long grain non-fragrant rice varieties were obtained from the University of Arkansas Division of Agriculture, Louisiana State University Ag Center, and the Mississippi State Agricultural and Forestry Experiment Station between 2002 (the initial release year of CL) and 2014 across 85 rice growing counties/parishes. Each plot consisted of seven rows, only the inner five rows of rice was harvested by a plot combine and was 1.5 × 5.0 meters in diameter. Although a gap between experimental and actual yields exists, Brennan [
38] concluded that the most reliable sources of relative yields are cultivar trials outside of actual farm observations. Although yields are often greater in experimental test plots as compared with producers’ fields, the relative yield differences between varieties are assumed to be comparable. The dataset included 44 rice varieties commercially released in the Mid-South. The dataset consisted of 25 inbred non-CL lines (Conventional), 9 inbred CL lines (CL), 5 hybrid lines (XL), and 5 hybrid CL lines (CLXL), representing 48.63%, 27.58%, 6.31%, and 17.48% of the total yield observations, respectively. Cultural practices varied somewhat across the locations over time, but overall, the rice variety trials were conducted under conditions for high yield. That is, input rates and types varied across time and location as recommendations evolved for new varieties and production practices. The average yields, across all locations and years, for Conventional, CL, XL, and CLXL varieties were 8.99, 8.54, 11.07, and 10.32 metric tons per hectare (MT ha
−1), respectively. Yield differences between Conventional and CL varieties, and between XL and CLXL varieties are not statistically different at the 5% significance level, which suggests that the main rationale for adopting CL is not necessarily yield potential but yield loss mitigation. Only in three out of the 13 years in the study did CL and CLXL have higher average yields than Conventional and XL varieties, respectively.
We performed 1000 Monte Carlo yield simulations to estimate the yearly yield distributions from actual yield data for each of the four rice types (Conventional, CL, XL, and CLXL). From the non-CL rice varieties (Conventional and XL), we subtract the simulated triangular yield loss associated with each initial red rice infestation rate
r, as described above. The yield loss in non-CL variety
i in year
t with infection rate
r,
Litr is estimated as
where
Yit is the simulated yield (MT ha
−1) for non-CL rice type
i (Conventional or XL) in year
t and
YLtr is the simulated percentage yield loss associated with red rice infestation rate
r (light, moderate, and heavy) in year
t.
2.2. Dockage Penalty
Red rice reduces the value of rice output via the reduction of yields and quality due to contamination with red rice kernels. For marketing and packaging purposes, it is not desirable to have red kernels comingled in with white rice.
Table 1 shows the USDA rice standard for red rice dockage [
39] and the associated discounts obtained from the largest rice miller in the U.S. [
40]. Discount rates vary greatly by grade and can therefore significantly reduce revenue in the presence of a severe red rice infestation. Following [
33], we simulate the red rice contamination in the paddy rice. Specifically, we modify Equation (A5) to account for the number of red rice kernels that remain in the panicles after shattering and are thus harvested together with commercial rice. In particular, we estimate the number of red rice kernels at time t and infestation rate
r that do not shatter,
Xtr, as
where
Mtr is the density of mature red rice in the population in year
t and infestation rate
r,
Ztr is the production of seeds per mature red rice plant in year
t and infestation rate
r, and
µ is the shattering rate for red rice. For the light, moderate, and heavy red rice infestation scenarios, we estimate that in the initial year of infestation each mature red rice plant produces 1065, 1019, and 940 seeds, respectively. The number of seeds produced per red rice plant varied inversely with the level of infestation [
31]. In other words, the lower the competition with other red rice plants, the higher the production of kernels per red rice plant. Using the shattering rate of 43% estimated by Zhang, Dai, Song, and Qiang [
33], we estimate the number of red rice kernels that do not shatter at time t to be 605, 2324, and 5357 kernels m
−2 for the light, moderate, and heavy infestation scenarios, respectively. Assuming that 1000 kernels of red rice weigh 25 grams, we then convert
Xtr to grams m
−2. We estimate the percentage (by weight) of red rice present in the commercial non-CL paddy rice,
RR%itr relative to the yield of non-CL variety
i in year
t and infestation rate
r net of losses due to red rice as
Finally, we estimate the discount per metric ton of non-CL rice variety
i in year
t and infestation rate
r (
$ MT
−1) due to red rice in the sample,
Ditr, based on Equation (4) and the discount values in
Table 1.
2.3. Profitability
Yearly (2002–2014) profitability was estimated for each of the four rice types (Conventional, CL, XL, and CLXL) and the subsequent CL technologies profitability were compared with their non-CL alternatives. The mean and standard deviation of the simulated annual yield for each of the rice types are described on
Table A1 in
Appendix A. The profitability (
$ ha
−1) of CL rice variety
j (CL and CLXL) in year
t,
πjt, is defined as
where
Yjt is the simulated yield (MT ha
−1) of CL rice variety
j (CL and CLXL) in year
t,
Pt is the long grain rice price (
$ MT
−1) in year
t, and
Cjt is the total cost of production of CL rice variety
j (
$ ha
−1) in year
t. Although there are differences in the seed costs between CL and non-CL rice types, this study used total cost of production to account also for other differences in production costs between CL and non-CL varieties, such as differences in herbicide and application costs. That is, solely looking at the difference in seed costs is not a holistic analysis of differences in costs. Cost of production for each of the rice types was obtained from the University of Arkansas Cooperative Extension Service [
34] for each of the years in the study.
The profitability (
$ ha
−1) of non-CL rice variety
i (Conventional and XL) in year
t and infestation rate
r,
πit, is defined as
where
Cit is the total cost of production of non-CL rice variety
i (
$ ha
−1) in year
t.
4. Discussion
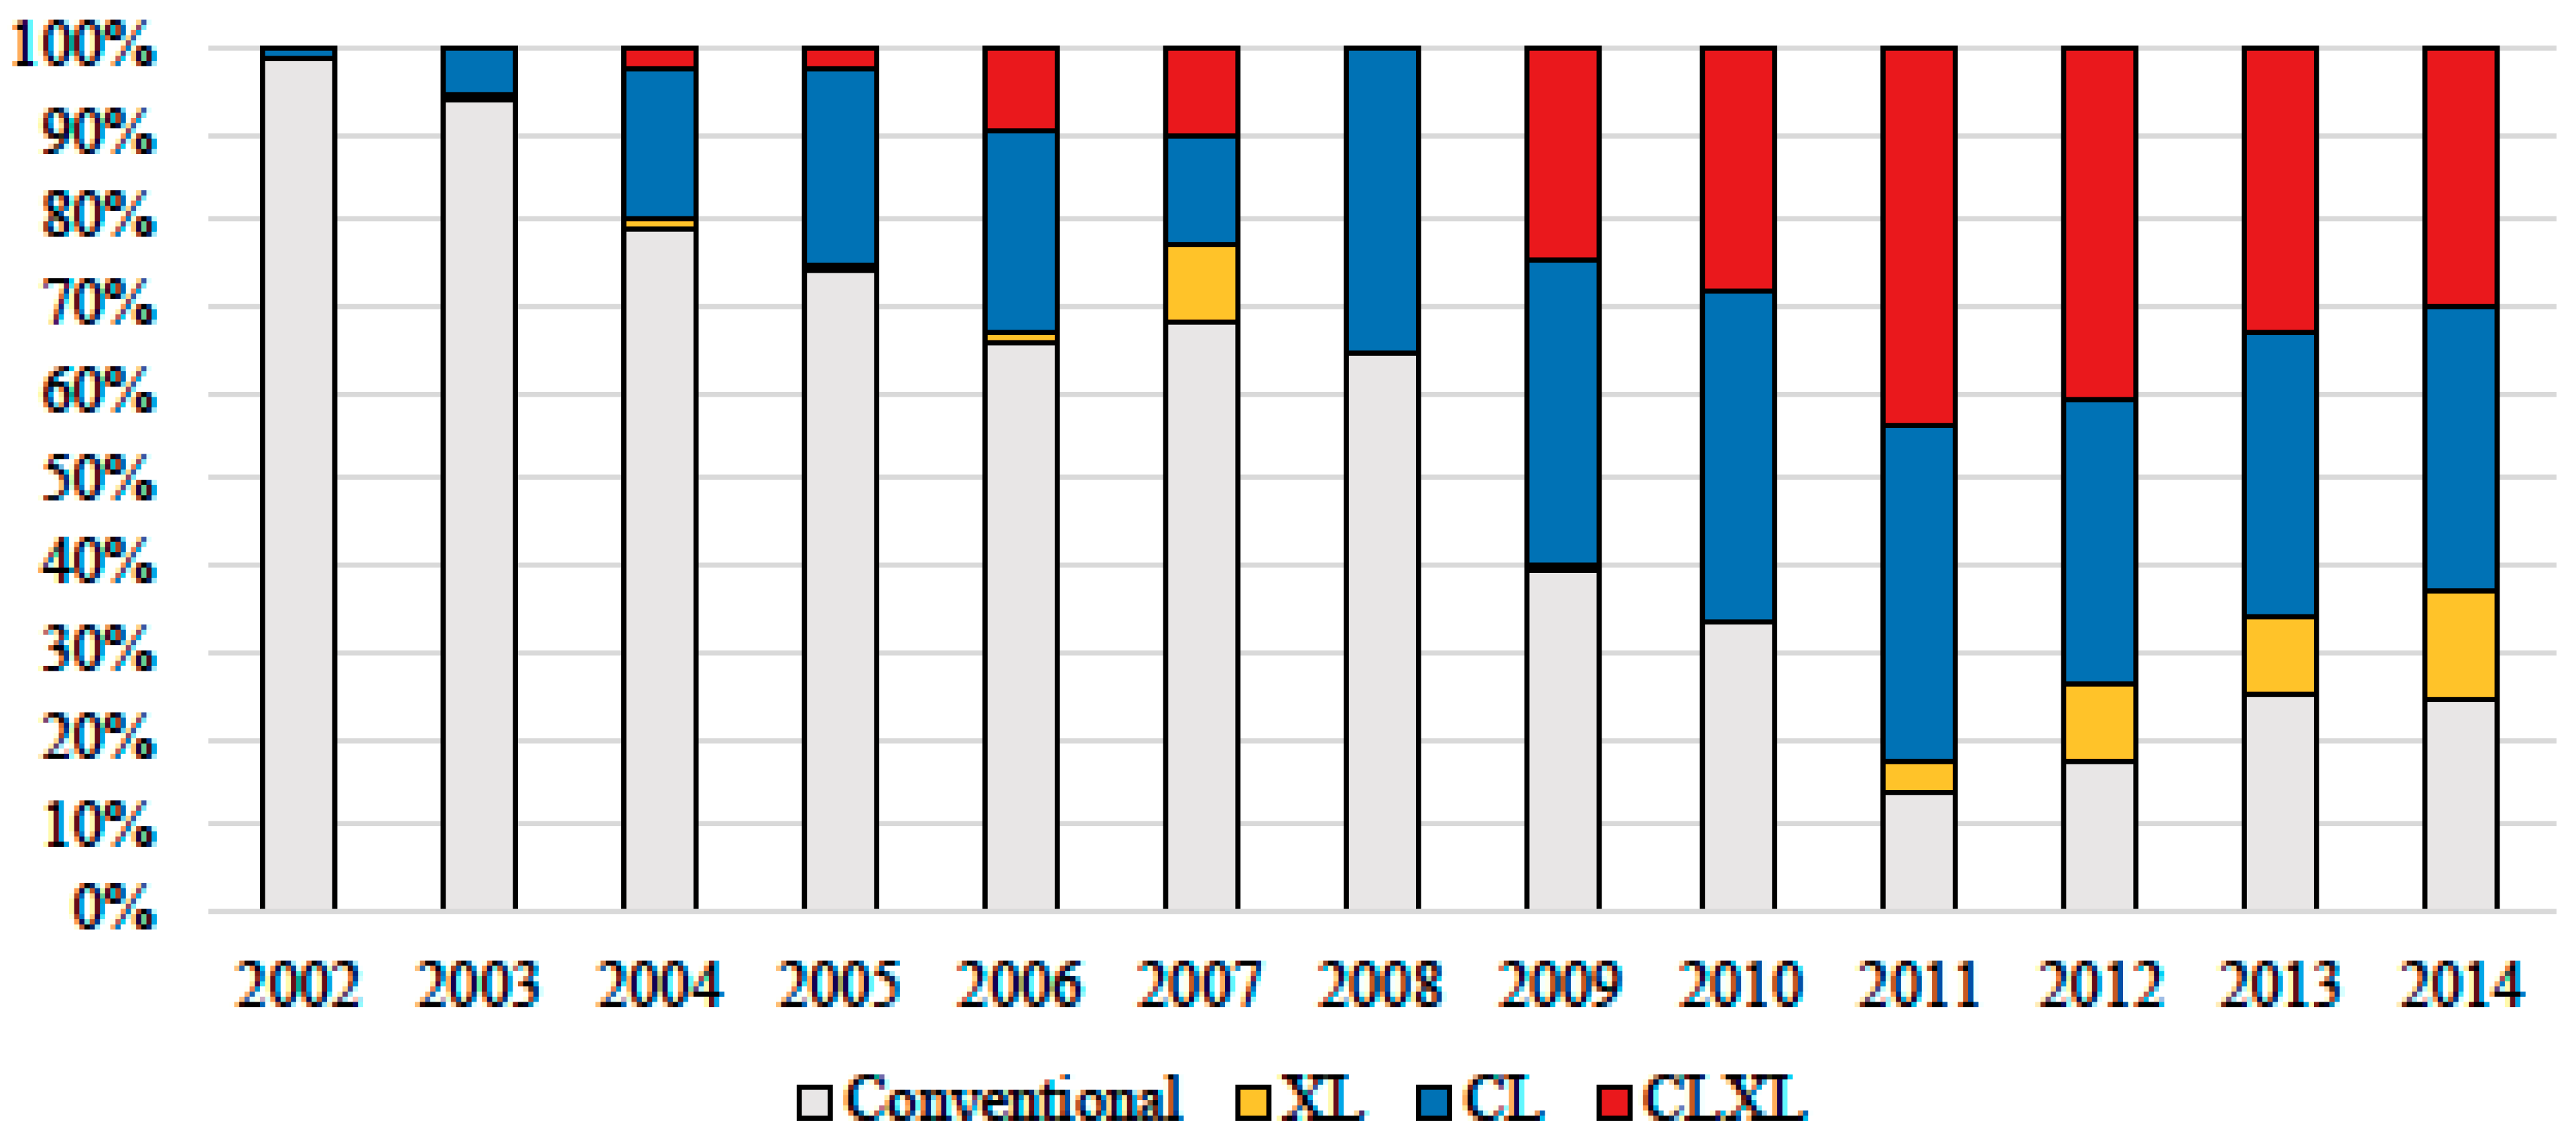
Like many new seed technologies that are packaged with an herbicide treatment, it is difficult for producers to determine a higher upfront cost will become beneficial for the bottom line. Concerning the case of red rice in the Mid-South, until 2019, the CL technology was the only way to selectively control red rice in a commercial rice field. To put the red rice problem in scale, over 60% of the acreage in 2014 in the Mid-South was sown with CL technology (
Figure 2). Assuming that the only reason producers would adopt CL, given its higher costs and lower average yields, was to combat red rice, this would imply that over 60% of the area in rice production in the Mid-South is battling some scale of a red rice infestation. In this manuscript, we have shown that CL technologies (CL and CLXL) can help mitigate the economic damage of a red rice infestation.
BASF, which owns the CL rice technology, has a stewardship agreement with numerous recommendations to avoid out-crossing Cl rice with red rice, including that producers “do not plant Clearfield rice in consecutive years in the same field” [
43]. However, there is no enforcement of the stewardship agreement, and with 60% of rice acreage in the Mid-South having various levels of red rice infestation, producers are using the CL technologies in consecutive growing seasons. Following the commercial release of CL rice, outcrossing of the imadazolinone-resistant gene into red rice has also been documented, and red rice resistance to Newpath
® (the CL regime herbicide) was first reported in 2004 [
44], only 2 years after the commercial release of CL rice. This outcrossing between cultivated CL rice and weedy red rice created red rice offspring that are currently resistant to the Newpath
® herbicide. Red rice resistant to Newpath
® and other herbicides, like Beyond®, with the same mode of action (imadazolinone) jeopardizes the CL technology and producers’ ability to mitigate red rice.
In response to red rice becoming resistant to the CL technology, BASF commercially released Provisia
® rice in 2018. Similar to CL, Provisia
® rice is developed using classical breeding methods from a population of mutants resistant to the herbicide quizalofop, the active ingredient in Provisia
® herbicide. By having a different mode of action from CL, Provisia
® rice is expected to be a complement to the use of CL in combating problematic rice weeds, including red rice, adding flexibility to manage all resistant rice types and annual grasses more effectively. The new herbicide option can also help bringing acres affected with weedy rice back into production sooner than under the traditional option of leaving the field fallow and using multiple herbicide burndowns. The BASF stewardship agreement for Provisa
® includes several recommendations, including that producers “do not plant Provisia
® rice in consecutive years in the same field” [
45]. If BASF and producers do not enforce/abide by this recommendation, the same resistance that is now plaguing the CL technology will enviably unfold in Provisia
®. Like most weeds, weedy red rice will evolve to become resistant to CL and inevitably Provisia
® [
46]. This study has shown the economic importance of having an herbicide regime to mitigate red rice. The economic benefits estimated in this study were likely a major player in red rice resistance to CL technology, as the benefits of CL were a major driver of its adoption and ultimate over usage (planting in consecutive years) in violation of the stewardship agreement. The Mid-South, specifically the areas in this study that rotate rice with soybeans, have experienced other large economically damaging herbicide-resistance issues. Glyphosate-resistant pigweed (
Amaranthus sp.) is so prevalent in the Mid-South many producers have abandoned Roundup Ready cotton and soybeans for alternative herbicide packages including Dicamba, which is currently facing its own legal challenges. Hopefully, BASF and rice producers will enforce/abide by the Provisia
® stewardship agreement to ensure rice producers will have at least one dependable tool against red rice. As this study shows, the cost of losing the ability to control red rice can be economically devastating, more so considering the projections of depressed commodity prices in the coming decade [
47]. While this study shows the large and significant economic benefits of controlling red rice infestation in the U.S. Mid-South, it should also serve as a warning to how fragile those benefits are to the development of red rice resistance.


