Article

Discrimination of Tomato Plants (Solanum lycopersicum) Grown under Anaerobic Baffled Reactor Effluent, Nitrified Urine Concentrates and Commercial Hydroponic Fertilizer Regimes Using Simulated Sensor Spectral Settings

1
Discipline of Geography, School of Agricultural, Earth and Environmental Sciences, University of KwaZulu-Natal, P/Bag X01, Scottsville, Pietermaritzburg 3209, South Africa
2
Discipline of Horticulture, School of Agricultural, Earth and Environmental Sciences, University of KwaZulu-Natal, P/Bag X01, Scottsville, Pietermaritzburg 3209, South Africa
3
Discipline of Crop Science, School of Agricultural, Earth and Environmental Sciences, University of KwaZulu-Natal, P/Bag X01, Scottsville, Pietermaritzburg 3209, South Africa
4
Institute for Water Studies, Department of Earth Sciences, University of the Western Cape, Private Bag X17, Bellville 7535, South Africa
*
Author to whom correspondence should be addressed.
Agronomy 2019, 9(7), 373; https://doi.org/10.3390/agronomy9070373
Submission received: 29 May 2019 / Revised: 8 July 2019 / Accepted: 9 July 2019 / Published: 11 July 2019
(This article belongs to the Special Issue Remote Sensing Applications for Agriculture and Crop Modelling)

Abstract

:
We assess the discriminative strength of three different satellite spectral settings (HyspIRI, the forthcoming Landsat 9 and Sentinel 2-MSI), in mapping tomato (Solanum lycopersicum Linnaeus) plants grown under hydroponic system, using human-excreta derived materials (HEDM), namely, anaerobic baffled reactor (ABR) effluent and nitrified urine concentrate (NUC) and commercial hydroponic fertilizer mix (CHFM) as main sources of nutrients. Simulated spectral settings of HyspIRI, Landsat 9 and Sentinel 2-MSI were resampled from spectrometric proximally sensed data. Discriminant analysis (DA) was applied in discriminating tomatoes grown under these different nutrient sources. Results showed that the simulated spectral settings of HyspIRI sensor better discriminate tomatoes grown under different fertilizer regimes when compared to Landsat 9 OLI and Sentinel-2 MSI spectral configurations. Using the DA algorithm, HyspIRI exhibited high overall accuracy (OA) of 0.99 and a kappa statistic of 0.99 whereas Landsat OLI and Sentinel-2 MSI exhibited OA of 0.94 and 0.95 and 0.79 and 0.85 kappa statistics, respectively. Simulated HyspIRI wavebands 710, 720, 690, 840, 1370 and 2110 nm, Sentinel 2-MSI bands 7 (783 nm), 6 (740 nm), 5 (705 nm) and 8a (865 nm) as well as Landsat bands 5 (865 nm), 6 (1610 nm), 7 (2200 nm) and 8 (590 nm), in order of importance, were selected as the most suitable bands for discriminating tomatoes grown under different fertilizer regimes. Overall, the performance of simulated HyspIRI, Landsat 9 OLI-2 and Sentinel-2 MSI spectral bands seem to bring new opportunities for crop monitoring.

1. Introduction

Food insecurity is a large and growing challenge in sub-Saharan Africa [1,2]. It is estimated that at least one out of four people are hungry and undernourished in sub-Saharan Africa. The World Bank estimates that in 2030, nearly 9 in 10 extremely poor people will be living in Sub-Saharan Africa [3]. This is exacerbated by droughts and soil nutrients deficiencies resulting from limited fertilizer applications [1,2]. This is in turn associated with high fertilizer and food prices, amongst other factors. According to FAO [4] the annual food inflation increased from 5% in 2014 to 6% in 2018 whereas in Europe it remained stable and declined in Latin America, Asia, and Oceania. Subsequently, the improvement of crop production which leads to food security has been amongst the principal priorities required to fulfil the goals of sustainable human development as well as the African Union’s Agenda 2063 [5]. Furthermore, food demand is anticipated to triple in sub-Saharan Africa after the projected 2.5-fold increase in population increase [6]. Specifically, a 60% increase in agricultural and horticultural production will be required by the increasing population in the light of diminishing water and soil nutrient resources [6]. The major concern is the current dietary transition, which is in favour of vegetables such as tomatoes amongst other crops, which is projected to increase, especially in urban areas, while water and soil nutrients are in decline [6,7,8].
Tomato fruits have a critical dietary role in providing folate, vitamins A, C and E; as well as antioxidants (lycopene, beta-carotene, gamma-carotene); trace elements of flavonoids; phytosterols and water-soluble vitamins important for human health [7]. To circumvent the challenge of decreasing soil nutrients and increase the production of vegetables (tomatoes) within a small land area, efforts have been exerted towards improving soil fertility and reducing expenses associated with commercial hydroponic fertilizer mix (CHFM) through the use of anaerobic baffled reactor (ABR) effluents and nitrified urine concentrate (NUC) both as a source of soil nutrients and water [8,9]. Smith and Smith [9], for instance, noted that nitrogen recovered from wastewater supported a high increase in tomato (Solanum lycopersicum) plant canopy volume, flower and fruit production when compared to plants treated with commercial hydroponic fertilizer mix (CHFM) which contained N, P, K, Ca, Mg and Si. Al-Hamdan, Cruise et al. (2014) in Jordan noted that treatment of tomato crop using waste water facilitated and increased their fruit size by up to 2 cm in diameter, and weight up to 78.7 g in relation to those administered with potable water in their field experiment. However, the challenge that has been lurking in the agricultural sector is the lack of comprehensive spatial explicit frameworks as well as objective criteria for crop growth and productivity monitoring. Spatially explicit data is important in effectively and precisely managing production both in the field and greenhouses to meet the increasing demand of high quality and safe agricultural products such as tomatoes. Information on vegetable crop type, growth, productivity or health status was previously measured in situ or done through routine field surveys which are often time consuming and date lagged [10,11]. Despite the fact that these in situ methods obtained plausible levels of accuracy in characterizing crops, they lacked spatial representativeness. Consequently, there is need for spatial explicit techniques that can be operationally used not only to characterize the crop’s areal extent, but also their physiognomies due to lack or excess of soil nutrients. This information can help deduce and understand crop quality, growth and productivity patterns, which are critical in ensuring food security and coming up with well-informed intervention mechanisms or management strategies where necessary.
Meanwhile, earth observation technologies offer spatially explicit non-destructive synoptic views, innovative and economically feasible timely spatial scale means of generating farm scale crop monitoring. Literature shows that crop/plant physiology and structure such as leaf area index, water content plant pigment content, canopy architecture and canopy density are associated with specific key spectral wavebands [12,13,14,15]. Subsequently the variations in these biochemical and physical characteristics of crop plants caused by various crop management practices (i.e., different fertilizer regimes) facilitates unique variations in their spectral finger prints. This makes remote sensing and earth observation facilities to be critical reservoirs of spatially and crop explicit information required in ensuring good quality of crop produce. Remotely sensed data is robust and very sensitive to subtle vegetation traits such as those induced by different water and nutrient regimes. Rajah et al. showed that hyperspectral remotely sensed data could discriminate common dry beans that were rain-fed from those that were irrigated. Lu, et al. [16] discriminated tomato crops that were infected with multi-diseases at different phenological stages using hyperspectral data. Their results exhibited a high overall classification accuracy of 100% in discriminating multi-diseases during the early, asymptomatic and late stages of leaves growth. Above all, the advent and advancement of earth observation facilities has unveiled opportunities for assessing previously unresolved crop quality, growth and productivity related questions linked to plant physiognomies such as that induced by different fertilizer regimes on plant spectral characteristics [11]. Despite hyperspectral data’s trade-off between cost and accuracy, it remains the most accurate spatial data for monitoring crop growth and productivity. Unlike broadband satellite data, hyperspectral data has numerous contiguous spectral channels with a potential ability to detect and characterize subtle differences in plant traits such as those induced by different fertilizer application regimes in relation. For example, Česonienė, et al. [17] demonstrated that hyperspectral data could discriminate between conventionally and organically grown carrots in Lithuania to Jeffries-Matusita distances ranging between 1.98 and 2.00. They attributed their results to the ability of hyperspectral data to discern on the variations in the cell structure conditions and canopy structure of the carrots grown under different farming methods. Meanwhile, multispectral sensors like Landsat, Satellite Pour l’Observation de la Terre (SPOT), MODerate Resolution Imaging Spectroradiometer (MODIS) are characterized with broad bands making it difficult to discern subtle plant traits as they tend to mask out critical plant information.
Although hyperspectral sensors provide accurate datasets, a number of sensors have been or are being developed with improved sensing capabilities because of the exorbitant acquisition costs associated with it [18]. For example, the earth observation community recently witnessed the launching of Sentinel 2 multispectral imager (MSI) and Landsat 8 OLI etc. Sentinel 2 MSI has been the first freely available sensor with a set of spectral wavebands covering the red-edge section of the electromagnetic spectrum (B5 (705 nm), 6 (740 nm), and 7 (783 nm)) at a relatively fine spatial resolution of 20m. The sensor has a wide swath-width of 290 km, coupled with a high spatial resolution of 10 m as well as a five-day temporal resolution making it a better facility for crop mapping and monitoring. Both sensors (i.e., Sentinel 2 MSI and Landsat 8 OLI) have been tested in various environmental application areas with plausible findings and conclusions [19,20,21,22]. However, in some instances they have been reported to experience challenges, especially when applied at farm level monitoring. This has been attributed to the presence of broad wavebands which are perceived to be concealing most important information. As a result, now new sensors such as the proposed Landsat 9 OLI-2 (with improved noise-to-signal ratio), Environmental Mapping and Analysis Program (EnMAP) and Hyperspectral Infrared Imager (HyspIRI) are being developed. The National Aeronautics and Space Administration agency (NASA) is looking forward to launching the state-of-the-art HyspIRI instruments covering the visible and near-infrared section (Vis/NIR) as well as the thermal infrared (TIR). There is a need to evaluate their performance in discriminating subtle plant properties resulting from crop management practices in relation to the available broadband multispectral sensors. These sensors could help by providing a spatially explicit non-destructive method of characterizing crop quality, growth and productivity patterns which are required in the food industry for pricing as well as in agricultural production for ensuring food security.
The upcoming hyperspectral instruments have a potential to supply the much-needed spatially explicit, accurate, consistent information on vegetable crops. Both of these instruments will be spectrometric covering the spectral ranges of 420–2450 nm and 380–2510 nm at different sampling distances of 6.5 nm for EnMAP’s VNIR and 10 nm for EnMAP’s SWIR section as well as HyspIRI’s VSWIR [23,24]. The swath width of HyspIRI will be 185 km at 30 and 60 m spatial resolutions whereas EnMAP have 30-km-wide coverage across-track at a ground-sampling unit of 30m. The temporal resolution of EnMAP will be 4 days at the equator whereas that of HyspIRI will be 5 days. The fine spectral, spatial and temporal resolutions of these sensors make them relatively more suitable for agriculture applications. The major advantage with such instruments is that they will avail quality data at relatively low costs for data scarce regions such as the sub-Saharan Africa where resources are limited. In this regard, there is need to compare the performance of these hyperspectral sensors to the recently launched freely available and forthcoming multispectral sensors (i.e., Sentinel 2 MSI and Landsat 9 OLI-2 with improve spectral settings) so as to ascertain their full potential.
Considering the fact that literature states that hyperspectral data is generally characterized by high collinearity and that there is no specific algorithm that is suitable for discriminating vegetation characteristics at different places and times, this study also examined the performance of discriminant analysis (DA) and partial least squares discriminant analysis (PLS-DA) in discriminating tomato plants grown under different fertilizer regimes. PLS-DA and DA have been widely used in discriminating plants with different characteristics using both hyperspectral and broadband sensors data [25,26,27]. These Algorithms have been widely used because they offer an opportunity to evaluate and interpret the minute spectral pattern variations in plants, especially those grown under different management regimes. PLS-DA and DA classification ensembles construct a distinctive spectrum that represents the spectral signatures of the plants samples while simplifying the discrimination process when compared with other methods such as K-nearest neighbours [28,29,30]. Despite the optimal performance of these methods in vegetation discrimination, the robustness and accuracy of these two is yet to be established [31] particularly in discriminating fine spectral variations of vegetable crops (i.e., tomatoes) induced by different fertilizer application regimes. Furthermore, hyperspectral data could be widely renowned for its exceptional performance in literature in relation to broad bands sensors but the performance of these forthcoming sensors remains undocumented. This study therefore, sought to assess the discriminative performance of HyspIRI, Landsat 9 OLI-2 and Sentinel 2 MSI in characterizing tomato (Solanum lycopersicum) crops grown under commercial hydroponic fertilizer mix, anaerobic baffled reactor effluent and nitrified urine concentrate as nutrient sources. HyspIRI was selected as a representative of hyperspectral sensors in this study due to the fact that both EnMAP and HyspIRI will have similar spectral and spatial characteristics and that HyspIRI is going to cover a larger spectral portion of the electromagnetic spectrum particularly in the VSWIR sensor in relation to that of EnMAP. In addition, this study also assessed the performance of DA and PLS-DA in discriminating tomato crops grown under different fertilizer regimes using HyspIRI, Landsat 9 OLI-2 and Sentinel 2 MSI spectral data simulated from hyperspectral data.

2. Materials and Methods

2.1. Experimental Set-Up

A pot experiment was conducted in a hydroponic system that was set up in a polyethylene tunnel located at Newlands-Mashu Research Station under eThekwini Municipality, Durban, South Africa (29°46′25.648″ E 30°58′28.329″ S). The hydroponic system was designed to run three nutrients streams namely, anaerobic baffle reactor (ABR) effluents, nitrified urine concentrate (NUC) and commercial hydroponic fertilizer mix (CHFM) as a control. Each hydroponic system consisted of 150 L tank and the nutrient solution for each system was enclosed in a 100 L container stacked on the ground at the foot of each system.
Six-weeks-old, seedlings of ‘Monica’, a determinate tomato cultivar purchased from a local nursery (Sunshine seedlings, Pietermaritzburg, South Africa) were transplanted to 30 cm polyethylene pots filled with pine sawdust as a growing medium. The nutrient solution for each nutrient source was supplied to the plants using a pressure pump (DAB Model K30/70M, DAB Pumps, MarcoPolo, Mestrino, Italy) via a 20 m irrigation line. A 20 cm drip irrigation emitters (2 L) were placed and irrigation was performed at six intervals of 5 min/duration daily using a timer. The study was arranged using a complete randomised design with three replications of five plants each, giving fifteen experimental units per nutrient source.
Tomato plants of the control treatment were irrigated with a commercial hydroponic fertilizer mix (Hygroponic® and Solu-cal®) at the rate of 800 g + 620 g/1000 L of water as recommended for hydroponic tomato production; NUC, commercial fertilizer application rate was used as a standard as recommended by Jonsson et al. (2004) and ABR effluents with no specified application rate. For the CHFM and NUC treatment, the fertilizer was mixed using municipal tap water whereas for the ABR treatment only effluent from the anaerobic baffle reactor component was used as nutrient and irrigation source. The experiment was allowed to run for 12 weeks before the crop was harvested. Remotely sensed proximal spectra data was collected at vegetative stage (i.e., four weeks after transplanting) and two weeks after flowering. In this study all requirements for the photosynthetic activity of the tomato plants were the same except for the fertilisation treatments. This was done so as to make sure that any spectral differences between the CHFM, ABR, NUC treated tomato plants were mainly due to the fertiliser applications since all conditions were the same.

2.2. Remotely Sensed Data

The FieldSpec-3 (ASD Inc., Boulder, CO, USA) Analytic Spectral Device (ASD) FieldSpec instrument was used to acquire the spectral reflectance of tomatoes plants receiving ABR effluents, NUC and CHFM. The ASD measured the radiation at 1.4 nm intervals for the 350–1000 nm and 2 nm intervals for the 1000–2500 nm spectral regions. The reflectance measurements were conducted using bare fibre-optic held at nadir position ~0.5m above the tomato canopies resulting in a field of view with a diameter of ~0.225m. This diameter was found to be adequate to capture the reflectance of the tomato canopies. The normalization of spectral measurements was conducted after every 5 to 10 spectral measurements, using a standard white spectralon. A standard spectralon is optically flat to ±4% over the range of 250–2500 nm and ±1% over the photopic region of the spectrum [32,33]. Its diffuse reflectance standards are highly Lambertian [33]. This was done to circumvent the possible changes in weather conditions as well as irradiance from the sun [34]. The spectral measurements were conducted under clear skies during the day between 10:00 and 14:00 since this is the time with maximum net radiation. A total of 900 spectral samples were measured on canopies of tomatoes treated with CHFM (n = 300), ABR (n = 300) and NUC (n = 300). Noise regions between 350 and 399, 1355 and 1420 nm, 1810 and 1940 nm and 2470–2500 nm were cleaned prior to any analysis of the data [35]. The spectrometrically sensed proximal spectra were then resampled into the spectral settings of HyspIRI, Sentinel 2_MSI and Landsat 9 OLI-2 (Table 1). To simulate the HyspIRI VSWIR sampling rate, 21 successive ASD bands were averaged to create one proxy HyspIRI band using a Gaussian averaging window as detailed in Prasad et al. (2009) [36] and Samiappan et al. (2010) [37]. To simulate the ASD data into the spectral settings of broad spectral sensors, the PRISM in IDL-ENVI was used.

2.3. Discriminating Tomato Plants Grown under Different Fertilizer Regimes

Exploratory data analysis was conducted to determine if the data followed a normal distribution curve. Normality test was performed using the Kolmogorov-Smirnov test. Further, we assessed spectral separability as well as administered a pre-filter [38] after hyperspectral data resampling it to HyspIRI, Sentinel-2 MSI and Landsat 8/9 OLI spectral configurations. Resampling was based on the Analysis of Variance test (ANOVA). We then conducted post hoc test to establish the channels that exhibited significant differences between the spectral data of the tomato crops receiving nutrients from ABR effluent, NUC and CHFM.
The other objective of this study was to assess the accuracies of partial least squares discriminant analysis and discriminant analysis algorithms in characterizing tomato crops grown under the three fertilizer regimes. In that regard, we used the PLSDA and the DA to classify the spectral reflectance of tomato crops growing under UNC, UNF and ABR fertilizer treatments. Details about DA and PLS DA are provided in Zhang, et al. [39] and Boulesteix [29]. Prior to conducting PLS-DA and DA, the spectral samples were partitioned into training (70%) and testing (30%) data.

2.4. Classification Accuracy Assessment

The 30 percent of the samples were used for classification accuracy assessment (90 per treatment). Confusion matrices were computed and used to evaluate the classification accuracies of the DA and PLS DA models. We further computed the overall, producer and user accuracies, as well as the kappa statistics for each set of spectral settings as classified by the two algorithms based on the confusion matrices. To compare the performance of the two algorithms, a McNemar’s test was conducted as detailed by Manandhar, et al. [40] and de Leeuw, et al. [41].

3. Results

Analysis of variance tests results showed significant differences (α = 0.05) between tomato plants treated with different fertilizer combinations based on the spectral settings of HyspIRI, Sentinel-2MSI and Landsat 9 OLI. Figure 1 illustrates spectral signatures (mean spectral reflectance) of tomato plants grown under ABR, CHFM and NUC treatments. Specifically, the spectral signatures of tomatoes grown under NUC exhibited higher reflectance curves when compared to those growing under CHFM and ABR in all the sections of the electromagnetic spectrum across all the sensors. The CHFM spectral signature was the lowest in comparison to the other to fertilizer treatments across all the spectral signatures and sensors. For HyspIRI resampled data, significant differences were observed in the visible, NIR as well as the SWIR portions of the electromagnetic spectrum (Figure 1). Meanwhile the most glaring differences in the reflectance of tomato plants grown under ABR, CHFM and NUC treatments were observed in the NIR portion of the electromagnetic spectrum based on the simulated Sentinel 2 MSI and Landsat 9 OLI-2 data (Figure 1). HyspIRI spectral settings exhibited more potential spectral windows of separability between tomato plants grown under ABR, CHFM and NUC treatments when compared with the broadband sensors. Potential spectral windows of separability exhibited by Sentinel 2 MSI and Landsat 9 OLI-2 were only in the near infrared regions (Figure 1).

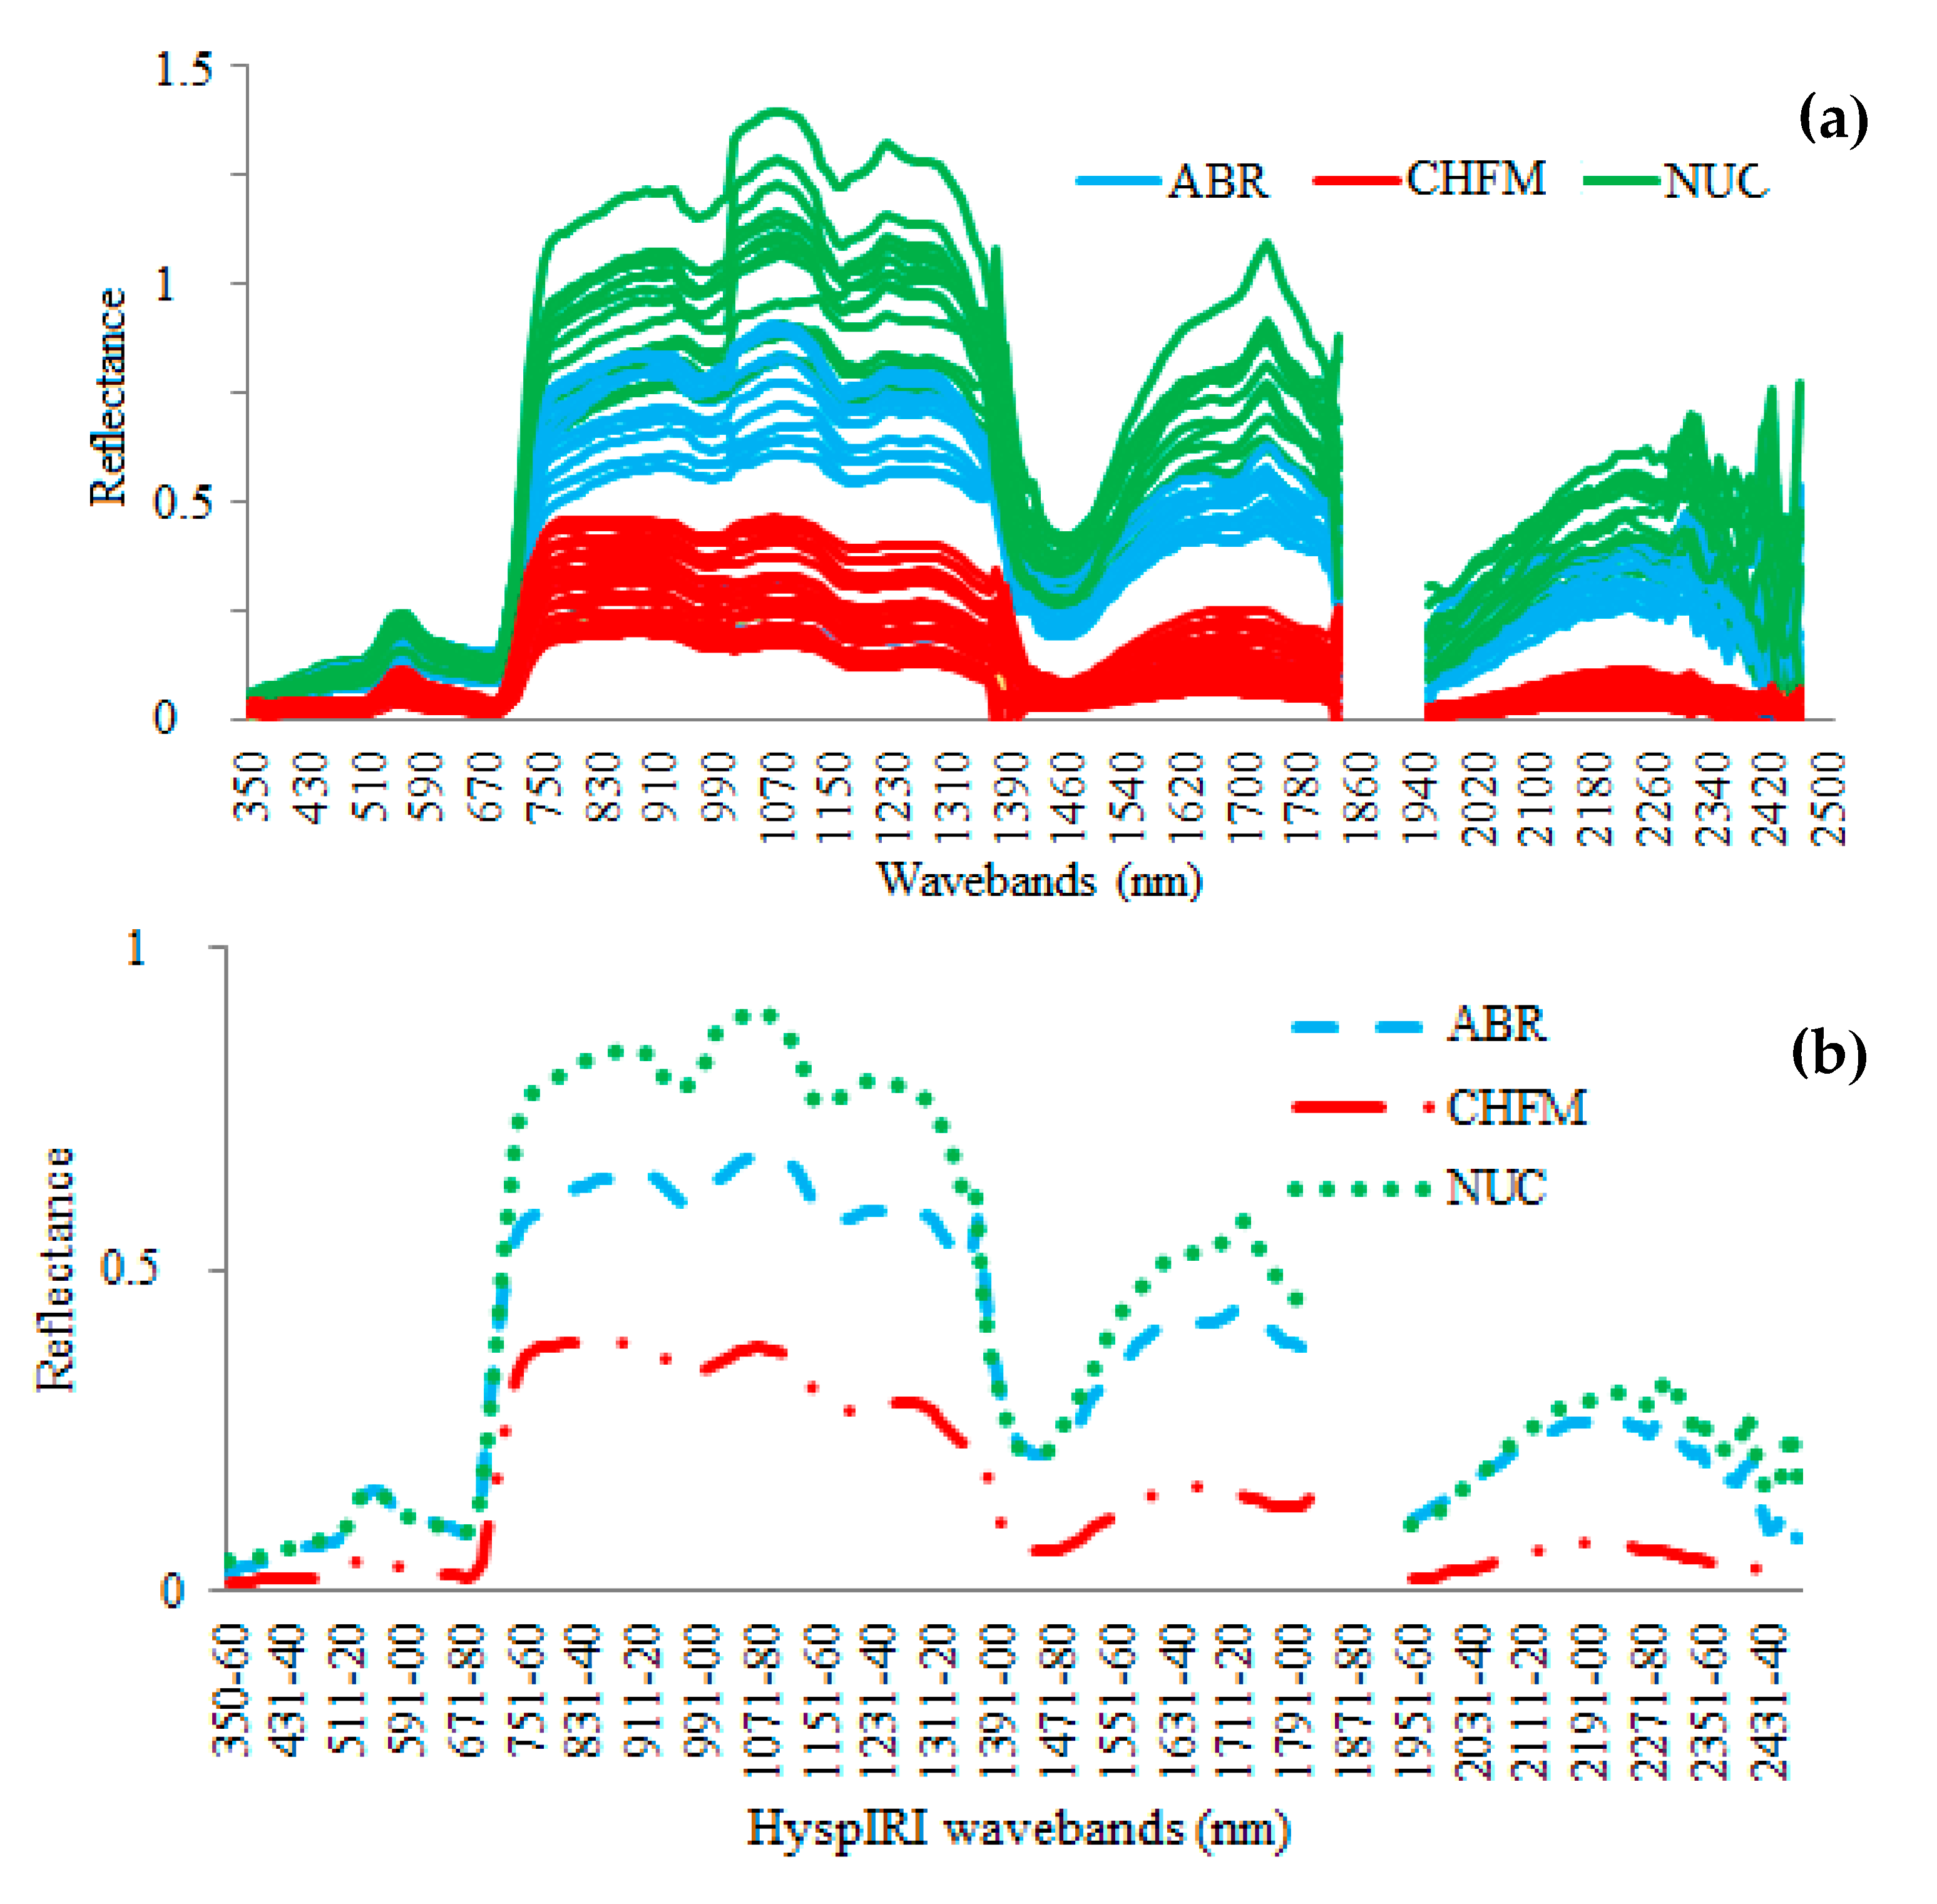
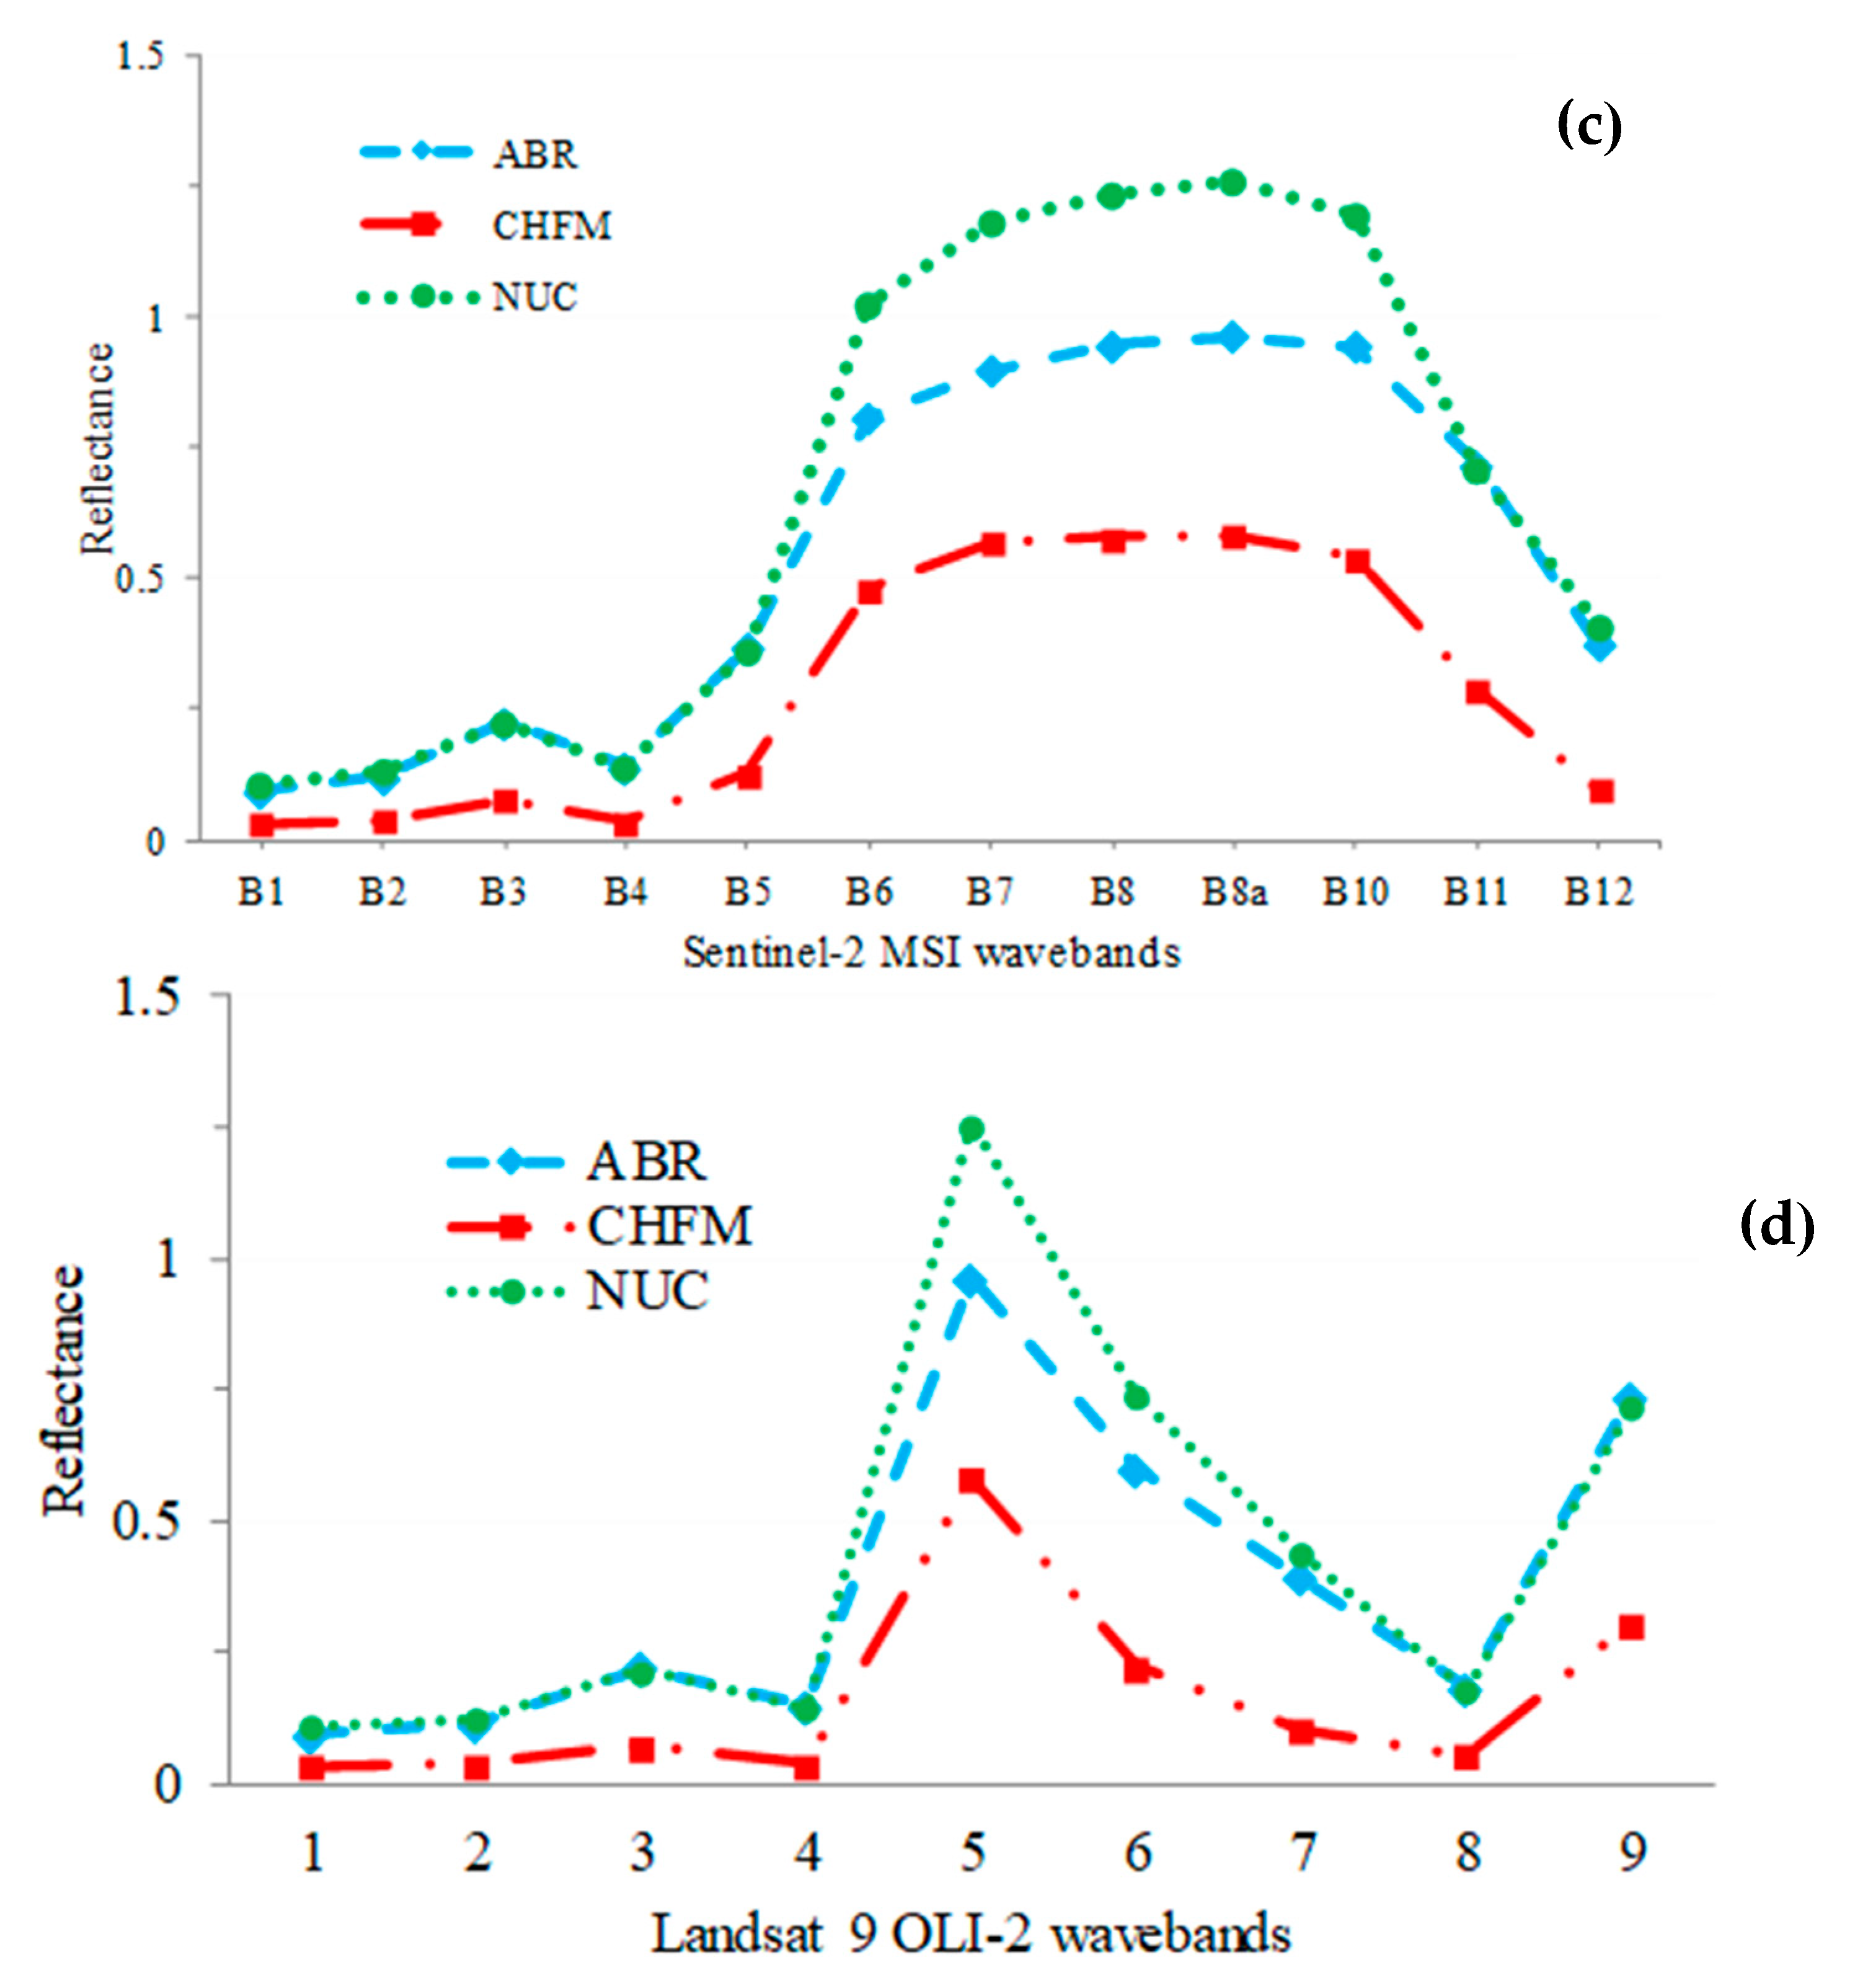
3.1. Discriminating Tomatoes under ABR Effluent, NUC and CHFM

All sensors better characterized tomato crops administered with ABR when compared to those administered with CHFM and NUC. Specifically, high producer and user accuracies ranging between 91% and 100% were observed in characterizing tomatoes treated with ABR (Table 2). Meanwhile tomatoes administered with ABR and CHFM were characterized with slightly lower accuracies (Table 2). Moreover, HyspIRI, produced high accuracies characterized by kappa statistics of 0.99, whereas the spectral settings of Sentinel-2 MSI and Landsat 9 OLI-2′s spectral settings exhibited kappa statistics of 0.85 and 0.79, respectively. HyspIRI spectral settings exhibited high producer accuracies of 100%, 92% and 100% for ABR, CHFM and NUC respectively. Meanwhile Sentinel-2 MSI exhibited slightly lower producer accuracies (ABR = 91%, CHFM = 86% and NUC = 100%). Landsat OLI-2 exhibited producer accuracies that were comparable to those of Sentinel 2 MSI which were 91% for ABR, 83% for CHFM and 100% for NUC. The same trend could be observed on the user accuracies (Table 2). In general, the CHFM treatments had slightly lower-class accuracies across all sensors in relation to the HEDM treatments.

3.2. Performance of DA and PLS-DA Algorithms in Discriminating Tomatoes under ABR Effluent, NUC and CHFM

When comparing the performance of algorithms, DA exhibited very high accuracies. For instance, DA’s producer accuracies derived using DA across all fertilizer treatments and sensor simulations ranged from a minimum of 89% whereas PLS-DA had a slightly lower minimum of 83% (Table 2). The user accuracies derived using DA ranged from a minimum of 76% whereas those derived using PLS-DA ranged from 65% to 100%. The overall accuracies derived using DA were higher (i.e., 0.94–0.99) when compared to those derived using PLS-DA (i.e., 0.3–0.97). Uniformly, the kappa statistics derived using DA were higher, ranging between 0.79 and 0.99 whereas those derived using PLS-DA were lower ranging between 0.63 and 0.90 (Table 2). Table 3 summarizes potential spectral variables for discriminating tomato plants grown under ABR, CHFM and NUC treatments using HyspIRI, Sentinel 2 MSI and Landsat 9 OLI-2. HyspIRI wavebands 710, 720, 690, 840, 1370 and 2110 nm, Sentinel 2-MSI bands 7, 6, 5 and 8a as well as Landsat bands 5, 6, 7 and 8, in order of importance, were identified as the most optimal spectral variables for discriminating tomato plants grown under different fertilizer regimes. NIR was the most prominent optimal section with a potential of discriminating tomatoes plants grown under different fertilizer regimes across the three sensors, although it did not outperform the red-edge section of the electromagnetic spectrum which was the most influential region.

4. Discussion

We sought to compare the strength of HyspIRI’s spectral configuration in relation to Landsat 9 OLI-2 and Sentinel 2 MSI spectral settings in characterizing tomato (Solanum lycopersicum) crops grown under CHFM, ABR and NUC treatment regimes. Results of this study showed that tomatoes that were fertilized using ABR could be optimally discriminated (i.e., Kappa statics ranging 0.79 to 0.99) from those that were administered with CHFM and NUC. The spectral reflectance of HDME fertilized crops was higher than that of those treated with CHFM. This indicates the potential of HEDM fertilizer for sustaining the health of vegetables in a manner comparable to that of conventional chemical fertilizers. This could be attributed to the fact that ABR effluents have nutrient properties favorable for tomato plants, which facilitate excessive vegetative growth, high biomass accumulation, delayed or uneven maturity [42,43,44]. Tomato crops with excessive vegetative growth, high biomass accumulation, delayed or uneven maturity tend to be easily detected and discriminated by satellite sensors compared to those which are not. Subsequently, tomatoes growing under the ABR treatments have a different spectral signature from those that are fertilized using CHFM and NUC. Literature illustrates that ABR tends to facilitate high biomass accumulation (i.e., increased leaf area index) hence the high classification accuracies exhibited by all remotely sensed data in this study in characterizing the HEDM fertiliser treatments [11,28,29]. For example, Al-Lahham, El Assi and Fayyad [45] illustrated that tomato crops that were administered with high quantities of waste water had big fruit sizes hence high biomass accumulation in relation to those that were administered with potable water. In a related study, Zavadil (2009) noted that primary treated waste water which contained an average of 14-fold nitrogen amounts (70.6 mg/L, which was 89% ammonia form) and also a 3-fold of the total phosphorus, resulted in high biomass accumulation and yields of lettuce salad, radishes and carrots in their study assessing the influence of sewage in relation to potable water on vegetable growth. Subsequently, the increases in biomass accumulation associated with wastewater treated vegetables could explain the discrimination of ABR treated tomato crops in comparison to those administered with CHFM and NUC, in this study. Furthermore, the most influential wavebands that facilitated high classification accuracies in discriminating tomato plants grown under human-excreta derived materials (HEDM) from those growing under CHFM conditions were from the red-edge section of the electromagnetic spectrum which is generally associated with healthy plants. The red-edge section of the electromagnetic spectrum is very sensitive to high chlorophyll, leaf angle distribution, leaf area index levels associated with plants grown in more nutritious environments such as the those exhibited by ABR. As aforementioned, HEDM have a high turnover of N P K plant nutrients which is comparable to that of commercial soluble fertilizers [46,47,48]. In this regard, the high turnover of plant nutrients such as nitrogen facilitates an increase in biomass, LAD, LAI which in turn makes the canopy spectral signature of those plants treated with HEDM to be discriminable from other plants especially in the red-edge and the NIR sections of the electromagnetic spectrum [49,50]. Subsequently, the red-edge and the NIR regions of the electromagnetic spectrum illustrate that the spectral signatures and the health of plants grown under HEDM are comparable to those grown under the CHFM.
When assessing the performance of sensors, HyspIRI outperformed the two multispectral sensors namely, Sentinel-2 MSI and Landsat OLI spectral settings in discriminating tomato crops grown under different fertilizer regimes. This could be explained by the fact that HyspIRI is a hyperspectral sensor characterized by narrow spectral wavebands that are more sensitive to the spectral reflectance of tomato crops grown under different fertilizer regimes than broadband sensor settings such as those of Landsat which could be masking out those minute tomato crops spectral variations. There is a consistently growing body of literature that supports the claim that hyperspectral sensors are more sensitive to minute vegetation spectral variabilities compared to broadband sensors due to the narrowed bandwidths configuration [51,52,53,54,55,56]. Specifically, Thenkabail, Smith and De Pauw [55,57] illustrated that narrow bands characterized different crop traits such as yield as well as spectral variations when compared to broadband spectral data. Also, they were able to better characterize wheat from barley using hyperspectral data in relation to the data from broadband sensors. They attributed this to the variation in spectral settings (bandwidths) of the sensors they used. These variations in spectral settings affected the detail that determined the accuracy of their models for plant trait characterization. Meanwhile, Clark [57] noted that there was no significant variation in the performance of HyspIRI and Sentinel-2 MSI as well as Landsat OLI in landcover classification of the San Francisco Bay Area in northern California, USA. However, their results confirmed that HyspIRI exhibited higher classification accuracies in their study.
Results of this study also illustrated that Sentinel 2 MSI and Landsat 9 performed satisfactorily in discriminating tomatoes grown under different fertilizer regimes, although Sentinel-2 MSI outperformed Landsat OLI. This could be explained by the fact that Sentinel-2 MSI spectral settings cover the red-edge portion of the electromagnetic spectrum which is critical in mapping and detecting various vegetation traits. Moreover, there is a large and growing body of literature illustrating that Sentinel-2 MSI performs better than Landsat OLI in vegetation mapping [22,57,58]. The study by Colkesen and Kavzoglu [58] illustrated that Sentinel-2 MSI outperformed Landsat OLI in discriminating alfalfa, sugar beet and bean in the agricultural lands of the Ferizli district, Turkey. Shoko and Mutanga [22] also illustrated the robustness of Sentinel-2 MSI remotely sensed data in better discriminating C3 Festuca costata Nees from the C4 Themeda triandra Forssk grasses in a mountainous area in South Africa. They also attributed the optimal performance of Sentinel-2 MSI to the presence of red-edge bands in discriminating Festuca costata from Themeda triandra grasses.
Even though this study successfully illustrated the robustness of the spectral settings of these sensors in discriminating tomato crops grown under different fertilizer regimes using simulated data, there is still need to assess their satellite remotely sensed data. This study only sought to evaluate the spectral configuration of these sensors, hence there is still need to evaluate their radiometric and spatial resolutions in a similar application setup. Generally, the reflectance of remotely sensed satellite data tends to be affected by numerous factors associated with the sensor’s platform, atmospheric related influences etc. [59,60,61]. Factors that affect satellite remotely sensed data are different from those that affect spectrometric proximally sensed data. Spectrometric proximally sensed data tends to be less affected by atmospheric related influences; hence, it offers a robust dataset suitable for testing the spectral settings of sensors, particularly the forth coming ones. The performance of the same sensors’ spectral settings derived using satellite platforms, therefore, still needs to be evaluated.
Although this was not the major objective of the study, DA outperformed PLS-DA in discriminating tomato crops grown under different fertilizer regimes. In this study PLS-DA failed to derive unnecessary variables for characterizing tomato crops grown under different fertilizer regimes. On the other hand, there are numerous studies that have illustrated the optimal performance of DA in dimension reduction as well as feature extraction [62,63,64]. Our results also indicated that DA selected more spectral bands in relation to PLS-DA as optimal spectral variables for discriminating tomatoes grown under different fertilizer treatment regimes. The optimal performance of DA in relation to PLS-DA could be attributed to the conservative nature of PLS-DA in classifying tomato plants [31].

Implications of the Study’S Findings for Horticultural Crop Production

The optimal performance of HyspIRI’s spectral settings in characterizing tomato plants grown under different fertilizer treatments illustrates its great potential in providing additional invaluable spatially explicit information urgently required in horticulture management and decision-making processes particularly for successful site and crop specific management practices. For instance, this study shows that based on remotely sensed data HEDM fertilizers have a great potential of improving vegetable crops health in manner comparable to that of conventional fertilisers. The fact that this study showed that HyspIRI, Sentinel 2 MSI and Landsat 9 OLI-2 could detect the differences between HEDM fertilized plants and those that are grown under conventional fertilizers underscores the potential of these sensors in providing information that could also be used in other applications such as crop inventory, condition, production forecast, assessment of nutrient deficiencies as well as growth and health of tomato plants and other horticultural crops. Furthermore, these sensors offer cheap, fast and reliable spatial explicit information on crop conditions required in the administration of precise and proper fertilizer applications while optimizing resources and increasing net returns especially in sub-Saharan countries with limited data and financial resources for facilitating high production of horticultural crops. However, more and extensive research efforts still need to be exerted in fully ascertaining and exploiting the potential of remotely sensed data in other horticultural crop-management applications.

5. Conclusions

The prime objective of this study was to compare the strength of the forthcoming hyperspectral sensor HyspIRI’s spectral settings in the context of characterizing the effects of different fertilizer-treatment regimes on tomato crops. Furthermore, the study assessed the performance of PLS-DA in relation to DA in discriminating tomatoes treated with ABR, NUC and CHFM. Based on the results exhibited by this study we conclude that:
  • The forthcoming HyspIRI sensor has the potential to accurately map tomato crops under various fertilizer regimes. Landsat and Sentinel, performed comparably to HyspIRI spectral settings.
  • Overall, all the sensors were able to characterise the comparable impact of HEDM in relation to that of CHFM fertilizers on the spectral characteristics of tomato plants as a proxy of their health.
  • DA offers optimal accuracies in characterizing tomatoes grown under different fertilizer regimes when compared to PLS-DA.
These findings are a substantial foundation upon which comprehensive precision agricultural assessments initiatives could be formed. These initiatives are required in order to attain sustainable agriculture as well as food security in regions such as sub-Saharan Africa where agricultural crop monitoring is currently hindered by the limited access to robust spatial data sets.

Author Contributions

Conceptualization, (M.S., O.M. and L.S.M.); Data curation, (L.S.M., S.T.M., A.O.O. and A.M.); Formal analysis, (M.S.); Investigation, (M.S., S.T.M. and A.M.); Project administration, (O.M. and P.L.M.); Resources, (O.M. and P.L.M.); Writing–original draft, (M.S.); Writing–review & editing, (M.S. and T.D.).

Funding

This research was funded by the National Research Foundation (NRF) of South Africa (Grant Numbers: 86893 and 84157).

Acknowledgments

The Pollution Research Group (PRG) is acknowledged for technical support and for providing human-excreta derived materials as well as space for experimentation for this study. We also extend our gratitude to the anonymous reviewers for their constructive criticism.

Conflicts of Interest

The authors declare no conflict of interest.

References

  1. Mabhaudhi, T.; Chibarabada, T.; Modi, A. Water-Food-Nutrition-Health Nexus: Linking Water to Improving Food, Nutrition and Health in Sub-Saharan Africa. Int. J. Environ. Res. Public Health 2016, 13, 107. [Google Scholar] [CrossRef]
  2. Van Ittersum, M.K.; Van Bussel, L.G.; Wolf, J.; Grassini, P.; Van Wart, J.; Guilpart, N.; Claessens, L.; de Groot, H.; Wiebe, K.; Mason-D’Croz, D.; et al. Can Sub-Saharan Africa Feed Itself? Proc. Natl. Acad. Sci. USA 2016, 113, 14964–14969. [Google Scholar] [CrossRef] [PubMed]
  3. The-World-Bank. Poverty & Equity Data Portal; The World Bank: Wastington, DC, USA, 2019. [Google Scholar]
  4. FAO. Inflation in Consumer Price Index for Food; FAO: Rome, Italy, 2019. [Google Scholar]
  5. Conceição, P.; Levine, S.; Lipton, M.; Warren-Rodríguez, A. Toward a Food Secure Future: Ensuring Food Security for Sustainable Human Development in Sub-Saharan Africa. Food Policy 2016, 60, 1–9. [Google Scholar] [CrossRef]
  6. Nordey, T.; Basset-Mens, C.; De Bon, H.; Martin, T.; Déletré, E.; Simon, S.; Parrot, L.; Despretz, H.; Huat, J.; Biard, Y.; et al. Protected Cultivation of Vegetable Crops in Sub-Saharan Africa: Limits and Prospects for Smallholders. A Review. Agron. Sustain. Dev. 2017, 37, 53. [Google Scholar] [CrossRef]
  7. Beecher, G.R. Nutrient Content of Tomatoes and Tomato Products. Proc. Soc. Exp. Biol. Med. 1998, 218, 98–100. [Google Scholar] [CrossRef]
  8. Busari, T.I.; Senzanje, A.; Odindo, A.O.; Buckley, C.A. Evaluating the Effect of Irrigation Water Management Techniques on (Taro) Madumbe (Colocasia Esculenta (L.) Schott) Grown with Anaerobic Filter (Af) Effluent at Newlands, South Africa. J. Water Reuse Desalin. 2019, 9, 203–212. [Google Scholar] [CrossRef]
  9. Smith, D.P.; Smith, N.T. Recovery of Wastewater Nitrogen for Solanum Lycopersicum Propagation. Waste Biomass Valorization 2019, 10, 1192–1202. [Google Scholar] [CrossRef]
  10. Al-Hamdan, M.; Cruise, J.; Rickman, D.; Quattrochi, D. Forest Stand Size-Species Models Using Spatial Analyses of Remotely Sensed Data. Remote Sens. 2014, 6, 9802–9828. [Google Scholar] [CrossRef] [Green Version]
  11. Petropoulos, G.; Srivastava, P.; Piles, M.; Pearson, S. Earth Observation-Based Operational Estimation of Soil Moisture and Evapotranspiration for Agricultural Crops in Support of Sustainable Water Management. Sustainability 2018, 10, 181. [Google Scholar] [CrossRef]
  12. Peng, Y.; Nguy-Robertson, A.; Arkebauer, T.; Gitelson, A. Assessment of Canopy Chlorophyll Content Retrieval in Maize and Soybean: Implications of Hysteresis on the Development of Generic Algorithms. Remote Sens. 2017, 9, 226. [Google Scholar] [CrossRef]
  13. Nguy-Robertson, A.L.; Peng, Y.; Gitelson, A.A.; Arkebauer, T.J.; Pimstein, A.; Herrmann, I.; Karnieli, A.; Rundquist, D.C.; Bonfil, D.J. Estimating Green Lai in Four Crops: Potential of Determining Optimal Spectral Bands for a Universal Algorithm. Agric. For. Meteorol. 2014, 192, 140–148. [Google Scholar] [CrossRef]
  14. Luo, S.; Wang, C.; Xi, X.; Nie, S.; Fan, X.; Chen, H.; Yang, X.; Peng, D.; Lin, Y.; Zhou, G. Combining Hyperspectral Imagery and Lidar Pseudo-Waveform for Predicting Crop Lai, Canopy Height and above-Ground Biomass. Ecol. Indic. 2019, 102, 801–812. [Google Scholar] [CrossRef]
  15. Zhao, T.; Koumis, A.; Niu, H.; Wang, D.; Chen, Y. Onion Irrigation Treatment Inference Using a Low-Cost Hyperspectral Scanner. In Proceedings of the Paper Presented at the Multispectral, Hyperspectral, and Ultraspectral Remote Sensing Technology, Techniques and Applications VII, Honolulu, HI, USA, 24–26 September 2018. [Google Scholar]
  16. Lu, J.; Ehsani, R.; Shi, Y.; de Castro, A.I.; Wang, S. Detection of Multi-Tomato Leaf Diseases (Late Blight, Target and Bacterial Spots) in Different Stages by Using a Spectral-Based Sensor. Sci. Rep. 2018, 8, 2793. [Google Scholar] [CrossRef] [PubMed]
  17. Česonienė, L.; Masaitis, G.; Mozgeris, G.; Gadal, S.; Šileikienė, D.; Karklelienė, R. Visible and near-Infrared Hyperspectral Imaging to Describe Properties of Conventionally and Organically Grown Carrots. J. Elem. 2019, 24, 421–435. [Google Scholar]
  18. Transon, J.; d’Andrimont, R.; Maugnard, A.; Defourny, P. Survey of Hyperspectral Earth Observation Applications from Space in the Sentinel-2 Context. Remote Sens. 2018, 10, 157. [Google Scholar] [CrossRef]
  19. Korhonen, L.; Packalen, P.; Rautiainen, M. Comparison of Sentinel-2 and Landsat 8 in the Estimation of Boreal Forest Canopy Cover and Leaf Area Index. Remote Sens. Environ. 2017, 195, 259–274. [Google Scholar] [CrossRef]
  20. Dube, T.; Mutanga, O. Evaluating the Utility of the Medium-Spatial Resolution Landsat 8 Multispectral Sensor in Quantifying Aboveground Biomass in Umgeni Catchment, South Africa. ISPRS J. Photogramm. Remote Sens. 2015, 101, 36–46. [Google Scholar] [CrossRef]
  21. Ahmadian, N.; Ghasemi, S.; Wigneron, J.P.; Zölitz, R. Comprehensive Study of the Biophysical Parameters of Agricultural Crops Based on Assessing Landsat 8 Oli and Landsat 7 Etm+ Vegetation Indices. GISci. Remote Sens. 2016, 53, 337–359. [Google Scholar] [CrossRef]
  22. Shoko, C.; Mutanga, O. Examining the Strength of the Newly-Launched Sentinel 2 Msi Sensor in Detecting and Discriminating Subtle Differences between C3 and C4 Grass Species. ISPRS J. Photogramm. Remote Sens. 2017, 129, 32–40. [Google Scholar] [CrossRef]
  23. Guanter, L.; Kaufmann, H.; Segl, K.; Foerster, S.; Rogass, C.; Chabrillat, S.; Kuester, T.; Hollstein, A.; Rossner, G.; Chlebek, C.; et al. The Enmap Spaceborne Imaging Spectroscopy Mission for Earth Observation. Remote Sens. 2015, 7, 8830–8857. [Google Scholar] [CrossRef]
  24. Lee, C.M.; Cable, M.L.; Hook, S.J.; Green, R.O.; Ustin, S.L.; Mandl, D.J.; Middleton, E.M. An Introduction to the Nasa Hyperspectral Infrared Imager (Hyspiri) Mission and Preparatory Activities. Remote Sens. Environ. 2015, 167, 6–19. [Google Scholar] [CrossRef]
  25. Sheik, O.M.; Kabir, P.; Ilaria, G.; Onisimo, M.; Zakariyyaa, O. Detecting Canopy Damage Caused by Uromycladium Acaciae on South African Black Wattle Forest Compartments Using Moderate Resolution Satellite Imagery. S. Afr. J. Geomat. 2019, 8, 69–83. [Google Scholar]
  26. Huang, H.C.; Liu, S.C.; Wang, C.; Xia, K.B.; Zhang, D.J.; Wang, H.Z.; Zhan, S.Y.; Huang, H.; He, S.Y.; Liu, C.C. On-Site Visualized Classification of Transparent Hazards and Noxious Substances on a Water Surface by Multispectral Techniques. Appl. Opt. 2019, 58, 4458–4466. [Google Scholar] [CrossRef] [PubMed]
  27. Li, X.Y.; Zhang, F.L.; Jane, Y. Locally Weighted Discriminant Analysis for Hyperspectral Image Classification. Remote Sens. 2019, 11, 109. [Google Scholar] [CrossRef]
  28. Corbane, C.; Alleaume, S.; Deshayes, M. Mapping Natural Habitats Using Remote Sensing and Sparse Partial Least Square Discriminant Analysis. Int. J. Remote Sens. 2013, 34, 7625–7647. [Google Scholar] [CrossRef]
  29. Boulesteix, A.L. Pls Dimension Reduction for Classification with Microarray Data. Stat. Appl. Genet. Mol. Biol. 2004, 3, 1–32. [Google Scholar] [CrossRef] [PubMed]
  30. Bagheri, N.; Mohamadi-Monavar, H.; Azizi, A.; Ghasemi, A. Detection of Fire Blight Disease in Pear Trees by Hyperspectral Data. Eur. J. Remote Sens. 2018, 50, 1–10. [Google Scholar] [CrossRef]
  31. Prats-Montalbán, J.M.; Ferrer, A.; Malo, J.L.; Gorbena, J. A Comparison of Different Discriminant Analysis Techniques in a Steel Industry Welding Process. Chemom. Intell. Lab. Syst. 2006, 80, 109–119. [Google Scholar] [CrossRef]
  32. Julia, A. Colour Correction of Underwater Images Using Spectral Data. Ph.D. Thesis, Acta Universitatis Upsaliensis, Uppsala, Sweden, 2005. [Google Scholar]
  33. Springsteen, A. Standards for Reflectance Measurements. Appl. Spectrosc. A Compact. Ref. Pract. 1998, 15, 247. [Google Scholar]
  34. Abdel-Rahman, E.M.; Mutanga, O.; Odindi, J.; Adam, E.; Odindo, A.; Ismail, R. A Comparison of Partial Least Squares (Pls) and Sparse Pls Regressions for Predicting Yield of Swiss Chard Grown under Different Irrigation Water Sources Using Hyperspectral Data. Comput. Electron. Agric. 2014, 106, 11–19. [Google Scholar] [CrossRef]
  35. Curran, P.J. Imaging Spectrqmetry-Its Present and Future Rôle in Environmental Research. In Imaging Spectrometry—A Tool for Environmental Observations; Springer: Berlin, Germany, 1994; pp. 1–23. [Google Scholar]
  36. Prasad, S.; Lori, M.B.; Hemanth, K. Data Exploitation of Hyspiri Observations for Precision Vegetation Mapping. In Proceedings of the 2009 IEEE International Geoscience and Remote Sensing Symposium, Cape Town, South Africa, 12–17 July 2009. [Google Scholar]
  37. Sathishkumar, S.; Prasad, S.; Bruce, M.L.; Robles, W. Nasa’s Upcoming Hyspiri Mission—Precision Vegetation Mapping with Limited Ground Truth. In Proceedings of the 2010 IEEE International Geoscience and Remote Sensing Symposium, Honolulu, HI, USA, 25–30 July 2010. [Google Scholar]
  38. Adelabu, S.; Mutanga, O.; Adam, E.; Sebego, R. Spectral Discrimination of Insect Defoliation Levels in Mopane Woodland Using Hyperspectral Data. Selected Topics in Applied Earth Observations and Remote Sensing. IEEE J. Sel. Top. Appl. Earth Obs. Remote Sens. 2014, 7, 177–186. [Google Scholar] [CrossRef]
  39. Zhang, H.; Lan, Y.; Suh, C.P.; Westbrook, J.K.; Lacey, R.; Hoffmann, W.C. Differentiation of Cotton from Other Crops at Different Growth Stages Using Spectral Properties and Discriminant Analysis. Trans. Am. Soc. Agric. Biol. Eng. 2012, 55, 1623–1630. [Google Scholar] [CrossRef]
  40. Manandhar, R.; Odeh, I.; Ancev, T. Improving the Accuracy of Land Use and Land Cover Classification of Landsat Data Using Post-Classification Enhancement. Remote Sens. 2009, 1, 330–344. [Google Scholar] [CrossRef] [Green Version]
  41. de Leeuw, J.; Jia, H.; Yang, L.; Liu, X.; Schmidt, K.; Skidmore, A.K. Comparing Accuracy Assessments to Infer Superiority of Image Classification Methods. Int. J. Remote Sens. 2006, 27, 223–232. [Google Scholar] [CrossRef]
  42. Pedrero, F.; Kalavrouziotis, I.; Alarcón, J.J.; Koukoulakis, P.; Asano, T. Use of Treated Municipal Wastewater in Irrigated Agriculture—Review of Some Practices in Spain and Greece. Agric. Water Manag. 2010, 97, 1233–1241. [Google Scholar] [CrossRef]
  43. Maurer, M.A.; Davies, F.S.; Graetz, D.A. Reclaimed Wastewater Irrigation and Fertilization of Matureredblush’grapefruit Trees on Spodosols in Florida. J. Am. Soc. Hortic. Sci. 1995, 120, 394–402. [Google Scholar] [CrossRef]
  44. Zavadil, J. The Effect of Municipal Wastewater Irrigation on the Yield and Quality of Vegetables and Crops. Soil Water Res. 2009, 4, 91–103. [Google Scholar] [CrossRef]
  45. Al-Lahham, O.; El Assi, N.M.; Fayyad, M. Impact of Treated Wastewater Irrigation on Quality Attributes and Contamination of Tomato Fruit. Agric. Water Manag. 2003, 61, 51–62. [Google Scholar] [CrossRef]
  46. Viskari, E.L.; Grobler, G.; Karimäki, K.; Gorbatova, A.; Vilpas, R.; Lehtoranta, S. Nitrogen Recovery with Source Separation of Human Urine–Preliminary Results of Its Fertiliser Potential and Use in Agriculture. Front. Sustain. Food Syst. 2018, 2, 32. [Google Scholar] [CrossRef]
  47. Moya, B.; Parker, A.; Sakrabani, R. Challenges to the Use of Fertilisers Derived from Human Excreta: The Case of Vegetable Exports from Kenya to Europe and Influence of Certification Systems. Food Policy 2019, 85, 72–78. [Google Scholar] [CrossRef]
  48. Moya, B.; Parker, R.S.; Mesa, B. Evaluating the Efficacy of Fertilisers Derived from Human Excreta in Agriculture and Their Perception in Antananarivo, Madagascar. Waste Biomass Valorization 2019, 10, 941–952. [Google Scholar] [CrossRef]
  49. Bassegio, D.; Santos, R.F.; de Oliveira, E.; Wernecke, I.; Secco, D.; de Souza, S.N.M. Effect of Nitrogen Fertilization and Cutting Age on Yield of Tropical Forage Plants. Afr. J. Agric. Res. 2013, 8, 1427–1432. [Google Scholar]
  50. Clevers, J.G.; Gitelson, A.A. Remote Estimation of Crop and Grass Chlorophyll and Nitrogen Content Using Red-Edge Bands on Sentinel-2 and-3. Int. J. Appl. Earth Obs. Geoinf. 2013, 23, 344–351. [Google Scholar] [CrossRef]
  51. Adam, E.; Mutanga, O.; Rugege, D. Multispectral and Hyperspectral Remote Sensing for Identification and Mapping of Wetland Vegetation: A Review. Wetl. Ecol. Manag. 2010, 18, 281–296. [Google Scholar] [CrossRef]
  52. Mansour, K.; Mutanga, O.; Everson, T. Remote Sensing Based Indicators of Vegetation Species for Assessing Rangeland Degradation: Opportunities and Challenges. Afr. J. Agric. Res. 2012, 7, 3261–3270. [Google Scholar]
  53. Thenkabail, P.S.; Lyon, J.G. Hyperspectral Remote Sensing of Vegetation: Knowledge Gain and Knowledge Gap after 50 Years of Research (Conference Presentation); Paper Presented at the Hyperspectral Imaging Sensors: Innovative Applications and Sensor Standards 2017; CRC Press: Boca Raton, FL, USA, 2017. [Google Scholar]
  54. Thenkabail, P.S.; Enclona, E.A.; Ashton, M.S.; Legg, C.; De Dieu, M.J. Hyperion, Ikonos, Ali, and Etm+ Sensors in the Study of African Rainforests. Remote Sens. Environ. 2004, 90, 23–43. [Google Scholar] [CrossRef]
  55. Thenkabail, P.S.; Smith, R.B.; De Pauw, E. Evaluation of Narrowband and Broadband Vegetation Indices for Determining Optimal Hyperspectral Wavebands for Agricultural Crop Characterization. Photogramm. Eng. Remote Sens. 2002, 68, 607–622. [Google Scholar]
  56. Thenkabail, P.S.; Lyon, J.G. Hyperspectral Remote Sensing of Vegetation; CRC Press: Boca Raton, FL, USA, 2016. [Google Scholar]
  57. Clark, M.L. Comparison of Simulated Hyperspectral Hyspiri and Multispectral Landsat 8 and Sentinel-2 Imagery for Multi-Seasonal, Regional Land-Cover Mapping. Remote Sens. Environ. 2017, 300, 311–325. [Google Scholar] [CrossRef]
  58. Colkesen, I.; Kavzoglu, T. Ensemble-Based Canonical Correlation Forest (Ccf) for Land Use and Land Cover Classification Using Sentinel-2 and Landsat Oli Imagery. Remote Sens. Lett. 2017, 8, 1082–1091. [Google Scholar] [CrossRef]
  59. Lillesand, T.; Ralph, W.K.; Jonathan, C. Remote Sensing and Image Interpretation; John Wiley & Sons: Hoboken, NJ, USA, 2015. [Google Scholar]
  60. Thenkabail, P.S.; Mariotto, I.; Gumma, M.K.; Middleton, M.E.; Landis, R.D.; Huemmrich, F.K. Selection of Hyperspectral Narrowbands (Hnbs) and Composition of Hyperspectral Twoband Vegetation Indices (Hvis) for Biophysical Characterization and Discrimination of Crop Types Using Field Reflectance and Hyperion/Eo-1 Data. Sel. Top. Appl. Earth Obs. Remote. Sens. IEEE J. 2013, 6, 427–439. [Google Scholar] [CrossRef]
  61. Mariotto, I.; Prasad, S.; Thenkabail, A.H.; Terrence Slonecker, E.; Platonov, A. Hyperspectral Versus Multispectral Crop-Productivity Modeling and Type Discrimination for the Hyspiri Mission. Remote Sens. Environ. 2013, 139, 291–305. [Google Scholar] [CrossRef]
  62. Pu, R.; Liu, D. Segmented Canonical Discriminant Analysis of in Situ Hyperspectral Data for Identifying 13 Urban Tree Species. Int. J. Remote. Sens. 2011, 32, 2207–2226. [Google Scholar] [CrossRef]
  63. Karimi Prasher, Y.S.O.; McNairn, H.; Bonnell, R.B.; Dutilleul, P.; Goel, P.K. Classification Accuracy of Discriminant Analysis, Artificial Neural Networks, and Decision Trees for Weed and Nitrogen Stress Detection in Corn. Trans. ASAE 2005, 35, 1261–1268. [Google Scholar] [CrossRef]
  64. Filella, I.; Serrano, L.; Serra, J.; Penuelas, J. Evaluating Wheat Nitrogen Status with Canopy Reflectance Indices and Discriminant Analysis. Crop Sci. 1995, 35, 1400–1405. [Google Scholar] [CrossRef]
Figure 1. Collected spectra (a) and Mean spectral signatures of tomato crops grown under ABR effluent, NUC and CHFM treatments based on (b) HyspIRI (c) Sentinel -2 MSI and (d) Landsat 9 OLI-2 spectral settings.
Agronomy 09 00373 g001aAgronomy 09 00373 g001b
Table 1. Properties of HyspIRI, Sentinel 2-MSI and Landsat 9 OLI-2 sensors.
SensorOrbital AltitudeRevisit Time (days)Swath Width (Km)Spectral BandsBand CentreSpatial Resolution
HyspIRI (VSWIR)626 km16185 kmContiguous (10 nm) 30
380–2500 nm
Landsat 9 OLI-2705 km16185 km1Coastal/Aerosol44330
2Blue48230
3Green56230
4Red65530
5NIR86530
6SWIR 1161030
7SWIR 2220030
8Panchromatic59015
9Cirrus137530
10Thermal10,800100
11Thermal12,000100
Sentinel 2-MSI786 km5280km 1Coastal aerosols44360
2Blue49010
3Green56010
4Yellow66510
5Red edge70520
6Red edge74020
7Red edge78320
8NIR84210
8aNIR86520
9NIR94560
10SWIR137560
11SWIR161020
12SWIR219020
Table 2. Classification accuracies derived using HyspIRI, Sentinel 2 MSI and Lands 9 OLI-2 spectral settings.
Sensor PLS-DA DA PLS-DA DA
PAUAPAUAOAKappaOAKappa
ABR100951001000.970.900.990.99
HyspIRICHFM92100100100
NUC10094100100
Sentinel 2 MSIABR911001001000.900.690.950.85
CHFM8610089100
NUC1006510082
Landsat 9 OLI-2ABR9195951000.890.630.940.79
CHFM8310089100
NUC1006510076
Table 3. Influential bands in discriminating tomato plants grown under different fertilizer regimes.
SpectrumSensor
HyspIRISentinelLandsat
DAPLS-DADAPLS-DADAPLS-DA
Visible542121
Red edge121033
NIR10102211
SWIR871122
M/FWIR77
Total42388754
NB M/FWIR means Mid/Far wavelength infrared.

