Abstract
In greenhouses, where intensive systems are widely used for organic production, the differences between “conventionalized” and agroecological approaches are especially evident. Among the agronomic practices, green manure from agroecological service crops (ASCs) and organic amendments represent the main tools for soil fertility management with respect to the substitution of synthetic fertilizer with organic ones (the input substitution approach). Over a two-year organic rotation, we compared a conventionalized system (SB) and two agroecological systems, characterized by ASC introduction combined with the use of manure (AM) and compost (AC) amendments. A system approach was utilized for the comparison assessment. For this purpose, agronomic performance, soil fertility and the density of soil arthropod activity were monitored for the entire rotation. The comprehensive evaluation of the parameters measured provided evidence that clearly differentiated SB from AM and AC. The drivers of discrimination were soil parameters referring to long term fertility and soil arthropod dynamics. The study confirmed the higher productivity of SB but also no positive impact on soil fertility and soil arthropods, as highlighted by AM and AC. Based on the results, a trade-off between productivity and the promotion of long-term ecosystem diversity and functioning is needed for the assessment of systems of organic production.
1. Introduction
The issue of intensive organic production systems has been the subject of debate during the last decade, since the concept of “conventionalization” of organic production was introduced [1,2]. “Conventionalized” organic production, also called as “input-substitution” system, is characterized by the substitution of synthetic inputs with those allowed by organic regulations [3]. Despite their conformity to organic regulations, these systems are, in general terms, very similar to conventional and integrated ones for the high yield per unit area and the potential environmentally negative externalities, such as degradation of soil, high greenhouse gases (GHG) emissions and biodiversity losses [4]. On the other hand, alternative organic production systems based on a balance between productivity, agrobiodiversity promotion and ecosystem service provision have been set up in different climatic conditions [5,6]. In the more recent scientific literature [7,8,9] the great majority of these organic systems are referred to open field conditions, where agronomic practices such as minimum tillage, organic amendments, long-term rotation and cover crop cultivation are more easily introduced. Only recently have such alternative organic systems of production been tested in protected conditions [10]. Among the many criteria involved in the definition of the price premium for organic vegetables, the potential environmental impact of the production system is considered one of the more influential among consumers of organic food [11,12,13].
These issues have led to the need to change the organic greenhouse production system, to meet the expected environmental sustainability (e.g., reduced water consumption and soil organic matter depletion), together with the market demand for organic production. In this context, an agroecological approach to organic production should be promoted, adopting a holistic perspective able to also encompass other aspects of agriculture (i.e., environmental, social), rather than just the production issues [14]. To implement such an approach, a deep comprehension of the complex interrelationships among the components of the agroecosystem is necessary, to maximize services and minimize negative externalities (e.g., biodiversity reduction due to external input use). Furthermore, practices aiming to increase the agrobiodiversity in space and time should be promoted, to foster the desired biodiversity components. Long-term rotation and introduction of agroecological service crops (ASCs)—cultivation of plant species not for yield purposes but for ecosystem service provision (e.g., cover crops, catch crops, living mulch, etc.) [15]—should also be adopted in greenhouse systems [10]. In this context, the real challenge for research on organic production is the comparison between different “certified” organic farming systems, which overcomes the mere comparison between conventional and organic agriculture. To contrast the widespread production intensification, different criteria for evaluating production systems must be identified. A holistic and agroecological based approach should reject the simplistic “conventional” criteria of maximizing yield per square meter or maximizing efficiency per input unit without any assessment of the negative impact on the environment [16]. Moreover, system studies in organic farming provide a sort of “knowledge package” including innovative solutions and multidisciplinary know-how, which go beyond the external inputs dependency of conventionalized systems of production. Since intensification of production systems implies simplification, and consequent biodiversity losses, which leads to reductions in ecosystem services, the use of arthropod biodiversity and dynamics can be a reliable indicator of system diversity, covering a wide range of ecological functions in the agroecosystem [17].
To investigate the effects of “agroecological” systems on agronomic performance, soil properties, and associated soil arthropod dynamics in greenhouse crops under a Mediterranean climate, a two-year field experiment was carried out at the Centre International De Hautes Études Agronomiques Méditerranéennes (CIHEAM)—Bari, in Valenzano (Puglia region, Southern Italy). The hypothesis underlying the experiment was that different agronomic management, within organic systems of production (organic fertilizers and ASC introduction and management, compared to a conventionalized-business as usual-system), would result in: (1) similar yield; (2) differences in soil fertility; and (3) differences in soil arthropods composition and their relative ecological services/disservices (e.g., pest control and organic matter decomposition). To test these hypotheses, the following aspects were studied: (1) crop performances over the two years of the experiment; (2) soil arthropod activity density in the management system tested; and (3) linkages between the cited biological community and the most important soil fertility parameters. A system approach was utilized for the assessment of different systems of production [18].
2. Materials and Methods
2.1. Experimental Site
The research was carried out at the long-term experiment on organic vegetable production systems in Mediterranean greenhouses (MOREGREEN LTE) located at the CIHEAM—Bari (MAIB), in Valenzano (Puglia region - Southern Italy). The location is about 72 meters above sea level (41°08′ N latitude and 16°51′ E longitude). The experimental greenhouse (300 m2; 7.5 m × 40.0 m) was an un-heated tunnel (EUROPROGRESS s.r.l., Mirandola (MO), Italy) with galvanized steel frames covered by ethylene vinyl acetate (EVA) sheets. It was longitudinally divided into two areas/fields (field I and field II). The present research was based on the two-year rotation of field I, cultivated with kohlrabi (Brassica oleracea var. gongyloides, cv “Korist”), lettuce (Lactuca sativa L. var. longifolia Lam., cv Salad bowl), zucchini (Cucurbita pepo L., cv Striata di Puglia) and lamb’s lettuce (Valerianella locusta L., cv Semegrosso d’Olanda) in rotation (2014–2015 and 2015–2016).
2.2. Experimental Design
The experimental layout was a completely randomized block (CRB) design with three replications (for a total of 9 plots, 3.0 m × 4.0 m each). The organic farming systems under comparison were as follows. (1) Substitution (SB), a business as usual organic production system (very diffused especially in greenhouse vegetable production), based on an “input substitution” approach. This system mimics conventional agriculture by substituting agrochemicals with products allowed in organic farming (e.g., substitution of synthetic fertilizers with organic ones). The following fertilizers were applied: commercial organic fertilizer based on guano (commercial name—“Guanito” by Italpollina); and liquid commercial organic fertilizer based on sugar beet molasses (commercial name—“Kappabios” by Serbios). (2) Agroman (AM), characterized by the use of a mixture of ASCs and mature organic cattle manure as a soil amendment. (3) Agrocom (AC), which utilizes a mixture of ASCs and on-farm made compost as a soil amendment. In the first year of rotation, before the kohlrabi crop, the same composition of ASC mixture was used in AM and AC, while two different mixtures of species were considered in the second cycle of ASCs, before the zucchini crop. The choice of mixtures, instead of the cultivation of a single ASC species, was made in order to better guarantee the provision of the ecological services in the long run. The ASC species mixture for each treatment and the ecological service corresponding to each botanical family are reported in Table 1. During the ASC cycles in AC and AM, soil was left bare in the SB plots.

Table 1.
Agroecological service crops (ASC) mixture composition and ecological services provided.
Before ASC sowing, the soil was prepared using a rotary tiller. ASC mixture seeds were broadcasted by hand and gently covered with soil using a rake on 27 and 10 June in 2014 and 2015, respectively. In the first year of rotation, the ASCs were terminated differently at the start of the flowering stage (about 50 days after sowing); in AC, the ASCs were manually chopped using a sickle and ploughed into the soil as green manure using a rotary spader, whereas in AM, the ASCs were flattened using a roller crimper [19] to obtain a mulching layer made of the ASC biomass, in which kohlrabi was transplanted. After the kohlrabi cycle, before lettuce transplanting, ASC mulch residues were incorporated into the soil using a rotary spader. In the second experimental year, ASCs were instead terminated as green manure in both the AM and AC systems. Details on rotation, starting from the first year, were as follows: kohlrabi was transplanted on 22 October 2014, using seedlings from the nursery of CIHEAM—Bari, and harvesting was completed on 7 January 2015. Lettuce was transplanted on 9 March 2015, using seedlings from the nursery of CIHEAM—Bari, and harvested on 24 April 2015. The density of the kohlrabi and lettuce was 10 plants/m2, (0.5 m between lines and 0.2 m within each line). Zucchini was transplanted at a density of 1.8 plants/m2, (0.8 m between lines and 0.7 m within each line) on 8 September 2015, using seedlings from the nursery of CIHEAM—Bari, and harvesting was completed on 30 November 2015.
Finally, lamb’s lettuce was sown at a rate of 50 seeds/m2 on 14 March 2016, using a pre-sown blanket of biodegradable tissue (supplied by Virens, Padova, Italy), and harvesting was completed on 18 May 2016 [23]. All crops were harvested according to required market standards. Cumulative production (yield) per crop was calculated for each system. Air temperature at 2 m height was measured hourly by two probes during both ASC and cash crop cycles. Air humidity and temperature were kept under control (10–28 °C range) by manually opening/closing tunnel border sides when needed.
2.3. Soil Preparation
The tunnel greenhouse was installed on May 2012, on a soil organically managed for ten years. Strawberry (Fragaria × ananassa var. Duchesne, cv Festival) was cultivated as previous crop in each system from September 2013 to May 2014. Before the first ASC cycle, the soil was ploughed using a rotary tiller (SICMA CS 105). In the SB system, for kohlrabi, lettuce and zucchini cultivation, the whole soil bed was covered by black polyethylene plastic mulch. Water was mainly supplied by drip irrigation, except for ASC and lamb’s lettuce cultivation, where sprinkler irrigation was used.
2.4. Organic Amendment and Fertilizers
The total amount of amendments and fertilizers applied to each of the three systems, total nitrogen and carbon content, and distribution practices are reported in Table 2 and Table 3. Compost and cattle manure samples were analysed in triplicate for dry matter, total organic carbon (TOC) and total nitrogen (TN). Dry matter was calculated by weight loss overnight in an oven at 105 °C. TOC was analyzed with a LECO analyzer (LECO RC-612; St. Joseph, MI, USA) using a dry combustion method [24]. TN was analyzed with the Dumas method using the elemental analyzer LECO FP 528.
Table 2.
Characterization of amendments and fertilizers applied for each crop during the rotation.
Table 3.
Distribution of amendments and fertilizers to the three systems for each crop (on dry matter basis, except for “Kappabios”, in liquid form).
2.5. Plant Sampling and Analysis
Each year, at the end of the ASC cycle, three quadrats (0.25 m × 0.25 m) per plot were used to sample the fresh aboveground biomasses. At the harvest stage, cash crops were collected from the plots and partitioned into products and residues. Plant samples were divided into two subsets. One was dried at 105 °C for the determination of the dry matter content by gravimetric loss (total plant biomass, total yield and biomass of residues ploughed into the soil at the end of crop cycle—hereafter reported as Tot Biom, Tot Yield and Inc res, respectively), while the other was dried at 60 °C and stored for analyses. In SB, crop residues were removed from the field. TN was analyzed using samples of the ASCs, products and residues, with the Dumas method using the elemental analyzer LECO FP 528. N uptake of cultivated plants was then calculated by multiplying N content by the correspondent biomass per hectare values, in order to obtain the total N uptake (Tot Nu) and the yield N uptake (Yield Nu). All the organic biomass utilized as C input (ASC and cash crop residues—Inc res C) were analyzed for C content on a LECO analyzer (LECO RC-612) using a dry combustion method. To obtain the C input, the carbon content of plant materials was multiplied by the correspondent biomass per hectare values.
2.6. Soil Sampling and Analysis
For each crop in rotation, at different plant phenological phases (at transplanting, during the plant growth cycle—twice for kohlrabi and zucchini and once for lettuce and lamb’s lettuce, and at harvest), elementary soil sub-samples were taken from each plot using an auger at a depth of 0–30 cm and mixed to form a composite sample for each plot. For each composite sample, total soil mineral nitrogen (SMN), as the sum of nitrate (NO3−-N) and ammonium nitrogen (NH4+-N), was determined. Fresh soil samples were extracted by 2M KCl (1:10 w/v). Then NH4+-N and NO3−-N were determined according to Henriksen and Selmer-Olsen [25] and Krom [26]. At the beginning of the experiment and at the end of each cash crop cycle, the soil samples were air dried, sieved at 2 mm and stored for the determination of total organic carbon (Soil TOC), total nitrogen (Soil TN) and available Phosphorus (Soil P). Soil TOC content was determined by combustion method on a LECO analyzer (LECO RC-612; St. Joseph, MI, USA) using a dry combustion method [24]. Soil TN was analyzed with the Dumas method using the elemental analyzer LECO FP 528. Soil P was extracted and measured according to the Olsen method [27].
2.7. Soil Arthropods Monitoring
Soil arthropods were monitored from July 2014, following the rotation plan, until May 2016. Depending on the crop cycle, monitoring periods were as follows: ASC ‘14 (49 days); kohlrabi (56 days); lettuce (43 days); ASC ‘15 (46 days); zucchini (93 days); and lamb’s lettuce (58 days). Pitfall traps were used to collect arthropods (one per plot). Each trap consisted of a plastic cup (13 cm × 10 cm, 500 mL) half filled with 50% propylene glycol water solution. The cups were dug into the soil and the rim was levelled with the soil surface. A 15 cm × 15 cm plastic saucer was placed 4 cm above the cup to prevent irrigation water entering the cups. The traps were replaced every 15–25 days during the monitoring period (depending on the capture rate). The content of each cup was emptied in the field into plastic containers and stored in the fridge until soil arthropods were counted in the laboratory. In the present study, seven macrogroups were considered (Coleoptera Carabidae, Coleoptera Staphylinidae, Collembola, Araneae, Myriapoda, Isopoda and Opiliones). Data are presented as mean activity density for each macrogroup per crop and as mean for full rotation period (total number of individuals divided by days of trap activity and multiplied by 10; resulting in cumulative activity density for a 10 days period). Detailed elaboration of total soil arthropods and relative abundance is reported in [28], while the present paper reports the activity density of individual macrogroups and intends to explore their possible relations with the main soil parameters studied.
2.8. Statistical Analysis
Agronomic parameters and arthropod macrogroups were analysed with a mixed model, using YEAR (levels: 1°–2°) as random factor, SYSTEM (levels: AC, AM and SB) and CROP (levels: A, K, L, Z and LM, for ASC, kohlrabi, lettuce, zucchini and lamb’s lettuce, respectively) as fixed factors. In the model, CROP was nested within YEARS. Mixed model analyses were performed by means of SAS 9.0.
Agronomic and arthropod data were also analyzed by means of an explorative multivariate analysis, using canonical discriminant analysis (CDA). CDA was used for understanding the temporal dynamics of the systems during the two-year rotation. In other words, to underpin the interactions evidenced by the mixed model (see previous analysis). The group variables of the CDA were System (SB, AC and AM) and Crop rotation (Year: 1 and 2), while the response variables (represented by arrows) were agronomic parameters and arthropod taxa. In the biplot, the multivariate 95% confidence coefficient of the canonical means of each group variable was represented by a circle. CDA was employed using R 3.3.2.
3. Results
The results of the mixed model analysis for agronomic parameters are reported in Table 4. The system x crop rotation (Year) showed significant interaction for most of the analyzed parameters, except for Soil P, Soil TN, Tot Biom, Inc res and Inc res C, while both System and Crop rotation (Year) factors highlighted significant differences, except for Soil TN in Crop rotation (Year). Table 5 and Table 6 display means for soil chemical and plant parameters, respectively, for each system and crop in rotation, including the total means for the compared systems in the whole rotation. In particular, Soil TOC showed increasing trends during the rotation in AC and AM until ASC ‘15, whereas a slight variation around the average value was recorded for SB (Table 5). No difference due to the Year was recorded for Soil TN, while a significant effect of Systems was detected (Table 4), with lower value in SB than in agroecological systems (Table 5). Soil P showed the highest values for AC, followed by SB and then by AM, with higher values in the first year rotation than in the second one (36.6 and 31.0 ppm, respectively). Soil mineral nitrogen (NO3−-N + NH4+-N as SMN) parameters showed the lowest dynamics in SB and first crop year rotation, whereas the highest were recorded in the same year by AC, recording the highest NO3−-N content during the lettuce cycle (179 ppm), with a similar trend also shown by AM. The lowest SMN values were instead recorded for the SB in the zucchini cycle (second year), corresponding to 23.3 ppm (NO3−-N + NH4+-N) (Table 5). As far as the plant parameters are concerned (Table 6), SB showed the highest yield for all the cash crops, with the exception of lamb’s lettuce when AM showed the highest yield. Similar results were recorded for the Nuptake parameters (Tot Nu and Yield Nu), whereas AM showed the highest Carbon input (Inc Res C) due to residues (0.23 t ha−1 vs 0.19 t ha−1 for AM and AC, respectively).
Table 4.
Results of the mixed model analysis on agronomic parameters (P levels). See material and methods for explanations.
Table 5.
Means of soil chemical parameters for the three organic systems during the two-year rotation period.
Table 6.
Means of plant parameters for the three organic systems during the two-year rotation period.
Crop rotation (System) showed significant differences, among the farming systems compared, in activity density for four out of the seven taxa (Araneae, Opiliones, Staphylinidae and Myriapoda) (Table 7). The significant interaction (p < 0.01) between systems and crops in the two-year rotation demonstrated that the effect of agroecological systems was strongly associated with the year of the rotation. Indeed, crop (Year) factor was strongly correlated with activity density for all the arthropod taxa. A detailed analysis of the mixed model interactions explains better the response of arthropod fauna to all the variables of the rotation (Table 8). For example, besides a general positive impact of agroecological systems on Staphylinidae in comparison with SB (mean value for the rotation), the AC system was positively associated with the activity density of this taxon mainly in the first year of rotation, and in particular during the kohlrabi and lettuce cultivation. Collembola activity density was higher in SB in comparison with agroecological systems, particularly for ASC during the first year.
Table 7.
Results of the mixed model analysis on arthropod taxa (P levels). See material and methods for explanations.
Table 8.
Activity density of soil arthropods macrogroups for the three organic systems during the two-year rotation period.
This trend changed during the second year, when density of this taxon was higher in the agroecological systems (zucchini) or it had similar values for all systems. Araneae were positively correlated with AM in the ASC cycle during the second year of rotation, while the difference among the systems was not relevant in the other crops. Opiliones positively responded to AC and AM in the first year during lettuce cycle, while Myriapoda were more associated with the agroecological systems during the second year (ASC and zucchini). The mean activity density of Carabidae and Isopoda during the whole rotation was not correlated with the systems (Table 7 and Table 8). Carabidae density showed a higher increase in AC than in SB and AM during the kohlrabi rotation (Table 8) and a partial response to AC in the ASC during the first year and in zucchini in the second year, even if the interaction is not significant (Table 7). Isopoda density was higher in agroecological systems in ASC during both the cultivation years.
Figure 1 and Figure 2 refer to the system discrimination due to the agronomical parameters variability. In particular, in Figure 1, SB differentiates with respect to AC and AM for yield (higher in SB), for Yield N uptake (higher nutritional efficiency of SB respect to AM and AC) and partially for Soil P. On the other hand, AM and AC differentiate from SB mainly for their effects on Soil TOC and Soil TN.
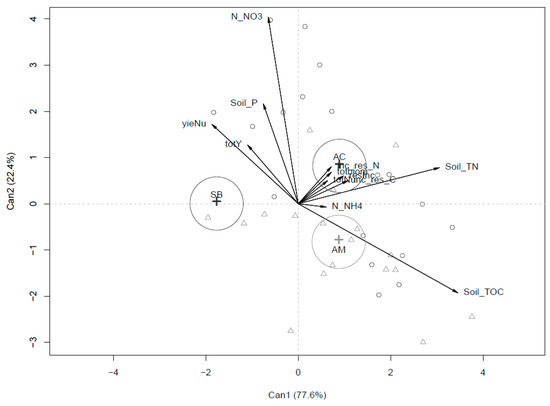
Figure 1.
Canonical discriminant analysis (CDA) output for agronomic parameters in the three compared systems (SB, AC and AM) pooling the two-year rotation.
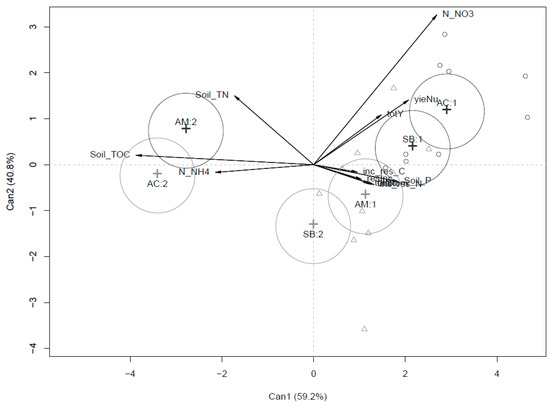
Figure 2.
CDA output for agronomic parameters in the three compared systems (SB, AC and AM) over the two experimental years.
Figure 2 refers to the same dataset utilized in Figure 1, with the difference that the effect of single systems of production (SB, AM and AC) on soil and plant parameters are analyzed during the two years of the experiment (SB1 and SB2; AM1 and AM2; AC1 and AC2), giving to the production systems compared a dynamic effect on plant and soil parameters. In particular, it is worth noting how, during the first year of rotation, the three systems compared (SB1, AM1 and AC1) did not differentiate clearly. In the second year, the differences among SB2, AM2 and AC2 seem to strongly discriminate substitution from agroecological systems in terms of soil parameter vectors (Soil TOC, NH4+-N and Soil TN).
Figure 3 graphically represents the distribution of the systems based on soil arthropod macrogroup abundances, pooling the two-year rotation together. In this case, AM assumed an intermediate position between SB and AC, along the first axis. So, the discrimination among the systems did not follow the same trend reported for soil chemical parameters. In any case, both AC and AM seem to be associated with vectors representing most of the groups of arthropods (higher abundance). Conversely, SB was correlated only with Collembola.
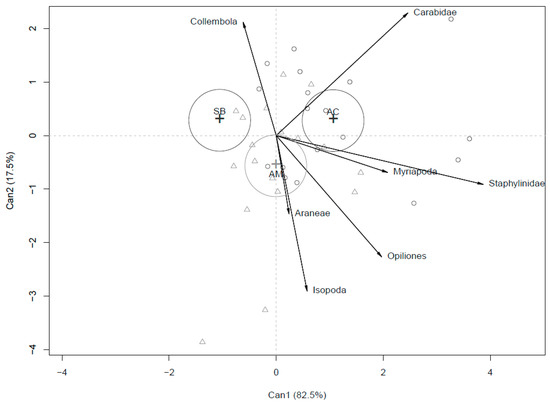
Figure 3.
CDA output for arthropods abundance in the three compared systems (SB, AC and AM) pooling the two-year rotation.
In Figure 4, the dynamic effect of the production systems (SB, AM and AC) on soil arthropod abundance is represented. CDA corroborates mixed model analysis, and in particular the interaction between system and crop rotation (year). The almost complete overlap of SB1 and SB2 confirms that the influence of the input substitution system of production on soil arthropods did not change during the two-year rotation. Conversely, for the two agroecological treatments, crops cultivated in the two years of rotation affected the trends of soil arthropods. In particular, during the first year, Staphilinidae and Opiliones showed strong correlation with AC and AM, respectively. During the second year, an overlap of the effects of AM2 and AC2 was observed, with a strong correlation of the agroecological systems with Araneae, Collembola and Myriapoda. During the second year, Isopoda showed slight correlation with AC and AM, confirmed by the almost significant interaction between systems and crop in rotation (Year) of the mixed model (Table 7). Both agroecological systems in the second year (AC2 and AM2), were associated with groups (Araneae, Myriapoda, Collembola) which were different in comparison to those of the first year (AC1 and AM1) of the experiment (Opiliones, Staphylinidae).
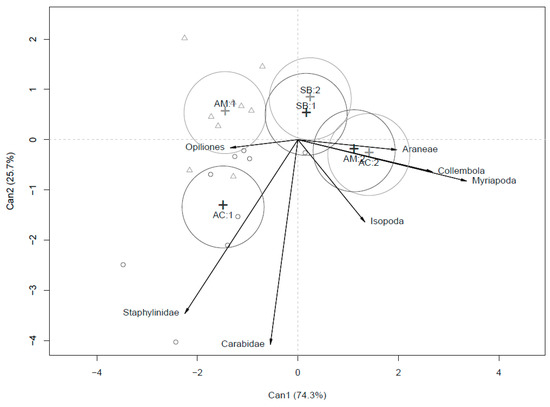
Figure 4.
CDA output for arthropods abundance in the three compared systems (SB, AC and AM) over the two experimental years
4. Discussion
Yield comparisons between conventional and organic farming systems have been reported by several authors and show that marketable yields are usually higher in conventional systems compared to organic systems by 10% to 25% [20,29,30]. In our research, as expected, similar results were observed for SB and agroecological treatments. Indeed, organic fertilisers used in SB seemed to play exactly the role of the synthetic input in a conventional system, guaranteeing a better productive effect and more efficient nitrogen uptake of the cash crop compared to AM and AC. So, the hypothesis of similar results was not verified. As observed by Tittarelli et al. [10], agroecological systems have a lower efficiency in N utilization because the amount of N associated to organic biomass incorporated to soil (e.g., crop residues, green manure and organic amendments) is higher compared to the amount applied with organic fertilizer. These agronomic practices have the wide objective of guaranteeing not only nutrients availability to the crops but also to increase soil organic matter content [31]. The analysis of the results in terms of soil fertility are further supported by the evidence shown in Figure 2, where the increasing amount of organic matter incorporated into the soil in the AC and AM systems is graphically represented in CDA by the shifting of agroecological systems in the second year of the trial under the Soil TOC and Soil TN drivers. On the other side, SB slightly changed during the biennial rotation with respect to the soil parameters analyzed, and it was mainly driven by yield and available mineral nitrogen. This result is in accordance with those of Garcia-Franco et al. [32]. Agroecological practices, which are mainly characterized by the introduction in the system of higher amounts of organic carbon, differentiated with respect to the input substitution system during the second year, when the amount of organic amendments incorporated into the soil became significantly higher than in SB, where just organic fertilizers were broadcasted.
The spatio-temporal distribution of soil arthropods in the systems of production we compared was more complex and seemed to follow a multi-effect response. Besides a general positive influence of agroecological systems on arthropod activity density, responses of macrogroups do not allow us to identify precise drivers of their patterns. Indeed, the agroecological systems (AM and AC) positively affected the activity density of most of the arthropod taxa, but these effects were strongly influenced by the year of cultivation. The positive effect of the agroecological systems, and in particular AC, was evident for Staphylinidaee during the first year of rotation. Some positive effects of the agroecological systems were found also for Opiliones, Araneae and Myriapoda, but only in the second year of rotation (Table 8). On the contrary, the SB system did not affect activity density of soil arthropod taxa in the two years of the cultivation of cash crops, and this lack of effect was constant during the whole rotation. The partial responses of taxa only for few crops in rotation seems to be the reason for the interactions close to significant values (Table 7), whereas the CDAs carried out for evaluating the temporal performance of systems on agronomic parameters and arthropod activity density confirmed the interactions observed with the mixed model and allowed a more in-depth evaluation of the results obtained.
The macrogroup of Collembola demonstrated, in our study, how complex soil arthropods reactions to production systems are. Agricultural practices implemented can affect nutrients supply and can be a source of physical disturbance, both considered to be among the key factors determining biological diversity in aboveground systems [33,34]. Coulibaly et al. [35] found that during a 4-year period, tillage intensity (i.e., physical disturbance) had a significant effect on diversity and abundance of Collembola, while residue incorporation (resource supply) had no significant impact. Our results only partially confirmed these findings, since in the first year of our experiment, additional disturbance of soil due to the sowing of ASC in AM and AC resulted in much lower activity density of the Collembola macrogroup in these systems than in SB. While the beneficial effects of agroecological practices (e.g., resource supply) appeared to be significant for the following crop (kohlrabi) and with a residual effect for the subsequent one (lettuce). During the second year, the effects of rotation (crop) could be observed, since the AC and AM systems had similar or higher values of Collembola activity density than in SB. In other words, the direction of the Collembola vector changed toward the AC and AM systems in the second year of the study. These results should be attributed to systems stabilization, since after the ASC cultivation in 2014, Collembola activity density was not significantly different between the systems for the whole rotation.
According to the scientific literature, soil fauna plays a key role in soil functioning and in the maintenance of soil quality [36] and can reflect anthropogenic disturbances to soil ecosystems [37,38]. Our results demonstrated how the community structure of soil arthropods is strictly linked to changes in soil fertility parameters. Soil arthropods are recognized as reliable bioindicators, due to their important role in terrestrial ecosystem services delivery, especially because of their capability to affect organic matter decomposition processes [39] and to contribute to biological pest control [40]. When soil arthropods are divided according to ecosystem service delivery groups (functional subgroups), such as biological pest control subgroups (Carabidae, Aranea, Opiliones, Staphylinidae) and nutrient cycling subgroups (Isopoda, Myriapoda, Collembola), the results obtained indicate significantly higher contribution of AC and AM systems to biological pest control [28]. In the case of the nutrient cycling subgroup, the systems did not differ significantly; thus, the hypothesis related to diversified services among systems is only partially confirmed.
It is worth noting that the introduction of agroecological practices, such as the cultivation of ASC as green manure and the use of soil amendments instead of commercial organic fertilizers, determined a quick change in some soil characteristics, which were able to discriminate systems of production.
5. Conclusions
The results obtained during the two-year rotation generated evidence for how the input substitution system (SB) is different to agroecological systems, both in terms of agronomic parameters and soil arthropods abundance. Thus, SB showed effects on short term soil fertility but, as expected, did not have any effect on parameters related to the long run. These slight differences in agronomic parameters were in line with the results obtained for soil arthropods, since significant changes in abundance and dynamics were not observed. On the other hand, both agroecological systems showed a significant change in long-term soil fertility parameters, and also an evolution of soil arthropod groups. Actually, in accordance with previous findings, patterns analyzed can be considered to be bioindicators for a comprehensive assessment of management systems. In protected condition, where the systems are often very intensive, the cultivation of ASC which are not aimed to produce yield represents an agronomic mean which is not easily acceptable by growers. Recent publication of European regulation (EU 2018/848) on organic production reports the need of short-term green manure for certified organic production in protected conditions. It is a challenge which would only be accepted by growers if its environmental impact is demonstrated.
Our results demonstrated that the label “organic” does not represent the same impact on soil fertility and biodiversity per se. Since, in protected conditions the input substitution approach is the more widely diffused system of production, it could be worth investigating its potential impact also on other aspects of soil health and suppressiveness (e.g., nematode biodiversity, soil microbial activity, etc.) in comparison with organic systems characterized by the implementation of agroecological practices.
Author Contributions
Conceptualization, F.T., C.C.; methodology, F.T., C.C., E.T., F.G.C., and G.B.; formal analysis, C.C., E.T. and S.M.; investigation S.M., E.T., and G.B.; data curation, E.T., F.G.C. and S.M.; writing—original draft preparation, C.C. and F.T.; writing—review and editing, E.T., F.G.C., S.M., G.M., and G.B.; visualization, C.C. and G.B.; supervision, F.T.; project administration, F.T.; funding acquisition, F.T.
Funding
This study has been carried out in the framework of the activities of BIOSEMED project funded by the Italian Ministry of Agriculture, and its findings relative to biodiversity issues have been discussed and shared with Dr. Roberta Farina in the DIVERFARMING H2020 project.
Acknowledgments
We would like to thank Stefano Trotta for his help in plants and soil analysis.
Conflicts of Interest
The authors declare no conflict of interest. The funders had no role in the design of the study; in the collection, analyses, or interpretation of data; in the writing of the manuscript; or in the decision to publish the results.
References
- Darnhofer, I.; Lindenthal, T.; Bartel-Kratochvil, R.; Zollitsch, W. Conventionalisation of organic farming practices: From structural criteria towards an assessment based on organic principles. A review. Agron. Sustain. Dev. 2010, 30, 67–81. [Google Scholar] [CrossRef]
- Goldberger, J.R. Conventionalization, civic engagement, and the sustainability of organic agriculture. J. Rural Stud. 2011, 27, 288–296. [Google Scholar] [CrossRef]
- European Commission. Commission Regulation (EC) No. 889/2008 laying down detailed rules for the implementation of Council Regulation (EC) No. 834/2007 on organic production and labelling of organic products with regard to organic production, labelling and control. Off. J. 2008, L250, 1–84. [Google Scholar]
- Frison, E.A. IPES-Food. In From Uniformity to Diversity: A Paradigm Shift from Industrial Agriculture to Diversified Agroecological Systems; IPES: Louvain-la-Neuve, Belgium, 2016. [Google Scholar]
- Moonen, A.C.; Barberi, P. Functional biodiversity: An agroecosystem approach. Agric. Ecosyst. Environ. 2008, 127, 7–21. [Google Scholar] [CrossRef]
- Wood, S.A.; Karp, D.S.; DeClerck, F.; Kremen, C.; Naeem, S.; Palm, C.A. Functional traits in agriculture: Agrobiodiversity and ecosystem services. Trends Ecol. Evol. 2015, 30, 531–539. [Google Scholar] [CrossRef] [PubMed]
- Campanelli, G.; Canali, S. Crop Production and environmental effects in conventional and organic vegetable farming systems: The case of a long-term experiment in Mediterranean conditions (Central Italy). J. Sustain. Agric. 2012, 36, 599–619. [Google Scholar] [CrossRef]
- Rahmann, G.; Reza Ardakani, M.; Bàrberi, P.; Boehm, H.; Canali, S.; Chander, M.; David, W.; Dengel, L.; Erisman, J.W.; Galvis-Martinez, A.C.; et al. Organic Agriculture 3.0 is innovation with research. Org. Agric. 2017, 7, 169–197. [Google Scholar] [CrossRef]
- Raviv, M. Sustainability of Organic Horticulture. In Horticultural Reviews, 36; Janick, J., Ed.; Wiley-Blackwell: Hoboken, NJ, USA, 2010; pp. 289–333. [Google Scholar]
- Tittarelli, F.; Ceglie, F.G.; Ciaccia, C.; Mimiola, G.; Amodio, M.L.; Colelli, G. Organic strawberry in Mediterranean greenhouse: Effect of different production systems on soil fertility and fruit quality. Renew. Agric. Food Syst. 2017, 32, 485–497. [Google Scholar] [CrossRef]
- Pearson, D.; Henryks, J.; Jones, H. Organic food: What we know (and do not know) about consumers. Renew. Agric. Food Syst. 2010, 26, 171–177. [Google Scholar] [CrossRef]
- Yiridoe, E.K.; Bonti-Ankomah, S.; Martin, R.C. Comparison of consumer perceptions and preference toward organic versus conventionally produced foods: A review and update of the literature. Renew. Agric. Food Syst. 2005, 20, 193–205. [Google Scholar] [CrossRef]
- EGTOP (Expert Group for Technical Advice on Organic Production). Final Report on Greenhouse Production (Protected Cropping). 2013. Available online: https://ec.europa.eu/info/sites/info/files/food-farming-fisheries/farming/documents/final-report-etop-greenhouse-production.pdf (accessed on July 10 2019).
- Niggli, U. Incorporating agroecology into organic research-an ongoing challenge. Sustain. Agric. Res. 2015, 4, 149–157. [Google Scholar] [CrossRef]
- Magagnoli, S.; Depalo, L.; Masetti, A.; Campanelli, G.; Canali, S.; Leteo, F.; Burgio, G. Influence of agroecological service crop termination and synthetic biodegradable film covering on Aphis gossypii Glover (Rhynchota: Aphididae) infestation and natural enemy dynamics. Renew. Agric. Food Syst. 2018, 33, 386–392. [Google Scholar] [CrossRef]
- Marliac, G.; Mazzia, C.; Pasquet, A.; Cornic, J.F.; Hedde, M.; Capowiez, Y. Management diversity within organic production influences epigeal spider communities in apple orchards. Agric. Ecosyst. Environ. 2016, 216, 73–81. [Google Scholar] [CrossRef]
- Hendrickx, F.; Maelfait, J.P.; Van Wingerden, W.; Schweiger, O.; Speelmans, M.; Aviron, S.; Augenstein, I.; Billeter, R.; Bailey, D.; Bukacek, R.; et al. How landscape structure, land-use intensity and habitat diversity affect components of total arthropod diversity in agricultural landscapes. J. Appl. Ecol. 2007, 44, 340–351. [Google Scholar] [CrossRef]
- Drinkwater, L.E. Cropping systems rsearch: Reconsidering agricultural experimental approaches. HortTechnology 2002, 12, 355–361. [Google Scholar] [CrossRef]
- Canali, S.; Campanelli, G.; Ciaccia, C.; Leteo, F.; Testani, E.; Montemurro, F. Conservation tillage strategy based on the roller crimper technology for weed control in Mediterranean vegetable organic cropping systems. Eur. J. Agron. 2013, 50, 11–18. [Google Scholar] [CrossRef]
- Canali, S.; Diacono, M.; Campanelli, G.; Montemurro, F. Organic no-till with roller crimpers: Agro-ecosystem services and applications in organic Mediterranean vegetable productions. Sustain. Agric. Res. 2015, 4, 70. [Google Scholar] [CrossRef]
- Snapp, S.S.; Swinton, S.M.; Labarta, R.; Mutch, D.; Black, J.R.; Leep, R.; Nyiraneza, J.; O’neil, K. Evaluating cover crops for benefits, costs and performance within cropping system niches. Agron. J. 2005, 97, 322–332. [Google Scholar]
- Nett, L.; Feller, C.; George, E.; Fink, M. Effect of winter catch crops on nitrogen surplus in intensive vegetable crop rotations. Nutr. Cycl. Agroecosyst. 2011, 91, 327–337. [Google Scholar] [CrossRef]
- Ceglie, F.G.; Amodio, M.L.; de Chiara, M.L.V.; Madzaric, S.; Mimiola, G.; Testani, E.; Tittarelli, F.; Colelli, G. Effect of organic agronomic techniques and packaging on the quality of lamb’s lettuce. J. Sci. Food Agric. 2018, 98, 4606–4615. [Google Scholar] [CrossRef] [PubMed]
- Wang, D.; Anderson, D.W. Direct measurement of organic carbon content in soils by the Leco CR-12 carbon analyzer. Commun. Soil Sci Plan. 1988, 29, 15–21. [Google Scholar] [CrossRef]
- Henriksen, A.; Selmer-Olsen, A.R. Automatic methods for determining nitrate and nitrite in water and soil extracts. Analyst 1970, 95, 514–518. [Google Scholar] [CrossRef]
- Krom, M.D. Spectrophotometric determination of ammonia: A study of a modified Berthelot reaction using salicylate and dichloroisocyanurate. Analyst 1980, 105, 305–316. [Google Scholar] [CrossRef]
- Olsen, S.R.; Sommers, L.E. Phosphorus. In Methods of Soil Analysis; Part 2. AL Page; X e Y Madison: Madison, WI, USA, 1982; pp. 403–430. [Google Scholar]
- Madzaric, S.; Ceglie, F.G.; Depalo, L.; Al Bitar, L.; Mimiola, G.; Tittarelli, F.; Burgio, G. Organic versus organic—Soil arthropods as bioindicators of ecological sustainability in greenhouse system experiment under Mediterranean conditions. Bull. Entomol. Res. 2018, 108, 625–635. [Google Scholar] [CrossRef] [PubMed]
- Reganold, J.P.; Wachter, J.M. Organic agriculture in the twenty-first century. Nat. Plants 2016, 2, 15221. [Google Scholar] [CrossRef]
- De Ponti, T.; Rijk, B.; van Ittersum, M. The crop yield gap between organic and conventional agriculture. Agric. Syst. 2012, 108, 1–9. [Google Scholar] [CrossRef]
- Mazzoncini, M.; Sapkota, T.B.; Bàrberi, P.; Antichi, D.; Risaliti, R. Long-term effect of tillage, nitrogen fertilisation and ASCs on soil organic carbon and total nitrogen content. Soil Tillage Res. 2011, 114, 165–174. [Google Scholar] [CrossRef]
- Garcia-Franco, N.; Albaladejo, J.; Almagro, M.; Martínez-Mena, M. Beneficial effects of reduced tillage and green manure on soil aggregation and stabilization of organic carbon in a Mediterranean agroecosystem. Soil Tillage Res. 2015, 153, 66–75. [Google Scholar] [CrossRef]
- Cole, L.; Buckland, S.M.; Bardgett, R.D. Influence of disturbance and nitrogen addition on plant and soil animal diversity in grassland. Soil Biol. Biochem. 2008, 40, 505–514. [Google Scholar] [CrossRef]
- Scheunemann, N.; Digel, C.; Scheu, S.; Butenschoen, O. Roots rather than shoot residues drive soil arthropod communities of arable fields. Oecologia 2015, 179, 1135–1145. [Google Scholar] [CrossRef]
- Coulibaly, F.M.; Coudrain, V.; Hedde, M.; Brunet, N.; Mary, B.; Recous, S.; Chauvat, M. Effect of different crop management practices on soil Collembola assemblages: A 4-year follow-up. Appl. Soil Ecol. 2017, 119, 354–366. [Google Scholar] [CrossRef]
- De Vries, F.T.; Thébault, E.; Liiri, M.; Birkhofer, K.; Tsiafouli, M.A.; BjØrnlund, L.; JØrgensen, H.B.; Brady, M.V.; Christensen, S.; de Ruiter, P.C.; et al. Soil food web properties explain ecosystem services across European land use systems. Proc. Natl. Acad. Sci. USA 2013, 110, 14296–14301. [Google Scholar] [CrossRef] [PubMed]
- Paoletti, M.G.; Favretto, M.R.; Stinner, B.R.; Purrington, F.F.; Bater, J.E. Invertebrates as bioindicators of soil use. Agric. Ecosyst. Environ. 1991, 34, 341–362. [Google Scholar] [CrossRef]
- Van Straalen, N.M. Evaluation of bioindicator systems derived from soil arthropod communities. Appl. Soil Ecol. 1998, 9, 429–437. [Google Scholar] [CrossRef]
- Sackett, T.E.; Classen, A.T.; Sanders, N.J. Linking soil food web structure to above- and belowground ecosystem processes: A meta-analysis. Oikos 2010, 119, 1984–1992. [Google Scholar] [CrossRef]
- Coleman, D.C.; Wall, D.H. Soil Fauna: Occurrence, Biodiversity, and Roles in Ecosystem Function. In Soil Microbiology, Ecology and Biochemistry; Academic Press: London, UK, 2015; pp. 111–149. [Google Scholar]
© 2019 by the authors. Licensee MDPI, Basel, Switzerland. This article is an open access article distributed under the terms and conditions of the Creative Commons Attribution (CC BY) license (http://creativecommons.org/licenses/by/4.0/).