Article

Arbuscular Mycorrhizal Fungi and Plant Growth Promoting Rhizobacteria Avoid Processing Tomato Leaf Damage during Chilling Stress

1
Dipartimento di Scienze della Vita, Università di Modena e Reggio Emilia, Via Amendola, n. 2, 42122 Reggio Emilia, Italy
2
Consiglio per la ricerca in agricoltura e l’analisi dell’economia agraria-Centro di ricerca Genomica e Bioinformatica (CREA-GB), Via San Protaso, 302, 29017 Fiorenzuola d′Arda, Italy
3
IRD, Cirad, Univ Montpellier, IPME, 911 Avenue Agropolis, 64501, 34394 Montpellier CEDEX 5, France
*
Author to whom correspondence should be addressed.
Present address: Consiglio per la ricerca in agricoltura e l’analisi dell’economia agraria-Centro di ricerca per la Zootecnia ed acquacoltura (CREA-ZA), Viale Piacenza, 29, 26900 Lodi, Italy.
Agronomy 2019, 9(6), 299; https://doi.org/10.3390/agronomy9060299
Submission received: 2 May 2019 / Revised: 1 June 2019 / Accepted: 9 June 2019 / Published: 10 June 2019
(This article belongs to the Section Horticultural and Floricultural Crops)

Abstract

:
Chilling stress limits processing tomato growth and yield, leading to high losses. An approach to increase the sustainability of crop production could involve the use of beneficial microorganisms. The objectives of this research were to investigate: (i) the efficacy of Funneliformis mosseae and Paraburkholderia graminis C4D1M in avoiding processing tomato damage during severe chilling stress; (ii) the synergic effect of the two microorganisms inoculated as a consortium; (iii) if the putative microorganism effects depended on the processing tomato genotype. To achieve these objectives, two experiments were carried out. In the first experiment, a modern genotype was assessed, while three genotypes were evaluated in the second experiment. At sowing, F. mosseae was mixed with peat. Nine days after sowing, P. graminis was inoculated close to the plant’s root collar. After 40 days of seed sowing, chilling treatment was performed at 1 °C for 24 h. F. mosseae mainly reduced the cell membrane injuries in term of electrolytic leakage and efficiency of photosystem II, after the chilling stress in both experiments. Conversely, in the second experiment, the consortium improved the seedling regrowth, increasing the efficiency of photosystem II. In addition, modern genotypes inoculated with microorganisms showed a better seedling regrowth.

Graphical Abstract

1. Introduction

Environmental stresses limit plant growth and yield, leading to high losses. In particular, chilling affects the development and productivity of crops originating from subtropical regions [1,2], such as tomato [3]. Tomato (Solanum lycopersicum L.) is an economically important horticultural crop [4,5], cultivated worldwide over ~4.7 million ha, and with a total production of ~177 million tons [6].
Tomato fruits are consumed fresh in salads and sandwiches or processed into products like whole peeled, diced products, juices, sauces and soups [7]. The genotypes suitable for processing tomato production are bred for adaptation to mechanical harvesting and canning purposes [8]. Most of the cultivated processing tomato genotypes are sensitive to low temperatures (0–12 °C) in all growth stages [9]. The negative effects of chilling are more remarkable during germination and at the seedling stage [10]. Chilling damages cellular membranes, generates Reactive Oxygen Species (ROS) and accumulates toxic compounds [11,12,13]. In addition, the chloroplasts are the primary visible sites of chilling injury [14] that causes a reduction of chlorophyll fluorescence and of photosynthetic activity [15].
Unlike the fresh tomato that may also be cultivated in heated greenhouses (preserving plant to chilling occurrences), processing tomato plants are cultivated only in open fields where chilling occurrences cannot be avoided. In Mediterranean environments, such as Italy and Spain, the growing season starts in March–April, when the probability of chilling events is still high [16]. A typical management practice applied by farmers is to transplant in the field processing tomato seedlings produced in nursery. Besides the possibility of chill spells in early spring, an increase of temperature and more frequent drought events have been reported in climatic models for the 21st century, especially in Southern European countries [17]. Warmer temperatures can accelerate tomato phenology, resulting in lower total biomass accumulation with a negative impact on yield [18]. It is therefore expected that the practice of early transplant will become increasingly widespread.
The use of beneficial microorganisms could be a sustainable way that allows a reduction of external inputs and improve tolerance to biotic and abiotic stresses [19]. In fact, microorganisms, such as arbuscular mycorrhizal fungi (AMF) or/and plant growth promoting rhizobacteria (PGPR), can increase plant tolerance to abiotic stresses like drought, salinity, metal toxicity and high temperature on many crops like wheat (Triticum aestivum L.), sunflower (Helianthus annuus L.), pea (Pisum sativum L.), barley (Hordeum vulgare L), rice (Oryza sativa L.), tomato (Solanum lycopersicum L.) grapevine (Vitis vinifera L.), lettuce (Lactuca sativa L.) and corn (Zea mays L.) [20,21,22,23]. AMF belong to phylum Glomeromycota and are the most widespread fungal symbionts of plants [24,25], including many agricultural crops [26]. AMF provide several benefits to host plants, like enhanced water and nutrient uptake, increased tolerance to soil-borne pathogens and environmental stresses, reduced sensitivity to heavy metals and positive contribution to soil structure [27,28,29,30,31,32,33]. These benefits could be ascribed to the influence of AMF on plant physiology and, in particular, on plastid biosynthetic pathways, Krebs cycle and secondary metabolism [32].
PGPR include a wide range of microorganisms which positively influence growth, yield and stress tolerance of plants through several direct and indirect mechanisms of actions colonizing both the rhizosphere and the endo-rhizosphere [34,35,36,37]. PGPR can induce physical and chemical changes in the plants by producing enzymes, osmolytes, siderophores and organic acids or/and by triggering the plants to produce hormones [21,36,37,38]. Ait Barka et al. [39] reported an increase of phenolic compounds and starch in leaves and shoots of grapevine cv. Chardonnay after treatment with the endophytic bacterium Paraburkholderia phytofirmans. In addition, when explants of grapevine were exposed to 4 °C for 2 weeks, an increase of the content of proline was recorded compared to the un-inoculated control. Interestingly, some PGPR, such as Agrobacterium spp., Azospirillum spp., Azotobacter spp. and (Para)Burkholderia spp., can promote mycorrhiza colonization (in this case, the PGPR are named mycorrhiza helper bacteria–MHB) [40].
Although some evidence of the positive influence of AMF and PGPR under sub-optimal temperatures has been reported [39,41,42] on tomato and cucumber (Cucumis sativus L.), a precise characterization of the physiological responses in terms of photochemical efficiency of photosystem II (PSII), integrity of cell membranes, recovery and regrowth capacity of inoculated tomato plants exposed to severe chilling (1 °C for 24 h) is missing. In fact, these parameters are very important because, as previously reported, the earliest visible damage caused by chilling stress is the impairment of the integrity of cell membranes and of photosystem activity. In addition, a study on four tomato recombinant inbred lines inoculated with AFM and PGPR showed that, during doughty stress, the microbial inoculant effects were depending on the recombinant inbred line considered [23].
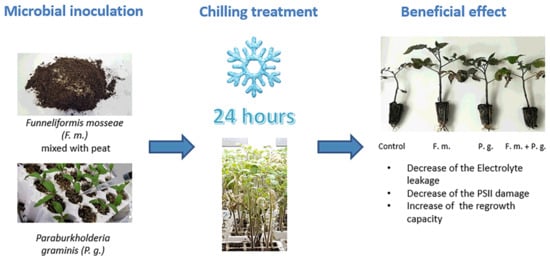
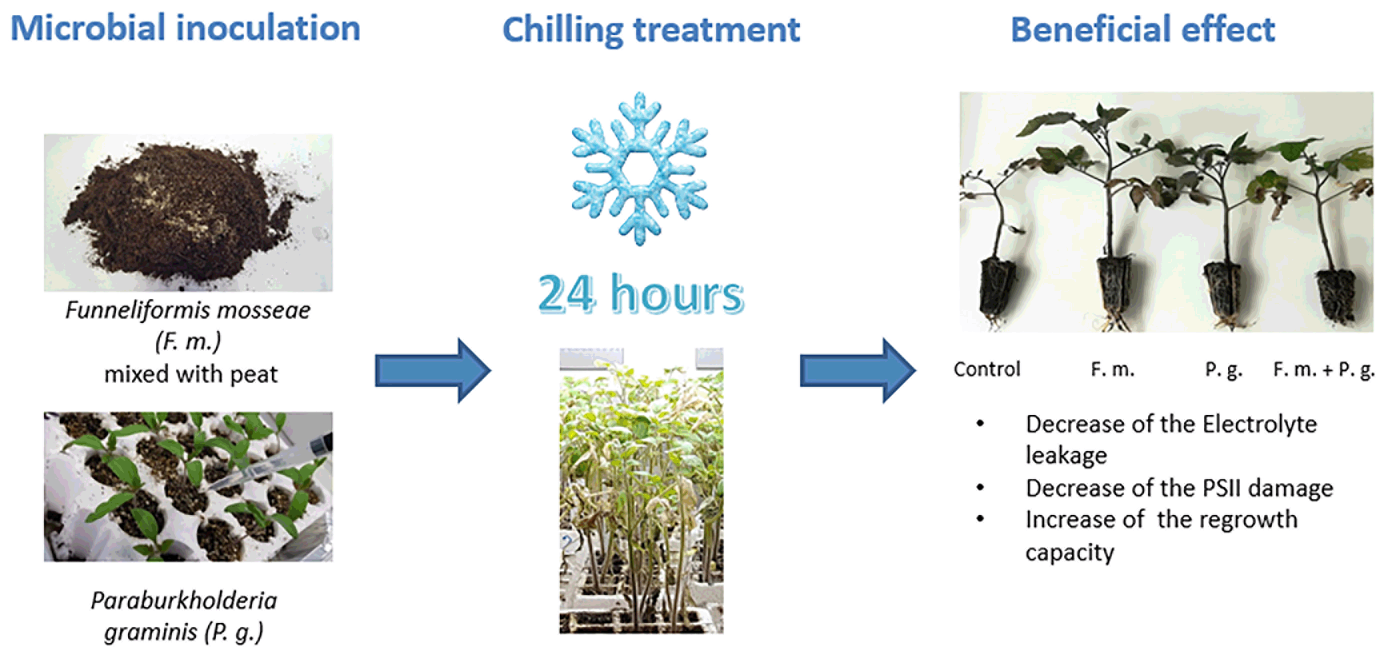
Hence, the objectives of this research were to investigate: (i) the efficacy of F. mosseae and P. graminis C4D1M in avoiding injuries to cell membranes and reduction of PSII efficiency after severe stress (1 °C for 24 h); (ii) the synergic effect of the two microorganisms inoculated as a consortium; (iii) if the putative microorganism effects depended on the processing tomato genotype.

2. Materials and Methods

2.1. Plant Materials, Growing and Stress Conditions

In the present study, two experiments were carried out; in the first preliminary experiment the genotype ‘Everton’ was used, while the second experiment was performed by comparing three genotypes released in different years: an old and well-known genotype ‘Pearson’; the most commonly transplanted in the Northern Italy ‘H3402′; and the more recent cultivar ‘Everton’. The main features of the three cultivars are summarized here: ‘Pearson’ was released in the mid−1930s by the University of California-DAVIS. This cultivar is bushy, self-topping, semi-determinate, has dense foliage, develops globular and large fruits, and is suitable for canning [16]. ‘H3402′ was released in 2002 by HEINZ; it is determinate, rustic with good vigor, bushy, has a good yield, provides a medium oval fruit, and is suitable for canning [16]. ‘Everton’ was released in 2008 by ISI-Sementi, it is an all-flesh genotype, rustic with medium vigor, high yielding, and suitable for dicing production (also frozen). The seeds were kindly provided by Dr. M. Beretta, ISI Sementi Company, Fidenza, Italy. Growth chamber experiments were conducted following a fully randomized experimental design. Each treatment consisted of nine plants with three replications. The seeds were germinated on moistened filter paper in a Petri dish at 25 °C for 3 days. Then the germinated seeds were transferred in the alveolar fixed seed trays (20 mm diameter holes, height of 60 mm in the first experiment; 30 mm diameter holes, height of 60 mm in the second experiment) filled with neutral peat composed of 23% organic carbon, 0.5% nitrogen (N) and dry apparent density 214 kg m−3 (Dueemme S.r.l., Reggio Emilia). Before transferring the germinated seeds in alveolar fixed seed trays, F. mosseae was mixed with peat 10% (v/v) (1 g of inoculum contained 10 propagules) as suggested by Rivero et al. [43]. The arbuscular mycorrhizal fungus inoculum was obtained from MycAgro, LabTechnopôle Agro Environnement, Bretenière, France.
Nine days after sowing, when cotyledons were completely unfolded [44], 1 mL of bacterial inoculum (107 CFU mL−1 of P. graminis C4D1M; determined according to a preliminary test, was added close to the plant’s root collar. A single colony of bacterium was cultivated in a 250 mL Erlenmeyer flask containing 60 mL of Tryptone Soya Yeast extract broth. The flask was incubated at 28 °C at 150 rpm for 24 h. Then the suspension was centrifuged for 4 min at 8000× g, the pelleted was washed and suspended in sterilized distilled water. The bacterial concentration was estimated by Jasco V-550 UV-VIS spectrophotometer (600 nm) and adjusted by sterilized distilled water until reaching 107 CFU mL−1. All treatments are summarized in Table 1.
The seedlings were kept in a growth chamber (Binder KBW 720, Tuttlingen, Germany) with a photoperiod of 16 h light and 8 h dark for 40 days under an irradiance of 180 µmol m−2 s−1 (white fluorescent tubes Fluora 18W/77, Osram, Munich, Germany), day/night temperatures of 25/19 °C [16]. After 40 days, when the seedlings reached the four-leaf stage, chilling treatment was performed at 1 °C for 24 h, as reported by Caffagni et al. [45] and Ronga et al. [16]. The temperature was gradually decreased by 2 °C h−1 until it reached 1 °C. In addition, during the day the irradiance was decreased from 180 m−2 s−1 to 60 µmol m−2 s−1. At the end of the stress period, the temperature was gradually raised by 2 °C h−1 until it reached 19 °C. After chilling treatment, seedlings were grown for two weeks in control conditions (25/19 °C day/night, 16 h photoperiod). The investigated parameters were recorded at the following four timings: (0) before the chilling stress, (24 h) at the end of chilling stress, (48 h) 24 h after stress (recovery), and (15 days) 15 days after stress (regrowth).

2.2. Morpho-Physiological and Agronomic Parameters

Before chilling stress, some morphological and agronomic parameters (height of plant, number of leaves, leaf area, leaf mass area, stem diameter, leaves, stems, roots, and total dry weights) were recorded. The leaves of five seedlings were weighed and leaf area measured (using area meter LI-3000A, LI-COR, Lincoln, NE, USA). In addition, specific leaf mass (SLM), a key parameter in plant growth and an important indicator of ecological strategies, was calculated as the ratio between leaf dry weight and leaf area. The different organs of the plant (leaves, stems and roots) were weighted and oven-dried at 65 °C until constant weight was reached to obtain the dry weight of single organs and the total dry weight.
The physiological parameters were recorded: before the chilling stress, immediately and one day after the end of the chilling stress, and at regrowth (15 days after the end of the stress). The leaf content of chlorophyll (CHL), flavonoids (FLAV, sum of adaxial and abaxial side of the leaf), and anthocyanins (ANTH) were estimated on the youngest fully expanded leaf using Dualex 4 Scientific (FORCE-A, Orsay, France) as suggested by Cerovic et al. [46]. Dualex 4 is a leaf-clip-type sensor that assesses, in a non-destructive way, physiological status of plants by transmittance and fluorescence measurements [46]. In addition, N balance index (NBI) was calculated as the ratio between CHL and FLAV [47].
The electrolyte leakage method was used to assess the size of cell membrane damage at the end of chilling stress following the protocol reported by Caffagni et al. [45] and Ronga et al. [16]. Briefly, two leaf disks of 0.5 cm diameter were put in a tube containing 25 mL of deionized water and stirred at 25 °C for 180 min. Electrolyte leakage (EL (%)) was expressed as (C.a − C.w)/(C.b − C.w) × 100 [48], where Ca and Cb were the electrical conductivities of the samples (a) at the end of chilling stress and (b) after autoclaving, while Cw was the conductivity of the deionized water. The electrical conductivities were measured by conductivity meter GLP 31 (Crison instruments, Barcelona, Spain). In addition, the degree of injury of cell membranes was evaluated by the Fv/Fm ratio (maximal efficiency of PSII) at four timings: before the chilling stress (Fv/Fm0), at the end of chilling stress (Fv/Fm 24 h), after 24 h (Fv/Fm 48 h), and after 15 days (Fv/Fm 15 days). The photochemical efficiency of photosystem II was indirectly assessed by chlorophyll a fluorescence using a pulse amplitude-modulated fluorometer (PAM 2000, Walz, Effeltrich, Germany) connected to a Leaf Clip Holder (2030-B, Walz, Effeltrich, Germany).
Visual score evaluation (VS 15 days) was used to evaluate the plant regrowth 15 days after chilling stress. A five-point scale (5 = fully regrown, 4 = slightly yellowed leaf tips, 3 = half yellowed leaves 2 = half yellowed and half wrinkled leaves and no regrowth, 1 = fully wrinkled leaves and no regrowth, 0 = dead plant) was used [16].

2.3. Molecular Analysis

The AMF root colonization was evaluated with a real-time PCR approach. Subsamples of the tomato roots (three replicates/treatment) were finely ground in liquid N with a mortar and pestle. The grinded material (300 mg) was mixed with 500 μL of extraction buffer (40 mM Tris-acetate, 20 mM sodium acetate, 1 mM EDTA, 1% w/v SDS pH 7.8) and 5 μL RNase (500 μg μL−1). After incubation at 37 °C for 600 s to digest contaminating RNA, 150 μL of NaCl was added. The suspension was centrifuged at 12,000× g for 1200 s at 4 °C and the supernatant mixed with 400 μL of chloroform and 400 μL of phenol, then centrifuged at 12,000× g for 1200 s. at 4 °C. The upper phase containing DNA was precipitated with 2 volumes of ethanol 95% (v/v). DNA was eluted with 50 μL elution buffer (10 mM Tris-HCl, 1mM EDTA, pH 7.8). The DNA concentration and quality were determined with a spectrophotometer at 260 and 280 nm (NanoDrop 1000, Thermo Fisher Scientific, Wilmington, DE, USA).
For real-time PCR the following primer pairs were used, according to Alkan et al. [49]: MOSF 5′-GAAGTCAGTCATACCAACGGGAA-3′, MOSR 5′-CTCGCGAATCCGAAGGC-3′. The amplification was carried out in 25 μL volume containing 12.5 μL of KAPA Sybr Fast qPCR kit (KAPA Biosystems, Wilmington, DE, USA), 0.3 μL of MOSF/MOSR primers (10 μm), 5 μL of template DNA (10 ng μL−1) and 6.9 μL of water. Reactions were repeated twice with a 7300 real-time PCR Systems (Applied Biosystems, Foster City, CA, USA) and with the following cycling protocol: 95 °C for 180 s and 40 cycles of 95 °C for 3 s and 60 °C for 30 s. A melting curve analysis (95 °C for 15 s, 60 °C for 30 s, 95 °C for 15 s) was always included in each run to control for false-positive results caused by primer-dimer hybridization and non-specific amplifications. The presence of F. mosseae DNA in the root samples was estimated based on the comparison of Cycle threshold (Ct) that was automatically calculated by 7300 system software.

2.4. Statistical Analysis

In order to evaluate the effects of treatment or genotype, one-way analysis of variance was performed, while to evaluate treatment × genotype interaction, data were subjected to two-way ANOVA. Means were compared using Duncan’s test at the 5% level. In addition, all recorded data during the experiment were analyzed by the Principal Component Analysis (PCA) model [50,51] to evaluate the relationships between the analyzed objects and the original variables, and a biplot graph was used. All analyses were performed by using GenStat 17th software.

3. Results

3.1. Physiological, Morphological and Agronomic Parameters Evaluated before Chilling Stress

Measurements of morpho-physiological and agronomic parameters, such as the ratio between height and diameter, dry weights, and leaf content of chlorophyll, flavonoid and anthocyanin, represent a relevant indicator of the plant status already before stress exposure [52,53,54]. Accordingly, in order to evaluate plant status, some physiological and morphological parameters were assessed before chilling stress exposure (Table 2A,B).
Considering the physiological parameters, the seedlings treated with B showed always the highest values of chlorophyll leaf content (CHL0), +33% and +14%, in the first and second experiments, respectively, in comparison with the non-inoculated control (Table 2A,B). In the second experiment, the genotype ‘Pearson’ showed the highest leaf content of chlorophyll while ‘Everton’ showed the lowest leaf content of flavonoids and anthocyanins and the highest NBI value (Table 2B). Regarding the morphological and agronomic parameters, in the second experiment, the seedling, generally, showed a higher development (D0, LN0, LDW0, SDW0, RDW0 and TDW0) in comparison with the seedling of the first experiment. In both experiments, the non-inoculated control showed the highest diameter and G + B showed the highest H/D0 ratio (+20.3% and +33.8%, in the first and in the second experiments, respectively, in comparison with the non-inoculated control). In the first experiment the inoculated seedlings showed the highest fraction of total dry weight to roots (G + 47.8%; B + 26.1% and G + B +68.2% in comparison with the non-inoculated treatment) (Table 2A). On the other hand, the inoculated seedlings showed the highest total dry weight (G + 42.9%, B + 19.0% and G + B + 28.6% in comparison with the non-inoculated treatment) in the second experiment.
‘Pearson’ ranked first for many parameters (H0, D0, LN0, LA0, LDW0, SDW0, RDW0 and TDW0); while the modern genotype ‘Everton’ and ‘H3402′ showed similar morphological characteristics for LA0, LDW0, SDW0, RDW0 and TDW0 (Table 2B).
No interaction was observed between treatments and genotypes apart for H0 and FLV0. Regarding H0, ‘H3402′ inoculated with B showed the lowest values, while ‘Pearson’ inoculated with G + B the highest ones. For FLV0 ‘Everton’ non-inoculated and ‘H3402′ inoculated with G + B showed the lowest values, while ‘H3402′ inoculated with B showed the highest ones.
In order to verify the photochemical efficiency of PSII before chilling exposure, Fv/Fm values were measured. All the seedling showed Fv/Fm values higher than 0.600 and in the second experiment G, B and G + B highlighted higher values than the non-inoculated treatment.

3.2. Effects of AMF and PGPR Inoculations on Leaf Damage and Performance after Chilling Stress

In order to verify whether AMF and PGPR inoculations help processing tomato seedlings to overcome chilling stress, the size of cell membrane damage and the photochemical efficiency of PSII were assessed (Table 3A,B) at the end of chilling stress and after 24 h.
At the end of chilling stress, all the treatments with microorganisms reduced the EL% 24 h values and the treatment G displayed lower values of EL% 24 h in comparison with the non-inoculated seedlings (−49.21% and −65.26% in experiment 1 and 2, respectively). In addition, in the second experiment, all the treatments with microorganisms reported higher Fv/Fm 24 h ratios.
In both experiments, all the treatments with microorganisms increased the Fv/Fm 48 h ratio and the seedlings inoculated with G showed the highest values (+351.0% and +47.0%, in the first and in the second experiment, respectively, in comparison with the non-inoculated seedlings) 24 h after chilling treatment. Considering the genotype effect, ‘Everton’ and ‘Person’ recorded the higher values compared to ‘H3402′.

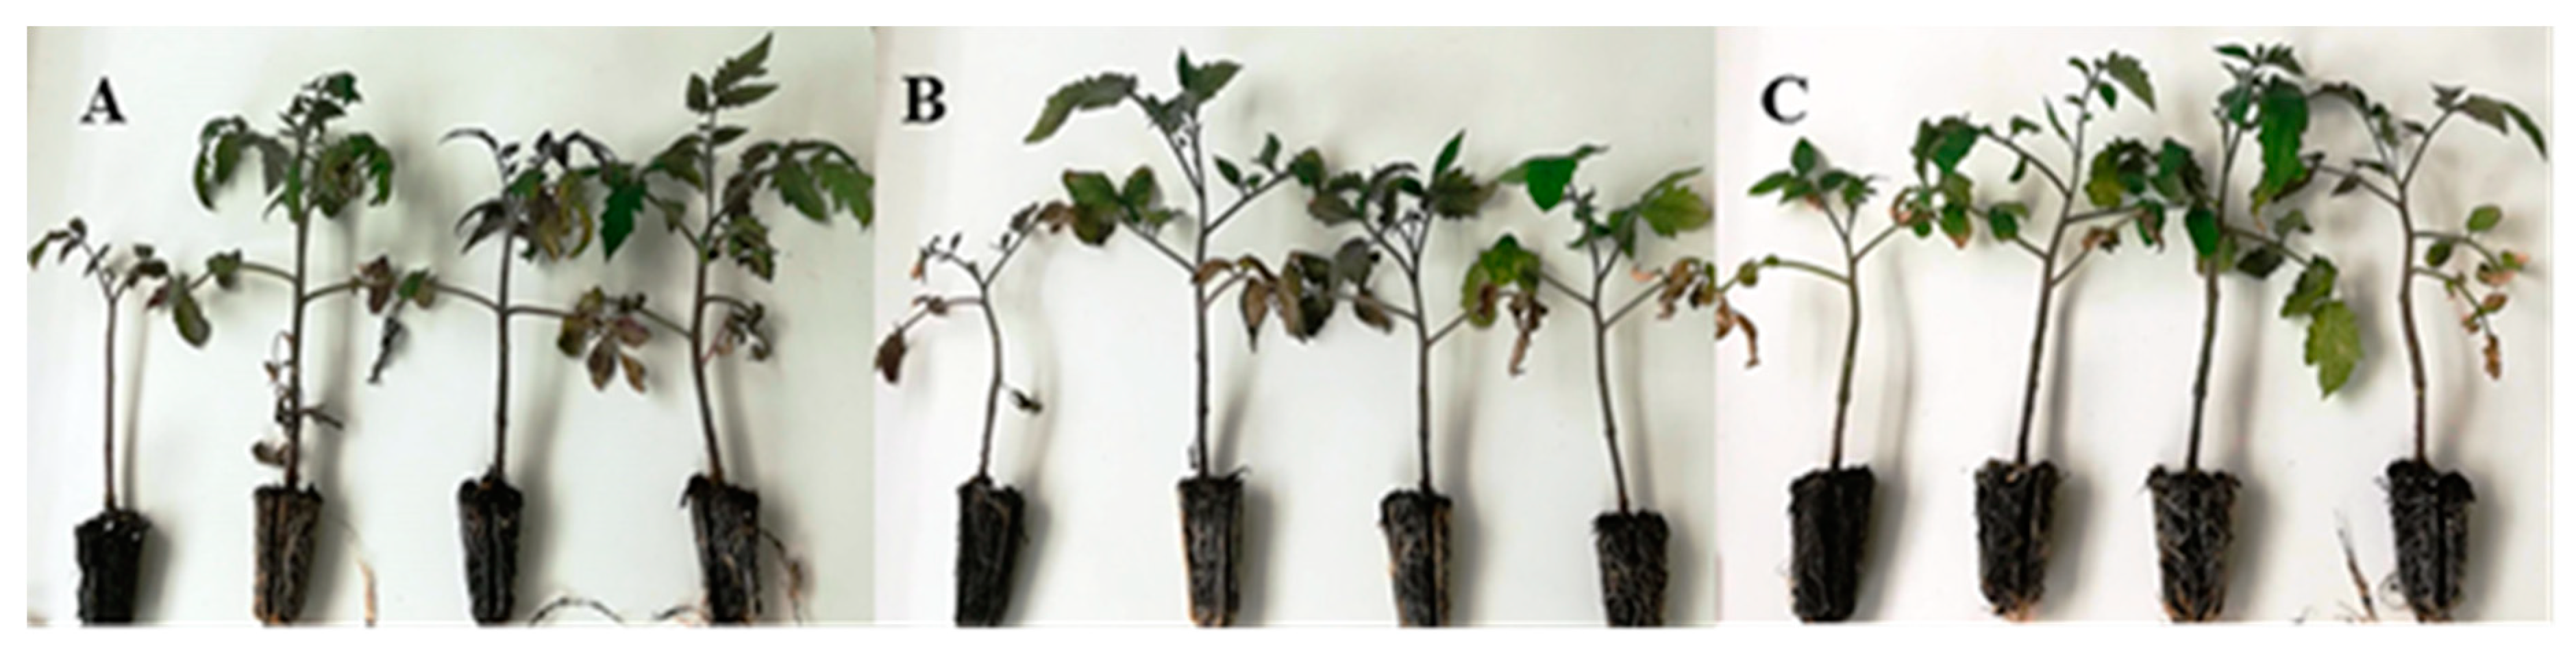
3.3. Effects of AMF and PGPR Inoculation after Regrowth

In order to evaluate the effects of microorganism inoculations on regrowth capacity, some parameters were also evaluated 15 days after the end of the stress (Table 4A,B).
In both experiments, the treatment containing microorganisms increased the Fv/Fm 15 days ratio in comparison with the non-inoculated control. In the second experiment the highest Fv/Fm 15 days ratio was showed by G + B (+44.4%, in comparison with the non-inoculated seedlings). When the interaction between genotype and treatment was considered, the best Fv/Fm 15 days ratios were shown by ‘Everton’ inoculated with G and ‘H3402′ inoculated with G + B. For chlorophyll assessment, in the second experiment, all the treatments with microorganisms increased the values of CHL 15 days. In general, after chilling stress, in both experiments the FLAV 15 days values increased and NBI 15 days values decreased in comparison with the values measured before chilling stress (FLAV0 and NBI0). In the second experiment, treatment G showed the highest values of FLAV 15 days, while G + B recorded the lowest value of ANTH 15 days. At the end of the regrowth period, the long-term effect of treatments was evaluated also by VS 15 days (Figure 1). In the first experiment, the seedlings inoculated with G and B showed the best regrowth capacity recording both a value of VS 15 days of 4.0. In addition, treatment G also confirmed the best regrowth capacity in the second experiment (VS 15 days = 4.4). Regarding the genotype effect, in the second experiment, ‘H3402′ showed the highest VS 15 days while ‘Pearson’ was the most damaged.

3.4. AMF Root Colonization in Tomato Seedling after Chilling Stress

Based on real-time analysis the presence of F. mosseae DNA was confirmed in the processing tomato roots inoculated with F. mosseae and with F. mosseae + P. graminis (Figure 2). In contrast, all non-inoculated roots (controls) and the P. graminis inoculated roots were negative for F. mosseae DNA presence (flat lines). Significant differences were found for AMF colonization among treatments, but not among genotypes (p = 0.586).

3.5. Relationships between Treatments and Evaluated Parameters

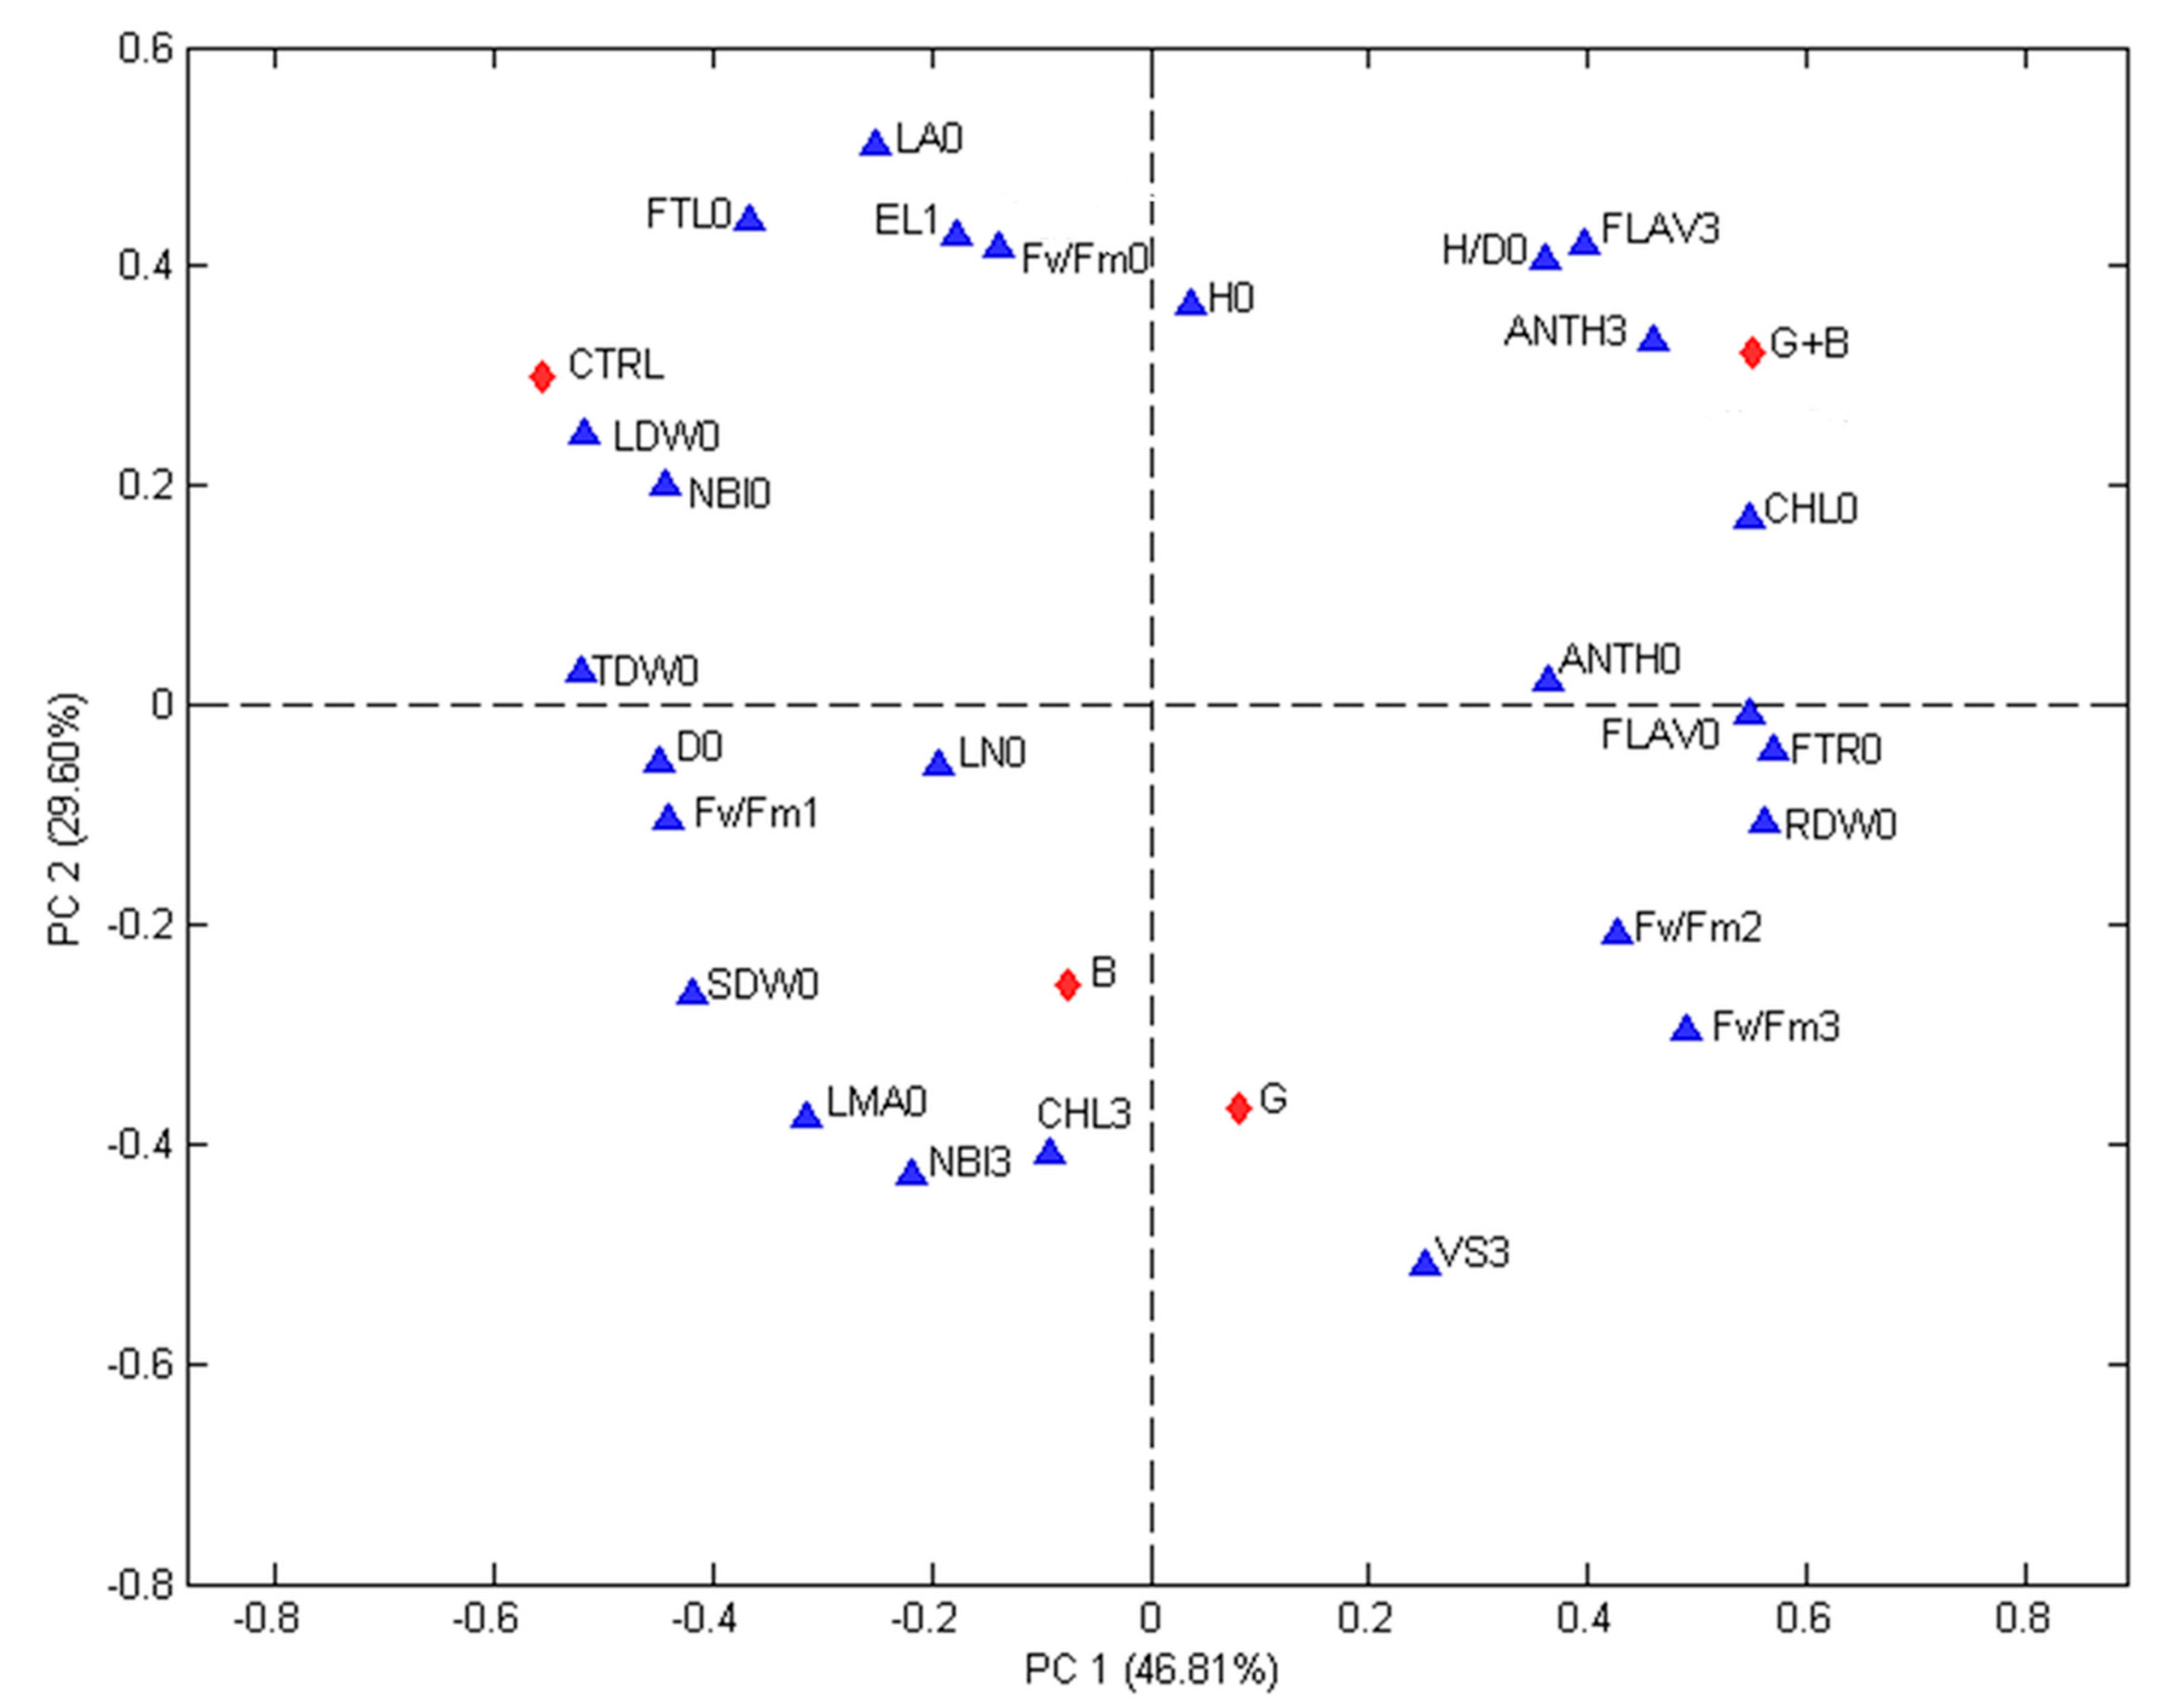
The correlations among treatments and evaluated parameters were studied using PCA. 
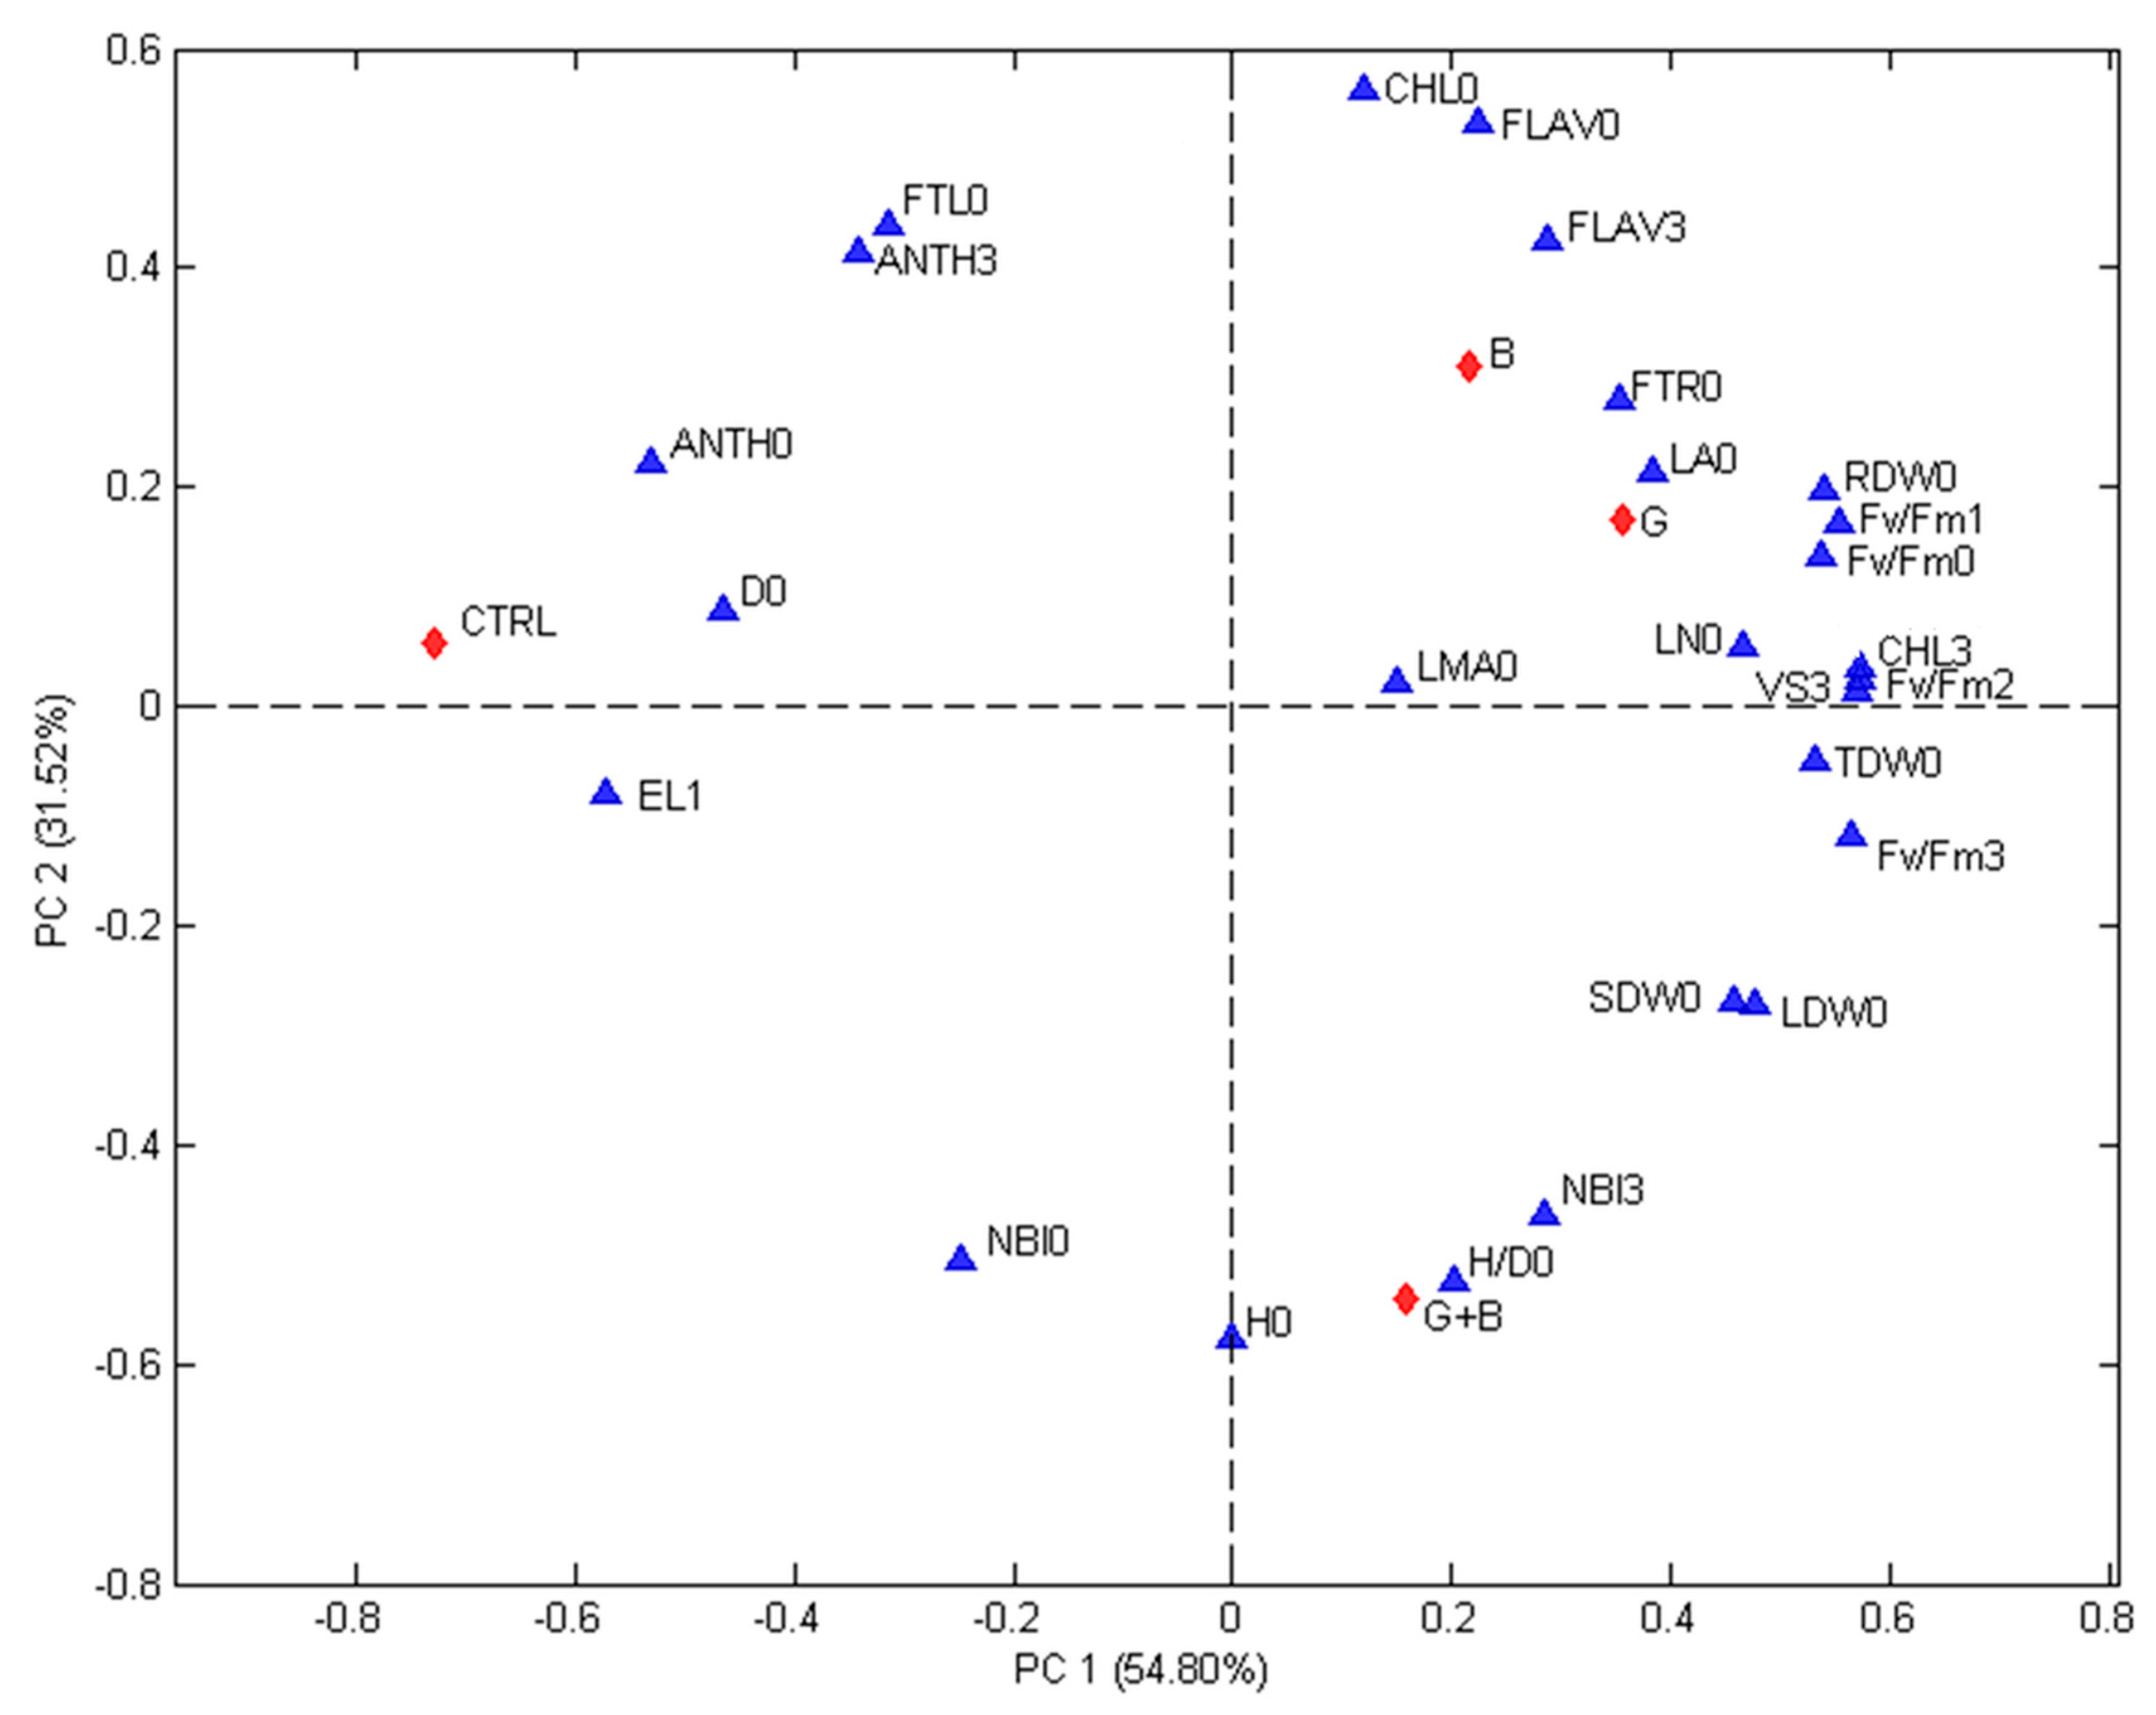
Figure 3 (first experiment) and Figure 4 (second experiment) show the biplots of the PCA models calculated for each experiment. The contributions of the two first principal components are 46.81% (PC1) and 29.60% (PC2) for the first experiment and 54.80% (PC1) and 31.52% (PC2) for the second one. In both Figures, differences among treatments and recorded parameters are visible and the first principal component gives an indication on the effect of treatments. The non-inoculated seedlings were always found on the top left quadrant while genotype inoculated with G and G + B were always found on the positive side. In both experiments, the seedlings inoculated with G were associated with VS15 days, Fv/Fm 48 h and Fv/Fm 15 days, while seedlings inoculated with G + B were linked to H/D0 ratio. In both experiments D0, NBI0, EL24 h, and FTL0 were associated with the control (non-inoculated seedlings).
The studied parameters (blue triangles) are: H/D = height to diameter ratio, CHL = index of the chlorophyll content in a leaf measured using a DUALX instrument, FLAV = index of the flavonoids content in leaf measured using a DUALX instrument, ANTH = index of the anthocyanins content in leaf measured using a DUALX instrument, NBI = nitrogen balance index, LN (no.) = number of leaves per seedling, LA = leaf area, LDW = leaf dry weight, SDW = stem dry weight, RDW = root dry weight, TDW = total dry weight, FTL = fraction of total dry weight to leaves, FTR = fraction of total dray weight to roots, LMA = leaf mass area, Fv/Fm = photochemical efficiency of photosystem II (PSII), EL = electrolyte leakage, VS 3 = VS 15 days = visual score recorded, 0 = measured or recorded before stress, 1 = measured or recorded immediately after the stress, 2 = measured or recorded 24 h after the end of the stress, 3 = measured or recorded at regrowth (15 days after stress). The studied treatments (red diamonds) are: CTRL = seedlings without microorganism treatment, G = seedlings inoculated with Funneliformis mosseae, B = seedlings inoculated with Paraburkholderia graminis, and G + B = seedlings inoculated with Funneliformis mosseae + Paraburkholderia graminis.
The studied parameter (blue triangles) are: H/D = height to diameter ratio, CHL = index of the chlorophyll content in leaf measured using a DUALX instrument, FLAV = index of the flavonoid content in leaf measured using a DUALX instrument, ANTH = index of the anthocyanin content in leaf measured using a DUALX instrument, NBI = nitrogen balance index, LN (no.) = number of leaves per seedling, LA = leaf area, LDW = leaf dry weight, SDW = stem dry weight, RDW = root dry weight, TDW = total dry weight, FTL = fraction of total dry weight to leaves, FTR = fraction of total dray weight to roots, LMA = leaf mass area, Fv/Fm = photochemical efficiency of photosystem II (PSII), EL = electrolyte leakage, VS 3 = VS 15 days = the visual score recorded, 0 = measured or recorded before stress, 1 = measured or recorded immediately after the stress, 2 = measured or recorded 24 h after the end of the stress, 3 = measured or recorded at regrowth (15 days after stress). The studied treatments (red diamonds) are: CTRL = seedlings without microorganism treatment, G = seedlings inoculated with Funneliformis mosseae, B = seedlings inoculated with Paraburkholderia graminis, and G + B = seedlings inoculated with Funneliformis mosseae + Paraburkholderia graminis.

4. Discussion

Processing tomato is a globally important horticultural crop [55]. It is generally grown in high-input conventional systems [56] and typically transplanted during spring, a period in which chill spells could still occur in Mediterranean environments. Hence, to improve agricultural sustainability, innovative strategies are required that can improve processing tomato tolerance to environmental stresses, avoiding high yield losses [57]. The wide variety of beneficial microorganisms present in the rhizosphere could be used to help crops to overcome abiotic stresses that reduce external inputs, thereby facilitating sustainable agricultural production [58]. In the present work, the physiological responses (efficacy of PSII, cell membrane injuries in term of EL%), recovery and regrowth capacity of processing tomato genotypes inoculated with F. mosseae, P. graminis and their consortium under severe chilling stress (1 °C for 24 h) were evaluated. Before chilling stress, physiological, morphological and agronomic parameters were measured to evaluate the effect of the treatments and the genotypes in the absences of stress. Leaf chlorophyll content value (CHL) is considered to be a good indicator of the status of plants, because it is the key pigment involved in photosynthesis [53]. In the present study, the seedlings inoculated with P. graminis showed an increase of leaf chlorophyll content (CHL0) (Table 2A,B). These results could be due to different reasons. Some studies reported capability of bacteria of the genus Paraburkholderia to fix nitrogen asymbiotically [59,60]. In addition, a recent study [61] showed that Paraburkholderia graminis can produce gramibactin, a siderophore that can bind iron and an essential element for chlorophyll production. Among the three genotypes, the values of leaf chlorophyll content were higher in genotype ‘Pearson’ (Table 2B), confirming the results showed by Ronga et al. [16].
The height to diameter ratio of seedlings is an important parameter to assess the seedling quality in nursery production [52,54]. In the present study, the treatment containing the consortium (G + B) increased the height/diameter ratio of seedlings (Table 2A,B) conferring more vigor to seedlings. Seedlings grown in nursery are often sown in alveolar fixed seed trays with very small holes, allowing the growth of higher number of plants per unit area. However, the container size can affect the development of seedlings [62,63]. In fact, in the second experiment, where the alveolar fixed seed trays with bigger holes were used, the seedlings had higher development (D0, LN0, LDW0, SDW0, RDW0 and TDW0). These results are consistent with findings previously reported by NeSmith and Duval [63]. In addition, in the second experiment, the total dry weight values, recorded before chilling stress, confirming the previous results showed by reference [42] under optimal growth temperature condition. In contrast, in the first experiment, there were not differences among treatments, therefore, it possible to presume an interaction between treatments and the higher amount of soil available to seedlings in the second experiments. However, this theory should be validated by further experiments.
Low temperature stress is known to reduce the development of the plant due to leaf tissue damage. In particular, injury of the membranes, with an increase in permeability, is the main effect caused by chilling stress [1,62,63]. Electrolyte leakage (EL) is a useful parameter to measure cell membrane damage [58,64]; however, this parameter is influenced by plant and leaf age as well as leaf position on the plant [64,65,66,67]. Hence, in both experiments the measurements were conducted at the same seedling age (40 days after sowing) using the upper fully expanded leaves. In the present study, the obtained data proved the protective activity of studied microorganisms towards cell membranes. However, only in the first experiments, significant differences among the treatments containing microorganisms were found. This could be ascribed to the different agronomic performance of the seedlings. In fact, seedlings with higher development are more tolerant to environmental stresses [52]. Therefore, it is possible to hypothesize that the higher tolerance of seedlings could have attenuated or hidden the different effects of the treatments at recovery. In addition, this hypothesis was supported by lesser EL values shown by the non-inoculated control in the second experiment in comparison with the first one.
The chloroplast is the primary site of a chilling injury [68]. Chilling stress affected the photosystem putatively, leading to a photoinhibition of photosynthesis due to photoinactivation of catalase and a decline of variable fluorescence [69]. Photosynthetic efficiency is a good marker to assess the effects of treatments and genotypes, after chilling stress. Fv/Fm parameter gives an idea of the PSII efficiency and, consequently, the damage of photosynthetic apparatus due to chilling stress [70] and the ability for recovery and regrowth of the seedlings to occur. Before chilling stress, all seedlings showed Fv/Fm0 ratios ranging from 0.73 to 0.83 (Table 2A,B), which are the typical values (Fv/Fm ratio) of many higher plants [69]. Instead, immediately after the chilling stress, the values of the Fv/Fm ratio were lower than the 0.73–0.83 range [71] (Table 2B and Table 3B). These data confirmed the results previously displayed by Caffagni et al. [45] and Ronga et al. [16]). In addition, in the first experiment differences between control and treatments were not observed. By contrast, in the second experiment, the seedlings inoculated with microorganisms showed higher values of Fv/Fm 24 h in comparison with the control seedling. It is possible to suppose that there was an interaction between treatments and higher amount of soil available for seedlings in the second experiments. However, this theory should be validated by further experiments. On the other hand, when the PSII efficiency was evaluated 24 h after the end of chilling stress (Fv/Fm 48 h), independent of genotype, F. mosseae was the treatment that mainly preserved the PSII to chilling stress. The differences in protecting the PSII highlighted by the different treatments containing microorganisms could be due to different microhabitats of the two microorganisms (F. mosseae vs. P. graminis). In fact, F. mosseae is an endophyte [24] while P. graminis lives in the rhizosphere [72]. Therefore, the seedling tissues could have protected F. mosseae from chilling stress [23] and could have influenced his efficacy. In addition, a study performed by Liu et al. [42] reported that F. mosseae increased content of redox compounds in the tomato roots under optimal temperature. Therefore, the presence of redox compounds before the chilling stress could also make seedlings more reactive to overcome the chilling stress.
A good regrowth capacity after stress is an important and desirable ability of crops, as it allows plants to develop, in short time, new leaves and shoots that are very important for recovering photosynthetic activity and carbon fixation. All the treatments containing microorganisms showed a high efficiency of PSII 15 days after the chilling treatment. However, when the seedling had higher development (in the second experiment), the seedlings inoculated with the consortium (G + B) showed the best efficiency of PSII and a less content of secondary metabolites in the leaf (FLAV3 and ANTH3). When the genotype was considered, the same results were achieved by using the most modern genotype “Everton”. VS 15 days is another method used to assess the ability of regrowth of the seedlings. Our results revealed that the best performances were obtained when the seedlings were inoculated with F. mosseae or the genotype “H3402” was used. The opposed results between Fv/Fm 15 days and VS 15 days could be due to different aspects that they consider: while the Fv/Fm ratio only considers the efficacy of PSII, the VS 15 days considers the regrowth capacity of the whole plant in general (i.e., appearance of new leaves).
Knowledge of the interaction between genotype and treatment could help farmers in choosing the best microorganism to help plants to overcome environmental stress. Some studies on rice and tomato revealed that different genotypes of rice and tomato responded differently to different microorganism inoculations [73,74]. Also in our study, the three processing tomato genotypes showed different responses to the different treatments containing microorganisms. Interestingly, the more recent genotypes “Everton” achieved a higher Fv/Fm 15 days result when inoculated with F. mosseae, while “H3402” achieved the higher Fv/Fm 15 days result when inoculated with the consortium. When we considered the interaction between F. mosseae and P. graminis, no differences were observed on the AFM colonization. These results agree with some studies [75,76,77], in which bacteria treatments did not influence the AFM root colonization.
Also, the analysis of biplots confirmed the ability of microorganisms to help processing tomato seedlings during chilling stress. Interestingly, F. mosseae, Fv/Fm 48 h and Fv/Fm 15 days and VS 15 days were closely associated, proving that processing tomato seedlings successfully overcome chilling stress when inoculated with F. mosseae. In addition, FTL0 was always opposed to F. mosseae and Fv/Fm 15 days, suggesting that F. mosseae induced a reduction of the biomass allocated to leaf (improving biomass allocated to roots. This lower biomass allocated to leaf may lead to lower damage during chilling stress. However, further studies are necessary to corroborate this hypothesis.

5. Conclusions

Chilling damage could limit processing tomato growth and production in open field. The present work provided evidence for the use of arbuscular mycorrhizal fungi (AMF) and plant growth promoting rhizobacteria (PGFR), alone and in consortium, in order to avoid the damage of processing tomato seedlings due to exposure to severe chilling stress (1 °C). The present study revealed that F. mossae was the most effective treatment in reducing electrolyte leakage, while increasing the efficacy of PSII and regrowth capacity of seedlings. Also, a different tolerance of genotypes was observed. In particular, the modern genotypes inoculated with microorganisms showed a better regrowth capacity. Interestingly, the alveolar fixed seed trays dimensions can influence the seedling growth; therefore, reduction seedlings density within the alveolar fixed seed trays could be a useful practice for the nursery sector in order to provide farmers with more vigorous seedlings. Since in the present work the physiological pathways and the derived metabolites were not investigated, further studies are necessary in order to fully understand the mechanisms triggered when processing tomato seedlings are inoculated with microorganisms. Further investigations are being undertaken to assess the activity of the microorganisms and their consortia in real nursery conditions, where fertilizers and plant protection products are used, and in the open field, where competition with other microorganisms occurs.

Author Contributions

Conceptualization, F.C. and D.R.; methodology, F.C. and D.R.; investigation, F.C., D.R., C.M. and R.G.; resources, E.F., V.T.; data curation, D.R.; Writing—Original draft preparation, F.C.; Writing—Review and editing, F.C.; supervision, E.F., C.M., R.G., L.M., V.T. and D.R.; funding acquisition, E.F., L.M. and V.T.

Funding

This work was partially supported by the GENBACCA project, Regione Emilia Romagna, POR-FESR 2014/2020 Initiative, by MIC-CERES project (FC Project ID 2013−1888; AF Project ID 1301-003) and by BIOPRIME (Italian MiPAF project code 1.10.05).

Acknowledgments

We wish to thank Massimiliano Beretta and ISI Sementi Spa (Fidenza, PR, Italy) for providing the seeds of the genotypes used in this work. The authors thanks Fulvia Rizza, Franz-W. Badeck, Leonardo Setti, Djangsou Hagassou, Lavinia Mareri and Simone Usai for their collaboration.

Conflicts of Interest

The authors declare no conflict of interest.

References

  1. Ma, X.; Chen, C.; Yang, M.; Dong, X.; Lv, W.; Meng, Q. Cold-regulated protein (SlCOR413IM1) confers chilling stress tolerance in tomato plants. Plant Physiol. Biochem. 2018, 124, 29–39. [Google Scholar] [CrossRef] [PubMed]
  2. Zhang, X.; Fowler, S.G.; Cheng, H.; Lou, Y.; Rhee, S.Y.; Stockinger, E.J.; Thomashow, M.F. Freezing-sensitive tomato has a functional CBF cold response pathway, but a CBF regulon that differs from that of freezing-tolerant Arabidopsis. Plant J. 2004, 39, 905–919. [Google Scholar] [CrossRef] [PubMed]
  3. Rui, L.; Lixing, Z.; Liu, W.; Lin, C.; Ruirui, Z.; Jiping, S.; Lin, S. Reduction of Tomato-Plant Chilling Tolerance by CRISPR−Cas9-Mediated SlCBF1 Mutagenesis. J. Agric. Food Chem. 2018, 66, 9042–9051. [Google Scholar] [CrossRef]
  4. Ronga, D.; Gallingani, T.; Zaccardelli, M.; Perrone, D.; Francia, E.; Milc, J.; Pecchioni, N. Carbon footprint and energetic analysis of tomato production in the organic vs. the conventional cropping systems in Southern Italy. J. Clean. Prod. 2019, 220, 836–845. [Google Scholar] [CrossRef]
  5. Ronga, D.; Zaccardelli, M.; Lovelli, S.; Perrone, D.; Francia, E.; Milc, J.; Ulrici, A.; Pecchioni, N. Biomass production and dry matter partitioning of processing tomato under organic vs conventional cropping systems in a Mediterranean environment. Sci. Hortic. 2017, 224, 163–170. [Google Scholar] [CrossRef]
  6. FAO. Food and Agriculture Data. Available online: http://www.fao.org/faostat/en/#data/QC (accessed on 16 March 2019).
  7. Foolad, M.R. Genome mapping and molecular breeding of tomato. Int. J. Plant Genom. 2007, 2007, 52. [Google Scholar] [CrossRef] [PubMed]
  8. Casals, J.; Rivera, A.; Sabaté, J.; del Castillo, R.R.; Simó, J. Cherry and Fresh Market Tomatoes: Differences in Chemical, Morphological, and Sensory Traits and Their Implications for Consumer Acceptance. Agron. J. 2019, 9, 9. [Google Scholar] [CrossRef]
  9. Foolad, M.R.; Lin, G.Y. Relationship between cold tolerance during seed germination and vegetative growth in tomato: Germplasm evaluation. J. Am. Soc. Hortic. Sci. 2000, 125, 679–683. [Google Scholar] [CrossRef]
  10. Ghanbari, F.; Sayyari, M. Controlled drought stress affects the chilling-hardening capacity of tomato seedlings as indicated by changes in phenol metabolisms, antioxidant enzymes activity, osmolytes concentration and abscisic acid accumulation. Sci. Hortic. 2018, 229, 167–174. [Google Scholar] [CrossRef]
  11. Allen, D.J.; Ort, D.R. Impacts of chilling temperatures on photosynthesis in warm climate plants. Trends Plant Sci. 2001, 6, 36–42. [Google Scholar] [CrossRef]
  12. Kuk, Y.I.; Shin, J.S.; Burgos, N.R.; Hwang, T.E.; Han, O.; Cho, B.H.; Jung, S.; Guh, J.O. Antioxidative enzymes offer protection from chilling damage in rice plants. Crop Sci. 2003, 43, 2109–2117. [Google Scholar] [CrossRef]
  13. Nayyar, H.; Chander, K.; Kumar, S.; Bains, T. Glycine betaine mitigates cold stress damage in chickpea. Agron. Sustain. Dev. 2005, 25, 381–388. [Google Scholar] [CrossRef]
  14. Kimball, S.L.; Salisbury, F.B. Ultrastructural changes of plants exposed to low temperatures. Am. J. Bot. 1973, 60, 1028–1033. [Google Scholar] [CrossRef]
  15. Yun, J.G.; Hayashi, T.; Yazawa, S.; Katoh, T.; Yasuda, Y. Acute morphological changes of palisade cells of Saintpaulia leaves induced by a rapid temperature drop. J. Plant Res. 1996, 109, 339–342. [Google Scholar] [CrossRef]
  16. Ronga, D.; Rizza, F.; Badeck, F.W.; Milc, J.; Laviano, L.; Montevecchi, G.; Nicola, P.; Francia, E. Physiological responses to chilling in cultivars of processing tomato released and cultivated over the past decades in Southern Europe. Sci. Hortic. 2018, 231, 118–125. [Google Scholar] [CrossRef]
  17. Lovelli, S.; Potenza, G.; Castronuovo, D.; Perniola, M.; Candido, V. Yield, quality and water use efficiency of processing tomatoes produced under different irrigation regimes in Mediterranean environment. Ital. J. Agron. 2017, 12, 17–24. [Google Scholar] [CrossRef]
  18. Ventrella, D.; Charfeddine, M.; Moriondo, M.; Rinaldi, M.; Bindi, M. Agronomic adaptation strategies under climate change for winter durum wheat and tomato in Southern Italy: Irrigation and nitrogen fertilization. Reg. Environ. Chang. 2012, 12, 407–419. [Google Scholar] [CrossRef]
  19. Daranas, N.; Badosa, E.; Francés, J.; Montesinos, E.; Bonaterra, A. Enhancing water stress tolerance improves fitness in biological control strains of Lactobacillus plantarum in plant environments. PLoS ONE 2018, 13, e0190931. [Google Scholar] [CrossRef] [PubMed]
  20. Grover, M.; Ali, S.Z.; Sandhya, V.; Rasul, A.; Venkateswarlu, B. Role of microorganisms in adaptation of agriculture crops to abiotic stresses. World J. Microbiol. Biotechnol. 2011, 27, 1231–1240. [Google Scholar] [CrossRef]
  21. Ilangumaran, G.; Smith, D.L. Plant Growth Promoting Rhizobacteria in Amelioration of Salinity Stress: A Systems Biology Perspective. Front. Plant Sci. 2017, 8, 1768. [Google Scholar] [CrossRef]
  22. Lanfranco, L.; Bonfante, P.; Genre, A. The Mutualistic Interaction between Plants and Arbuscular Mycorrhizal Fungi. In The Fungal Kingdom; Heitman, J., Howlett, B., Crous, P., Stukenbrock, E., James, T., Gow, N., Eds.; ASM Press: Washington, WA, USA, 2017; pp. 727–747. [Google Scholar]
  23. Calvo-Polanco, M.; Sánchez-Castro, I.; Cantos, M.; García, J.L.; Azcón, R.; Ruiz-Lozano, J.M.; Beuzón, C.R.; Aroca, R. Exploring the use of recombinant inbred lines in combination with beneficial microbial inoculants (AM fungus and PGPR) to improve drought stress tolerance in tomato. Environ. Exp. Bot. 2016, 131, 47–57. [Google Scholar] [CrossRef] [Green Version]
  24. Bonfante, P.; Genre, A. Mechanisms underlying beneficial plant—fungus interactions in mycorrhizal symbiosis. Nat. Commun. 2010, 1, 41. [Google Scholar] [CrossRef] [PubMed]
  25. Gutjahr, C.; Parniske, D. Cell and developmental biology of Arbuscular Mycorrhiza symbiosis. Annu. Rev. Cell Dev. Biol. 2013, 29, 593–617. [Google Scholar] [CrossRef] [PubMed]
  26. Smith, S.; Read, D. Mycorrhizal Symbiosis; Academic: London, UK, 2008. [Google Scholar]
  27. Baum, C.; El-Tohamy, W.; Gruda, N. Increasing the productivity and product quality of vegetable crop using arbuscular mycorrhizal fungi: A review. Sci. Hortic. 2015, 187, 131–141. [Google Scholar] [CrossRef]
  28. Cavagnaro, T.R.; Barrios-Masias, F.H.; Jackson, L.E. Arbuscular mycorrhizas and their role in plant growth, nitrogen interception and soil gas efflux in an organic production system. Plant Soil 2012, 353, 181–194. [Google Scholar] [CrossRef]
  29. Gosling, P.; Hodge, A.; Goodlass, G.; Bending, G.D. Arbuscular mycorrhizal fungi and organic farming. Agric. Ecosyst. Environ. 2006, 113, 17–35. [Google Scholar] [CrossRef]
  30. Hart, M.; Ehret, D.L.; Krumbein, A.; Leung, C.; Murch, S.; Turi, C.; Franken, P. Inoculation with arbuscular mycorrhizal fungi improves the nutritional value of tomatoes. Mycorrhiza 2014, 25, 359–376. [Google Scholar] [CrossRef] [PubMed]
  31. Subramanian, K.S.; Santhanakrishnan, P.; Balasubramanian, P. Responses of field grown tomato plants to arbuscular mycorrhizal fungal colonization under varying intensities of drought stress. Sci. Hortic. 2006, 107, 245–253. [Google Scholar] [CrossRef]
  32. Vangelisti, A.; Natali, L.; Bernardi, R.; Sbrana, C.; Turrini, A.; Hassani-Pak, K.; Hughes, D.; Cavallini, A.; Giovannetti, M.; Giordani, T. Transcriptome changes induced by arbuscular mycorrhizal fungi in sunflower (Helianthus annuus L.) roots. Sci. Rep. 2018, 8, 1–14. [Google Scholar] [CrossRef] [PubMed]
  33. Zouari, I.; Salvioli, A.; Chialva, M.; Novero, M.; Miozzi, L.; Tenore, G.C.; Bagnaresi, P.; Paola Bonfante, P. From root to fruit: RNA-Seq analysis shows that arbuscular mycorrhizal symbiosis may affect tomato fruit metabolism. BMC Genom. 2014, 15, 221. [Google Scholar] [CrossRef] [PubMed]
  34. Ahmad, F.; Ahmad, I.; Khan, M.S. Screening of free-living rhizospheric bacteria for their multiple plant growth promoting activities. Microbiol. Res. 2008, 163, 173–181. [Google Scholar] [CrossRef] [PubMed]
  35. Bhattacharyya, P.N.; Jha, D.K. Plant growth-promoting rhizobacteria (PGPR): Emergence in agriculture. World J. Microbiol. Biotechnol. 2012, 28, 1327–1350. [Google Scholar] [CrossRef] [PubMed]
  36. Shameer, S.; Prasad, T.N.V.K.V. Plant growth promoting rhizobacteria for sustainable agricultural practices with special reference to biotic and abiotic stresses. J. Plant Growth Regul. 2018, 84, 603–615. [Google Scholar] [CrossRef]
  37. Ruzzi, M.; Aroca, R. Plant growth-promoting rhizobacteria act as biostimulants in horticulture. Sci. Hortic. 2015, 196, 124–134. [Google Scholar] [CrossRef]
  38. Numanad, M.; Bashira, S.; Khana, Y.; Mumtaza, R.; Shinwaric, Z.K.; Khan, A.L.; Khan, A.; AL-Harrasi, A. Plant growth promoting bacteria as an alternative strategy for salt tolerance in plants: A review. Microbiol. Res. 2018, 209, 2–32. [Google Scholar]
  39. Ait Bakra, E.; Nowak, J.; Clement, C. Enhancement of chilling resistance of inoculated grapevine plantlets with a plant growth promoting rhizobacterium, Burkholderia phytofirmans strain PsJN. Appl. Environ. Microbiol. 2006, 72, 7246–7252. [Google Scholar]
  40. Duponnois, R. Bacteria helping mycorrhiza development. In Microbial Activity in the Rhizosphere; Mukerji, K.G., Manoharachary, C., Singh, J., Eds.; Springer: Berlin, Germany, 2006; pp. 297–310. [Google Scholar]
  41. Abdel Latef, A.A.; Chaoxing, H. Arbuscular mycorrhizal influence on growth, photosynthetic pigments, osmotic adjustment and oxidative stress in tomato plants subjected to low temperature stress. Acta Physiol. Plant 2011, 33, 1217–1225. [Google Scholar] [CrossRef]
  42. Liu, A.; Chen, S.; Wang, M.; Liu, D.; Chang, R.; Wang, Z.; Lin, X.; Bai, B.; Ahammed, G.J. Arbuscular Mycorrhizal Fungus Alleviates Chilling Stress by Boosting Redox Poise and Antioxidant Potential of Tomato Seedlings. J. Plant Growth Regul. 2016, 35, 109–120. [Google Scholar] [CrossRef]
  43. Rivero, J.; Gamir, J.; Aroca, R.; Pozo, M.J.; Flors, V. Metabolic transition in mycorrhizal tomato roots. Front. Microbiol. 2015, 6, 598. [Google Scholar] [CrossRef]
  44. Meier, U. Growth Stages of Mono and Dicotyledonous Plants; BBCH Monography Blackwell, 2nd ed.; Federal Biological Research Centre for Agriculture and Forestry: Braunschweig, Germany, 2001; p. 622. [Google Scholar]
  45. Caffagni, A.; Pecchioni, N.; Francia, E.; Pagani, D.; Milc, J. Candidate gene expression profiling in two contrasting tomato cultivars under chilling stress. Biol. Plant. 2014, 58, 283–295. [Google Scholar] [CrossRef]
  46. Cerovic, Z.G.; Masdoumier, G.; Ghozlen, N.B.; Latouche, G. A new optical leaf-clip meter for simultaneous non-destructive assessment of leaf chlorophyll and epidermal flavonoids. Physiol. Plant. 2012, 146, 251–260. [Google Scholar] [CrossRef] [PubMed]
  47. Cerovic, Z.G.; Cartelat, A.; Goulas, Y.; Meyer, S. In-the-field assessment of wheat leaf polyphenolics using the new optical leaf-clip DUALEX. Precis. Agric. 2005, 5, 243–249. [Google Scholar]
  48. Rizza, F.; Crosatti, C.; Stanca, A.M.; Cattivelli, L. Studies for assessing the influence of hardening on cold tolerance of barley genotypes. Euphytica 1994, 75, 131–138. [Google Scholar] [CrossRef]
  49. Alkan, N.; Gadkar, V.; Yarden, O.; Kapulnik, Y. Analysis of quantitative interactions between two species of arbuscular mycorrhizal fungi, Funneliformis mosseae and G. intraradices, by real-time PCR. Appl. Environ. Microbiol. 2006, 72, 4192–4199. [Google Scholar] [CrossRef] [PubMed]
  50. Jackson, J.E. A Users Guide to Principal Components; Wiley Sons Ltd.: New York, NY, USA, 1991. [Google Scholar]
  51. Wold, S.; Esbensen, K.; Geladi, P. Principal component analysis. Chemometr. Intell. Lab. 1987, 2, 37–52. [Google Scholar] [CrossRef]
  52. Herrera, F.; Castillo, J.E.; Chica, A.F.; Bellido, L.L. Use of municipal solid waste compost (MSWC) as a growing medium in the nursery production of tomato plants. Bioresour. Technol. 2008, 99, 287–296. [Google Scholar] [CrossRef] [PubMed]
  53. Muñoz-Huerta, R.F.; Guevara-Gonzalez, R.G.; Contreras-Medina, L.M.; Torres-Pacheco, I.; Prado-Olivarez, J.; Ocampo-Velazquez, R.V. A Review of Methods for Sensing the Nitrogen Status in Plants: Advantages, Disadvantages and Recent Advances. Sensors 2013, 13, 10823–10843. [Google Scholar] [CrossRef] [PubMed]
  54. Ronga, D.; Pane, C.; Zaccardelli, M.; Pecchioni, N. Use of spent coffee ground compost in peat-based growing media for the production of basil and tomato potting plants. Commun. Soil Sci. Plant Anal. 2016, 3, 356–368. [Google Scholar] [CrossRef]
  55. Hagassou, D.; Francia, E.; Ronga, D.; Buti, M. Blossom end-rot in tomato (Solanum lycopersicum L.): A multi-disciplinary overview of inducing factors and control strategies. Sci. Hortic. 2019, 249, 49–58. [Google Scholar] [CrossRef]
  56. Ronga, D.; Lovelli, S.; Zaccardelli, M.; Perrone, D.; Ulrici, A.; Francia, E.; Milc, J.; Pecchioni, N. Physiological responses of processing tomato in organic and conventional Mediterranean cropping systems. Sci. Hortic. 2015, 190, 161–172. [Google Scholar] [CrossRef] [Green Version]
  57. Ronga, D.; Caradonia, F.; Setti, L.; Hagassou, D.; Giaretta Azevedo, C.V.; Milc, J.; Pedrazzi, S.; Allesina, G.; Arru, L.; Francia, E. Effects of innovative biofertilisers on yield of processing tomato cultivated in organic cropping systems in northern Italy. Acta Hortic. 2019, 1233, 129–136. [Google Scholar] [CrossRef]
  58. Sarkar, J.; Chakraborty, B.; Chakraborty, U. Plant Growth Promoting Rhizobacteria Protect Wheat Plants Against Temperature Stress Through Antioxidant Signalling and Reducing Chloroplast and Membrane Injury. J. Plant Growth Regul. 2018, 37, 1396–1412. [Google Scholar] [CrossRef]
  59. Cantliffe, J.D. Pre- and Postharvest Practices for Improved Vegetable Transplant Quality. HortTechnology 1993, 3, 415–418. [Google Scholar] [CrossRef] [Green Version]
  60. NeSmith, D.S.; Duval, J.R. The effect of container size. HortTechnology 1998, 8, 495–498. [Google Scholar] [CrossRef]
  61. Hermenau, R.; Ishida, K.; Gama, S.; Hoffmann, B.; Pfeifer-Leeg, M.; Plass, W.; Mohr, J.F.; Wichard, T.; Saluz, H.P.; Hertweck, C. Gramibactin—A bacterial siderophore with a diazeniumdiolate ligand system. Nat. Chem. Biol. 2018, 14, 841–843. [Google Scholar] [CrossRef] [PubMed]
  62. Raison, J.K.; Chapman, E.A. Membrane phase changes in chilling-sensitive vigna radiate and their significance to growth. Aust. J. Plant Physiol. 1976, 3, 291–299. [Google Scholar]
  63. Thomashow, M.F. Plant cold acclimation, freezing tolerance genes and regulatory mechanisms. Annu. Rev. Plant Physiol. Plant Mol. Biol. 1999, 50, 571–599. [Google Scholar] [CrossRef] [PubMed]
  64. Bajji, M.; Kinet, J.M.; Lutts, S. The use of the electrolyte leakage method for assessing cell membrane stability as a water stress tolerance test in durum wheat. Plant Growth Regul. 2002, 36, 61–70. [Google Scholar] [CrossRef]
  65. Adam, A.L.; Gala, A.A.; Manninger, K.; Barna, B. Inhibition of the development of leaf rust (Puccinia recondita) by treatment of wheat with allopurinol and production of a hypersensitive-like reaction in a compatible host. Plant Pathol. 2000, 49, 317–323. [Google Scholar] [CrossRef]
  66. Bandurska, H.; Gniazdowska-Skoczek, H. Cell membrane stability in two barley genotypes under water stress conditions. Acta Soc. Bot. Pol. 1995, 64, 29–32. [Google Scholar] [CrossRef]
  67. Premachandra, G.S.; Shimada, T. The measurement of cell membrane stability using polyethylene glycol as a drought tolerance test in wheat. Jpn. J. Crop Sci. 1987, 56, 92–98. [Google Scholar] [CrossRef]
  68. Kratsch, H.A.; Wise, R.R. The ultrastructure of chilling stress. Plant Cell Environ. 2000, 23, 337–350. [Google Scholar] [CrossRef]
  69. Feierabend, J.; Schaan, C.; Hertwig, B. Photoinactivation of Catalase Occurs under Both High- and Low-Temperature Stress Conditions and Accompanies Photoinhibition of Photosystem II. Plant Physiol. 1992, 100, 1554–1561. [Google Scholar] [CrossRef] [PubMed]
  70. Maxwell, K.; Johnson, G.N. Chlorophyll fluorescence—A practical guide. J. Exp. Bot. 2000, 51, 659–668. [Google Scholar] [CrossRef] [PubMed]
  71. Stirbet, A.; Govindjee. On the relation between the Kautsky effect (chlorophyll a fluorescence induction) and Photosystem II: Basics and applications of the OJIP fluorescence transient. J. Photochem. Photobiol. B 2011, 104, 236–257. [Google Scholar] [CrossRef] [PubMed]
  72. Suárez-Moreno, Z.R.; Caballero-Mellado, J.; Coutinho, B.G.; Mendonca-Previato, L.; James, E.K.; Venturi, V. Common features of environmental and potentially beneficial plant-associated Burkholderia. Microb. Ecol. 2012, 63, 249–266. [Google Scholar] [CrossRef] [PubMed]
  73. Santamaría, J.; Bayman, P. Fungal Epiphytes and Endophytes of Coffee Leave (Coffea arabica). Microbiol. Ecol. 2005, 50, 1–8. [Google Scholar] [CrossRef] [PubMed]
  74. Garcia de Salamone, I.E.; Funes, J.M.; Di Salvo, L.P.; Escobar Ortega, J.S.; D’Auria, F.; Ferrando, L.; Fernandez Scavino, A. Inoculation of paddy rice with Azospirillum brasilense and Pseudomonas fluorescens: Impact of plant genotypes on the rhizosphere microbial communities and field crop production. Appl. Soil Ecol. 2012, 61, 196–204. [Google Scholar] [CrossRef]
  75. Mohameda, I.; Eidd, E.K.; Abbasb, M.H.H.; Saleme, A.A.; Ahmedf, N.; Alib, M.; Shahg, G.M.; Fanga, C. Use of plant growth promoting Rhizobacteria (PGPR) and mycorrhizae to improve the growth and nutrient utilization of common bean in a soil infected with white rot fungi. Ecotoxicol. Environ. Saf. 2019, 171, 539–548. [Google Scholar] [CrossRef] [PubMed]
  76. Roesti, D.; Guar, R.; Johri, B.N.; Imfeld, G.; Sharma, S.; Kawaljeet, K.; Aragno, M. Plant growth stage, fertilizer management and bio-inoculation of arbuscular mycorrhizal fungi and plant growth promoting rhizobacteria affect the rhizobacterial community structure in rain-fed wheat field. Soil Biol. Biochem. 2006, 38, 1111–1120. [Google Scholar] [CrossRef]
  77. Zubek, S.; Turnau, K.; Tsimilli-Michael, M.; Strasser, J.R. Response of endangered plant species to inoculation with arbuscular mycorrhizal fungi and soil bacteria. Mycorrhiza 2009, 19, 113–123. [Google Scholar] [CrossRef] [PubMed]
Figure 1. Seedlings of ‘Pearson’ (A), ‘H3402′ (B), and ‘Everton’ (C) at regrowth. In each square, from left to right: CTRL, G, B and G + B. CTRL = seedlings without microorganism treatment, G = seedlings inoculated with Funneliformis mosseae, B = seedlings with Paraburkholderia graminis inoculated, G + B = seedlings inoculated with Funneliformis mosseae + Paraburkholderia graminis.
Agronomy 09 00299 g001
Figure 2. Real time dissociation curves to confirm mycorrhizal inoculation in ‘Pearson’ (A), ‘H3402′ (B) and ‘Everton’ (C), respectively. Single peaks are obtained from three technical replicates (each peak of different color represents a replicate). Flat lines are no template control (NTC) technical replicates.
Agronomy 09 00299 g002
Figure 3. Biplot of Principal Component Analysis results of first experiment.
Agronomy 09 00299 g003
Figure 4. Biplot of Principal Component Analysis results on second experiment.
Agronomy 09 00299 g004
Table 1. Beneficial microorganisms and genotypes used in the experiments.
ExperimentTreatmentGenotypeCTRLGBG + B
1 and 2T1Evertonx
1 and 2T2Everton x
1 and 2T3Everton x
1 and 2T4Everton x
2T5Pearsonx
2T6Pearson x
2T7Pearson x
2T8Pearson x
2T9H3402x
2T10H3402 x
2T11H3402 x
2T12H3402 x
CTRL = seedlings without microorganism treatment, G = seedlings inoculated with Funneliformis mosseae, B = seedlings inoculated with Paraburkholderia graminis, G + B = seedlings inoculated with Funneliformis mosseae + Paraburkholderia graminis.
Table 2. Parameters measured before chilling stress in the first and second experiment (A and B, respectively). (1) Physiological parameters: Fv/Fm = photochemical efficiency of photosystem II (PSII), CHL = index of the chlorophyll content in leaf measured using a DUALX instrument, FLAV = index of the flavonoid content in leaf measured using a DUALX instrument, ANTH = index of the anthocyanin content in leaf measured using a DUALX instrument, NBI = nitrogen balance index. (2) Morphological non-destructive parameters: H = height of seedlings, D = stem diameter of seedlings, H/D = height to diameter ratio, LN (no.) = number of leaves per seedling, LA = leaf area, SLM = specific leaf mass. (3) Morphological destructive parameters: LDW = leaf dry weight, SDW = stem dry weight, RDW = root dry weight, TDW = total dry weight, FTL = fraction of total dry weight to leaves, FTR = fraction of total dray weight to roots. 0 = measured or recorded before stress, CTRL = seedlings without microorganism treatment, G = seedlings inoculated with Funneliformis mosseae, B = seedlings inoculated with Paraburkholderia graminis, G + B = seedlings inoculated with Funneliformis mosseae + Paraburkholderia graminis, TREAT = treatment, GENO = genotype. Data are presented as mean ± standard deviation (SD) (in the first experiment n = 5; in the second experiments n treatment = 15 and n genotype = 20). Different letters indicate statistically significant differences among treatments or genotypes by ANOVA followed by Duncan’s test at p < 0.05, n.s. = not significant, ** = p < 0.01, * = p < 0.05. Bold fonts indicate higher values.
A (1)
TreatmentFv/Fm0CHL0 FLAV0ANTH0NBI0
CTRL0.787 ± 0.04n.s.21.60 ± 2.5c0.507 ± 0.03b0.367 ± 0.10n.s.42.64 ± 4.5n.s.
G0.737 ± 0.06n.s.23.77 ± 1.9bc0.690 ± 0.29ab0.397 ± 0.02n.s.36.22 ± 9.4n.s.
B0.780 ± 0.05n.s.28.83 ± 1.1a0.763 ± 0.26ab0.353 ± 0.04n.s.31.64 ± 5.4n.s.
G + B0.780 ± 0.05n.s.23.73 ± 0.5bc0.910 ± 0.12a0.393 ± 0.06n.s.32.47 ± 6.5n.s.
F values0.939 0.016 0.021 0.841 0.091
A (2)
TreatmentH0 (mm)D0 mm)H/D0LN0 (no.)LA0 (m2 plant−1)SLM0 (g cm−2)
CTRL152.00 ± 16n.s.2.83 ± 0.11a53.60 ± 6.4 ab3.67 ± 0.16ab0.0035 ± 0.0008n.s.0.00319 ± 8.2 × 10⁻⁴n.s.
G143.00 ± 10n.s.2.73 ± 0.30ab52.49 ± 3.5ab3.71 ± 0.10a0.0024 ± 0.0001n.s.0.00319 ± 1.4 × 10⁻⁴n.s.
B113.00 ± 30n.s.2.43 ± 0.05b46.38 ± 5.5b3.52 ±0.11b0.0025 ± 0.0009n.s.0.00369 ± 4.8 × 10⁻⁴n.s.
G + B150.00 ± 20n.s.2.33 ± 0.13b64.50 ± 12.6a3.57 ± 0.15ab0.0030 ± 0.0008n.s.0.00272 ± 2.1 × 10⁻⁴n.s.
F values0.055 0.010 0.043 0.49 0.331 0.268
A (3)
TreatmentLDW0 (g plant−1)SDW (g plant−1)RDW0 (g plant−1)TDW0 (g plant−1)FTL0FTR0
CTRL0.11 ± 0.03n.s.0.045 ± 0.016ab0.04 ± 0.06n.s.0.193 ± 0.044n.s58.00 ± 2.7n.s18.24 ± 1.6c
G0.08 ± 0.03n.s.0.039 ± 0.011ab0.04 ± 0.09n.s.0.163 ± 0.047n.s48.00 ± 8.5n.s26.96 ± 2.8ab
B0.09 ± 0.09n.s.0.050 ± 0.004a0.04 ± 0.05n.s.0.187 ± 0.014n.s49.00 ± 6.0n.s23.01 ± 2.8b
G + B0.08 ± 0.02n.s.0.029 ± 0.006b0.05 ± 0.10n.s.0.157 ± 0.046n.s51.00 ±1.9n.s30.68 ± 2.1a
F values0.569 0.049 0.458 0.734 0.275 0.005
B (1)
TreatmentFv/Fm0CHL0 FLAV0ANTH0NBI0
CTRL0.787 ± 0.02b32.62 ± 3.2ab0.364 ± 0.23b0.118 ± 0.04a112.80 ± 19.6a
G0.815 ± 0.01a35.13 ± 5.4a0.526 ± 0.21a0.052 ± 0.02ab74.50 ± 28.4b
B0.823 ± 0.01a37.13 ± 2.7a0.558 ± 0.29a0.071 ± 0.02ab83.30 ± 23.4b
G + B0.809 ± 0.02a28.28 ± 4.3b0.255 ± 0.16b0.043 ± 0.01b132.00 ± 21.2a
F values<0.001 0.012 <0.001 0.049 <0.001
GENOTYPE
EVERTON0.810 ± 0.03n.s32.08 ± 5.2ab0.284 ± 0.13b0.020 ± 0.01b128.10 ± 25.5a
H34020.809 ± 0.02n.s.31.23 ± 3.4b0.537 ± 0.30a0.097 ±0.02a73.20 ± 15.2c
PEARSON0.806 ± 0.03n.s.36.54 ± 3.1a0.456 ±0.24a0.097 ±0.02a100.70 ± 19.8b
F values0.855 0.049 <0.001 0.006 <0.001
TREAT × GENOn.s. n.s. ** n.s. n.s.
B (2)
TreatmentH0 (mm)D0 (mm)H/D0LN0 (no.)LA0 (m2 plant−1)SLM0 (g cm−2)
CTRL126.50 ± 13b3.29 ± 0.46a39.00 ± 5.8b4.60 ± 0.33b0.0054 ± 0.001b0.0025 ± 0.0006n.s.
G123.60 ± 21b3.04 ± 0.37b41.00 ±4.2b4.90 ± 0.62ab0.0069 ± 0.001a0.0025 ± 0.0007n.s.
B116.00 ± 20b2.80 ±0.27c41.00 ± 5.2b5.30 ± 0.60a0.0058 ± 0.002ab0.0027 ± 0.0005n.s.
G + B146.90 ± 16a2.86 ±0.43bc52.00 ± 6.9a5.00 ± 0.35a0.0056 ± 0.002ab0.0026 ± 0.0004n.s.
F value<0.001 <0.001 <0.001 0.011 0.048 0.730
GENOTYPE
EVERTON126.00 ± 18.1b2.90 ±0.20b43.00 ± 5.9n.s.4.80 ± 0.30 b0.0049 ± 0.001b0.0024 ±0.0003b
H3402116.80 ± 20.2c2.70 ±0.35c44.00 ± 9.6n.s.5.00 ± 0.40ab0.0048 ± 0.001b0.0028 ± 0.0003a
PEARSON142.00 ± 17.3a3.39 ±0.38a42.00 ± 7.0n.s.5.20 ± 0.30a0.0082 ± 0.002a0.0025 ±0.0004ab
F values<0.001 <0.001 0.643 0.049 <0.001 0.043
TREAT × GENO** n.s. n.s. n.s. n.s. n.s.
B (3)
TreatmentLDW0 (g plant−1)SDW0 (g plant−1)RDW0 (g plant−1)TDW0 (g plant−1)FTL0FTR0
CTRL0.12 ± 0.02b0.05 ± 0.01n.s.0.04 ± 0.02n.s.0.21 ± 0.05b61.00 ±5.5n.s.19.40 ± 5.7n.s.
G0.15 ± 0.02a0.06 ± 0.02n.s.0.06 ± 0.02n.s.0.30 ± 0.06a59.00 ± 9.6n.s.20.10 ± 5.3n.s.
B0.13 ± 0.03ab0.06 ±0.02n.s.0.05 ± 0.02n.s.0.25 ± 0.07ab61.00 ± 4.3n.s.21.40 ±3.0 n.s.
G + B0.15 ± 0.02a0.06 ± 0.02n.s.0.05 ± 0.02n.s.0.27 ± 0.06ab58.00 ± 8.7n.s.19.90 ± 6.1n.s.
F value0.049 0.286 0.182 0.035 0.907 0.736
GENOTYPE
EVERTON0.11 ± 0.03b0.05 ± 0.01b0.04 ± 0.02b0.20 ± 0.06b59.00 ± 7.7n.s.21.80 ± 5.9n.s.
H34020.12 ± 0.04b0.05 ± 0.01b0.04 ± 0.02b0.23 ± 0.09b61.00 ± 9.1n.s.19.30 ± 5.5n.s.
PEARSON0.18 ± 0.05a0.08 ± 0.02a0.10 ± 0.02a0.35 ± 0.09a60.00 ± 3.6n.s.19.60 ± 3.2n.s.
F value<0.001 0.049 0.002 <0.001 0.456 0.276
TREAT × GENOn.s. n.s. n.s. n.s. n.s. n.s.
Table 3. Parameters measured at the end of chilling stress and after 24 h in the first and second experiment (A and B, respectively). Fv/Fm = photochemical efficiency of photosystem II (PSII), EL = electrolyte leakage, 24 h = measured or recorded immediately after the stress, 48 h = measured or recorded 24 h after the end of the stress, CTRL = seedlings without microorganism treatment, G = seedlings inoculated with Funneliformis mosseae, B = seedlings inoculated with Paraburkholderia graminis, G + B = seedlings inoculated with Funneliformis mosseae + Paraburkholderia graminis, TREAT = treatment, GENO = genotype. Data are presented as mean ± standard deviation (SD) (in the first experiment n = 5; in the second experiments n treatment = 15 and n genotype = 20). Different letters indicate statistically significant differences among treatments or genotypes by ANOVA followed by Duncan’s test at p < 0.05, n.s. = not significant, ** = p < 0.01, * = p < 0.05. Bold fonts indicate higher values.
A
TreatmentFv/Fm 24 hEL% 24 hFv/Fm 48 h
CTRL0.510 ± 0.18n.s.86.94 ± 0.3a0.102 ± 0.050b
G0.490 ± 0.19n.s.42.79 ± 1.6d0.460 ± 0.332a
B0.380 ± 0.20n.s.67.95 ± 0.9c0.131 ± 0.057ab
G + B0.333 ± 0.23n.s.77.27 ± 9.5bc0.350 ± 0.249ab
F value0.099 <0.001 0.032
B
TreatmentFv/Fm 24 hEL% 24 hFv/Fm 48 h
CTRL0.572 ± 0.06b55.48 ± 11.8a0.528 ± 0.10c
G0.728 ± 0.05a36.21 ± 10.87b0.776 ± 0.03a
B0.718 ± 0.07a38.89 ± 10.69b0.719 ± 0.11ab
G + B0.662 ± 0.08a42.26 ± 11.2b0.707 ± 0.06b
F value<0.001 <0.001 <0.001
Genotype
EVERTON0.640 ± 0.12n.s.45.32 ± 16.26n.s.0.701 ± 0.10a
H34020.689 ± 0.10n.s.39.84 ± 12.32n.s.0.645 ± 0.14b
PEARSON0.681 ± 0.12n.s.44.47 ± 10.27n.s.0.702 ± 0.12a
F value0.271 0.092 0.041
TREAT × GENOn.s. n.s. n.s.
Table 4. Parameters measured 15 days after chilling stress (regrowth) in the first and second experiment (A and B, respectively). Fv/Fm = photochemical efficiency of photosystem II (PSII), CHL = index of the chlorophyll content in leaf measured using a DUALX instrument, FLAV = index of the flavonoid content in leaf measured using a DUALX instrument, ANTH = index of the anthocyanin content in leaf measured using a DUALX instrument, NBI = nitrogen balance index, VS 15 days = visual score recorded, 15 days = measured or recorded at regrowth (15 days after stress), CTRL = seedlings without microorganism treatment, G = seedlings inoculated with Funneliformis mosseae, B = seedlings inoculated with Paraburkholderia graminis, G + B = seedlings inoculated with Funneliformis mosseae + Paraburkholderia graminis, TREAT = treatment, GENO = genotype. Data are presented as mean ± standard deviation (SD) (in the first experiment n = 5; in the second experiments n treatment = 15 and n genotype = 20). Different letters indicate statistically significant differences among treatments or genotypes by ANOVA followed by Duncan’s test at p < 0.05, n.s. = not significant, ** = p < 0.01, * = p < 0.05. Bold fonts indicate higher values.
A
TreatmentFv/Fm 15 daysCHL 15 daysFLAV 15 daysANTH 15 daysNBI 15 daysVS 15 days (val. 0–5)
CTRL0.544 ± 0.10b16.67 ± 2.7n.s.1.167 ± 0.41n.s.0.327 ±0.10n.s.15.42 ± 5.17n.s.3.33 ± 0.3b
G0.787 ± 0.09a20.70 ± 8.0n.s.1.123 ± 0.24n.s.0.340 ±0.08n.s.20.24 ± 12.9n.s.4.00 ± 0.3a
B0.708 ±0.09a16.20 ± 2.7n.s.1.127 ± 0.25n.s.0.303 ±0.03n.s.14.87 ± 3.87n.s.4.00 ± 0.3a
G + B0.762 ±0.07a15.03 ± 0.3n.s.1.357 ±0.07n.s.0.453 ±0.01n.s.11.11 ± 0.80n.s.3.67 ± 0.4ab
F values0.010.4520.5780.1420.3970.045
B
TreatmentFv/Fm 15 daysCHL 15 daysFLAV 15 daysANTH 15 daysNBI 15 daysVS 15 days (val. 0–5)
CTRL0.544 ± 0.08c26.48 ± 4.6b0.953 ± 0.16c0.435 ± 0.10 a28.77 ± 7.8b2.49 ± 0.37 c
G0.787 ± 0.02ab37.51 ± 4.9a1.250 ± 0.23a0.402 ± 0.08a31.14 ± 4.3b4.39 ± 0.27a
B0.768 ± 0.03b35.15 ± 3.8a1.090 ± 0.13b0.381 ± 0.10ab32.96 ± 6.3b3.87 ± 0.29b
G + B0.802 ± 0.02a34.34 ± 4.1a0.872 ± 0.13c0.323 ± 0.05b40.03 ± 6.3a3.85 ± 0.28b
F values<0.001 <0.001 <0.001 0.011 <0.001 <0.001
Genotype
EVERTON0.750 ± 0.08a31.33 ± 6.5b1.040 ± 0.25n.s.0.373 ± 0.08n.s.31.83 ± 7.9n.s.3.71 ± 0.64b
H34020.725 ± 0.01ab34.67 ± 5.8a1.000 ± 0.22n.s.0.369 ± 0.10n.s.35.43 ± 7.1n.s.3.91 ± 0.76a
PEARSON0.701 ± 0.01b34.11 ± 5.2a1.080 ± 0.17n.s.0.413 ±0.10n.s.32.41 ± 7.1n.s.3.33 ± 0.82c
F values0.001 0.031 0.377 0.241 0.169 <0.001
TREAT × GENO** n.s. n.s. n.s. n.s. n.s.

