Article

Drought-Tolerant Barley: I. Field Observations of Growth and Development

by
Andrea Y. Carter
1,
Martha C. Hawes
2,* and
Michael J. Ottman
1
1
School of Plant Sciences, University of Arizona, Tucson, AZ 85721, USA
2
Soil, Water, and Environmental Sciences, University of Arizona, Tucson, AZ 85721, USA
*
Author to whom correspondence should be addressed.
Agronomy 2019, 9(5), 221; https://doi.org/10.3390/agronomy9050221
Submission received: 13 February 2019 / Revised: 5 April 2019 / Accepted: 28 April 2019 / Published: 30 April 2019
(This article belongs to the Special Issue Root-Soil Interactions)

Abstract

:
An ever-growing challenge to agricultural production worldwide is the reduced availability of water and increased incidence of drought. The development of low-irrigation barley cultivars marks a significant achievement in breeding efforts for drought tolerance, but specific traits conferring adaptation to water stress remain unclear. Here, we report results from two years of replicated field trials comparing yield, phenology, water usage, and rooting characteristics of low-irrigation varieties “Solar” and “Solum” to high-input, semi-dwarf varieties “Kopious” and “Cochise”. The objective was to identify differential performance of varieties under high- and low-water conditions through comparison of growth and developmental traits. Rooting characteristics were analyzed by digging in-field root profile walls to a depth of 1.8 m. Varieties were compared under high (877 mm) and low (223 mm) water regimes including irrigation and precipitation. Observed traits associated with improved performance of the low-irrigation varieties under drought conditions included early vigor, early flowering, greater root growth at 40–80 cm depth, and more effective water use exhibited by greater water extraction post-anthesis. The deeper rooting pattern of the low-irrigation varieties may be related to their ability to use more water post-anthesis under water stress, and thus, to fill grain, compared to high input varieties.

1. Introduction

Barley has demonstrated a capacity to thrive in arid and semi-arid climates where drought is a determinant of crop productivity. The projected increase in incidence and severity of drought conditions combined with the predicted decline in water availability has sparked interest in crop production that is less water dependent [1,2]. As a result of the increasing demand for cereal grains, attributable to human and animal consumption, there is an emerging consensus that demand could be better met through the development, dissemination, and adoption of drought tolerant genotypes [3,4].
Major drought tolerance traits assessed in this study relate to crop growth, water use, and yield. Crop growth as measured by biomass is indicative of a crop’s ability to retain function in a dehydrated state [5,6,7,8]. Greater early-season leaf or shoot biomass, known as early vigor, is another drought adaptive trait. Early season canopy cover reduces evaporation from the soil surface leaving more water available for crop growth [9,10,11]. Plant height under drought stress compared to under non-stress conditions is also an indicator of crop drought tolerance as is the allocation of carbohydrate reserves to grain filling, expressed by harvest index [12,13,14].
Harvest index, the ratio of grain to total above-ground biomass, and grain yield in cereals is most affected by terminal drought stress, i.e., stress during the critical reproductive stage of anthesis. Therefore, traits associated with increased water access during grain fill, or changes in crop duration are associated with greater harvest index and grain yield [15,16]. A primary way to increase crop water access is through deeper roots, if subsurface water is available. Water use during this period is critical as photosynthate is allocated to grain growth [17,18]. In association with rooting depth, penetration ability of roots is of interest, as soil hardness generally increases as the soil dries [19,20].
Another means to improve water access is by adapting crop phenology to seasonal moisture availability. Considered one of the most impactful breeding strategies for low-water environments, faster phenological development has led to improved yield of cereals in Mediterranean-type environments characterized by winter precipitation and terminal drought stress [21,22,23]. Shorter crop duration maximizes growth when temperatures and vapor pressure deficit are lower.
The development and release of one-irrigation barley cultivars marks a significant achievement in breeding efforts for drought tolerance; however, the specific physiological and phenological traits associated with their drought tolerance remain unclear. In an effort to elucidate these traits, two years of replicated field trials were conducted in Tucson, Arizona comparing low-input varieties “Solar” and “Solum” to high-input, conventional varieties “Kopious” and “Cochise”. We hypothesize that the low-input varieties will perform better under low water conditions and vice versa at high water conditions due to differences in yield components, phenology, water use patterns, and rooting characteristics.

2. Materials and Methods

2.1. Varietal Information

Development of barley cultivars adapted to water-limited environments was the motivation for a breeding program headed by R.T. Ramage and R. K. Thompson with the Agriculture Experiment Station (AES) of the University of Arizona and the Agriculture Research Service (ARS), USDA. In 1981, Composite Cross XXXIX was released, a population adapted to a single irrigation of 15 cm to 20 cm applied at or before planting (enough to wet the soil profile to a depth of 1.5 m to 1.8 m), with normal seasonal rainfall around 7 cm to 11 cm in Southwest Arizona. Selection criteria included turgid plants at flowering, plump seed, and ability to outcross (male sterility) [24].
Continued breeding efforts using the Composite Cross XXXIX germplasm resulted in the release of six-row “one-irrigation barley” varieties: Solum in 1991 (by the ARS, USDA and Arizona AES) and Solar (by Arizona AES) in 2006. Originating as F6 selections, these varieties were released as spring barleys for winter crop production in low-water-use environments in the Southwestern United States where only one or two irrigations were applied. Variety trials by Arizona AES (2002 to 2004) have confirmed “Solar” has significantly higher yield, test weight, and lodging resistance than its predecessor “Solum” [25].
The conventional varieties included in this study were “Kopious” and “Cochise”, derived from Composite Cross XXXII, a short-straw high-input population developed by Ramage et al. [26]. These varieties normally receive 5 to 7 flood irrigations of around 150 mm per irrigation each season.

2.2. Site Characteristics

Field studies were conducted to study barley performance under high- and low-irrigation conditions. Trials were conducted in the years of 2015 and 2018 at the University of Arizona, Campus Agricultural Station in Tucson, AZ located at 32°9′36″ N, and 110°33′36″ W. Soil type was a Gila very fine sandy loam (coarse-loamy, mixed, superactive, calcareous, thermic Typic Torrifluvent). The field was fallow prior to the 2015 and 2018 planting.

2.3. Cultural Methods

The cultural methods were similar each year, with slight variations. For the 2015 trial, planting occurred on 3 December 2014 and was established with sprinkler irrigation from 12 December to 16 December (33 mm). For the 2018 trial, planting occurred on 7 December 2017 and was established with sprinkler irrigation from 12 December to 1 January (51 mm). In both years, the seed was planted into dry, flat soil with a cone planter. The low-input varieties were planted at a seeding rate of 78 kg ha−1 (1.24 million seeds ha−1) and the high-input varieties were planted at a seeding rate of 157 kg ha−1 (2.4 million seeds ha−1) to reflect the optimum seeding rate for each variety type.
Nitrogen was applied in the form of urea (46–0–0) at a rate of 56 kg N ha−1 at planting. During the growing season, an additional 112 kg N ha−1 was applied around the tillering stage to both irrigation treatments. Weeds and insects were controlled as needed. Each plot was 7 rows wide with a row spacing of 15 cm and a plot length of 9 m. The experimental design was Latin square with each variety having four reps per treatment.

2.4. Soil Water Measurements

Neutron probe access tubes were installed to a depth of 1.8 m to measure volumetric water content at depth increments of 0.3 m. Soil water was measured approximately once a week and relative to irrigations (0–1 day before, and 3–4 days after irrigation) with a neutron probe (CPN Model 503DR, Campbell Pacific Nuclear International Inc., Concord, CA, USA). The neutron probe was calibrated by regressing volumetric water content against standardized neutron count ratios using multiple paired measurements when soil was wet and dry. Volumetric soil moisture content for the neutron probe calibration was determined from gravimetric water content and bulk density.
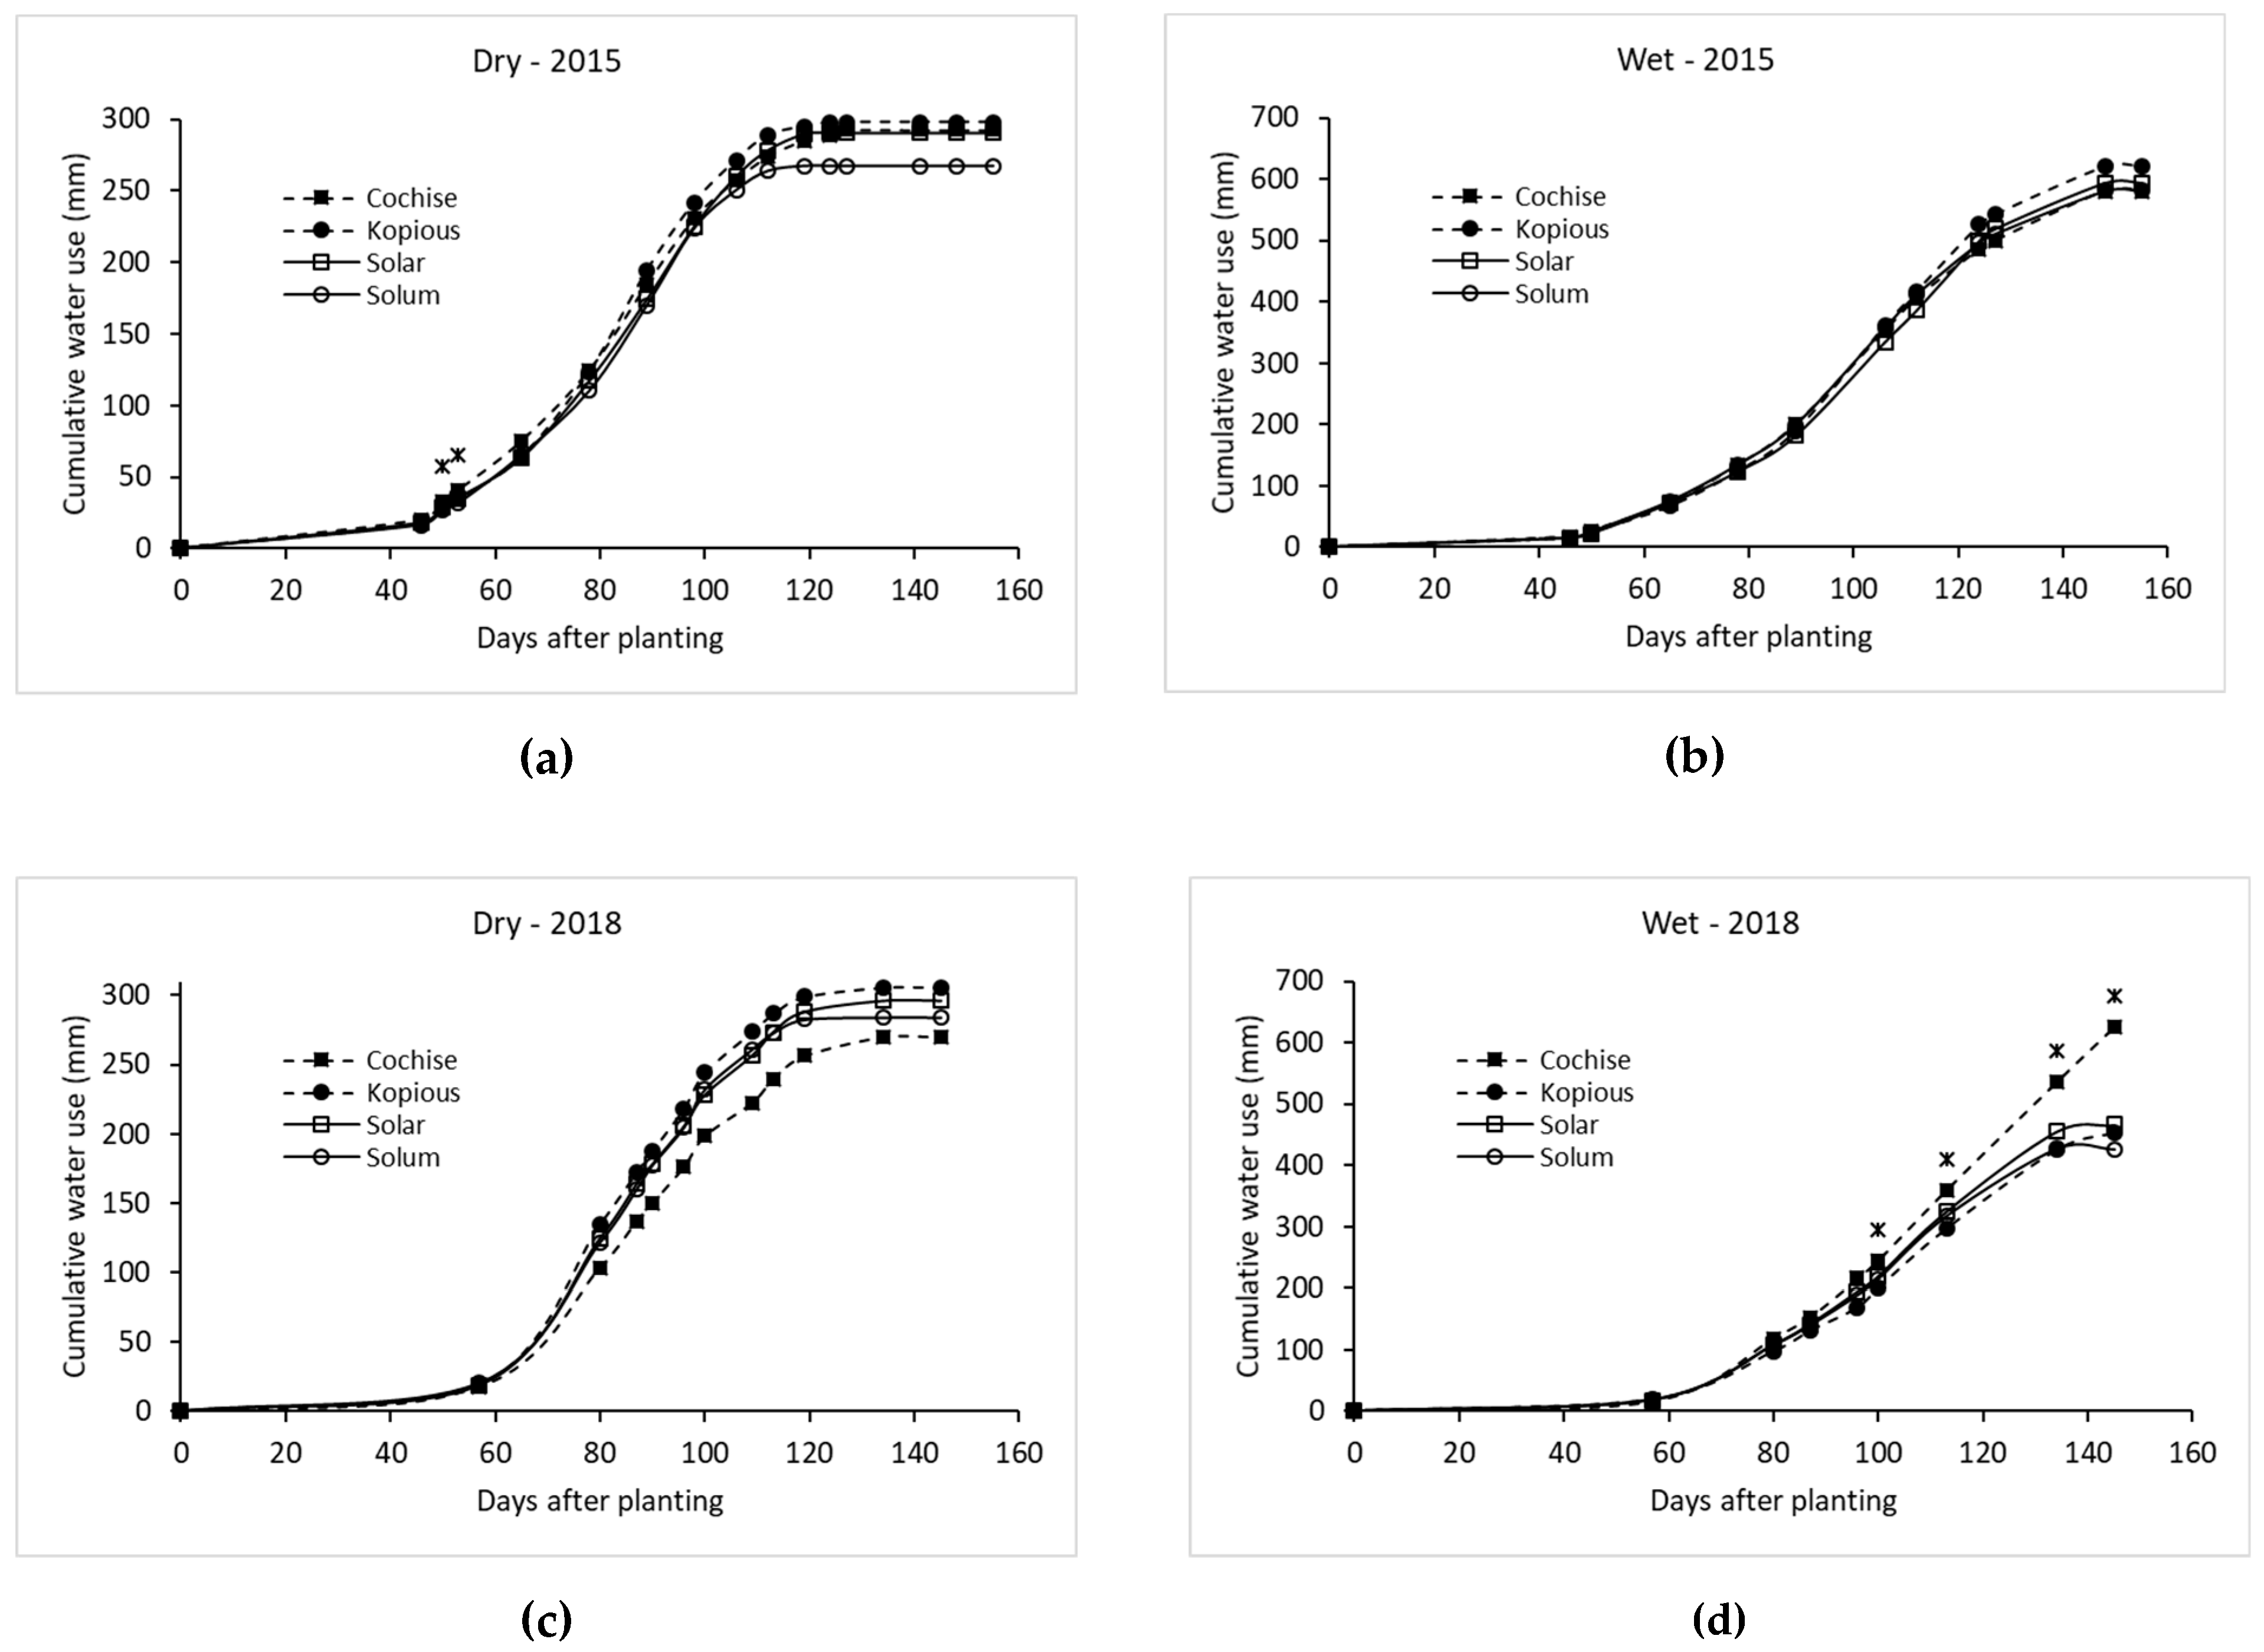
Neutron probe counts from 0 m to 1.8 m were used to calculate period water use for each variety by the water balance method, with precipitation and irrigation included and runoff assumed to be negligible. The period water use values were summed at the end of the season for total water use of each variety.
Water use (ET) was estimated from the differences in soil water content between specific time periods plus rainfall. Deep percolation was considered negligible as soil water content was taken at least 3 days after an irrigation when field capacity had been reached and most deep percolation had already occurred. Furthermore, soil water content was measured at 1.8 m, a depth beyond which not much water would percolate. The time periods between soil water measurements were at least 3 days after an irrigation and 0–1 day before the next irrigation, as mentioned above. Water use between soil water measurements before and after an irrigation were estimated by averaging the estimated daily water use before and after the soil water measurements. This daily water use was calculated from the crop coefficient (Kc) multiplied by reference evapotransiration (ETo). The Kc was calculated from ET/ETo. Water use between planting and the first soil water measurement was estimated using a Kc of 0.25 multiplied by ETo from the nearby weather station.

2.5. Soil Water Retention Characterization

Soil water characteristics previously reported by Miller and Ottman were used [27]. Soil bulk density was 1.48 g cm−3. Volumetric soil water content was 0.24 m3 m−3 at field capacity (θvFC), 0.085 m3 m−3 at permanent wilting point (θvPWP), and plant-available water (θvPAW) was 0.155 m3 m−3. The differences in soil water characteristics among depths were small and less than the standard error of these measurements, so values were averaged across depths.

2.6. Irrigation Treatments

The experiment included two irrigation treatments: high and low, hereon referred to as HI and LI respectively (Table 1). In both years, sprinkler irrigation was applied to both treatments until seedling emergence. Sprinkler irrigation was used to germinate the seed as it results in better stand establishment than flooding, where a soil crust often forms inhibiting seedling emergence. Flood irrigation was used during the season after emergence since the soil profile could be saturated with a single flood irrigation, whereas several sprinkle irrigation events would be required to do so to prevent surface runoff. The frequency of flood irrigations in the HI treatment was based on levels of soil water depletion (SWD), with irrigations occurring around 50% depletion or approximately every two weeks during mid-season, totaling 6 irrigations per season. In 2015, the LI treatment only received sprinkler irrigation and no subsequent flood irrigations due to high precipitation in December and January. In 2018, the LI treatment received one flood irrigation following emergence, and an additional flood irrigation at the five-leaf stage. The source of irrigation water was tertiary-treated municipal effluent.

2.7. Plant Measurements

Measurements of plant biomass and interception of photo synthetically active radiation (PAR) were taken throughout the season around five leaf, first node, boot, and flowering stages. Date of heading, flowering, and physiological maturity were recorded. Biomass samples were obtained from an area of two rows by a 45.7 cm cut at the base. Dry weight was assessed after samples had dried at 60 °C for 2 to 10 days depending on growth stage. Intercepted PAR was measured with a Sunfleck Ceptometer (Decagon Devices, Pullman, WA, USA). Measurements were taken within one hour of solar noon on clear days. Three averaged readings were taken at the soil surface within the canopy, along with companion measurements of incident PAR outside the influence of the canopy.
Heading date was recorded when 50% of the heads were past the leaf collar. Flowering date was recorded when 50% of heads had anthers extruded. Maturity date was noted when 50% of heads and peduncle had changed to tan color.
At harvest, biomass yield, height, and lodging were assessed as well as grain yield, test weight, and seed weight. Plant height was averaged from 10 heads. For final biomass yield, 1 m2 of whole barley plants were hand-harvested and dried at 60 °C. Grain weight was assessed from the 1 m2 sample. For final grain yield, 5 rows by 1.5 m were hand-harvested and threshed. Clean seed was assessed for test weight and seed weight.

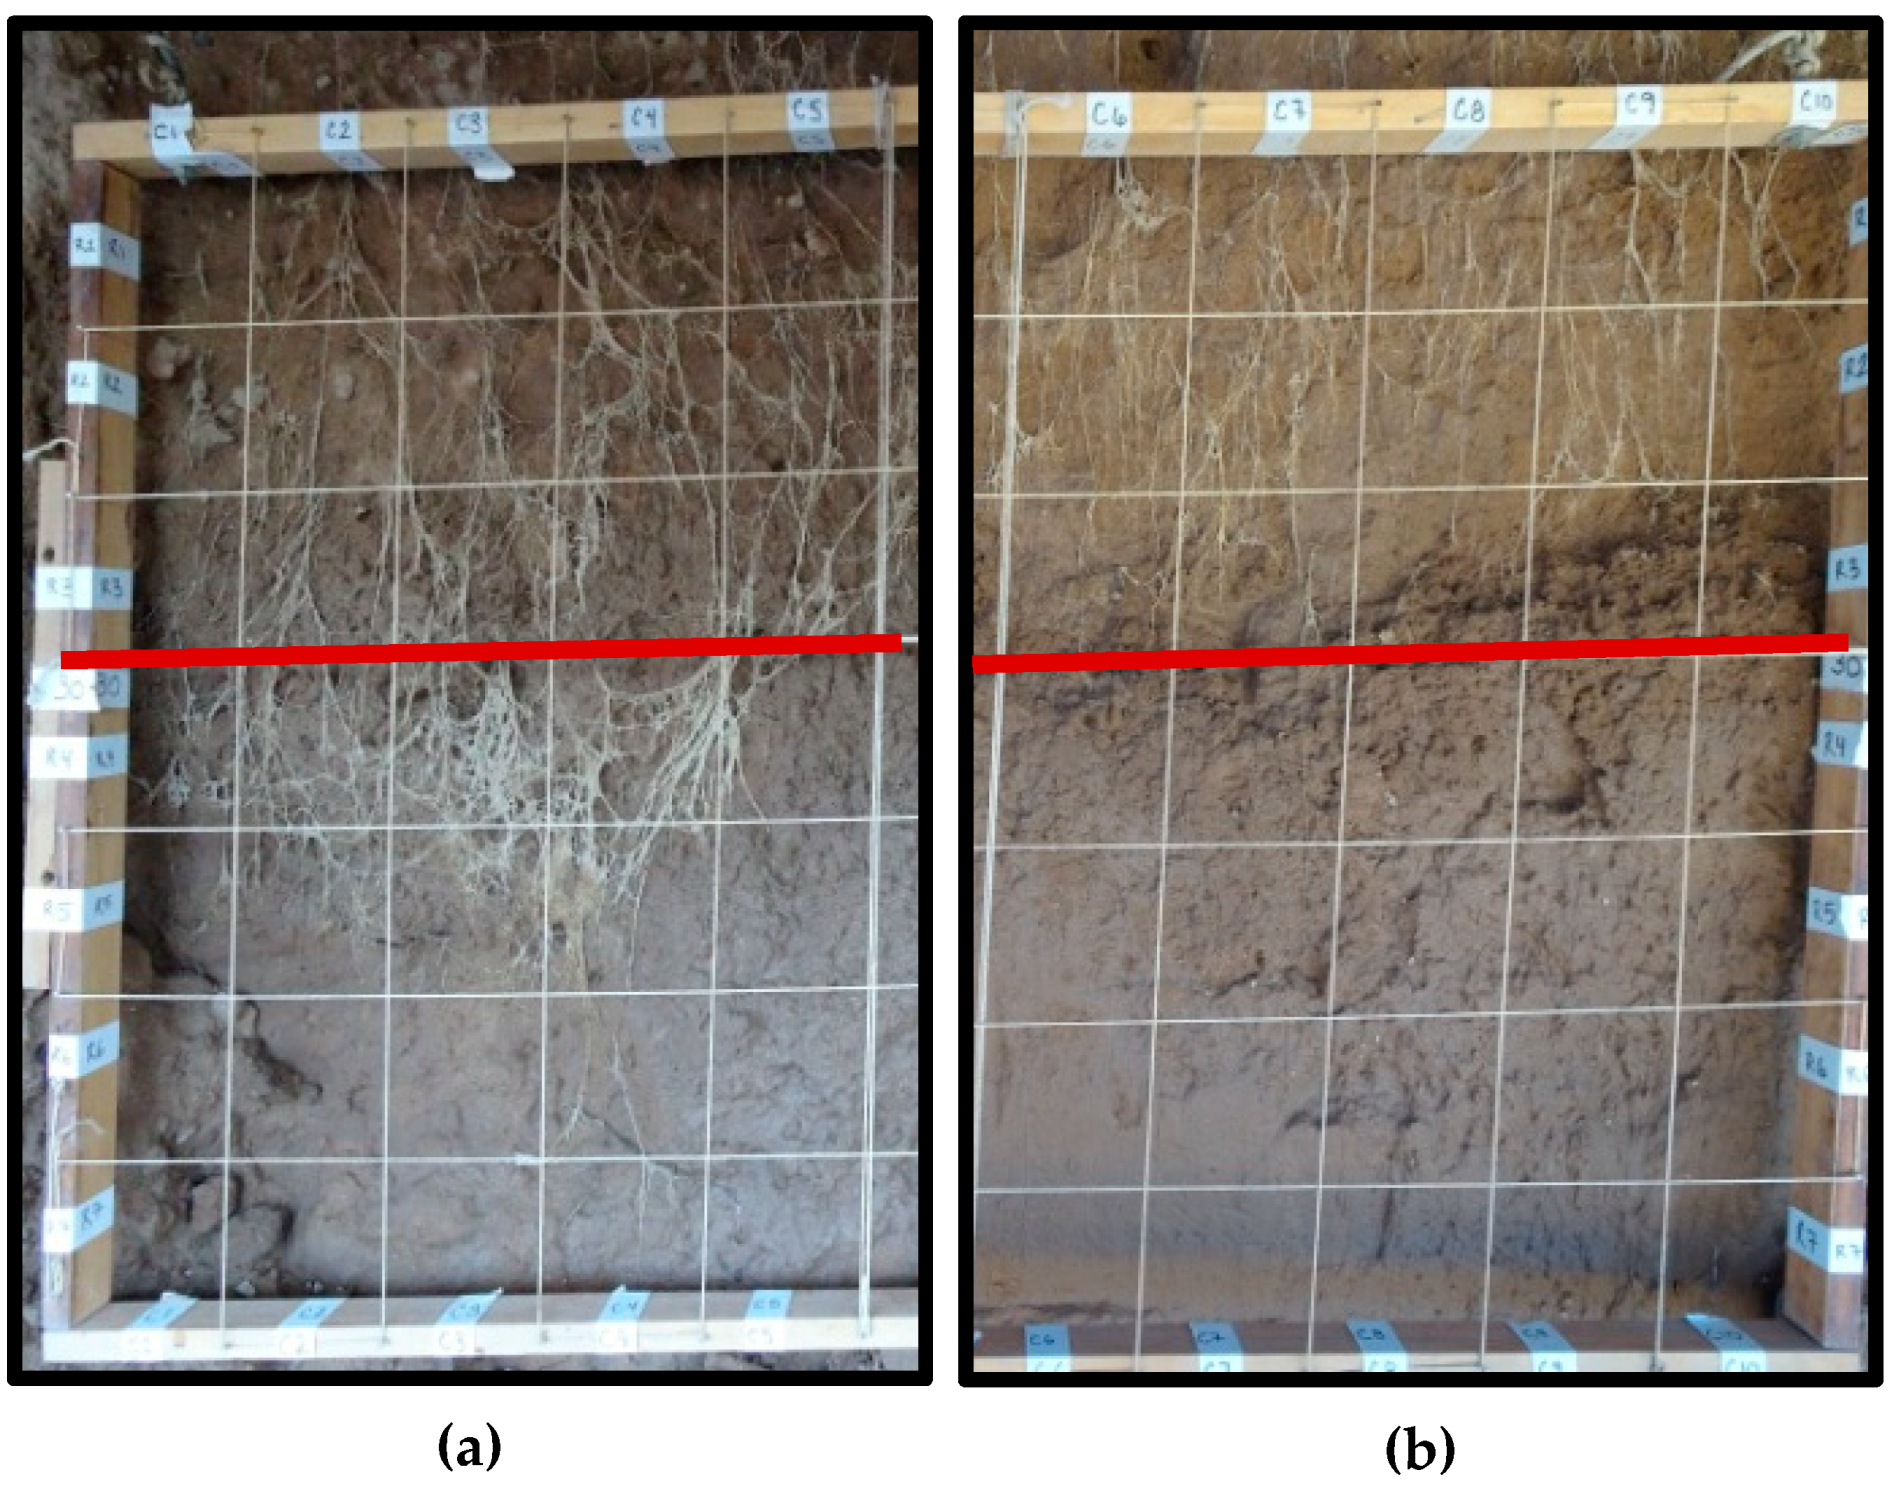
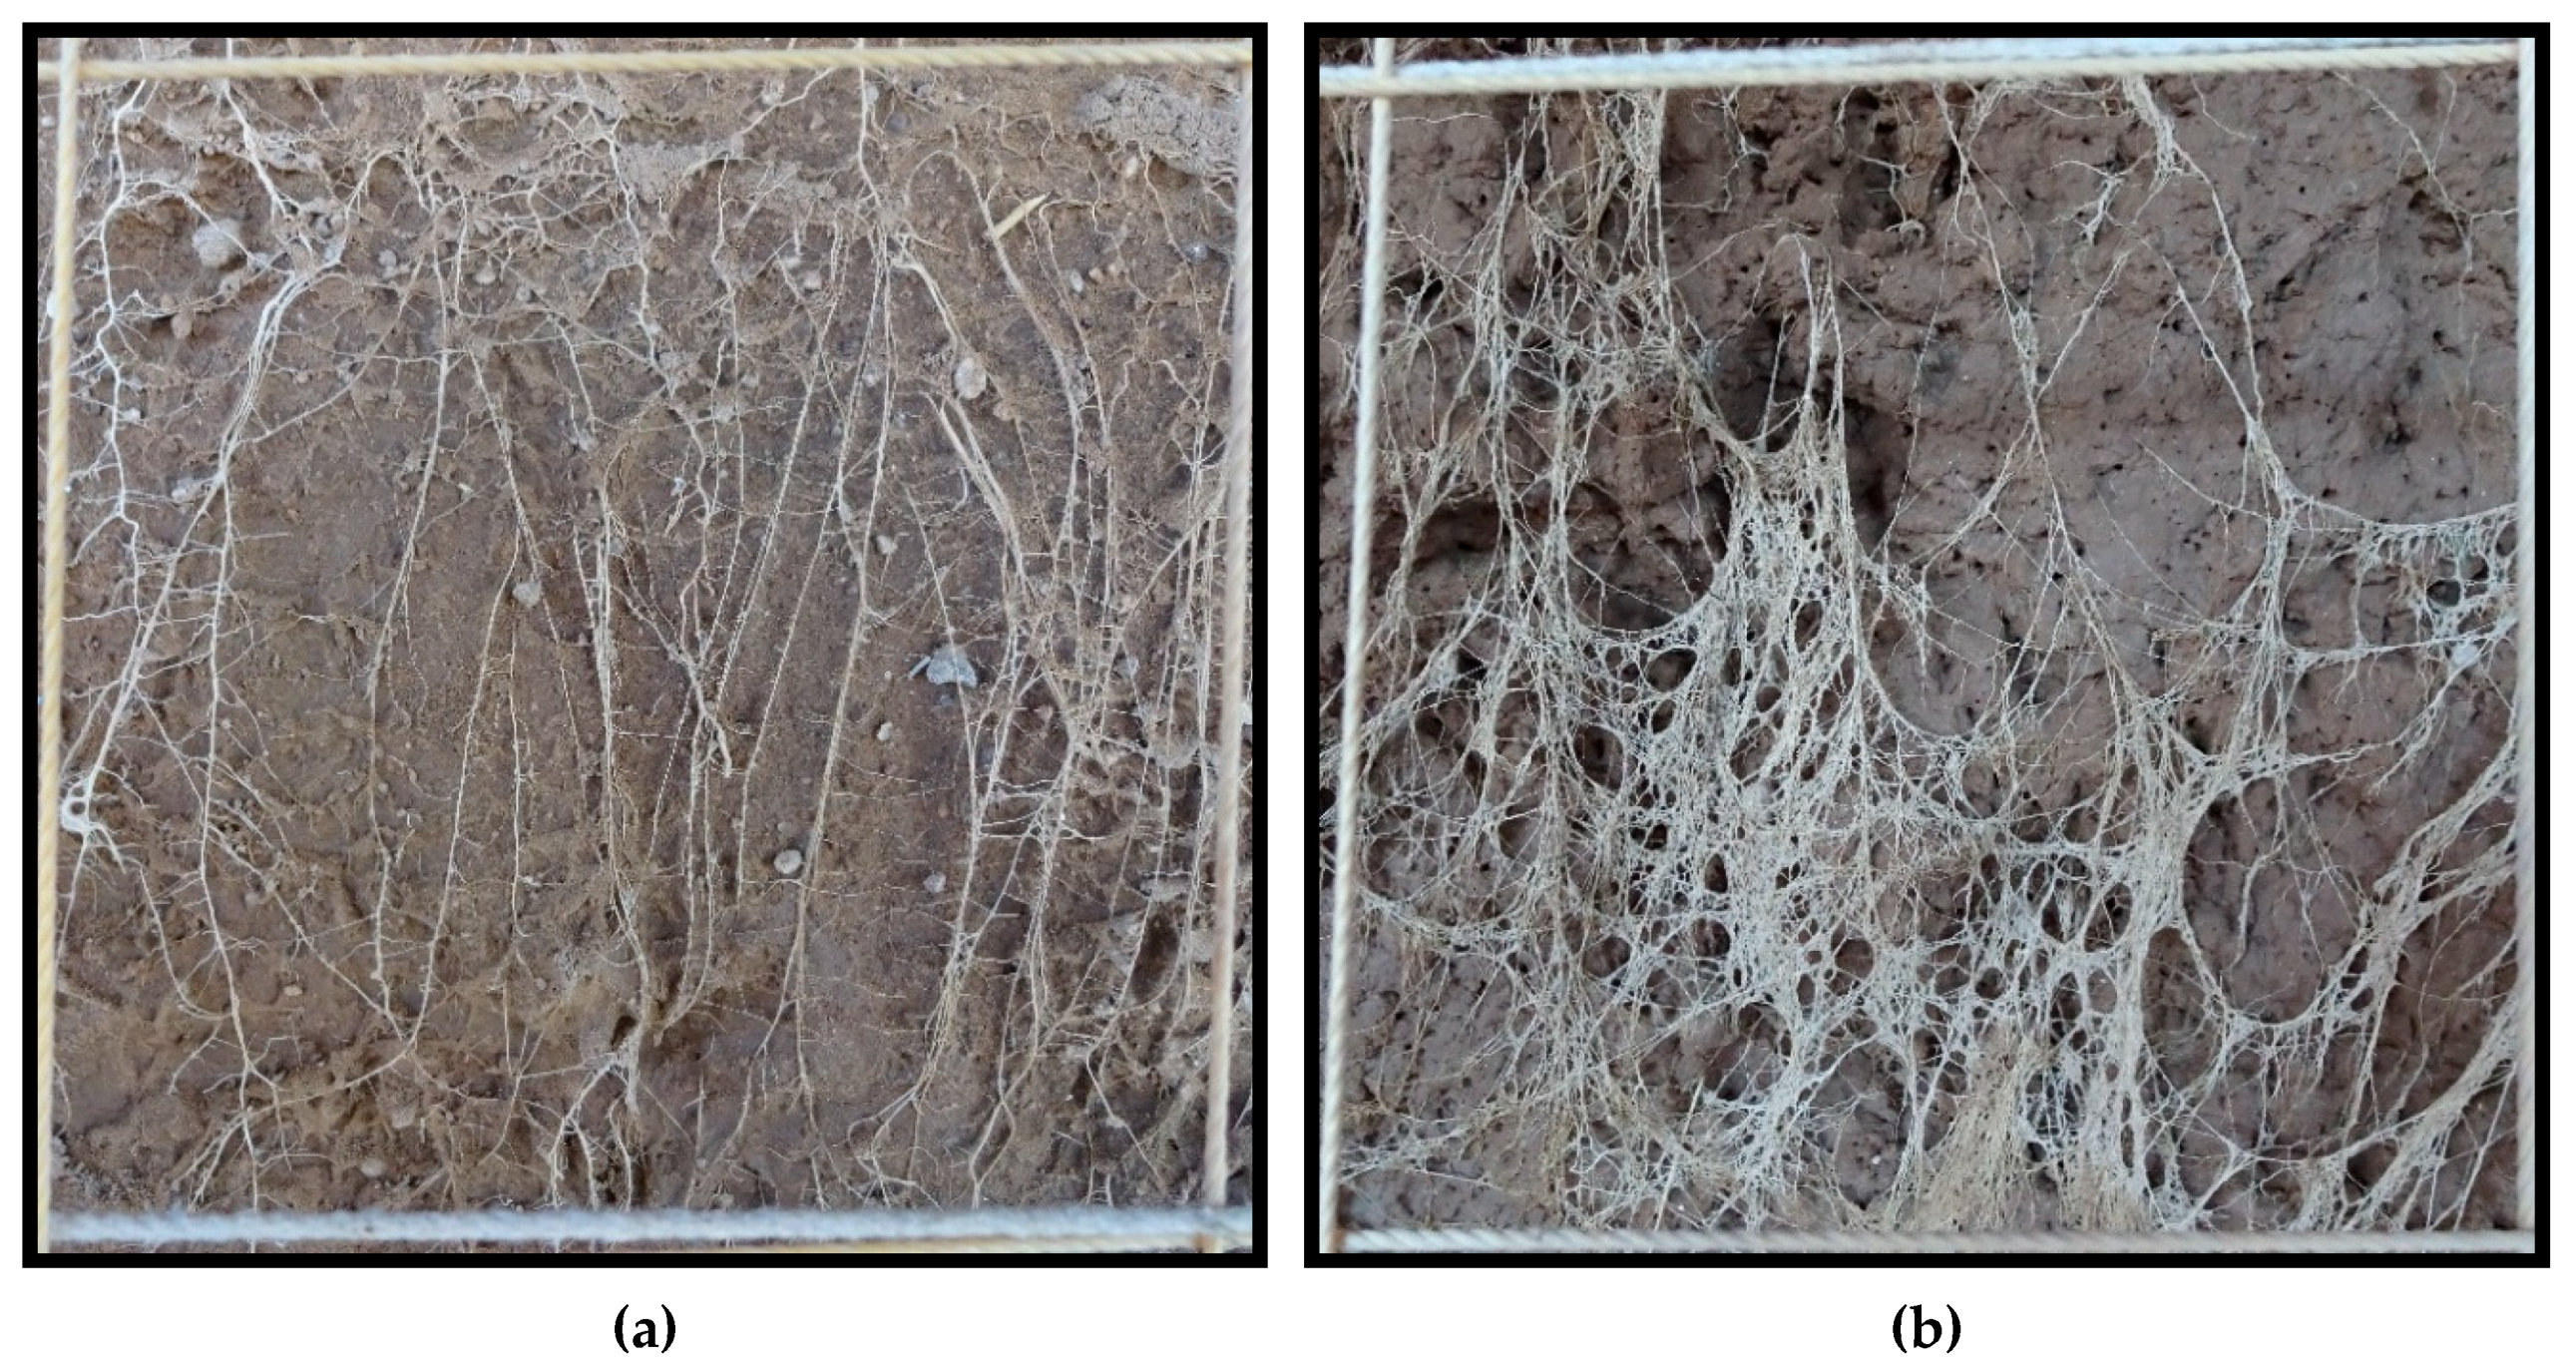
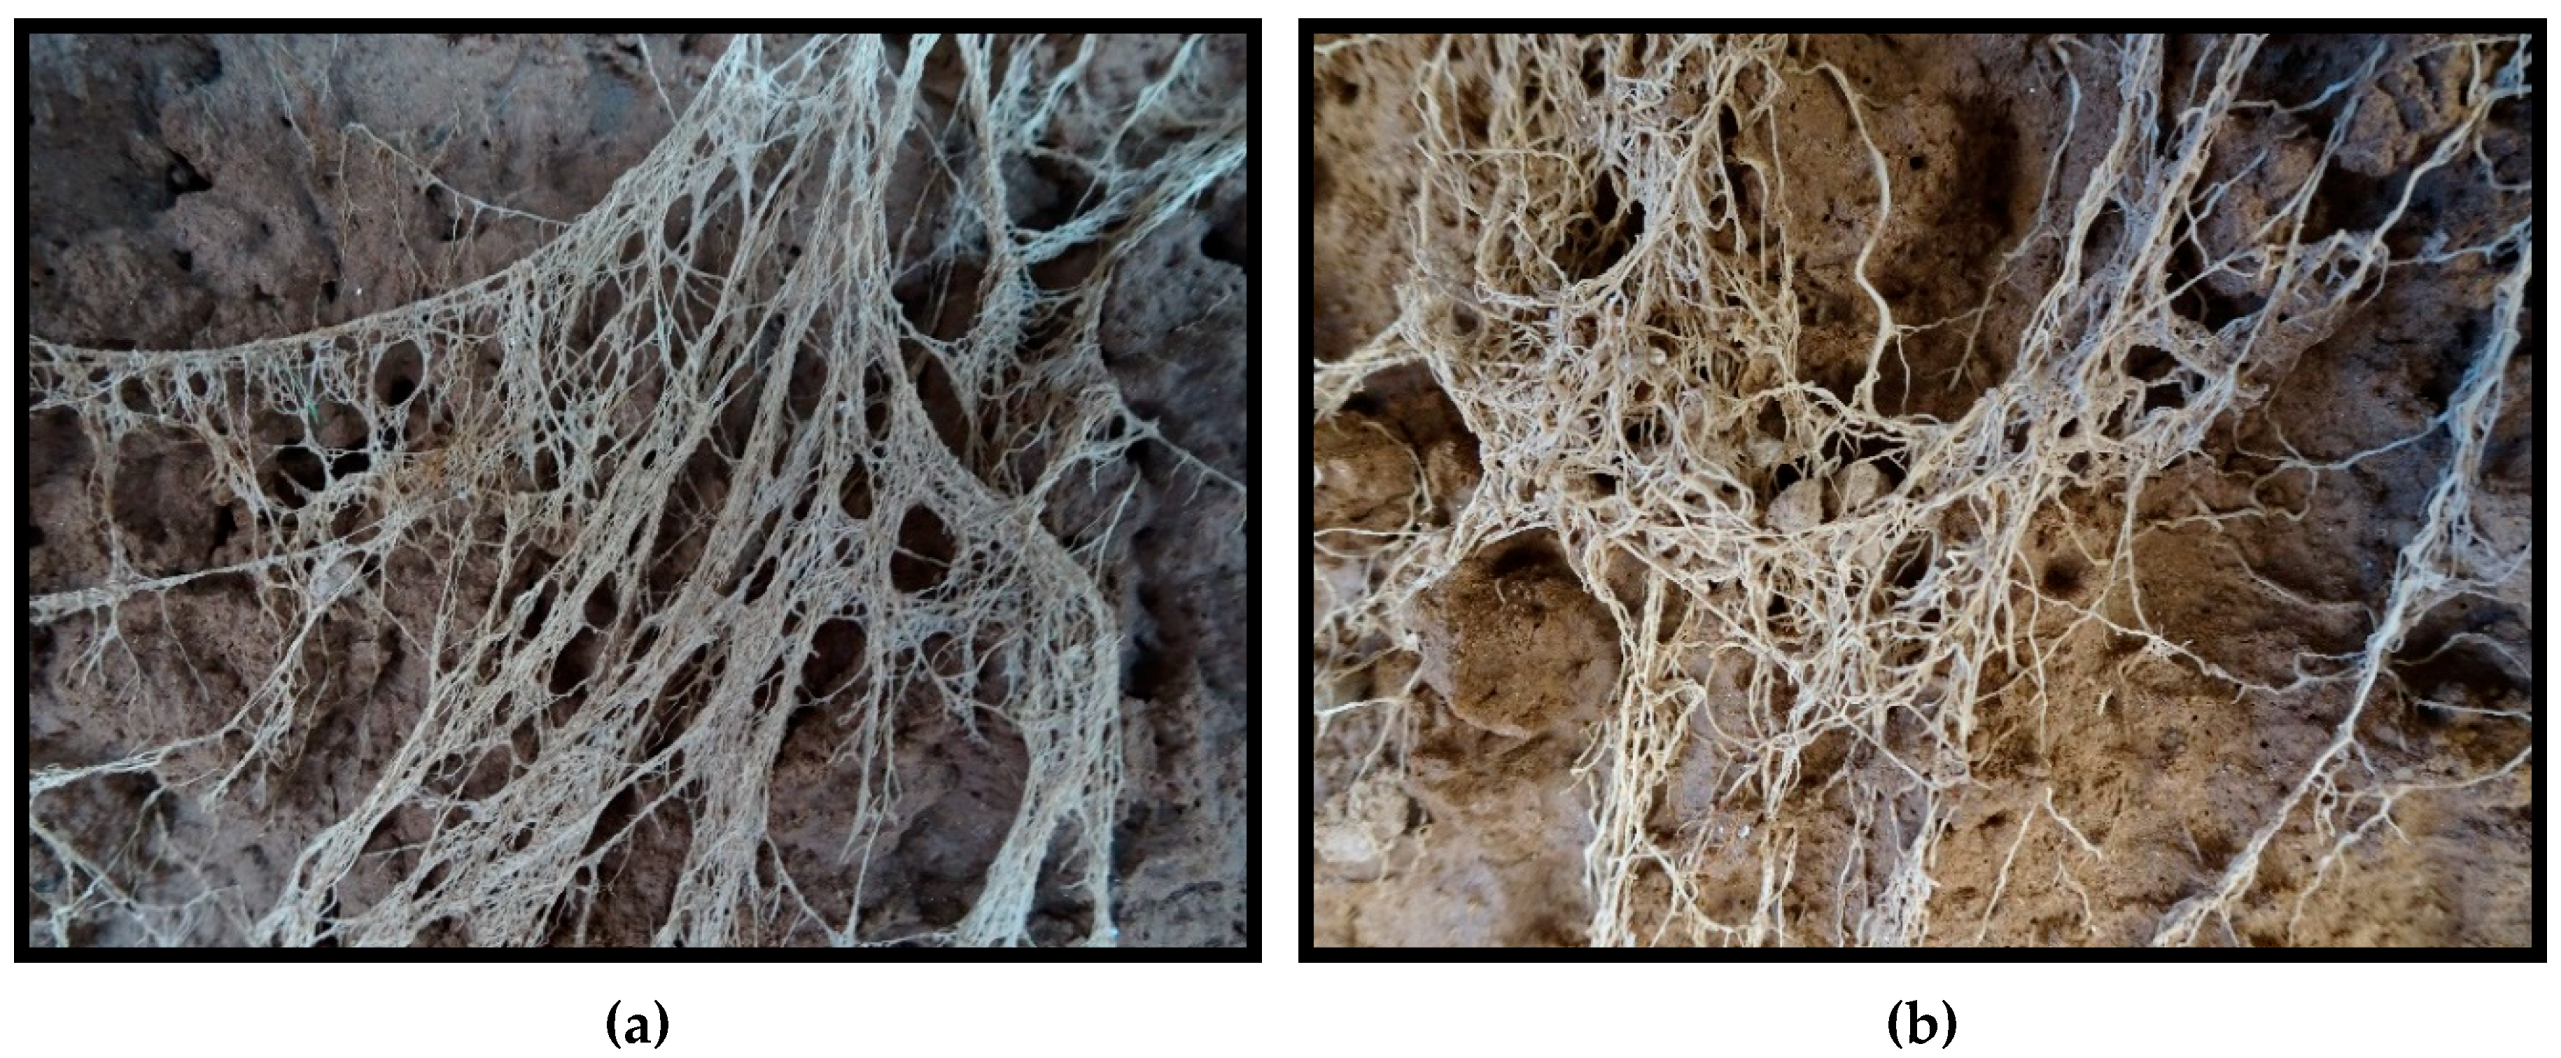
2.8. Method of Root Analysis

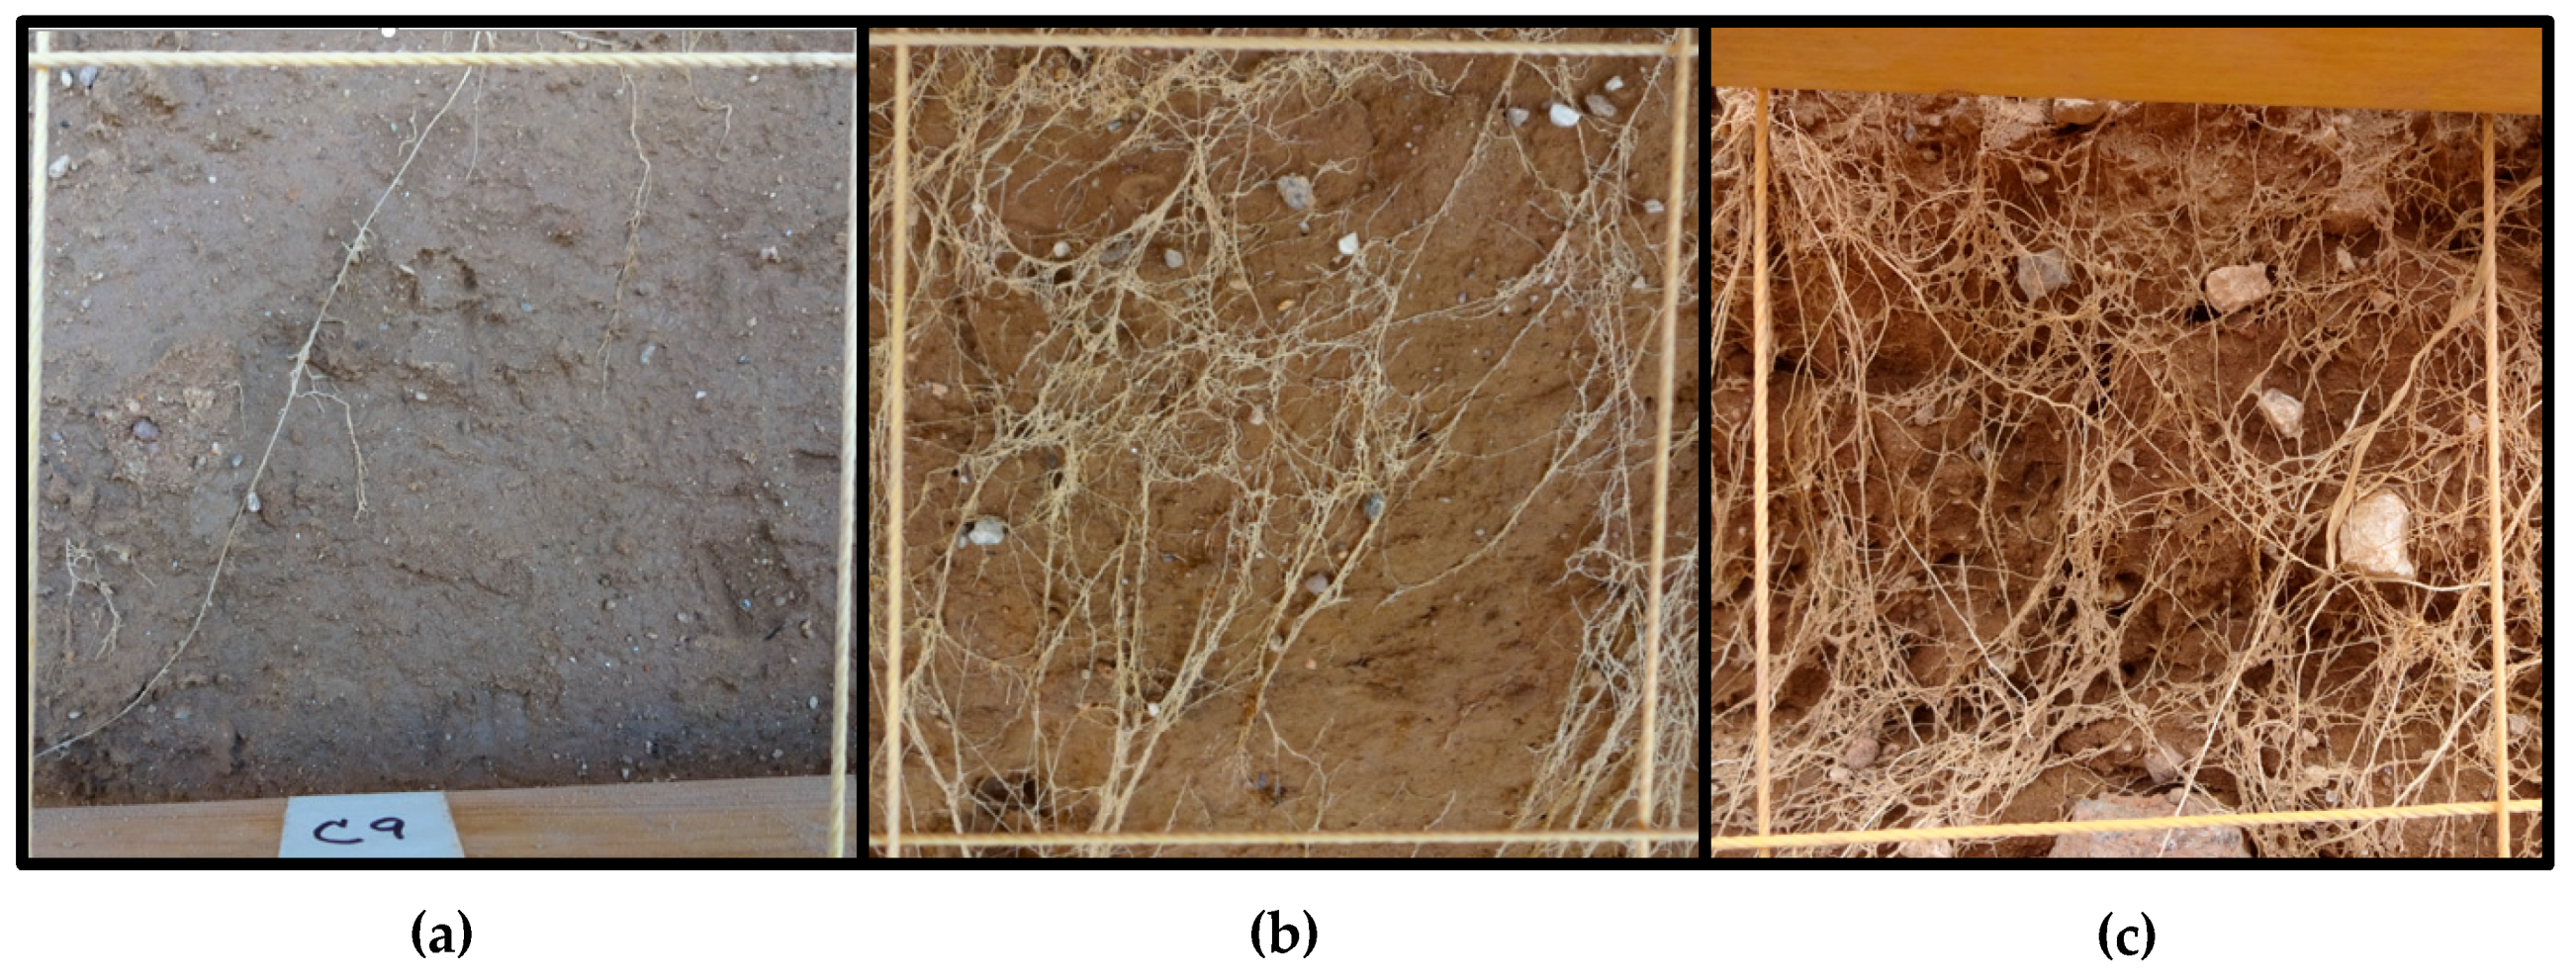
Root density at physiological maturity was assessed using the profile wall method. A 1.8-m deep trench traversing the plots was dug with a back-hoe, taking care to create a vertical, flat profile, that was later smoothed with a shovel. The profile wall was washed slowly with water using a fanned spray nozzle to expose the roots. For each variety under both irrigation treatments, the density of roots within 10 cm × 10 cm grids were rated on a scale of 1 to 10 along the total profile (100-cm wide by 180-cm deep). For example, a rating of 1 was given when 1 to 2 roots were present in the grid square, a rating of 5 was given when approximately 50 percent of the grid square was filled with roots, and a rating of 10 was scored when roots filled the majority of the grid square. See Figure 1 for examples of root ratings.
In 2018, a 6-mm thick plexiglass sheet measuring 1.2 m × 0.85 m was placed flush against each profile wall and buried early in the season. The intention was to have the roots grow up to the plexiglass and be observable without washing, however, washing was still required. Placement of the plexiglass did create a flat soil surface for when the root profile wall was dug and greatly facilitated the process of washing away the soil.

2.9. Statistical Analysis

The data was analyzed by SAS version 9.4 using the PROC GLM procedure, except for water use which was analyzed using the PROC MIXED procedure, and the root profile wall data which was analyzed using SPSS version 25 with the GLM procedure.

2.10. Weather

Weather data was recorded by the Arizona Meteorological Network (AZMET) Campus Agricultural Center weather station, located about 0.5 km from the experimental plots. See Table 2 for growing season temperature, precipitation, and ETo.

3. Results

3.1. Light Interception

Fraction of photosynthetically active radiation (fPAR) intercepted by the crop differed among varieties depending on irrigation treatment and year (Table 3). Under HI in 2015, fPAR was higher for the high-input varieties at first and last sampling, and in 2018 there was no difference between groups. Under LI in 2015, fPAR was also greater for the high-input varieties at all sampling times. Conversely, under LI in 2018, the low-input varieties had higher fPAR at all measurement times. High precipitation during the beginning of the 2015 growing season may explain the improved performance of the high-input varieties under low irrigation conditions for this year. In 2015, in Dec–Jan, there was 122 mm of precipitation, compared to 14 mm in 2018 and the 33-year average of 44 mm at the field location.

3.2. Plant Growth and Biomass Accumulation

Biomass yield differed among varieties depending on irrigation treatment (Table 4). Under HI in 2015, biomass yield did not differ between nor within groups except at the first sampling time in which the high-input varieties had greater biomass than the low-input varieties. Under HI in 2018, biomass yield did not differ between groups except at the last sampling time in which the low-input varieties outperformed the high-input varieties. Under LI in 2015, the high-input varieties had higher biomass at the first two sampling dates, possibly due to unusually high precipitation, but the low-input varieties had higher biomass at the last sampling date. Under LI in 2018, the low-input varieties had higher biomass at all but one of the sampling times.

3.3. Phenology

All varieties progressed faster under LI (Table 5). As a group, under HI, the low-input varieties flowered five days earlier in 2015, and eight days earlier in 2018 than the high-input varieties. Under LI, the low-input varieties flowered two days earlier in 2015 and four days earlier in 2018 compared to the high-input varieties. Similarly, under HI, compared to the high-input varieties, the low-input varieties reached physiological maturity (PM) eight and nine days earlier in 2015 and 2018, respectively. Under LI, the low-input varieties reached PM nine and six days earlier in 2015 and 2018, respectively.
Another phenological difference observed was time between heading and flowering. Under HI, all varieties flowered one to two days after heading. Under LI, however, the high-input varieties flowered 0 to 1 days after heading while the low-input varieties maintained the one to two-day interval observed under HI. A shortened heading to anthesis interval, observed both years, may be a sign of stress response in “Cochise” and “Kopious”.

3.4. Final Yield Components

Yield and yield components differed among varieties depending on irrigation treatment, variety, and year (Table 6 and Table 7). For the HI treatment in 2015 and 2018, high-input varieties had higher total yield and grain yield compared to low-input varieties. Differences between test weight were not significant. Under HI, harvest index was similar between groups in 2015 but higher for the high-input varieties in 2018. In contrast, under LI in 2015 and 2018, low-input varieties had higher grain yield and test weight. “Solar” was the only variety to meet or surpass the minimum test weight (605 kg m−3) to be qualified as Grade 1 barley based on standards set by the Federal Grain Inspection Service of the US [28]. Harvest index was also higher for the low-input group in 2015 but not significantly different in 2018. Total yield did not differ between groups under LI either year; however, “Solar” had the highest and “Cochise” the lowest total yield of all varieties. Kernel weight and plant height were higher for the low-input varieties under both LI and HI treatments in both years. Percent of lodging was higher for the low-input varieties in 2015 under HI and LI. Between the low-input varieties, “Solar” lodged significantly less. In 2018, lodging was minimal. Lastly, under LI the average height of the semi-dwarf varieties (69 cm in 2015 and 59 cm in 2018) was below optimal height for mechanical harvest (typically 76 cm to 86 cm) [29].

3.5. Root Traits

A comparison of root growth by each variety under HI verse LI shows that the high-input varieties had more root growth under HI than they did under LI, especially in the top 0–30 cm (Figure 2). Conversely, the low-input varieties had more root growth under LI than HI especially from 40–80 cm depth. The low-input varieties also had higher average root growth compared to high-input varieties in both years under LI (Figure 3). In 2015, “Solum” had significantly more roots than the other varieties from 0–100 cm and in 2018 “Solar” had significantly more roots than the other varieties from 50–90 cm. Under HI, there was no difference in average root growth between varieties; however, “Kopious” had more roots than the other varieties at 40–50 cm depth in 2015, and in 2018, “Cochise” had more roots than the other varieties at 20–30 cm depth.
Observations from the root profile showed dramatic differences in rooting between varieties, especially at depth. (Figure 4). The profile also revealed that under LI, “Solar” and “Solum” roots were able to penetrate through a hard caliche layer starting at 70 cm to 80 cm depth (Figure 5). Caliche is a hardened, naturally cemented deposit of calcium carbonate common in the soils of arid regions. In addition, under HI, roots of all varieties generally appeared thinner and less aggregated than roots under LI which appeared thicker and often formed a webbed, mesh-like conglomeration (Figure 6). Roots of the low-input varieties showed this webbed phenotype more often than the high-input varieties; however, as Figure 7 shows, they too sometimes formed this root morphology.

3.6. Water Use

Total cumulative water use was generally similar between varieties under both high and low irrigation in 2015 and 2018, with the exception of “Cochise” under HI in 2018, using significantly more water than the other varieties (Figure 8). “Cochise” began using more water than the other varieties post-anthesis, approximately 100 days after planting. However, general trends of cumulative water use by growth stage, show that the high-input varieties use more water pre-anthesis while the low-input varieties use more water post-anthesis (Table 8).

4. Discussion

4.1. Early Vigor

Defined by fast leaf area development and biomass accumulation, early seedling vigor is associated with greater leaf area, and thus, greater incident light interception [30,31]. Our results show higher light interception by the low-input varieties under LI at all sampling times in 2018, but not 2015, which may have been due to high rainfall during the early 2015 season. Higher fPAR at the beginning of the 2018 season suggests early vigor in the low-input varieties under LI when considering fPAR as a proxy for leaf area.
Similar to the fPAR results, biomass was also greater for the low-input varieties under LI at first sampling in 2018. Greater early season growth is particularly useful under drought conditions as ground cover and canopy shading serve to reduce evaporation from the soil surface, increasing available water for transpiration and crop growth [32,33].

4.2. Early Flowering and Maturity

The importance of early flowering/heading as a drought escape mechanism has been extensively reported on, as have positive correlations between earliness and grain yield under drought stress in cereals [34,35]. In this study, early flowering and maturity were observed in the varieties bred for low irrigation conditions and correlated with higher grain yield under LI. Under HI, early maturity was negatively correlated with grain yield.

4.3. Root Length Density, Depth, and Penetration

Greater average root length density and deeper roots of “Solar” and “Solum” under LI correlated with higher grain yield. Similar results have been reported in other studies in which deeper rooted genotypes had higher grain yield under drought stress [36,37,38,39,40,41]. The observation from the root profile that “Solar” and “Solum” roots were able to penetrate through a caliche layer starting at 70 cm depth is noteworthy. Mechanical impedance is a major limiting factor of root growth [42]. Cereal cultivars better able to penetrate hard pans have been shown to have deeper root growth and better access to water [43,44,45]. Many of the studies on root penetration ability have been conducted in pot experiments with artificially compacted soil. The use of root profile walls in this experiment allowed for in-field visual documentation of roots growing through hard soil.

4.4. Plant Height and Lodging Resistance

Though dramatic gains in grain yield were achieved through the development of semi-dwarf cereals, in cases of severe water deficit, they may be too short for mechanical harvest, or less economically profitable in areas where straw used as animal feed is an important commodity, e.g., West Asia and North Africa [46]. A multisite study by Silva Lopes et al. [47] found plant height was significantly and positively associated with grain yield in the most low-yielding, rainfed environments. The results from this study found the taller varieties, “Solar” and “Solum” outperformed the semi-dwarf cultivars in grain yield under LI. The low-input varieties were also able to maintain similar plant height under LI as that under HI which is indicative of their drought tolerance [13]. Moreover, under LI the average height of the semi-dwarf varieties (69 cm in 2015 and 59 cm in 2018) was below optimal height for mechanical harvest (typically 76 to 86 cm) [29].
As expected, the semi-dwarf varieties had significantly less lodging than the standard-height varieties, particularly under HI. “Solar” demonstrated significantly less lodging than its predecessor “Solum”, as it was bred to do [25]. Bending strength or stiffness has been associated with root penetration of hard soils [48]. The improved lodging resistance of Solar may somehow be related to the ability of Solar roots to better penetrate through drying/hard soil.

4.5. Effective Use of Water

Effective use of water (EUW) describes maximizing soil water capture for assimilate partitioning to reproduction [49]. Effective use of water was demonstrated through early vigor and higher harvest index of the low-input varieties under LI. In addition, under both irrigation treatments cumulative water use over the season was the same between all the varieties tested, indicating those bred for low-water use environments had greater grain yield per unit water use under LI. The observation that the low-input varieties use less water pre-anthesis and more water post-anthesis under drought conditions suggest they may employ a water conservation technique such as early vigor to ensure water is still available during the critical grain filling period or have a means of accessing more water during this period, such as the rooting traits of “Solar” and “Solum”. A study by Siddique et al. [50] similarly found early flowering genotypes of wheat exhibiting early vigor had lower rates of soil evaporation early in the season and used a greater ratio of water post-anthesis than pre-anthesis.

4.6. Future Research

Given the extensive time and labor required for root profile analysis, future research could explore how to improve the efficiency, effectiveness, and replicability of this method to better study roots in realistic soil environments. Real time monitoring of water use may reveal interesting patterns undetectable by the neutron probe. Further exploration of differences in root morphology and traits associated with water usage would help to further our understanding of drought tolerance.

5. Conclusions

Though debate exists regarding whether selection under optimal or stress conditions is preferable when breeding for drought tolerance, the results of this study show the varieties bred for low-water conditions had greater grain yield and test weight under LI than varieties bred for high-water-use conditions. Advantageous traits under HI conditions were associated with poorer performance under drought stress, specifically later maturity, shallow root systems, and less water-use post-anthesis. Observed strategies of drought tolerance in this study included early vigor, early flowering, greater root density at depth, and greater water extraction post-anthesis. The root profile pit addressed the need for root studies conducted in realistic environments and revealed insights difficult to capture with other field-based methods.

Author Contributions

All authors contributed to conceptualization, methodology, validation, writing, and investigation.

Funding

Funding for this study was received in part by the Arizona Grain Research and Promotion Council

Acknowledgments

We thank Mary Comeau and Said Attalah for their diligent field and processing assistance as well as Carl Schmalzel for his tremendous help with the soil profile. We also thank Stephen Hussman and the staff of the University of Arizona Campus Agriculture Experiment Station in Tucson as well as the Alfred P. Sloan Foundation. Lastly, thanks and acknowledgment to Sergio Matias for his technical support.

Conflicts of Interest

The authors declare no conflict of interest.

References

  1. Cassman, K.; Dobermann, A.; Walters, D.; Yang, H. Meeting cereal demand while protecting natural resources and improving environmental 1uality. Annu. Rev. Env. Resour. 2003, 28, 315. [Google Scholar] [CrossRef]
  2. Ceccarelli, S.; Grando, S.; Maatougui, M.; Michael, M.; Slash, M.; Haghparast, R.; Rahmanian, M.; Taheri, A; Al-Yassin, A.; Benbelkacem, A.; et al. Plant breeding and climate changes. J. Agri. Sci. 2010, 148, 627–637. [Google Scholar] [CrossRef]
  3. Fita, A.; Rodriguez-Burruezo, A.; Boscaiu, M.; Prohens, J.; Vicente, O. Breeding and domesticating crops adapted to drought and salinity: A new paradigm for increasing food production. Front. Plant Sci. 2015, 6, 978. [Google Scholar] [CrossRef] [PubMed]
  4. Reynolds, M.; Langridge, P. Physiological breeding. Curr. Opin. Plant Biol. 2016, 31, 162–171. [Google Scholar] [CrossRef] [PubMed]
  5. Ramos, J.M.; Garcia Del Moral, L.F.; Recalde, L. Vegetative growth of winter barley in relation to environmental conditions and grain yield. Agri. Sci. 1985, 104, 413–419. [Google Scholar] [CrossRef]
  6. Wahbi, A.; Gregory, P.G. Genotypic differences in root and shoot growth of barley (Hordeum Vulgare). II. Field studies of growth and water use of crops grown in Northern Syria. Exp. Agri. 1989, 25, 389–399. [Google Scholar]
  7. Villegas, D.; Aparicio, N.; Blanco, R.; Royo, C. Biomass accumulation and main stem elongation of durum wheat grown under Mediterranean conditions. Ann. Bot. 2001, 88, 617–627. [Google Scholar] [CrossRef]
  8. López-Castañeda, C. Variation in grain yield, biomass and grain number of barely under drought. Trop. Subtrop. Agroecosys. 2011, 14, 907–918. [Google Scholar]
  9. Cooper, P.J.M.; Gregory, P.J.; Tully, D.; Harris, H.C. Improving water use efficiency of annual crops in rainfed farming systems of West Asia and North Africa. Exp. Agri. 1987, 23, 113–158. [Google Scholar] [CrossRef]
  10. López-Castañeda, C.; Richards, R.A. Variation in temperate cereals in rainfed environments III. Water use and water-use efficiency. Field Crops Res. 1994, 39, 85–98. [Google Scholar]
  11. Vandenboogaard, R.; Veneklaas, E.J.; Lambers, H. The association of biomass allocation with growth and water use efficiency of two Triticum aestivum cultivars. Aust. Plant Physiol. 1996, 23, 751–761. [Google Scholar]
  12. Passioura, J.B. Grain yield, harvest index and water use of wheat. Aust. Inst. Agri. Sci. 1977, 43, 117–120. [Google Scholar]
  13. Blum, A. Phenotyping and Selection. In Plant Breeding for Water-Limited Environments; Springer Science: New York, NY, USA, 2011; pp. 153–193. [Google Scholar]
  14. Richards, R.; Hunt, J.; Kirkegaard, J.; Passioura, J. Yield improvement and adaptation of wheat to water-limited environments in Australia—A case study. Crop Pasture Sci. 2014, 65, 676–689. [Google Scholar] [CrossRef]
  15. Turner, N. Further progress in crop water relations. Adv. Agron. 1996, 58, 293–338. [Google Scholar]
  16. Araus, J.L.; Slafer, G.A.; Reynolds, M.P.; Royo, C. Plant breeding and drought in C 3 Cereals: What should we breed for? Ann. Bot. 2002, 89, 925–940. [Google Scholar] [CrossRef]
  17. Lynch, J. Roots of the second green revolution. Aust. Bot. 2007, 554, 93–512. [Google Scholar] [CrossRef]
  18. Wasson, A.P.; Richards, R.A.; Chatrath, R.; Misra, S.C.; Prasad, S.V.S.; Rebetzke, G.J.; Kirkegaard, J.A.; Christopher, J.; Watt, M. Traits and selection strategies to improve root systems and water uptake in water-limited wheat crops. Exp. Bot. 2012, 63, 3485–3498. [Google Scholar] [CrossRef]
  19. Clark, L.J.; Whalley, W.R.; Barraclough, P.B. How do roots penetrate strong soil? Plant Soil 2003, 255, 93–104. [Google Scholar] [CrossRef]
  20. Colombi, T.; Torres, L.C.; Walter, A.; Thomas, K. Feedbacks between soil penetration resistance, root architecture and water uptake limit water accessibility and crop growth—A vicious circle. Total Environ. 2018, 626, 1026–1035. [Google Scholar] [CrossRef]
  21. Shephard, K.D.; Cooper, P.J.M.; Allan, A.Y.; Dreunan, D.S.H.; Keating, J.D.H. Growth, water use and yield of barley in Mediterranean-type environments. J. Agric. Sci. 1987, 8, 365–378. [Google Scholar] [CrossRef]
  22. Van Oosterom, E.J.; Acevedo, E. Adaption of barley (Hordeurn vulgare L.) to harsh mediterranean environments. I. Morphological traits. Euphyrica 1992, 62, 1–14. [Google Scholar] [CrossRef]
  23. Villegas, D.; Aparicio, N.; Nachit, M.; Araus, J.; Royo, C. Photosynthetic and developmental traits associated with genotypic differences in durum wheat yield across the Mediterranean basin. Crop Pasture Sci. 2000, 51, 891–901. [Google Scholar] [CrossRef]
  24. Ramage, R.T.; Thompson, R.K. Release notice of composite cross XXXIX. Barley Newsl. 1981, 24, 89–90. [Google Scholar]
  25. Ottman, M.J. Release of ‘Solar’ a Six-Rowed Spring Barley Bred for Reduced Water Use Environments; University of Arizona Agriculture Experiment Station: Tucson, AZ, USA, 2006. [Google Scholar]
  26. Ramage, R.T.; Thompson, R.T.; Eslick, E.P. Release of Composite Cross XXXII. Barley Newsl. 1976, 19, 9–11. [Google Scholar]
  27. Miller, A.; Ottman, M. Irrigation frequency effects on growth and ethanol yield in sweet sorghum. Agronomy 2010, 102, 60–70. [Google Scholar] [CrossRef]
  28. Federal Grain Inspection Service. United States Standards for Barley. United States Department of Agriculture, 2019. Available online: https://www.ecfr.gov/cgi-bin/text-idx?SID=fe4fd2c7d0fa6785babbf474d740c155&mc=true&node=se7.7.810_1206&rgn=div8 (accessed on 1 February 2019).
  29. Kline, M.A. Management considerations for relay intercropping: I. Wheat. Purdue University Cooperative Extension Service Agronomy Guide. 2003, 314. Available online: https://mdc.itap.purdue.edu/item.asp?itemID=20202 (accessed on 15 January 2019).
  30. Monteith, J.L. Validity of the correlation between intercepted radiation and biomass. Agri. Forest Meteor. 1994, 68, 213–220. [Google Scholar] [CrossRef]
  31. Lopez-Castaneda, C.; Richards, R.; Farquhar, G. Variation in early vigor between wheat and barley. Crop Sci. 1995, 32, 472–479. [Google Scholar] [CrossRef]
  32. Blum, A. Drought resistance—is it really a complex trait? Funct. Plant Biol. 2011, 38, 753–757. [Google Scholar] [CrossRef]
  33. Gregory, P.J.; Tennant, D.; Belford, R.K. Root and shoot growth, and water and light use efficiency of barley and wheat crops grown on a shallow duplex soil in a meditrranean-type environment. Aust. J. Agri. Res. 2007, 58, 303–315. [Google Scholar] [CrossRef]
  34. Acevedo, E.; Craufurd, P.; Austin, R.; Perezmarco, P. Traits associated with high-yield in barley in low-rainfall environments. J. Agri. Sci. 1991, 116, 23–36. [Google Scholar] [CrossRef]
  35. Shakhatreh, Y.; Kafawin, O.; Ceccarelli, S.; Saoub, H. Selection of Barley Lines for Drought Tolerance in Low-Rainfall Areas. J. Agron. Crop Sci. 2001, 186, 119–127. [Google Scholar] [CrossRef]
  36. Chloupek, O.; Dostál, V.; Středa, T.; Psota, V.; Dvořáčková, O. Drought tolerance of barley varieties in relation to their root system size. Plant Breed. 2010, 129, 630–636. [Google Scholar] [CrossRef]
  37. Palta, J.; Watt, M. Vigorous Crop Root Systems: Form and Function for Improving the Capture of Water And Nutrients; Elsevier: Amsterdam, The Netherlands, Chapter 13; 2009; pp. 309–325. [Google Scholar]
  38. Lopes, M.; Reynolds, M. Drought adaptive traits and wide adaptation in elite lines derived from resynthesized hexaploid wheat. Crop Sci. 2011, 51, 1617–1626. [Google Scholar] [CrossRef]
  39. Al-Ajlouni, Z.I.; Al-Abdallat, A.M.; Al-Ghzawi, A.L.A.; Ayad, J.Y. Impact of pre-anthesis water deficit on yield and yield components in barley (Hordeum vulgare L.) plants grown under controlled conditions. Agronomy 2016, 6, 33–46. [Google Scholar] [CrossRef]
  40. Kirkegaard, J.A.; Lilley, J.M.; Howe, G.N.; Graham, J.M. Impact of subsoil water use on wheat yield. Aust. J. Agric. Res. 2007, 58, 303–315. [Google Scholar] [CrossRef]
  41. Lopes, M.; Reynolds, M. Partitioning of assimilates to deeper roots is associated with cooler canopies and increased yield under drought in wheat. Funct. Plant Biol. 2010, 37, 147–156. [Google Scholar] [CrossRef]
  42. Lynch, J.P.; Chimungu, J.G.; Brown, K.M. Root anatomical phenes associated with water acquisition from drying soil: Targets for crop improvement. J. Exp. Botany 2014, 65, 6155–6166. [Google Scholar] [CrossRef] [PubMed]
  43. Cairns, J.; Audebert, E.; Townend, A.; Price, A.; Mullins, C. Effect of soil mechanical impedance on root growth of two rice varieties under field drought stress. Plant Soil 2004, 267, 309–318. [Google Scholar] [CrossRef]
  44. Kubo, K.I.; Yanagisawa, K.A. Genotypic variation of the ability of root to penetrate hard soil layers among Japanese wheat cultivars. Plant Product. Sci. 2006, 9, 47–55. [Google Scholar] [CrossRef]
  45. Acuña, T.L.; He, X.; Wade, L.J. Temporal variation in root penetration ability of wheat genotypes through thin wax layers in contrasting water regimes and in the field. Field Crops Res. 2012, 138, 1–10. [Google Scholar] [CrossRef]
  46. Annicchiarico, P.; Pecetti, L. Developing a tall durum wheat plant type for semi-arid, Mediterranean cereal-livestock farming systems. Field Crops Res. 2003, 80, 157–164. [Google Scholar] [CrossRef]
  47. Lopes, M.; Saglam, D.; Ozdogan, M.; Reynolds, M. Traits associated with winter wheat grain yield in Central and West Asia. J. Integ. Plant Biol. 2014, 56, 673–683. [Google Scholar] [CrossRef]
  48. Clark, L.; Price, A.; Steele, K.; Whalley, W. Evidence from near-isogenic lines that root penetration increases with root diameter and bending stiffness in rice. Funct. Plant Biol. 2008, 35, 1163–1171. [Google Scholar] [CrossRef]
  49. Blum, A. Effective use of water (EUW) and not water-use efficiency (WUE) is the target of crop yield improvement under drought stress. Field Crops Res. 2009, 112, 119–123. [Google Scholar] [CrossRef]
  50. Siddique, K.H.M.; Tennant, D.; Perry, M.W.; Belford, R.K. Water-use and water use efficiency of old and modern wheat cultivars in a Mediterranean environment. Aust. J. Agri. Res. 1990, 41, 431–447. [Google Scholar] [CrossRef]
Figure 1. Examples of root density ratings from the profile walls: (a) rating of 1; (b) rating of 5; (c) rating of 10.
Agronomy 09 00221 g001
Figure 2. Root density ratings at depths from profile walls dug at physiological maturity under high irrigation (dry) and low irrigation (wet) by variety: (a) “Cochise”; (b) “Kopious”; (c) “Solar”; (d) “Solum”. Crossmark “×” indicates significant difference in root density at p < 0.05.
Agronomy 09 00221 g002
Figure 3. Root density ratings at depths from profile walls dug at physiological maturity by low irrigation (LI) or high irrigation (HI) treatment and year: (a) LI 2015; (b) HI 2015; (c) LI 2018; and (d) HI 2018. Crossmark “×” indicates significant differences in root density at p < 0.05.
Agronomy 09 00221 g003
Figure 4. Roots of physiologically mature barley varieties at 90–100 cm depth when grown under low irrigation in 2018: (a) “Solar” roots; (b) “Kopious” roots.
Agronomy 09 00221 g004
Figure 5. Root profile at physiological maturity (PM) from 50–10 cm under low irrigation treatment in 2018, red line indicates start of caliche layer at 70 cm: (a) “Solar” variety at PM with roots growing through caliche; (b) “Cochise” variety at PM showing root growth stops at the caliche layer.
Agronomy 09 00221 g005
Figure 6. Different root phenotypes exhibited under high and low irrigation: (a) “Cochise” roots at 30–40 cm under high irrigation; (b) “Solum” roots at 30–40 cm under low irrigation.
Agronomy 09 00221 g006
Figure 7. Webbed root phenotype under low irrigation seen at higher magnification: (a) “Solar” roots at 50–60 cm; (b) “Kopious” roots at 30–40 cm.
Agronomy 09 00221 g007
Figure 8. Cumulative water use (mm) since days after planting: (a) 2015, high irrigation; (b) 2015, low irrigation treatment; (c) 2018, high irrigation; (d) 2018, low irrigation treatment. Crossmark “×” indicates significant difference at p < 0.05.
Agronomy 09 00221 g008
Table 1. Soil water depletion (SWD) and irrigation amounts for barley irrigation trials conducted in Tucson, AZ in 2015 and 2018. The growing season precipitation was 151 mm in 2015 and 55 mm in 2018.
Water SourceDateHigh Irrigation TreatmentLow Irrigation Treatment
2015SWDmmSWDmm
Sprinkler Irrigation12–16 Dec. *n/a33n/a33
Floods16 Dec. *n/a117
23 Jan.0.4078
20 Feb.0.52156
4 Mar.0.65152
27 Mar.0.70128
10 Apr.0.74137
total80133
2018SWDmmSWDmm
Sprinkler Irrigation11 Dec *–1 Jan.n/a51n/a51
Floods10 Jan.n/a53n/a52
9 Feb.0.491100.49105
9 Mar.0.4781
23 Mar.0.4884
6 Apr.0.5089
26 Apr.0.8491
total 637 208
* Dates in December were in 2014 and 2017 when respective plantings occurred.
Table 2. Monthly average maximum and minimum temperature, precipitation, and reference ETo for the 2015 and 2018 growing seasons compared with the 31-year average in Tucson, AZ.
MonthMax. TemperatureMin. TemperaturePrecipitationReference ETo
2015201831-yr avg.2015201831-yr avg.2015201831-yr avg.2015201831-yr avg.
°Cmm
Dec. *18.921.718.93.32.81.655822516959
Jan.19.422.819.53.92.21.857622617668
Feb.23.921.121.06.73.93.494118897684
March26.125.024.88.96.16.316010140130142
April28.331.128.29.410.69.2607180183184
May30.033.932.812.813.913.5803203221228
Mean24.425.924.27.56.613.5------
Sum------1515582724754765
* Month of December shows data for 2014 and 2017 when respective plantings occurred, ETo was calculated using the standardized Penman–Monteith equation.
Table 3. Effect of irrigation treatment on the fraction of photosynthetically active radiation (PAR) intercepted by barley for trials conducted in Tucson in 2015 and 2018.
Irrigation TreatmentVariety 2015 2018
21 Jan.19 Feb.16 Mar.2 Feb.23 Feb.20 Mar.27-Mar.
High“Cochise”0.5320.9760.9960.4590.6680.9110.596
“Kopious”0.5400.9840.9960.6230.8640.9730.719
Mean0.5360.980.9960.5410.7660.9420.657
“Solar”0.3120.9750.9870.5340.8110.9460.652
“Solum”0.2940.9750.9690.4810.7520.9430.613
Mean0.3030.9750.9780.5080.7810.9440.632
Varietynsns**********
Variety Adaptation*ns**nsnsnsns
LSD.05nsns0.0120.0690.0650.0150.052
Low“Cochise”0.4680.9890.9920.3690.6260.8720.529
“Kopious”0.4570.9900.9910.5880.8560.9550.692
Mean0.4630.9900.9920.4790.7410.9140.611
“Solar”0.3810.9850.9880.5770.8210.9550.684
“Solum”0.3050.9770.9760.6070.8170.9580.706
Mean0.3430.9810.9820.5920.8190.9570.695
Variety*************
Variety Adaptation**************
LSD.050.1160.0070.0040.0970.0670.0470.072
* Significance of variety effect and variety adaptation effect was based on a p-values: + < 0.10, * < 0.05, ** < 0.01; while ns = not significant. Least significant difference (LSD) was calculated at the p < 0.05 level.
Table 4. Effect of irrigation treatment on biomass yield (g m−2) of barley for trials conducted in Tucson in 2015 and 2018.
Irrigation TreatmentVariety 2015 2018
21 Jan.19 Feb.16 Mar.7 Feb.23 Feb.16 Mar.27 Mar.
High“Cochise”1501812321590.42789631656
“Kopious”1661744290314130313641833
Mean1581778305911629011631744
“Solar”1251787316513436014732081
Solum1141729292112031512062180
Mean1191758304312733813392131
Variety*nsns+nsnsns
Variety Adaptation**nsnsnsnsns*
LSD.0535.933438141.396.8434472
Low“Cochise”1441884279568.22839111196
“Kopious”1841952240416231412021670
Mean1641918260011529810561433
“Solar”1421930297815749713242013
“Solum”1301676306414440713302365
Mean1361803302115145213272189
Variety******nsns**
Variety Adaptation**+****ns**
LSD.0528.318644148.7246489618
* Significance of variety effect and variety adaptation effect was based on a p-values: + < 0.10, * < 0.05, ** < 0.01; while ns = not significant. Least significant difference (LSD) was calculated at the p < 0.05 level.
Table 5. Effect of irrigation treatment on heading, flowering and physiological maturity of barley by date for trials conducted in Tucson in 2015 and 2018.
Irrigation TreatmentVariety 2015 2018
HeadingFloweringMaturityHeadingFloweringMaturity
High“Cochise”9 Mar.11 Mar.1 May20 Mar.22 Mar.6 May
“Kopious”9 Mar.11 Mar.1 May22 Mar.24 Mar.30 Apr.
Mean9 Mar.11 Mar.1 May21 Mar.23 Mar.3 May
“Solar”5 Mar.7 Mar.23 Apr.15 Mar.17 Mar.26 Apr.
“Solum”5 Mar.6 Mar.23 Apr.13 Mar.14 Mar.23 Apr.
Mean5 Mar.6 Mar.23 Apr.14 Mar.15 Mar.24 Apr.
Variety************
Variety Adaptation************
LSD 0500.402.22.20.85
Low“Cochise”7 Mar.7 Mar.11 Apr.19 Mar.19 Mar.24 Apr.
“Kopious”7 Mar.7 Mar.10 Apr.20 Mar.20 Mar.23 Apr.
Mean7 Mar.7 Mar.10 Apr.19 Mar.19 Mar.23 Apr.
“Solar”4 Mar.6 Mar.3 Apr.14 Mar.16 Mar.19 Apr.
“Solum”3 Mar.4 Mar.31 Mar.13 Mar.14 Mar.16 Apr.
Mean3 Mar.5 Mar.1 Apr.13 Mar.15 Mar.17 Apr.
Variety***********
Variety Adaptation***********
LSD.051.61.81.201.511.141.31
* Significance of variety effect and variety adaptation effect was based on a p-values: + < 0.10, * < 0.05, ** < 0.01; while ns = not significant. Least significant difference (LSD) was calculated at the p < 0.05 level.
Table 6. Effect of irrigation treatment on barley yield and yield components for a trial conducted in Tucson in 2015.
Irrigation TreatmentVarietyTotal YieldGrain YieldHarvest IndexTest WeightKernel WeightLodgingPlant Height
g m−2g m−2%kg m−3g/1000%cm
High“Cochise”24907152962331.63185
“Kopious”30198134068442.3086
Mean27557643465437.01686
“Solar”24564703167245.019102
“Solum”20204373560142.56193
Mean223845433637444098
Variety+**+******
Variety Adaptation***nsns**+**
LSD.054671457.860.16.0386.5
Low“Cochise”17052362048217.3069
“Kopious”15652601947017.4069
Mean16352481947617.4069
“Solar”18903352560725.54104
“Solum”11812622748026.64395
Mean15362992654426.12499
Variety+**+********
Variety Adaptationns***********
LSD.0551251.97.529.95.8194.3
* Significance of variety effect and variety adaptation effect was based on a p-values: + < 0.10, * < 0.05, ** < 0.01; while ns = not significant. Least significant difference (LSD) was calculated at the p < 0.05 level.
Table 7. Effect of irrigation treatment on barley yield and yield components for a trial conducted in Tucson in 2018.
Irrigation treatmentVarietyTotal YieldGrain YieldHarvest IndexTest WeightKernel WeightLodgingPlant Height
g m−2g m−2%kg m−3g/1000%cm
High“Cochise”13896204072630.0083
“Kopious”16306773874332.6081
Mean15096473973431.3082
“Solar”13475243481040.73.75104
“Solum”10183583276244.32.5100
Mean11834423378642.53.13102
Variety**ns****ns**
Variety Adaptation********ns**
LSD.05409193ns27.54.2ns7.5
Low“Cochise”8432993254420.6058
“Kopious”9522202053518.4061
Mean8982592754019.5059
“Solar”11324033269627.3097
“Solum”7942743260027.7093
Mean9633393264827.5095
Variety***ns****-**
Variety Adaptationns*ns****-**
LSD.05134101ns42.05.1-4.4
* Significance of variety effect and variety adaptation effect was based on a p-values: + < 0.10, * < 0.05, ** < 0.01; while ns = not significant. Least significant difference (LSD) was calculated at the p < 0.05 level.
Table 8. Effect of irrigation treatment on barley water use (mm) for trials conducted in Tucson in 2015 and 2018.
Irrigation TreatmentVarietyCumulativePre-AnthesisPost-Anthesis
201520182015201820152018
High“Cochise”581627272244309383
“Kopious”621454271215351241
Mean601540271229330312
“Solar”594466209171386293
“Solum”581426218151363275
Mean588446213161374284
Varietyns**********
Variety adaptationns*******+
Variety × depth***ns******
LSD.05ns5224273535
Low“Cochise”2922702101818288
“Kopious”2983062212317774
Avg2952882162068081
“Solar”290296186197105100
“Solum”2672841701869798
Mean27929017819210199
Varietynsns*******
Variety adaptationnsns**ns****
Variety × depthnsnsnsns**ns
LSD.05nsns26351516
* Significance of variety effect and variety adaptation effect was based on a p-values: + < 0.10, * < 0.05, ** < 0.01; while ns = not significant. Least significant difference (LSD) was calculated at the p < 0.05 level.

