Article

The Effect of Potassium and Sulfur Fertilization on Seed Quality of Faba Bean (Vicia faba L.)

by
Przemysław Barłóg
*,
Witold Grzebisz
and
Remigiusz Łukowiak
Department of Agricultural Chemistry and Environmental Biogeochemistry, Poznan University of Life Sciences, Wojska Polskiego 71F, 60-625 Poznan, Poland
*
Author to whom correspondence should be addressed.
Agronomy 2019, 9(4), 209; https://doi.org/10.3390/agronomy9040209
Submission received: 28 February 2019 / Revised: 20 April 2019 / Accepted: 22 April 2019 / Published: 25 April 2019
(This article belongs to the Section Soil and Plant Nutrition)

Abstract

:
Faba bean seeds are regarded as a highly valuable protein source for human and animal nutrition. High yield and quality of faba bean require adequate mineral nutrition. The aim of the study was to assess the impact of potassium (K) and elemental sulfur (S) on crude protein (CP) and tannin content (TC) in seeds, crude protein yield (CPY), and amino acid (AA) composition. Field trials were carried out during 2010–2013 in the temperate climate of Central Europe. The study assessed the influence of the following factors: variable soil K content and fertilization (K1, K2, K3, and K4) and elemental S application (0, 25, and 50 kg S ha−1). Plants were harvested at two growth stages to obtain immature seeds and mature seeds. K and S applications did not have a significant impact on CP and AA composition, including sulfur AA content. The TC decreased in response to increasing content of plant-available K in soil. In respect to CPY, the results indicate a positive response of faba bean to increasing K content in soil. The effect of S fertilization depended on the K treatment. The most beneficial influence of S on CPY was registered on K-poor soil.

1. Introduction

Faba bean (Vicia faba L.) is an important legume crop in many countries around the world. Its seeds are regarded as a highly valuable protein source for human and animal nutrition, because they are characterized by a relatively high content of digestible starches and proteins and provide a balanced diet of lysine-rich protein [1]. The faba bean can be harvested when the seeds are fresh and green and used as a vegetable, or harvested at the maturity stage when the seeds are dry [2]. In general, the large-seeded type of faba bean is produced for human consumption, whereas the small-seeded type is grown for animal feed. Numerous studies have reported that faba bean has a positive effect on human health. Its seeds are rich not only in proteins and energy, but also in essential minerals, vitamins, fiber, and phytochemicals, which can protect against low-density lipoprotein (LDL) cholesterol, cardiovascular disease, cancer, and diabetes [3,4]. Consumption of faba beans can also increase the level of L-dopa in the blood and improve the health of patients suffering from Parkinson’s disease [5]. In addition, faba bean belongs to the group of plants classified as nitrogen-fixing plants. Therefore, this species contributes to sustainable agriculture by maintaining and improving soil fertility and playing a key role in crop rotation [6,7].
Unfortunately, despite all our knowledge on the significance of grain legumes in so-called sustainable crop production, their crop area is still small. The main reason for that in Europe, including Poland, is low and year-variable yields that do not compensate for the investment outlays, thus they are not profitable [8]. When compared to other legumes, faba bean is highly sensitive to water deficiency [9], which is largely due to its shallow root system [10]. Water deficiency during flowering causes flower and pod abortion, leading to a significant reduction in the yield [11]. In the soil and climate conditions of Poland, water resources coming from winter precipitation and current rainfall are often insufficient and cause abiotic stress, to which faba bean is extremely susceptible. The water deficiency stress is intensified by the domination of K-deficient soils in Poland [12]. Potassium plays a vital role in water stress tolerance [13]. Moreover, the K in plants is involved in photosynthesis, assimilate transport, enzyme activation, and oxidative stress [14,15]. Deficiency of this element in the initial growth stage significantly disturbs the distribution of assimilates between above-ground organs and roots [16]. Deficiency of the element in soil may lead to fewer primordia and impede the nitrogen (N2) fixation mechanism, which may be linked to a lower protein content in seeds [17,18,19]. Potassium deficiency stress may also lead to increased concentrations of antinutritional factors in pulse seeds [20,21].
Recently, awareness of the importance of appropriate nourishment of plants with S has grown. In various countries, including Poland, reduction of industrial pollution has decreased the deposition of this element in soils and increased the need for S in fertilizers [22]. As numerous research studies show, a shortage of this component in the soil reduces the yield and seed quality of pulses [23,24,25]. Sulfur also plays a vital role in N2 fixation [26,27]. To improve the S supply in faba bean, K2SO4 fertilizers are mostly used [19,28]. In this way, two nutrients are applied simultaneously. The scientific literature does not, however, provide any specific information regarding the influence of elemental S on the yield and quality of faba bean. Elemental S is a relatively new fertilizer used in agriculture, therefore its impact on the yield and chemical composition of plants is not yet fully known. Fertilizer not only is a source of S for plants after oxidation, but also considerably changes soil properties by acidifying it [29]. Thus, it can alter the availability of minerals, including K. Elemental S, as a nutrient carrier and a component initiating many microbiological processes in soil, is a significant factor in metabolic and physiological changes in legume yields [30]. We previously showed that the effect of S on SY significantly depends on the K concentration in the soil. A positive role of S is most apparent on soil with a low concentration of plant available K. On soil rich in K, however, S fertilization results in lower faba bean yield [31].
In comparison with cereals, faba bean seeds have relative high lysine (Lys) and arginine (Arg) content but low sulfur amino acid content, specifically cysteine (Cys) and methionine (Met) [32,33]. This is why sulfur is such a crucial element in determining the quality of faba bean seeds. As scientific studies show, S fertilization may increase not only the protein content in faba bean seeds, but also the content of amino acids in proteins [25]. Some authors report that S fertilization may at the same time worsen seed quality due to increased tannin content, one of many anti-nutritious compounds of faba bean seeds [34]. The antinutritional effects of tannins include depression of food intake, formation of less digestible tannin–dietary protein complexes, inhibition of digestive enzymes, astringent taste of tannin-rich foods and feeds, and toxicity of absorbed tannin and its metabolites [35]. Some studies report that a tannin-rich diet may have a negative effect on iron absorption and cause its deficiency [36]. However, in recent years, especially in human nutrition, the more interesting fact is that phenolic compounds have strong antioxidant activity and a tannin-rich diet may have potential beneficial cancer-fighting properties [37].
The chemical composition of grain legume seeds is primarily determined by genotype. According to Burstin et al. [38], all of the environmental factors that impact N nutrition, such as drought stress, soil compacting, root diseases, fertilization, and pests, may influence CP and AA composition. In relation to faba bean grown as a vegetable, an important factor determining the quality of seeds is the time of harvest [39]. Studies focused on the influence of K and S on the quality of pulses usually consider seeds from one time of harvest. However, the chemical composition of seeds changes during their maturation [21,40]. The authors of the present paper formulated a hypothesis that the influence of elemental S application on the quality of faba bean seeds dependent not only on plant-available K in soil or current rates of K, but also on the time of harvest. Our research objective was to establish the response of faba bean to a change in soil growth factors, specifically the potential of soil to provide plants with K and S. The specific objectives refer to the role of the elements in: (i) content and yield of crude protein; (ii) amino acid composition; and (iii) condensed tannin content in immature (green) and mature (dry) seeds.

2. Materials and Methods

2.1. Site Description

Field trials with faba beans were carried out during 2010–2013 at the Brody Experimental Farm, which belongs to Poznan University of Life Sciences (52°43ʹN; 16°29ʹE). The site is 96 m above sea level. According to the World Reference Base for Soil Resources [41] classification system, soil used in the experiment was classified as Haplic Luvisols. The topsoil was characterized as sandy loam, and the subsoil was characterized as loam texture. The content of organic carbon (Corg) in the topsoil amounted to 11.6 g kg−1. The long-term average yearly precipitation and temperature in the study area are approximately 560 mm and 8.2 °C, respectively.

2.2. Experimental Design

The study was part of a long-term experiment with different levels of K fertilization (established in 1990). The experiments were carried out in a split-plot design with 4 replications, and with the following factors: (i) soil K availability and different K rates (K1, K2, K3, and K4); and (ii) elemental S application (0, 25, and 50 kg S ha−1).
The K1 treatment represents the control without K application, whereas K2, K3, and K4 represent application of K equal to 25%, 50%, and 100% of a particular plant in crop rotation, respectively. The plots under treatments K1 and K4 have remained in the unchanged system of K fertilization since 1990. Treatments K2 and K3 were established in 2001, when K1 and K4 were divided into 2 parts: regeneration of the control object with potassium (K3) and exclusion from potassium fertilization (K2). As a result, in terms of K content in the topsoil, the treatments can be arranged in the following way: K1 < K3 < K2 < K4 (Table 1).
With respect to faba bean, the rates of K amounted to 0, 33.3, 66.5, and 133.0 kg K ha−1 for K1, K2, K3, and K4 treatments, respectively. The 100% rate was determined using the assumed seed yield (12 t ha−1 of green seeds) and the specific K uptake (11.1 kg K t−1). Each large plot representing different K fertilization was divided into small plots with different S rates. The total number of plots was 48, and the area of an individual plot was 22.4 m2 (2.8 m × 8 m).
Potassium and S were applied every spring, 2–3 weeks before seed sowing. The first nutrient was applied as KCl (49.8% pure K), whereas the second application was elemental S (granulated fertilizer, 90% S). No N fertilizers were used in the experiment. Phosphorus (P) fertilization of 26.2 kg P ha−1 (triple superphosphate, 17.4% pure P) was employed in the autumn after the forecrop was harvested.

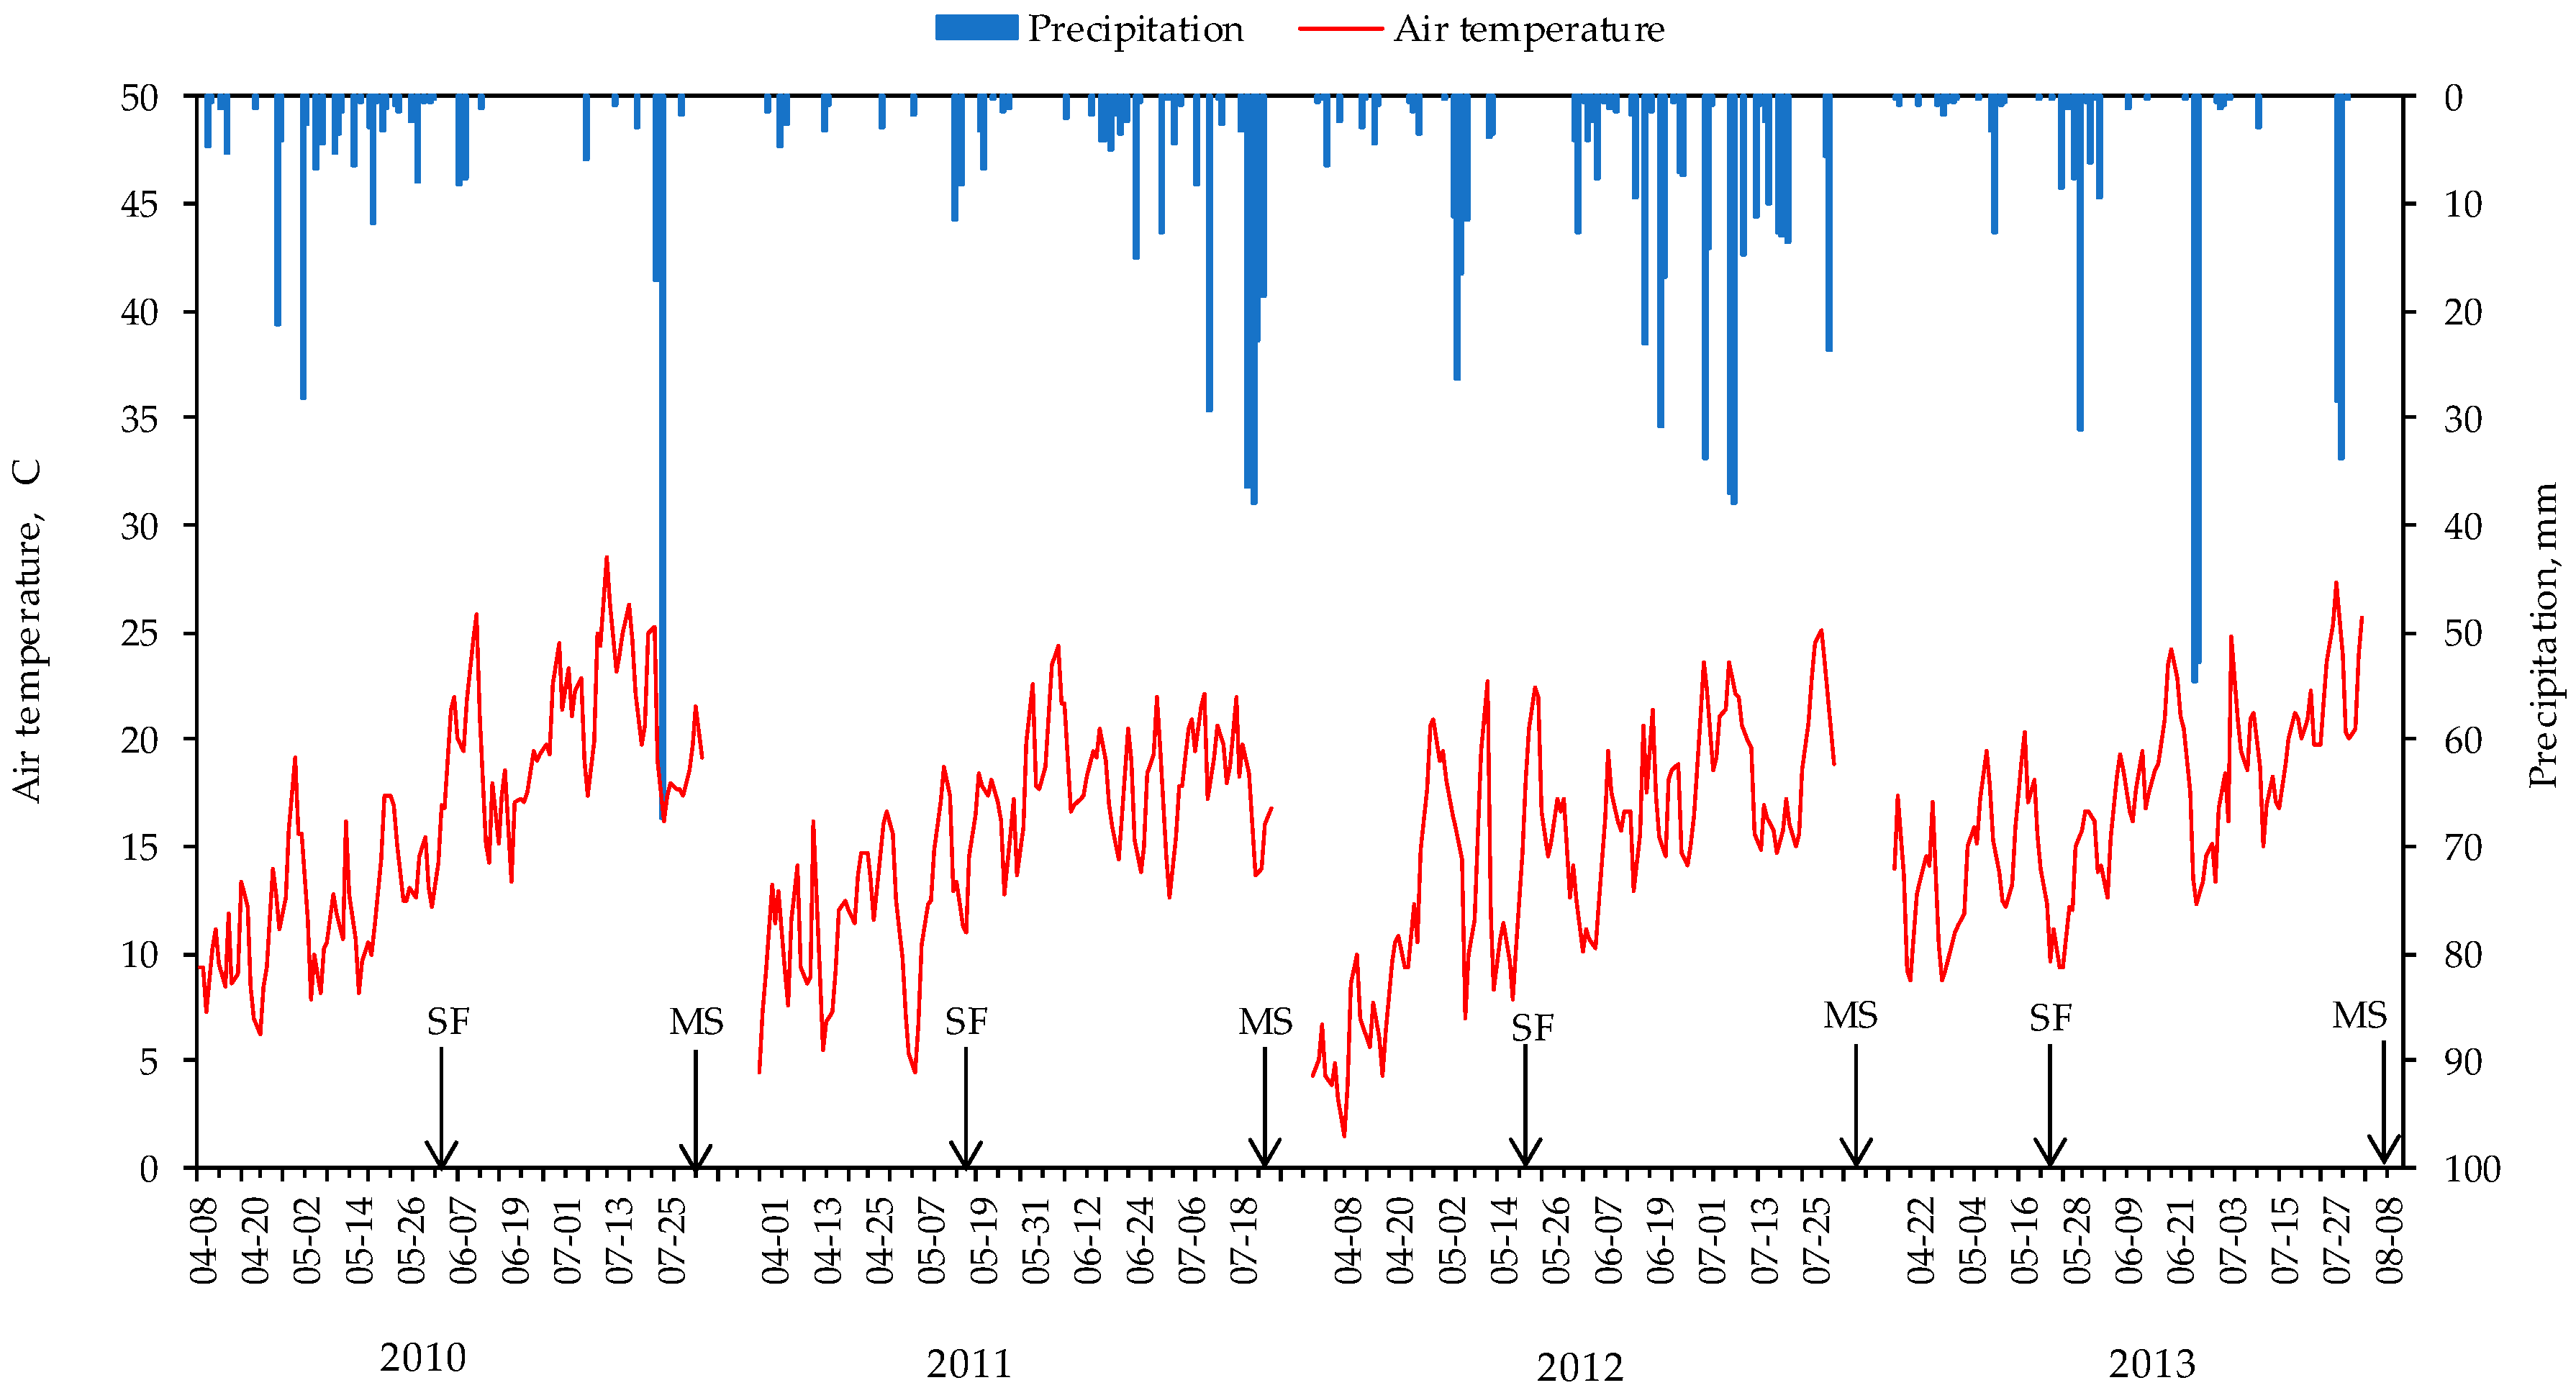
2.3. Environmental Conditions

Soil sampling was carried out annually at the beginning of March in the period 2010–2013, before fertilizer application. Soil samples were taken using a manual Eijkelkamp auger from topsoil (0–0.3 m) and subsoil (0.3–0.6 m) of each field representing different K fertilization. The topsoil samples taken from the K1 plot showed a low content of plant available K; K3, medium; K2, medium or high; and K4, high. At a soil depth of 0.3–0.6 m, the differences in K content between treatments were less prominent than at a depth of 0–0.3 m, especially between K2 and K3 treatments. Moreover, the topsoil featured a high content of available P and an average content of Mg and S. The long-standing K fertilization system did not have a significant influence on the content of the above elements in soil; however, a certain trend of increased S–SO4 content was observed in the samples taken from the K4 plot (Table 1).
During the experiments, there were varied weather conditions. The first 2 years (2010 and 2011) were unfavorable for plant growth and yield due to drought. In these years, the sum of precipitation during the growing season, from sowing to harvesting of faba bean, was 154 and 102 mm, respectively. The next years were relatively moist and beneficial for plant growth. However, more precipitation was recorded in 2012 (380 mm) than in 2013 (268 mm). For comparison, the mean precipitation from March to July at the experimental site over 50 years (1954–2009) was 275 mm. The mean air temperature during growing seasons ranged from 14.1 °C (2012) to 16.8 °C (2013). Precipitation and mean daily air temperature during the faba bean growing period, from sowing to harvest, are shown in Figure 1. The figure shows that the greatest difference in precipitation was recorded in June, which is a period of flowering and pod formation of the faba bean.

2.4. Experimental Material

Cultivar Vicia faba L. var. major “Bachus” was used in the experiment (“Spójnia” Plant Breeding and Seed Production Ltd.). It is an early seed variety, with traditional (indeterminate) type of growth and white flowers with a melanin stain on the wings. The cultivar is useful for preserving and direct consumption. Its potential seed yield in Polish soil climatic conditions (rainfed) ranges from 2.4 to 4 t ha−1 of dry matter. In our experiment, winter wheat was the forecrop in each year. Faba bean was sown on the following dates: 4 April 2010, 29 March 2011, 1 April 2012, and 17 April 2013. Seeds were planted by hand at a depth of 5 cm, with a population density of 30 plants per m2 and an inter-row space of 0.40 m. Before sowing, the seeds were inoculated with Rhizobium leguminosarum bv. viciae bacteria (Nitragina, BIOFOOD s.c., Wałcz, Poland). During vegetation, plant protection included the application of herbicides (active ingredients: linuron and/or chlomazon), fungicide (chlorothalonil), and insecticide (pirimicarb).

2.5. Experimental Measurements

Faba bean was harvested at 2 growth stages to obtain: (i) immature seeds (GS); and (ii) mature seeds (MS). The first harvest was at the vegetative stage, when the seeds are fresh and green, at a moisture content of about 70%. According to the BBCH (in German: Biologische Bundesanstalt, Bundessortenamt and CHemische Industrie) scale, phenological growth stages amounted to: (i) 85/87; and (ii) 96/97 [42]. Faba bean samples were hand-harvested from an area of 7.5 m2. After harvesting, seed samples were dried at 55 °C for 3–6 days to determine dry matter content.

2.6. Chemical Analysis

Crude protein (CP) content was determined by the Kjeldahl method (N × factor of 6.25) using a Kjeltec Auto 1031 Analyzer (Foss Tecator, Sweden). For the determination of crude protein yield (CPY) following expression was used:
CPY = CP × SY/100
where SY is seed yield in kg ha−1.
To determine amino acids (AA), dry seed samples were hydrolyzed at 110 °C for 24 h in the presence of 6 mol dm−3 HCl [43]. After cooling, the hydrolysate was washed with distilled water, filtered, and dried at 60 °C (under vacuum) in a rotary evaporator. The dried sample was then dissolved in 0.01 mol dm−3 HCl. Chromatography analysis of hydrolysate was carried out using Na-citrate buffers (pH 3.5, 4.25, and 9.45) and ninhydrin on a T-339 automatic amino acid analyzer with a column of reverse-phase Ostion LG ANB (Ingos, Praha, Czech Republic). Tryptophan was not analyzed by this method. Amino acid results were expressed as g 100 g−1 of CP.
Chemical analysis of tannin content (TC) was conducted by using the method with vanillin [44]. Tannins were extracted from seeds using a reflux condenser in a dimethylformamide (DMF) solution and Na2S2O5. After filtering, vanillin in sulfuric acid solution was added to the analyzed solution. The calibration curve was estimated using (+)-catechin as the standard and the results were expressed as g (+)-catechin equivalent per kg. Color intensity was measured at a wavelength of 494 nm.

2.7. Chemical Score and Essential Amino Acid Index

The chemical score (CS) for amino acids and essential amino acid index (EAAI) were calculated using the standard equations [45]:
CS = (AA × 100%)/AA of protein in requirement pattern
EAAI = 10 log EAA
where AA is amino acid or sum of amino acids in g 100−1 of CP; EAA is essential amino acids; log EAA = 0.1[log(a1/a1s × 100) + log(a2/a2s × 100) + log(an/ans × 100)]; a1, …, an are the essential amino acid contents in faba bean seeds; and a1s, …, ans are the required levels of EAA in the requirement pattern.
CS and EAAI were calculated taking into account the requirement pattern for humans (children) and used for this purpose: sulfur amino acids (SSA) = 2.3, phenylalanine (Phe) + tyrosine (Tyr) = 4.1, threonine (Thr) = 2.5, histidine (His) = 1.8, isoleucine (Ile) = 3.0, leucine (Leu) = 6.1, valine (Val) = 4.0, and Lys = 4.8 g 100 g−1 of protein [46].

2.8. Statistical Analysis

The effects of individual research factors (year, potassium, sulfur) and their interactions were assessed by means of 3-way ANOVA. The effects of factors on TC and AA composition were compared by means of 3-way ANOVA without replication. Means were separated by honest significant difference (HSD) using Tukey’s method when the F-test indicated significant factorial effects at the level of p < 0.05. The relationships between traits were analyzed using Pearson correlation and linear regression. STATISTICA 12 software was used for all statistical analyses [47].

3. Results

3.1. Protein Content and Yield

ANOVA results show that CP depended significantly on the growing season. Potassium treatment and S fertilization did not have any significant effect on this parameter. In contrast to CP, the yield of crude protein (CPY) depended significantly on the K and S treatments, and interaction between these factors. However, the first factor (year) can be considered as the major one (Table 2).
The significant highest concentration of CP was recorded in seeds harvested in dry years (2010–2011), while the lowest content was registered in wet years (2012–2013). The average difference in CP was 24.8 g kg−1 and 21.4 g kg−1, depending on seed maturity. As the studies determined, the growing season had more impact on CP than the harvest time. Average content of crude protein in GS was 281.1 g kg−1, and in MS was 272.6 g kg−1 (Table 3).
During growing seasons under moderately wet conditions (2012–2013), the obtained CPY was considerably higher than in dry years (2010–2011). The average difference in CPY was 70.0% for GS, and 52.6% for MS. The effect of K fertilization systems on CPY depended on harvest time. At first growth stage, the CPY increase in K3 and K4 treatments and the control (K1) was 17.7% and 14.8%, respectively. For MS, however, higher CPY increase was found. At this growth stage, the CPY increase in K2 and K4 treatments and K1 treatment was 36.3% and 42.0%, respectively. Sulfur application had no significant effect on CPY at first time of harvest. In contrast, at maturity, the mean CPY increase due to application of 50 kg S ha−1 was at the level of 13.8% (Table 3).
At each growth stage, S application positively affected CPY (Figure 2). The highest increases of CPY were noted in soil with the lowest content of K (K1 treatment) and/or an average rate of KCl (K3). At maturity, a significant effect of fertilizers was seen. At this growth stage, the highest CPY value was obtained in the K4/S0 treatment. The average difference between CPY in K1/S0 and K4/S0 was 83.0%. A large difference (75.0%) was also observed between K1/S0 and K2/S50 treatments. In contrast to K1, K2, and K3 plots, S application on K4 treatment resulted in decreased CPY. However, regardless of the K treatment, the differences between S0 and S50 were not significant (Figure 2b).

3.2. Tannin Content

The main factor determining the TC was the course of weather conditions (F3,44 = 97.8 at p < 0.001 and F3,44 = 7.09 at p < 0.001, for GS and MS, respectively). Regardless of the time of harvest, in relatively wet years, seeds carried more tannins than in dry years (Table 4). The time of seed harvest had less impact. On average, GS contained less tannin (0.437 g kg−1) than MS (0.466 g kg−1). TC also depended on the K treatment. At each growth stage, K application decreased TC, especially in K2 and K4 treatments. Only in 2010, the result was not clear. Despite this, a significant influence of that factor was recorded at maturity (F3,44 = 2.99 at p < 0.05). Seeds of plants grown on K-rich soil (K2 and K4) featured considerably lower TC than in K1 (Table 4). Contrary to K treatment, the influence of S application on TC was insignificant. The following values of TC were obtained for GS: S0, 0.448; S25, 0.464; and S50, 0.402 g kg−1. The following values of TC were obtained for MS: S0, 0.430; S25, 0.426; S50, 0.426 g kg−1.

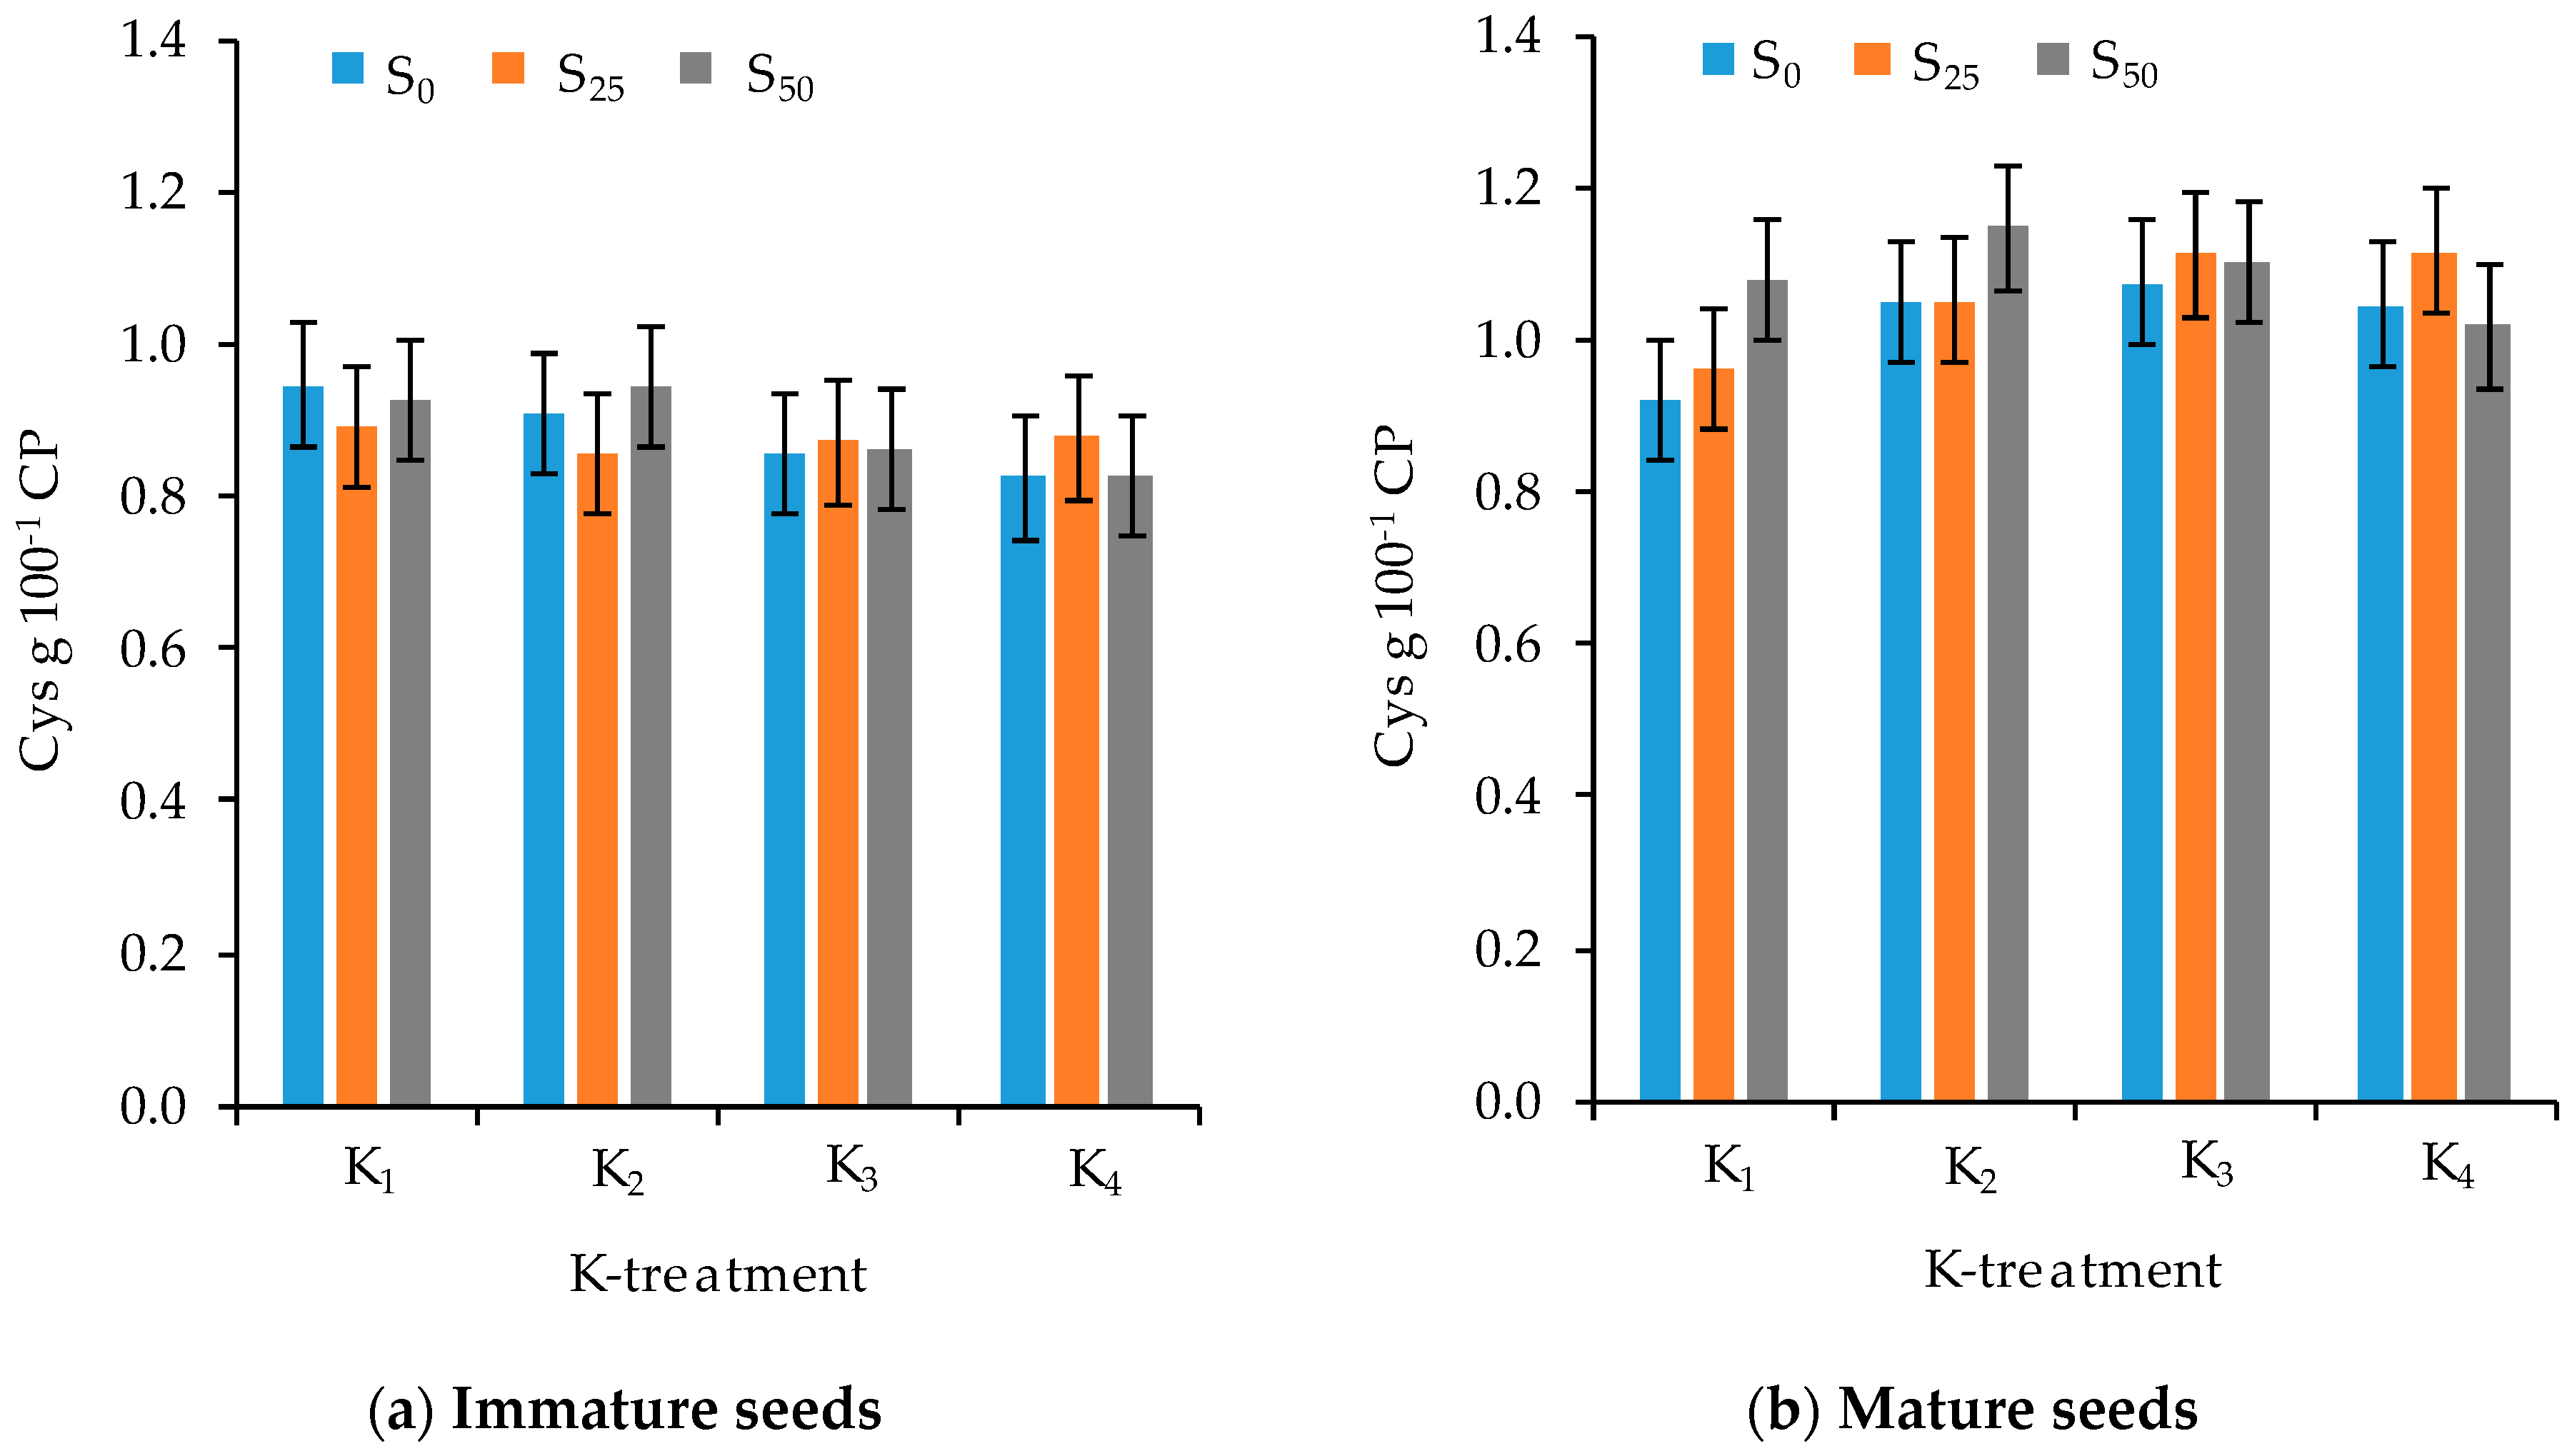
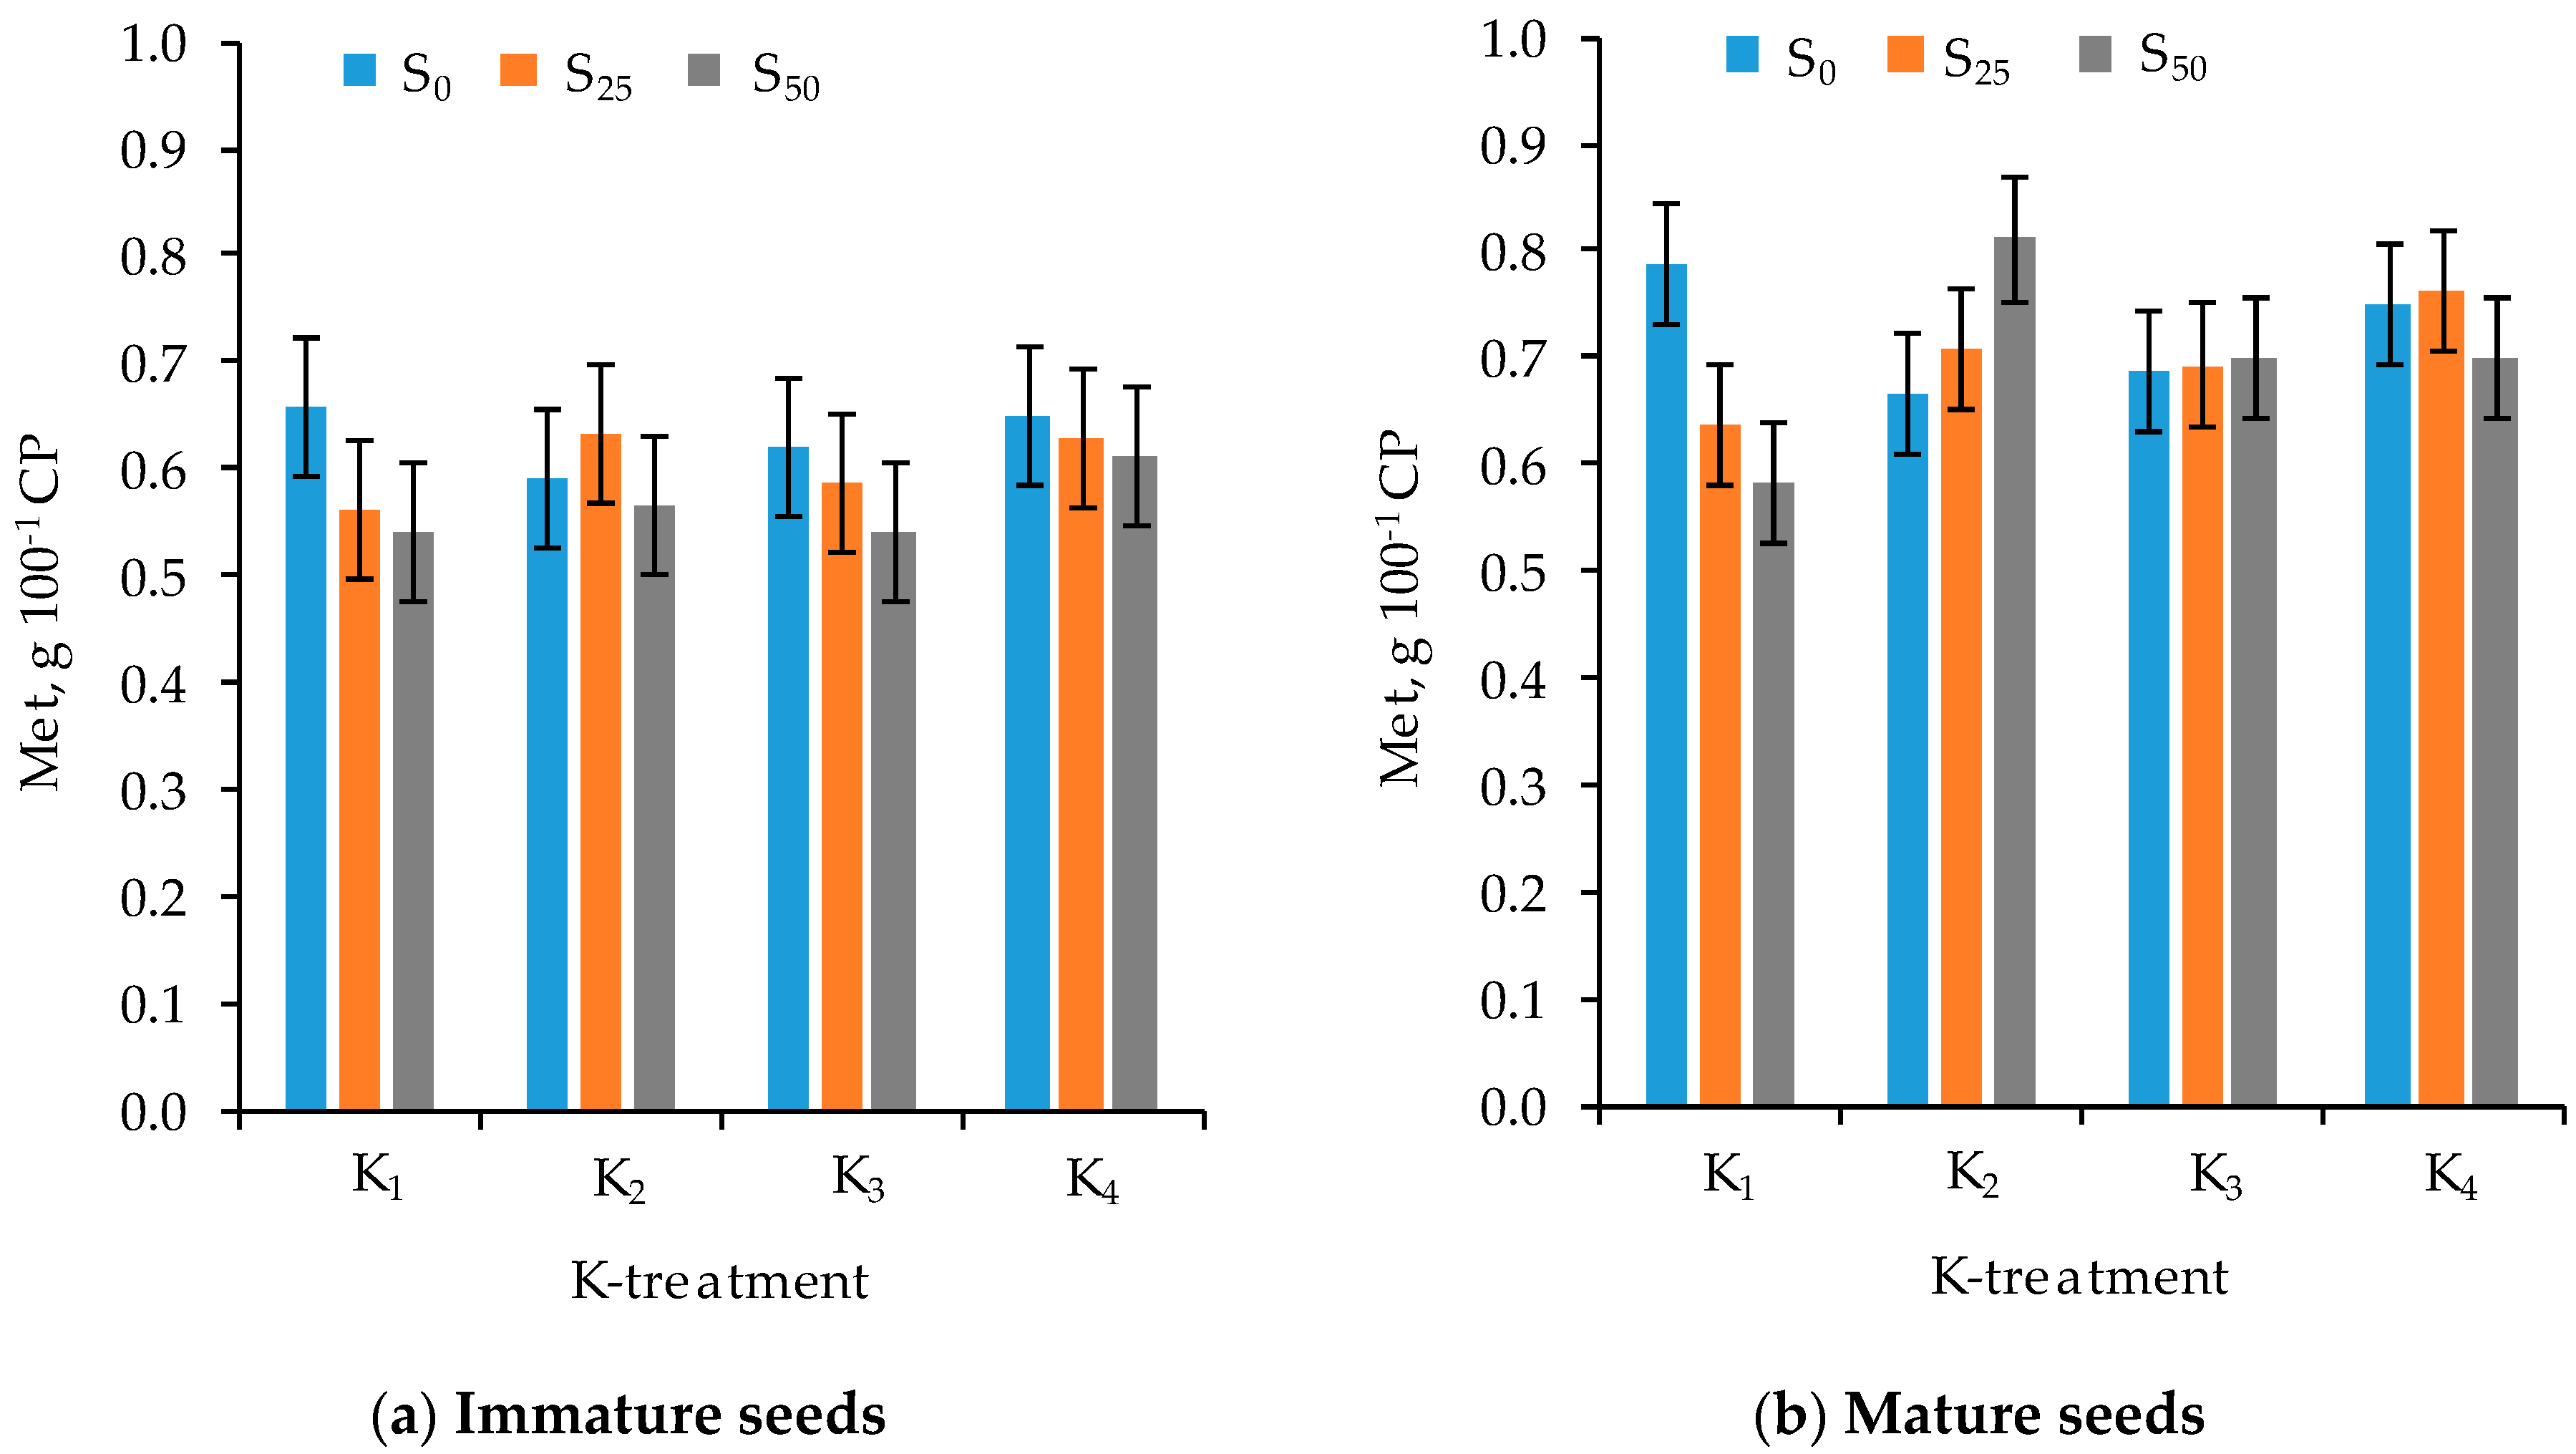
3.3. Amino Acid Composition

The growing season significantly affected AA composition, regardless of seed maturity. In general, during wet years CP contained more Lys and Arg than in dry years. Inversely, the highest content of Cys, proline (Pro), and glutamic acid (Glu) was found in dry years (Table 5 and Table 6).
Potassium treatment had no significant influence on average AA content. However, there was a tendency toward lower Cys content in GS protein along with an increased rate of K, whereas at maturity (MS), Cys, Met, Lys, Fen, and total EAA content increased in treatments with higher concentrations of soil-available K. The experiment did not show a significant influence of S application on average SAA content. Average essential amino acid (EAA) content was higher in crude protein in MS than GS. At the same time, the share of EAA in total amino acids (TAA) remained on a similar level, i.e., 40.5% and 41.0%, respectively (Table 5 and Table 6).
Due to the importance of the topic, the results of SAA content, depending on growth stage and seed maturity, and K and S fertilization, are shown in Figure 3 and Figure 4. Cys content in MS showed a tendency to increase as S rates rose, especially in K1 and K2 treatments. However, at the same time, Met content showed a tendency to decrease. The only exception was K2 treatment at maturity (Figure 3 and Figure 4).
The biological value of protein, evaluated using EAAI, ranged 91–92% in relation to human standards [46]. The analysis of CS for different EAA showed lower values for SAA (56.9% for GS and 68.6% for MS, on average). The values also fell below 100% for Val (93.3–87.3%) and Leu (97.6–99.0%). The highest CS values were obtained for His (137.1–172.0%) and Tyr + Phe (136.3–149.8%). CS and EAAI values significantly depended on growing season and time of seed harvest. In dry years (2010–2011), the biological value of protein, expressed in CSSAA indices, was considerably higher for MS than for GS. A reverse tendency was observed for CSVal and CSLeu. Probably because of the diverse influence of weather conditions on EAA, specific changes of EAAI cannot be observed. The studies did not prove any significant impact of plant available K in soil and S application on CS and EAAI values. However, at maturity, a tendency for CSSAA and EAAI values to increase with S application was observed in the K2 treatment (Table 7).

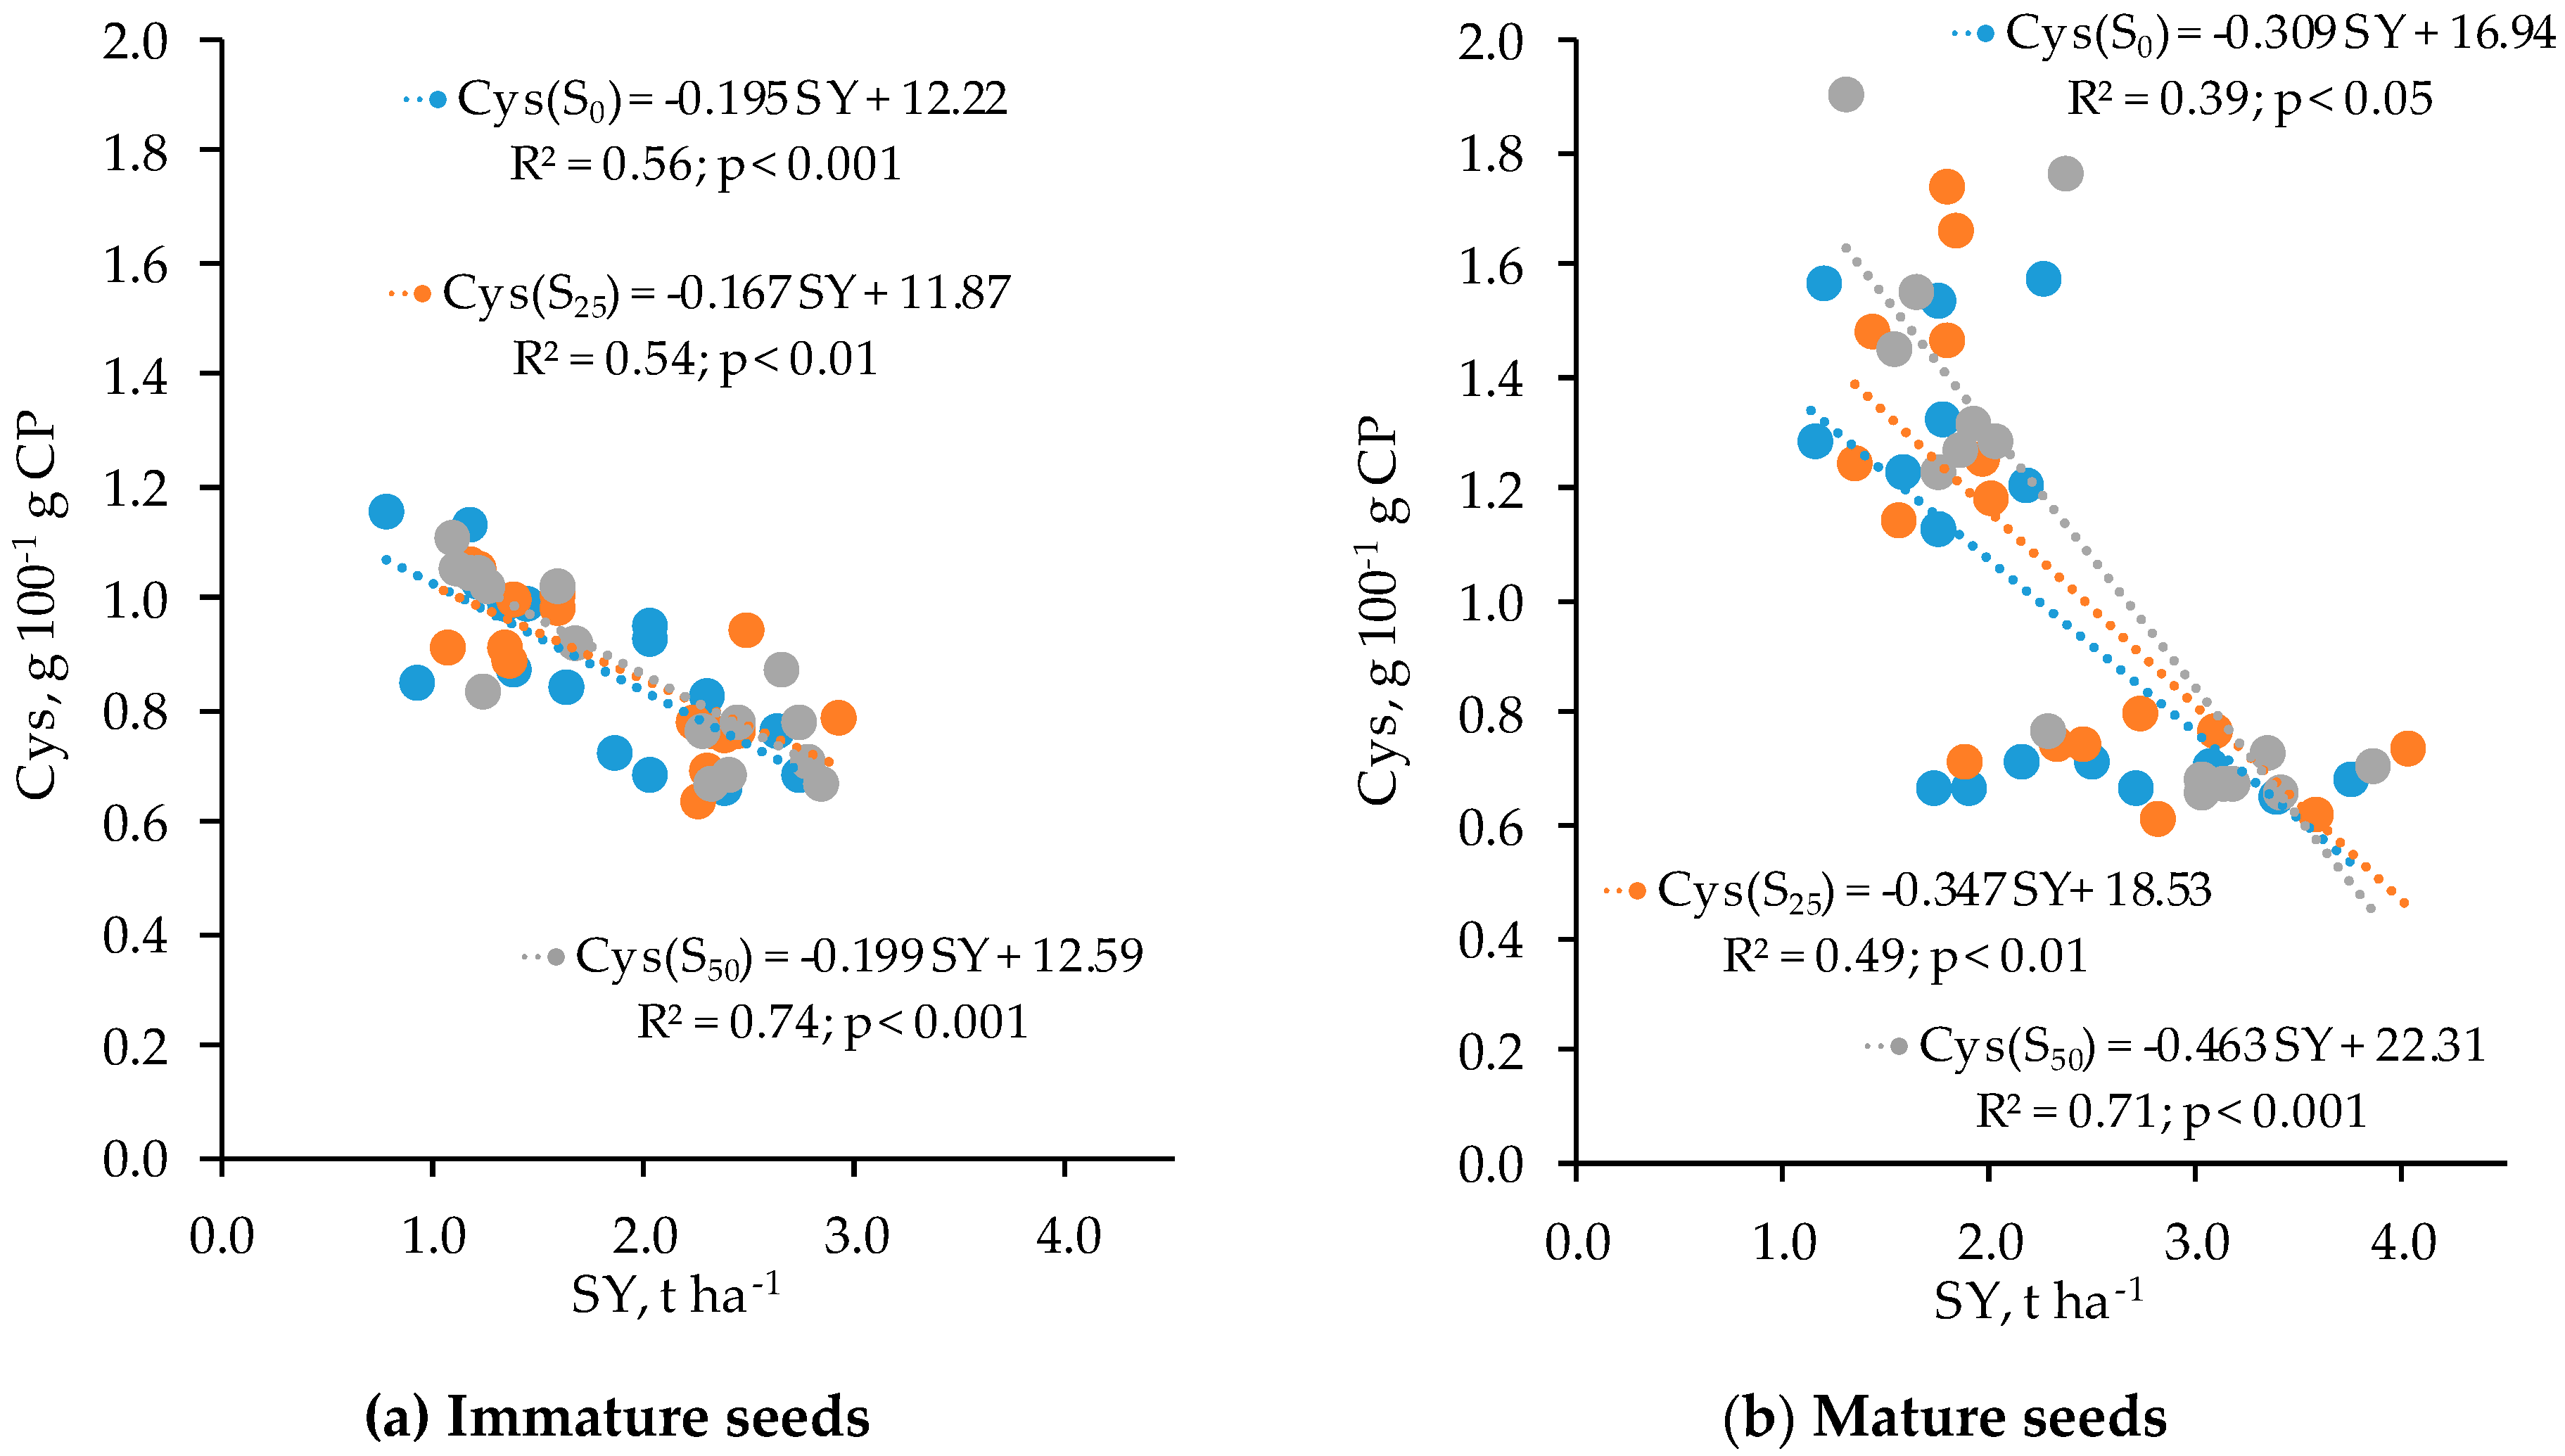
3.4. Relationships Between Features

A negative correlation was observed between CP and yield of GS (r2 = 0.33, p < 0.001; n = 48) and between CP and yield of MS (r2 = 0.28, p < 0.001; n = 48). Our studies also showed a negative relationship between CP and seed weight (r2 = 0.60, p < 0.001 and r2 = 0.42, p < 0.001, respectively, for GS and MS). Along with the increase of SY, a higher concentration of aspartic acid (Asp) content was observed at every stage of seed maturity, while increased alanine (Ala), Met, Lys, and Arg was registered in immature seeds. A negative correlation was observed between SY and Cys, Glu, and Pro content, regardless of the stage of seed maturity. Our studies also revealed a negative correlation between Lys and CP. A negative correlation between Met and CP was observed only at the GS stage. In contrast to Met, the Cys content correlated positively with CP (Table 8).
Tannins correlated positively with yield of immature seeds (R2 = 0.42, p < 0.001; n = 48) and mature seeds (r2 = 0.29, p < 0.001; n = 48). Despite the growth stage, the TC correlated negatively with the concentration of Cys, Pro, and Glu. The studies did not confirm a significant correlation between TC and Met (Table 8).
Cys content is particularly important for seed quality. For this reason, the correlation between SY and Cys content was analyzed at three levels of S fertilization. The studies show a negative correlation between SY and Cys regardless of the S rate. The strongest negative correlation between these features, expressed by the R2 coefficient, was registered after the highest rate of S was applied (Figure 5).

4. Discussion

As our studies show, the main factor determining faba bean quality was the year of study. This finding is in line with other studies [48,49,50,51]. Some authors reported that water deficiency leads to an increased CP content in faba bean seeds [52,53]. In our study, the highest CP content was recorded in 2010, despite a deeper drought in 2011. The volume of CP in pulses depends not only on overall water availability, but also on the time and length of water stress occurring in the plant’s growth stage [54]. According to Mwanamwenge et al. [55], water stress during flowering causes a 50% reduction in faba bean yield. The main reason for the SY reduction was distortions in flower bud and pod formation, and consequently decreases in number of pods per plant. However, the compensatory effect was observed in 2011, when along with the lowest number of pods per plant, an increase in seed weight was observed [31,56]. The drought in 2010 came later than in 2011 (during seed-filling), the consequence of which was decreased seed weight, therefore increased CP content. Our studies showed a negative relationship between CP and seed weight. A negative correlation was also observed between CP and SY. A negative relationship between SY and CP content was already described in earlier studies [38,51,52]. However, our studies also indicate that the determination coefficient R2 value of the obtained dependencies relied on the time of harvest to a very small degree. A considerable impact of K and S fertilization on CPY was a direct result of a significant correlation of that feature with the seed yield (SY). For GS, the value of the determination coefficient (R2) was 0.97 (p < 0.001, CPY = 55.7 SY + 247.9), and for MS it also equaled 0.97 (p < 0.001, CPY = 67.5 SY + 240.5). Thus, the observed CPY value variations, can be explained by the changes in the SY, which resulted directly from the yield-forming functions of K and S [57,58,59,60,61,62]. In our study, the influence of K treatments on CPY depended on the harvest time. It was concluded that, for GS, the most important factor was the current level of K fertilization (K rate). For MSY, however, a positive influence of earlier soil-accumulated K was observed, demonstrated by a higher yield of K2 than K3 (despite the higher rate of K in K3 than in K2). The difference between K fertilization and the exploitation of K reserves from soil was particularly transparent in wet years. It is well recognized that a decrease in soil water content is accompanied by a subsequent decrease in transpiration rate, resulting in less mass flow of K to the root surface [12]. A positive role of S was most apparent on soil with a low concentration of K. On soil rich in K, however, S fertilization resulted in lower CPY. However, regardless of the K treatment and seed maturity, the differences between S0 and S50 were not significant. This result corroborates a greater yield-forming role of K than S within the studied conditions. In our studies, the soil contained an average S–SO4 content, and faba bean therefore had sufficient S content. However, the observed patterns indicate a need to include this element in faba bean fertilization. On average, the highest CPY increase (+30.4%) was obtained K1/S50 treatment (at maturity). For comparison, according to Cazzato et al. [28], application of 30 and 60 Kg S ha−1 increases CPY by 13.8–20.2%.
As the experiments showed, the AA composition depended considerably on the course of the weather during the growing season. The lowest EAA content in CP was registered in dry years (2010 and 2011). The scientific literature shows that Cys, Met, and Lys content correlate negatively with CP content in faba bean seeds [48,50]. In drought conditions, the albumin and globulin contents decrease and the glutelin and prolamine contents increase, which potentially lowers the EAA content [52]. According to Schumacher et al. [50], during water stress, total AA content increases, while the nutritional value of protein decreases slightly. This is a result of fewer Lys and other EAAs. Our studies also revealed a negative correlation between Lys and CP. A negative correlation between Met and CP was only observed at the GS stage. In addition, Cys content correlated positively with CP. Cys content, however, was negatively correlated with SY, regardless of the S rate. The obtained result clearly indicates a dilution effect of Cys in high-yielding plant seeds [8].
The S fertilization as reported by some authors positively affected content of SAA in pulses [25,33]. Our study does not support this phenomenon. One of the reasons could be different contents of available forms of S in the soil and type of S fertilizer. In light of the scientific literature, the effect of S fertilization may also depend on the genotype, i.e. variety [63]. Our results, however, are in line with Mona et al. [21], who proved that K fertilization causes slim increase in Lys and Cys in faba bean seeds.
The TC in seeds was approximately 0.256–0.711 g kg−1. This was close to the results obtained in other experiments carried out on large seed varieties of faba bean [64]. As the studies determined, the growing season had more impact on TC than the harvest time. Moreover, as opposed to other quality determining features, the TC also depended on the K fertilization system. A significant influence of that factor was recorded at maturity. Seeds of plants grown on K-rich soil (K2 and K4) featured a considerably lower concentration of tannins than those in K1, especially in wet years. Probably K fertilization prolongs the seed-filling stage and increases their weight [31]. This process leads to the dilution of tannins in the samples of whole-seed ground material, because they accumulate mainly in the seed coat [65]. Contrary to K treatment, the influence of S application on TC was insignificant. Previous studies indicated that elemental S application at the rates of 25 and 50 kg S ha−1 significantly increased TC [33].

5. Conclusions

The experiment did not show a significant influence of K and elemental S fertilization on CP content and AA composition. The main factor determining faba bean quality was the course of weather during growing season. However, a slight enhancement of biological value of protein in mature seeds is possible through increased sulfur AA content, especially Met, during a simultaneous application of S (50 kg S ha−1) and lower rate of K (33.3 kg K ha−1), on soils with medium concentration of plant available K. In contrast to CP and AAs, tannin content was significantly dependent on K fertilization. The increase of plant available K in soil resulted in a lower tannin content, especially in mature seeds. To ensure a high yield of protein, the soil should be also characterized by a high content of available K. In soil with low or medium K content, additional application of elemental S at the rate of 50 kg S ha−1 contributed to increased soil K productivity.

Author Contributions

Conceptualization, P.B. and W.G.; methodology, W.G.; validation, P.B. and R.Ł.; formal analysis, P.B.; investigation, P.B. and R.Ł.; resources, P.B. and R.Ł.; data curation, P.B. and R.Ł.; writing—original draft preparation, P.B., W.G. and R.Ł.; writing—review and editing, P.B. and W.G.; visualization, P.B.; supervision, W.G.; and project administration, P.B.

Funding

The study was financed by the National Science Centrum, Kraków, Poland, Grant no. N N310 026139.

Acknowledgments

The authors would like to thank to the Research Centre for Cultivar Testing (COBORU) in Słupia Wielka, Poznań for tannins analyses; the Department of Animal Nutrition and Feed Management, Poznan University of Life Sciences for amino acids analysis; and the editor and reviewers for their valuable comments and suggestions, which substantially improved the manuscript.

Conflicts of Interest

The authors declare no conflict of interest.

References

  1. Crépon, K.; Marget, P.; Peyronnet, C.; Carrouée, B.; Arese, P.; Duc, G. Nutritional value of faba bean (Vicia faba L.) seeds for feed and food. Field Crop Res. 2010, 115, 329–339. [Google Scholar] [CrossRef]
  2. Singh, A.K.; Bharati, R.C.; Manibhushan, N.C.; Pedpati, A. An assessment of faba bean (Vicia faba L.) current status and future prospect. Afr. J. Agric. Res. 2013, 8, 6634–6641. [Google Scholar] [CrossRef]
  3. Ofuya, Z.M.; Akhidue, V. The role of pulses in human nutrition: A review. J. Appl. Sci. Environ. Manag. 2005, 9, 99–104. [Google Scholar] [CrossRef]
  4. Duranti, M. Grain legume proteins and nutraceutical properties. Fitoterapia 2006, 77, 67–82. [Google Scholar] [CrossRef]
  5. Rabey, J.M.; Vered, Y.; Shabtai, H.; Graff, E.; Korczyn, A.D. Improvement of Parkinsonian features correlate with high plasma levodopa values after broad bean (Vicia faba) consumption. J. Neurol. Neurosurg. Psychiatry 1992, 55, 725–727. [Google Scholar] [CrossRef] [PubMed]
  6. Jensen, E.S.; Peples, M.B.; Hauggaard-Nielson, H. Faba bean in cropping systems. Field Crop Res. 2010, 115, 203–216. [Google Scholar] [CrossRef] [Green Version]
  7. Alhajj Ali, S.; Tedone, L.; Verdini, L.; Cazzato, E.; De Mastro, G. Wheat Response to No-Tillage and Nitrogen Fertilization in a Long-Term Faba Bean-Based Rotation. Agronomy 2019, 9, 50. [Google Scholar] [CrossRef]
  8. Duc, G. Faba bean (Vicia faba L.). Field Crop Res. 1997, 53, 99–109. [Google Scholar] [CrossRef]
  9. Ghassemi-Golezani, K.; Ghanehpoor, S.; Dabbagh Mohammadi-Nasab, A. Effects of water limitation on growth and grain filling of faba bean cultivars. J. Food Agric. Environ. 2009, 7, 442–447. [Google Scholar]
  10. Khan, H.R.; Paull, J.G.; Siddique, K.H.M.; Stoddard, F.L. Faba bean breeding for drought-affected environments: Aphysiological and agronomic perspective. Field Crop Res. 2010, 115, 279–286. [Google Scholar] [CrossRef]
  11. López-Bellido, F.J.; López-Bellido, L.; López-Bellido, R.J. Competition, growth and yield of faba bean (Vicia faba L.). Eur. J. Agron. 2005, 23, 359–378. [Google Scholar] [CrossRef]
  12. Grzebisz, W.; Gransee, A.; Szczepaniak, W.; Diatta, J. The effects of potassium fertilization on water-use efficiency in crop plants. J. Plant Nutr. Soil Sci. 2013, 176, 355–374. [Google Scholar] [CrossRef] [Green Version]
  13. Zörb, C.; Senbayram, M.; Peiter, E. Potassium in agriculture—Status and perspectives. J. Plant Physiol. 2014, 171, 656–669. [Google Scholar] [CrossRef] [PubMed]
  14. Cakmak, I. The role of potassium in alleviating detrimental effects of abiotic stresses in plants. J. Plant Nutr. Soil Sci. 2005, 168, 521–530. [Google Scholar] [CrossRef]
  15. Pettigrew, W.W. Potassium influences on yield and quality production for maize, wheat, soybean and cotton. Physiol. Plant 2008, 133, 670–681. [Google Scholar] [CrossRef] [PubMed]
  16. Marschner, H.; Kirkby, E.A.; Cakmak, J. Effect of mineral nutritional status on shoot-root partitioning of photo-assimilates and cycling of mineral nutrients. J. Exp. Bot. 1996, 47, 1255–1263. [Google Scholar] [CrossRef]
  17. Kurdali, F.; Al-Ain, F.; Al-Shamma, M. Nodulation, dry matter production, and N2 fixation by fababean and chickpea as affected by soil moisture and potassium fertilizer. J. Plant Nutr. 2002, 25, 355–368. [Google Scholar] [CrossRef]
  18. Römheld, V.; Kirkby, E.A. Research on potassium in agriculture: Needs and prospects. Plant Soil 2010, 335, 155–180. [Google Scholar] [CrossRef]
  19. Taha, A.A.; Omar, M.M.; Hadeer, R.K. Effect of different sources and levels of potassium on growth, yield and chemical composition of faba bean. J. Soil Sci. Agric. Eng. Mansoura Univ. 2016, 7, 243–248. [Google Scholar]
  20. Gremigni, P.; Wong, M.; Edwards, N.; Harris, D.; Hamblin, J. Potassium nutrition effects on seed alkaloid concentrations, yield and mineral content of lupins (Lupinus angustifolius). Plant Soil 2001, 234, 131–142. [Google Scholar] [CrossRef]
  21. Mona, A.M.; Sabah, M.A.; Rehab, A.M. Influence of potassium sulphate on faba bean yield and quality. Aust. J. Basic Appl. Sci. 2011, 5, 87–95. [Google Scholar]
  22. Scherer, H.W. Sulfur in soils. J. Plant Nutr. Soil. Sci. 2009, 172, 326–335. [Google Scholar] [CrossRef]
  23. Tabe, L.; Higgins, T. Engineering plant protein composition for improved nutrition. Trends Plant Sci. 1998, 3, 282–296. [Google Scholar] [CrossRef]
  24. Neugschwandtner, R.; Ziegler, K.; Kriegner, S.; Wagentristl, H.; Kaul, H.P. Nitrogen yield and nitrogen fixation of winter faba beans. Acta Agric. Scand. Sect. B 2015, 65, 658–666. [Google Scholar] [CrossRef]
  25. Głowacka, A.; Gruszecki, T.; Szostak, B.; Michałek, S. The response of common bean to sulphur and molybdenum fertilization. Int. J. Agron. 2019, 2019, 3830712. [Google Scholar] [CrossRef]
  26. Kaiser, B.N.; Gridley, K.L.; Brady, J.N.; Phillips, T.; Tyerman, S.D. The role of molybdenum in agricultural plant production. Ann. Bot. 2005, 96, 745–754. [Google Scholar] [CrossRef]
  27. Mendel, R.R.; Bittner, F. Cell biology of molybdenum. Biochim. Biophys. Acta 2006, 1763, 621–635. [Google Scholar] [CrossRef] [Green Version]
  28. Cazzato, E.; Tufarelli, V.; Ceci, E.; Stellacci, A.M.; Laudadio, V. Quality, yield and nitrogen fixation of faba bean seeds as affected by sulphur fertilization. Acta Agric. Scand. Sect. B 2012, 62, 732–738. [Google Scholar] [CrossRef]
  29. Zhou, L.I.; Cao, J.; Zhang, F.S.; Li, L. Rhizosphere acidification of faba bean, soybean and maize. Sci. Total Environ. 2009, 407, 4359–4362. [Google Scholar] [CrossRef]
  30. Niewiadomska, A.; Barłóg, P.; Borowiak, K.; Wolna-Maruwka, A. The effect of sulphur and potassium fertilisation on the nitrogenase and microbial activity in soil under broad bean (Vicia faba L.) cultivation. Fresenius Environ. Bull. 2015, 24, 723–732. [Google Scholar]
  31. Barłóg, P.; Grzebisz, W.; Łukowiak, R. Faba bean yield and growth dynamics in response to soil potassium availability and sulfur application. Field Crop Res. 2018, 219, 87–97. [Google Scholar] [CrossRef]
  32. Graham, P.H.; Vance, C.P. Legumes: Importance and constraints to greater use. Plant Physiol. 2003, 131, 872–877. [Google Scholar] [CrossRef]
  33. Wang, T.L.; Domoney, C.; Hedley, C.L.; Casey, R.; Grusak, M.A. Can we improve the nutritional quality of legume seeds? Plant Physiol. 2003, 131, 886–891. [Google Scholar] [CrossRef]
  34. Elscheikh, E.A.E.; Elzidany, A.A. Effect of Rhizobium inoculation, organic and chemical fertilizers on proximate composition, in vitro protein digestibility, tannin and sulphur content of faba beans. Food Chem. 1997, 59, 41–45. [Google Scholar] [CrossRef]
  35. Jansman, A.J.M. Tannins in feedstuffs for simple stomached animals. Nutr. Res. Rev. 1993, 6, 209–236. [Google Scholar] [CrossRef]
  36. Delimont, N.M.; Haub, M.D.; Lindshield, B.L. The impact of tannin consumption on iron bioavailability and status: A narrative review. Curr. Dev. Nutr. 2017, 1, 1–12. [Google Scholar] [CrossRef]
  37. Turco, I.; Ferretti, G.; Bacchetti, T. Review of the health benefits of Faba bean (Vicia faba L.) polyphenols. J. Food Nutr. Res. 2016, 55, 283–293. [Google Scholar]
  38. Burstin, J.; Gallardo, K.; Mir, R.R.; Varshney, R.K.; Duc, G. Improving protein content and nutrition quality. In Biology and Breeding of Food Legumes; Pratap, A., Kumar, J., Eds.; CAB International: Wallingford, UK, 2011; pp. 314–328. [Google Scholar]
  39. Lisiewska, Z.; Kmiecik, W.; Słupski, J. Content of amino acids in raw and frozen broad beans (Vicia faba var. major) seeds at milk maturity stage, depending on the processing method. Food Chem. 2007, 105, 1468–1473. [Google Scholar] [CrossRef]
  40. Burbano, C.; Cuadrado, C.; Muzquiz, M.; Cubero, J.I. Variation of favism—Inducing factors (vicine, convicine and L-Dopa) during pod development in Vicia faba L. Plant Food Hum. Nut. 1995, 47, 265–275. [Google Scholar] [CrossRef]
  41. WRB. World reference base for soil resources 2014. In Word Soil Resources Reports, 106; Food and Agriculture Organization of the United Nations: Rome, Italy, 2015. [Google Scholar]
  42. Meier, U. Phenological growth stages and BBCH-identification keys of faba bean (Vicia faba L.). In Growth Stages of Mono- and Dicotyledonous Plants, 2nd ed.; Meier, U., Ed.; Federal Biological Research Centre for Agriculture and Forestry: Berlin and Braunschweig, Germany, 2001. [Google Scholar]
  43. AOAC. Official Methods of Analysis of the Association of Official Analytical Chemists, 15th ed.; Herlich, K., Ed.; Association of Official Analytical Chemists Inc.: Arlington, VA, USA, 1990. [Google Scholar]
  44. Kuhla, S.; Ebmeier, C. Untersuchungen zum Tanningehalt in Ackerbohnen. Arch. Tierernahr. 1981, 31, 573–588. [Google Scholar] [CrossRef]
  45. Oser, B.L. An integrated essential amino acid index for predicting the biological value of proteins. In Protein and Amino Acid Nutrition; Albanese, A.A., Ed.; Academic Press: New York, NY, USA, 1959; pp. 295–311. [Google Scholar]
  46. FAO/WHO/UNU. Protein and amino acid requirements in human nutrition. In WHO Technical Report Series; No. 935; Joint FAO/WHO/UNU Expert Consultation on Protein and Amino Acid Requirements in Human Nutrition, Food and Agriculture Organization of the United Nations, World Health Organization and United Nations University: Geneva, Switzerland, 2007. [Google Scholar]
  47. StatSoft Inc. Electronic Statistics Textbook; StatSoft Inc.: Tulsa, OK, USA, 2013. [Google Scholar]
  48. Lafiandra, D.; Polignano, G.B.; Filippetti, A.; Porceddu, E. Genetic variability for protein content and S-aminoacids in broad-beans (Vicia faba L.). Kulturpflanze 1981, 29, 115–127. [Google Scholar] [CrossRef]
  49. Avola, G.; Gresta, F.; Abbate, V. Diversity examination based on physical, technological and chemical traits in a locally grown landrace of faba bean (Vicia faba L. var. major). Int. J. Food Sci. Technol. 2009, 44, 2568–2576. [Google Scholar] [CrossRef]
  50. Schumacher, H.; Paulsen, H.M.; Gau, A.E.; Link, W.; Jörgens, H.U.; Sassand, O.; Dietrich, R.D. Seed protein amino acid composition of important local grain legumes Lupinus angustifolius L., Lupinus luteus L., Pisum sativum L. and Vicia faba L. Plant Breed. 2011, 30, 156–164. [Google Scholar] [CrossRef]
  51. Mohammed, Y.A.; Chen, C.; Walia, M.K.; Torrion, J.A.; McVay, J.; Lamb, P.; Miller, P.; Eckhoff, J.; Miller, J.; Khan, Q. Dry pea (Pisum sativum L.) protein, starch, and ash concentrations as affected by cultivar and environment. Can. J. Plant Sci. 2018, 98, 1188–1198. [Google Scholar] [CrossRef]
  52. Alghamdi, S.S. Chemical Composition of Faba Bean (Vicia faba L.) Genotypes under Various Water Regimes. Pak. J. Nutr. 2009, 8, 477–482. [Google Scholar]
  53. El Fiel, H.E.A.; El Tinay, A.H.; Elscheikh, E.A.E. Effect of nutritional status of faba bean (Vicia faba L.) on protein solubility profiles. Food Chem. 2002, 76, 219–223. [Google Scholar] [CrossRef]
  54. Foroud, N.; Mûndel, H.H.; Saindon, G.; Entz, T. Effect of level and timing of moisture stress on soybean yield, protein, and oil responses. Field Crop Res. 1993, 31, 195–209. [Google Scholar] [CrossRef]
  55. Mwanamwenge, J.; Loss, S.P.; Siddique, K.H.M.; Cocks, P.S. Effect of water stress during floral initiation, flowering and podding on the growth and yield of faba bean (Vicia faba L.). Eur. J. Agron. 1999, 9, 273–293. [Google Scholar] [CrossRef]
  56. Barłóg, P.; Niewiadomska, A.; Ambroży-Deręgowska, K. Effect of sulphur fertilization on seed yield and yield components of broad bean on the background of different levels of potassium content in soil. Fragm. Agron. 2014, 31, 7–17. [Google Scholar]
  57. Singh, N.; Kuhad, M.S. Role of Potassium in Alleviating the Effect of Water Stress on Yield and Seed Quality in Chickpea (Cicer arietinum L.). Bull. Natl. Inst. Ecol. 2005, 15, 219–225. [Google Scholar]
  58. Fan, S.; Lifang, H.; Jin, H.; Li, Z. Improvement of Root Nodule Nitrogen Fixation and Soil Fertility by Balanced Fertilization of Broad Beans. Better Crops Int. 1997, 11, 22–23. [Google Scholar]
  59. Habtemichial, K.H.; Singh, B.R.; Aune, J.B. Wheat response to N2 fixed by faba bean (Vicia faba L.) as affected by sulfur fertilization and rhizobial inoculation in semi-arid Northern Ethiopia. J. Plant Nutr. Soil Sci. 2007, 170, 412–418. [Google Scholar] [CrossRef]
  60. Pacyna, S.; Schulz, M.; Scherer, H. Influence of sulphur supply on glucose and ATP concentrations of inoculated broad beans (Vicia faba minor L.). Biol. Fertil. Soils 2006, 42, 324–329. [Google Scholar] [CrossRef]
  61. Zhao, F.; Wood, A.; McGrath, S. Effects of sulphur nutrition on growth and nitrogen fixation of pea (Pisum sativum L.). Plant Soil 1999, 212, 209–219. [Google Scholar] [CrossRef]
  62. Hussain, K.; Islam, M.; Siddique, M.T.; Hayat, R.; Mohsan, S. Soybean growth and nitrogen fixation as affected by sulfur fertilization and inoculation under rainfed conditions in Pakistan. Int. J. Agric. Biol. 2011, 13, 951–955. [Google Scholar]
  63. Pandurangan, S.; Sandercock, M.; Beyaert, R.; Conn, K.L.; Hou, A.; Marsolais, F. Differential response to sulfur nutrition of two common bean genotypes differing in storage protein composition. Front. Plant Sci. 2015, 6, 92. [Google Scholar] [CrossRef] [PubMed]
  64. Baginsky, C.; Peña-Neira, A.; Cáceres, A.; Hernández, T.; Estrella, I.; Morales, H.; Pertuze, R. Phenolic compound composition in immature seeds of fava bean (Vicia faba L.) varieties cultivated in Chile. J. Food Compos. Anal. 2013, 31, 1–6. [Google Scholar] [CrossRef]
  65. Amarowicz, R.; Pegg, R.B. Legumes as a source of antioxidants. Eur. J. Lipid Sci. Technol. 2008, 110, 855–878. [Google Scholar] [CrossRef]
Figure 1. Mean daily air temperature and precipitation during 2010–2013 growing seasons of faba bean. Key growth stages: SF, start of flowering; MS, mature seeds (harvest).
Agronomy 09 00209 g001
Figure 2. Effect of interaction between K and S application on crude protein yield (CPY) in: (a) immature seeds; and (b) mature seeds. K1, K2, K3, and K4 refer to levels of soil K availability and fertilization; S0, S25, and S50 refer to sulfur application at rates of 0, 25, and 50 kg S ha−1, respectively. Letters indicate significant differences between treatments (p < 0.05). Hatched bars represent 2 × standard error (SE) ranges.
Agronomy 09 00209 g002
Figure 3. Effect of interaction between K and S application on Cys content in: (a) immature seeds; and (b) mature seeds. K1, K2, K3, and K4 refer to levels of soil K availability and fertilization; S0, S25, and S50 refer to sulfur application at rates of 0, 25, and 50 kg S ha−1, respectively. Letters indicate significant differences between treatments (p < 0.05). Hatched bars represent 2 × standard error (SE) ranges.
Agronomy 09 00209 g003
Figure 4. Effect of interaction between K and S application on Met content in: (a) immature seeds; and (b) mature seeds. K1, K2, K3, and K4 refer to levels of soil K availability and fertilization; S0, S25, and S50 refer to sulfur application at rates of 0, 25, and 50 kg S ha−1, respectively. Letters indicate significant differences between treatments (p < 0.05). Hatched bars represent 2 × standard error (SE) ranges.
Agronomy 09 00209 g004
Figure 5. Cysteine (Cys) content as a function of seed yield (SY) at three levels of sulfur application: S0, S25, S50 at rates of 0, 25, and 50 kg S ha−1, respectively, for: (a) immature seeds; and (b) mature seeds.
Agronomy 09 00209 g005
Table 1. Soil chemical properties in early spring as a result of stationary long-term field experiments, varied K fertilization (mean ± standard error of mean for 2010–2013).
Soil Depth, mK TreatmentpH
1 M KCl
Nutrient Content, mg kg−1
P 1K 1Mg 2S-SO4 3
0–0.3K16.16 ± 0.54101.8 ± 19.387.0 ± 27.253.4 ± 14.68.5 ± 7.7
K26.23 ± 0.54108.3 ± 15.8131.8 ± 35.157.0 ± 19.510.0 ± 9.3
K36.28 ± 0.50103.2 ± 24.8108.3 ± 29.652.2 ± 13.37.2 ± 5.3
K46.34 ± 0.48107.3 ± 23.0167.3 ± 34.657.6 ± 18.76.6 ± 4.3
0.3–0.6K15.98 ± 0.4782.1 ± 25.197.4 ± 33.959.7 ± 22.35.9 ± 4.2
K26.00 ± 0.4988.1 ± 32.9108.1 ± 26.667.9 ± 17.27.9 ± 6.9
K36.18 ± 0.5786.7 ± 41.7107.0 ± 32.563.9 ± 10.47.0 ± 5.9
K46.28 ± 0.6187.8 ± 37.0125.7 ± 38.562.8 ± 18.77.2 ± 5.6
1 Double Lactate method, pH 3.6 (1:50 w/v ratio); 2 0.0125 M CaCl2 (1:10 w/v ratio); 3 2% CH3COOH (1:10 w/v ratio).
Table 2. Three-way ANOVA results (F values): effect of year (Y), potassium (K), sulfur (S) application, and interaction between factors on crude protein content (CP) and crude protein yield (CPY) depending on seed maturity. GS, immature seeds; MS, mature seeds.
FactorDegr. of FreedomCPCPY
GSMSGSMS
Y333.1 ***93.3 ***30.0 ***42.6 ***
K30.21.52.7 *18.5 ***
S20.01.01.74.9 **
Y × K90.41.30.52.8 **
Y × S60.31.00.50.8
K × S60.20.61.72.6 *
Y × K × S180.20.50.50.7
Error144
*, **, and ***, significant level for p < 0.05, 0.01, and 0.001, respectively.
Table 3. Effect of growing season, K treatment, and S application on crude protein content (CP) and crude protein yield (CPY) depending on seed maturity. GS, immature seeds; MS, mature seeds.
FactorCP
g kg−1
CPY
kg ha−1
GSMSGSMS
Year
2010312.0 a296.3 a412.7 b520.5 b
2011274.9 b270.2 b346.3 b464.3 b
2012266.9 c256.8 c633.5 a772.1 a
2013270.4 bc266.9 b656.5 a730.9 a
K treatments
K1280.6275.3468.5 b490.1 b
K2280.8271.9491.4 ab667.8 a
K3284.8274.3551.2 a634.0 a
K4281.0268.7537.9 a696.0 a
S treatments
S0281.4273.4480.9586.6 b
S25279.5271.9517.7611.7 ab
S50284.5272.4538.2667.6 a
Different letters indicate statistically significant differences between treatments at p < 0.05 (Tukey’s test).
Table 4. Effect of years and K treatments on tannin content (mg kg−1) in immature seeds (GS) and mature seeds (MS) of faba bean.
Seed MaturityK TreatmentYearMean
2010201120122013
GSK10.3560.2840.4870.7430.467
K20.3850.2420.3790.6790.421
K30.3890.2810.4640.7120.462
K40.3280.2190.3500.7120.402
Mean0.364 b0.256 c0.420 b0.711 a
MSK10.4010.3840.6180.5240.482 a
K20.3960.3550.3780.4740.401 b
K30.3360.3760.5370.4640.428 ab
K40.4100.3620.4070.4140.398 b
Mean0.376 a0.369 a0.535 b0.469 ab
Different letters indicate statistically significant differences between treatments at p < 0.05 (Tukey’s test).
Table 5. Effect of growing season, K treatment, and S application on amino acid composition of immature seeds (GS) of faba bean (g 100g−1 of CP).
FactorAspTreSerGluProCysGliAlaWalMetIleLeuTyrFenHisLizArgTAA 1EAA 2
Year
20108.29 a3.04 b3.96 b16.1 a5.12 a0.94 b3.41 b3.59 c3.76 a0.50 b3.13 c6.05 c2.99 a3.61 b2.74 a4.83 c7.47 b79.6 c31.6 b
20118.58 b2.80 c3.76 c16.2 a4.93 a1.05 a3.48 b3.77 b3.77 b0.60 b3.26 b6.39 b2.57 c3.21 c2.30 c5.04 b6.36 d78.1 c31.0 b
20129.55 a3.23 a4.33 a13.2 c4.04 b0.70 d3.89 a3.76 b4.49 a0.72 a3.71 a6.64 a2.91 ab4.03 a2.54 b6.58 a9.38 a83.7 a35.6 a
20138.37 ab2.63 d3.44 d14.1 b2.78 c0.85 c3.21 c4.41 a3.66 b0.57 b3.06 c5.51 d2.72 bc3.05 c2.29 c4.68 c7.02 c72.3 c29.0 c
F3,44*********************************************************
K treatments
K18.652.923.8714.794.270.923.503.833.890.583.316.122.843.482.455.267.5878.331.8
K28.692.903.8814.994.270.903.493.954.120.603.316.152.833.502.485.317.5578.932.1
K38.692.953.8814.934.170.863.513.833.790.583.236.132.743.432.455.227.5077.931.4
K48.762.933.8614.984.150.843.503.933.870.633.306.182.793.492.495.347.6078.631.9
F3,44n.s.n.s.n.s.n.s.n.s.n.s.n.s.n.s.n.s.n.s.n.s.n.s.n.s.n.s.n.s.n.s.n.s.n.s.n.s.
S treatments
S08.632.933.8714.94.180.883.493.864.040.633.316.162.843.542.505.327.6378.732.2
S258.702.903.8514.84.250.873.493.913.850.603.276.112.763.402.415.227.3977.831.4
S508.772.943.8915.04.220.893.523.873.870.563.286.172.803.482.495.317.6578.731.8
F2,45n.s.n.s.n.s.n.s.n.s.n.s.n.s.n.s.n.s.n.s.n.s.n.s.n.s.n.s.n.s.n.s.n.s.n.s.n.s.
1 TAA, total amino acid; 2 EAA, sum of exogenous amino acid; *, **, and *** F-ratio significant at p < 0.05, 0.01 and 0.001, respectively; n.s., no significant. Different letters indicate significant differences between treatments at p < 0.05 (Tukey’s test).
Table 6. Effect of growing season, K treatment, and S application on amino acid composition of mature seeds (MS) of faba bean (g 100g−1 of CP).
FactorAspTreSerGluProCysGliAlaWalMetIleLeuTyrFenHisLizArgTAA 1EAA 2
Year
20108.43 c3.15 b3.95 c15.9 b5.27 a1.25 b3.56 b3.46 b3.64 b0.723.11 b6.08 c2.70 b3.823.18 b5.65 b8.71 b82.6 ab33.3 b
20119.12 bc3.27 ab4.36 a16.6 a5.49 a1.65 a3.87 a3.81 a2.63 c0.722.08 c5.84 d3.83 a3.914.08 a5.61 b7.28 c84.1 a33.6 b
20129.40 ab3.31 a4.15 b13.0 c3.91 b0.69 c3.82 a3.72 a4.13 a0.683.52 a6.41 b2.72 a3.832.52 c6.43 a9.36 a81.6 b34.2 ab
20139.70 a3.41 a4.28ab13.4 c4.04 b0.71 c3.94 a3.84 a4.27 a0.703.63 a6.61 a2.81 b3.952.60 c6.63 a9.65 a84.2 a35.3 a
F3,44***************************n.s.*********n.s.**************
K treatments
K19.063.294.1614.54.731.073.743.653.720.673.156.163.043.642.976.008.6382.233.7
K29.283.364.2714.94.561.083.823.753.770.733.156.312.963.992.916.128.7883.834.4
K39.173.224.1914.84.731.103.833.733.560.693.046.263.093.913.236.108.8983.534.2
K49.143.274.1114.74.691.063.793.693.620.743.016.222.963.973.296.118.7183.134.2
F3,44n.s.n.s.n.s.n.s.n.s.n.s.n.s.n.s.n.s.n.s.n.s.n.s.n.s.n.s.n.s.n.s.n.s.n.s.n.s.
S treatments
S09.153.274.1814.74.691.093.833.703.650.723.076.243.153.823.056.118.7683.234.2
S259.113.264.1414.64.691.063.753.693.620.703.056.182.963.813.155.998.6982.533.8
S509.223.324.2314.84.661.093.813.733.730.703.146.292.934.003.086.138.8183.734.4
F2,45n.s.n.s.n.s.n.s.n.s.n.s.n.s.n.s.n.s.n.s.n.s.n.s.n.s.n.s.n.s.n.s.n.s.n.s.n.s.
1 TAA, total amino acid; 2 EAA, sum of exogenous amino acid; *, **, and *** F-ratio significant at p < 0.05, 0.01 and 0.001, respectively; n.s., no significant. Different letters indicate significant differences between treatments at p < 0.05 (Tukey’s test).
Table 7. Chemical scores (CS) and essential amino acid indices (EAAI) of faba bean crude protein at two stages of seed maturity. GS, immature seeds; MS, mature seeds.
FactorCSSAACSValCSLeuEAAI
GSMSGSMSGSMSGSMS
Year
201055.5 b75.9 b89.6 b86.7 b96.0 c96.5 c90.2 b94.3 a
201163.2 a88.2 a89.7 b62.6 c101.4 b92.8 d92.6 a87.4 c
201254.6 b52.8 c106.9 a98.4 a105.4 a101.7 b92.6 a92.0 b
201354.4 b54.5 c87.1 b101.6 a87.5 d105.0 a87.7 c92.6 ab
F3,44************************
K treatments
K157.863.792.788.697.197.891.291.5
K257.668.198.189.797.6100.191.192.3
K355.668.890.384.997.399.490.091.1
K456.669.292.286.298.298.790.691.4
F3,44n.s.n.s.n.s.n.s.n.s.n.s.n.s.n.s.
K × S interaction
K1S061.765.793.190.897.898.392.292.1
S2555.361.692.185.296.795.290.990.1
S5056.463.892.890.096.999.891.091.4
K2S057.566.0108.489.797.3100.091.391.9
S2557.367.693.188.297.699.490.792.3
S5058.170.792.991.298.1100.991.292.7
K3S056.967.891.683.398.297.991.090.2
S2556.169.489.184.096.198.789.591.4
S5053.969.290.287.397.7101.489.691.7
K4S056.769.192.084.398.199.890.490.9
S2558.072.292.187.497.599.290.592.4
S5055.266.192.586.799.097.090.991.0
F6,36n.s.n.s.n.s.n.s.n.s.n.s.n.s.n.s.
*, **, and *** F-ratio significant at p < 0.05, 0.01, and 0.001, respectively; n.s., no significant. Different letters indicate significant differences between treatments at p < 0.05 (Tukey’s test).
Table 8. Correlation coefficient (r) between amino acids and seed yield (SY), seed weight (SW), crude protein (CP), and tannins (T) at two stages of seed maturity.
Amino AcidsImmature Seeds (GS)Mature Seeds (MS)
SYSWCPTSYSWCPT
Asp0.43 **0.50 ***−0.51 ***−0.170.42 **0.64 ***−0.67 ***0.25
Tre0.04−0.060.11−0.42 **0.200.40 **−0.42 **0.07
Se0.020.010.02−0.47 **−0.070.37 *−0.40 **0.05
Glu−0.83 ***−0.42 **0.62 ***−0.56 ***−0.77 ***−0.51 ***0.56 ***−0.57 ***
Pro−0.80 ***−0.44 **0.57 ***−0.87 ***−0.71 ***−0.47 **0.56 ***−0.59 ***
Cys−0.74 ***−0.230.32 *−0.40 **−0.71 ***−0.39 **0.44 **−0.57 ***
Gli0.160.31 *−0.28−0.42 **0.250.59 ***−0.60 ***0.14
Ala0.56 ***0.40 **−0.50 ***0.77 ***0.120.52 ***−0.59 ***0.11
Val0.180.17−0.25−0.160.54 ***0.18−0.210.49 ***
Met0.34 *0.43 **−0.50 ***−0.07−0.23−0.120.02−0.17
Ile0.270.39 **−0.45 **−0.31 *0.56 ***0.16−0.180.50 ***
Leu−0.160.22−0.15−0.71 ***0.53 ***0.37 *−0.38 **0.37 **
Tyr0.01−0.40 **0.28−0.00−0.37 *0.10−0.13−0.30 *
Fen0.12−0.050.02−0.33 *0.030.12−0.08−0.05
His−0.21−0.51 ***0.59 ***−0.31 *−0.49 ***−0.140.24−0.46 **
Liz0.39 **0.38 **−0.45 **−0.210.65 ***0.54 ***−0.56 ***0.46 **
Arg0.51 ***0.13−0.200.050.57 ***0.20−0.170.47 **
TAA 1−0.110.010.04−0.59 ***−0.230.08−0.01−0.20
EAA 20.130.15−0.18−0.40 **0.31 *0.39 **−0.37 **0.20
1 TAA, total amino acid; 2 EAA, exogenous amino acid; *, **, and ***, significant level for p < 0.05, 0.01, and 0.001, respectively.

