Article

Nitrogen Application Improved Photosynthetic Productivity, Chlorophyll Fluorescence, Yield and Yield Components of Two Oat Genotypes under Saline Conditions

1
Joint International Research Laboratory of Agriculture and Agri-Product Safety of Ministry of Education, Yangzhou University, Yangzhou, Jiangsu, 225009, China
2
Jiangsu Institute of Agricultural Sciences for Region along the Yangtze River, Nantong, Jiangsu, 226541, China
3
Ottawa Research and Development Centre, Agriculture and Agri-Food Canada, Ottawa, ON, K1A 0C6, Canada
*
Authors to whom correspondence should be addressed.
Agronomy 2019, 9(3), 115; https://doi.org/10.3390/agronomy9030115
Submission received: 21 January 2019 / Revised: 21 February 2019 / Accepted: 21 February 2019 / Published: 27 February 2019

Abstract

:
Understanding the interaction between salinity and nitrogen (N) nutrition is of great economic importance to improve plant growth and grain yield for oat plants. The objective of this study was to investigate whether N application could alleviate the negative effect of salinity (NaCl) stress on oat physiological parameters and yield performance. Two oat genotypes with contrasting salt tolerance response (6-SA120097, a salt-tolerant genotype SA and 153-ND121147, salt-sensitive ND) were grown under four N rates (0, 100, 200, and 400 mg N pot−1) in non-saline and saline (100 mM NaCl) conditions. The results showed that salinity, N fertilization and their interaction significantly affected the photosynthetic rate, transpiration rate, agronomic nitrogen use efficiency (aNUE), physiological nitrogen efficiency (pNUE) and apparent nitrogen recovery (ANR), seed number, and grain yield. Saline stress reduced gas exchange rate, nitrogen use efficiency (NUE), grain yield, and yield components. N fertilization increased photosynthetic productivity and chlorophyll fluorescence, resulting in improved grain yields and yield components for both genotypes. On average, the photosynthetic rate was increased by 38.7%, 74.1%, and 98.8% for SA and by 49.8%, 77.6%, and 110% for ND, respectively, under the N rates of 100, 200, and 400 mg N pot−1, as compared with non-fertilized treatment. In addition, grain yield was increased by 80.6% for genotype SA and 88.7% for genotype ND under higher N application rate (200 mg N pot−1) in comparison with the non-nitrogen treatment. Our experimental results showed that an increase of N supply can alleviate the negative effects induced by salinity stress and improved plant growth and yield by maintaining the integrity of the photosynthesis and chlorophyll fluorescence processes of oat plants, which provides a valuable agronomic strategy for improving oat production in salt-affected soils.

1. Introduction

Saline stress has become one of the major abiotic stresses restricting crop productivity and agricultural sustainability in many areas of the world, especially in arid and semiarid regions [1,2]. Currently, more than 20% of the world’s cultivated areas are affected by salinity [3]. It is estimated that more than 34 million hectares of farming lands are affected by salinity in China [4,5]. There is an urgent need to develop crops adapted to saline soils and corresponding agronomic practices to maintain crop productivity and exploit salt-affected soils.
Oat (Avena sativa L.), as a crop both for grain and forage uses, has obtained renewed attention worldwide due to its rich-nutrient with high protein content, minerals, and dietary fibers. With population growth and increasing demand for food, large fertile farming lands previously cultivated to oat have been replaced by other high-yielding crops like rice and maize [6]. Oat production has moved to marginal lands that are prone to salt accumulation, since it is more salt-tolerant than most food crops. However, the increasing saline stress, due to high evapotranspiration and limited rainfall as well as poor soil management, has adversely affected its growth, nutritive value, and yield capacity [7,8]. Alternative cultural techniques are being developed to reduce the adverse effects of salinity on crop growth and production. Proper application of fertilizer is a convenient and effective practice to improve yield and nutritive value for oat plants.
As compared with other nutrients, nitrogen (N) is required most consistently in larger amounts for oat production [9]. N fertilization has a significant impact on plant growth, yield components, and quality. It was also reported that nitrogen fertilization improves salinity tolerance of cotton plants [10], because N can play both nutritional and osmotic roles in saline conditions. However, implementing of appropriate N application methods in crops is particularly difficult due to the problems with excessive or inadequate rates or some abiotic stresses such as salt and drought. It is understood that the growth inhibition and the adverse effects induced by saline stress can be alleviated by proper use of fertilizer in some trees and crops such as apple (Malus pumila) [11], pine (Pinus) [12], maize (Zea mays L.) [13], rice (Oryza. sativa L.) [14], wheat (Triticum aestivum L.) [15], and cotton (Gossypium spp.) [10]. For oat plants, however, the possibility of applying N fertilizer to alleviate the negative effects of saline stress on plant performance in salt-affected soils has not been studied; therefore, information about plant physiological, growth and yield responses to salinity will be valuable for maintaining oat production.
Nitrogen has been recognized as an essential management practice to supply nutrition for oat growth and yield improvement. However, previous studies focused on the response of oat plants to salt stress or fertilization separately [16,17], and little information is available regarding the interactive effects of salinity and N fertilization on the physiological and yield responses. Information regarding the interactive effects between salt stress and N fertilization on crop performance will be useful for improving current exploitation practices to establish oat plants in salt-affected soils. This study aims to (1) determine the physiological (photosynthetic rate and chlorophyll fluorescence parameters) and yield response to interactive effects between N application rate and saline stress for two oat genotypes; and (2) verify whether increasing N application could alleviate the negative effects of saline stress in terms of grain yield and physiological parameters.

2. Materials and Methods

A controlled pot experiment was done in the greenhouse from November 2016 to May 2017 at the Ottawa Research and Development Centre, Agriculture and Agri-Food Canada (AAFC), Ontario, Canada. The study was conducted for two runs. The nitrogen, salinity levels, and other practices were totally the same in the two runs. Gas exchange, chlorophyll fluorescence, and electrical conductivity (EC) were determined for both runs. Grain yield and yield components were only recorded in the second run. Unless otherwise specified, the data presented were the results of the second run.

2.1. Experimental Design

The experiment was a 2 × 4 × 2 completely randomized design with two genotypes, four N levels and two saline levels. Each treatment was replicated three times. There were 48 pots in total for each run in the study. Two oat genotypes with distinctive differences in salt tolerance [18], 6-SA120097 (salt tolerant, abbreviated as SA) and 153-ND121147 (salt sensitive, abbreviated as ND), were used. Considering the fact that numerous studies have been conducted to investigate the response of oat germination to salinity stress [16,19], the soil salinity (NaCl) treatments were incorporated into the pots at the tillering stage in the study. The soil salinity levels were 100 mM NaCl and non-saline control. The resulting salinity level was based on the previous study for oat, which was referred to as medium salinity [16]. The amount of N was estimated with a population of 3,000,000 plants ha−1 according to common field practice used by local farmers. For each pot, 20 uniform seeds were selected and sown by hand at the seeding depth of 20–30 mm. All the pots were thinned to 6 seedlings per pot after emergence. The N application rates were 0, 50, 100, 200 kg ha−1, which correspond to 0, 100, 200, and 400 mg N per pot in terms of plant population density. The nitrogen was applied 4 times, as basal fertilizer (30%) and topdressing at tillering (30%), booting (20%), and flowering (20%). Both NaCl and nitrogen nutrition (N) were dissolved in the same amount of deionized water and applied into pots. The control treatment of soil was made by adding tap water.
All the pots (16 cm in diameter and 20 cm in height) were filled with the mixture of sand, top-layer soil taken from a nearby field, peat moss, and vermiculite (3:5:1:1 in volume). Each pot was filled with 5 kg air-dried potting media. The potting media contained 52 g kg−1 organic matter, 19 mg kg−1 available P, 160 mg kg−1 available K, and 170 mg kg−1 mineral N, with a pH of 6.9. A plastic saucer was placed underneath each pot to catch the leachable solution if any and then the solution was poured back into the pots. In order to ensure the plants did not suffer from moisture stress, all the pots were watered with 300 mL tap water every other day from sowing to heading and 500 mL tap water every day from heading to physiological maturity. Electrical conductance (EC) of potting media was recorded for each pot using a soil EC meter (Direct Soil EC Meter, Spectrum Technologies Inc., Aurora, CO, USA) at different stages. The testing point of the EC meter was placed at a 15 cm soil depth. The greenhouse was maintained at a 25/16 °C (day/night) temperature regime with a 16 h photoperiod during the whole growing period. The pots were rotated on the bench weekly to avoid any variations in ventilation and lighting conditions inside the greenhouse during the experiment.

2.2. Sampling and Measurement Parameters

2.2.1. Photosynthesis and Chlorophyll Fluorescence

The net photosynthetic rate (Pn), stomatal conductance (gs), and transpiration rate (E) on flag leaves were measured at the flowering stage using an open gas-exchange system (LI-6400F; LI-COR, Inc., Lincoln, NE, USA). The system was set at 50% relative humidity, 400 μmol mol−1 CO2, and 1500 μmol m−2 s−1 photosynthetic photon flux density within the cuvette. A red/blue LED light source was provided during the measurements.
Chlorophyll fluorescence was analyzed using a portable chlorophyll fluorometer (PAM-2500, WALZ-USA, Pepperell, MA, USA) based on standard procedures as described in the PAM-2500 manual. Before measurements, all leaf samples were kept in dark conditions for 30 min and then the initial fluorescence (F0) and maximal fluorescence (Fm) were measured. The minimal fluorescence (F0) was determined using a weak red light (<0.1 μmol m−2 s−1). Then the maximum fluorescence (Fm) and maximal fluorescence emission (Fm’) were determined using a saturating pulse (8000 μmol m−2 s−1) of 0.8 s duration whereas the “actinic light” was 200 μmol m−2 s−1. Other fluorescence parameters, including steady-state fluorescence (Fs), basic fluorescence after light induction (F0’), maximum quantum efficiency of PSII (Fv/Fm), actual photochemical quantum efficiency of PSII (ΦPSII) and photochemical quenching (qP), non-photochemical quenching (NPQ), and electron transfer rate (ETR) were also recorded.

2.2.2. Growth and Yield Parameters

At maturity, plant height of each pot was measured. Then the plants were separated into panicles, shoots, and leaves. The number of panicles and the panicle length were recorded. After drying at 75 °C to a constant weight, they were weighed, and the seed number and grain yield of each pot were determined and then the samples were ground for nitrogen use efficiency determination.

2.2.3. Nitrogen Use Efficiency (NUE)

Nitrogen content was determined after Kjeldahl digestion and analyzed with a flow-injection auto-analyzer (Quik-Chem® 8000 Flow Injection Analyzer, Zellweger Analytics, Inc., Lachat Instruments, Milwaukee, WI, USA). Three NUE indices, including agronomic nitrogen use efficiency (aNUE), physiological nitrogen use efficiency (pNUE), and nitrogen recovery efficiency (NRE) were calculated as following [6,10]:
aNUE = (Yf − Y0)/Fappl
where Yf and Y0 refer to grain yield [g pot−1] in the N-applied treatment and its control; Fappl is the N rate [g N pot−1].
pNUE = (Yf − Y0)/(TNUf − TNU0)
where TNUf and TNU0 is total N uptake in the N-applied treatment and its control.
NRE = (TNUf − TNU0)/Fappl
where TNUf and TNU0 is total N uptake in the N-applied treatment and its control.

2.2.4. Statistical Analysis

The experiment was a completely randomized design, with two genotypes (SA vs. ND), two saline levels (control vs. 100 mM NaCl), and four N levels (0, 100, 200, and 400 mg N per pot). All data were analyzed using the SPSS statistical package (version 11.5, SPSS Inc., 2003). A Duncan multiple range test was carried out to determine if significant (p ≤ 0.05) difference occurred between individual treatments. All figures were produced using the SigmaPlot package (Version 13.0, SYSTAT, San Jose, CA, USA).

3. Results

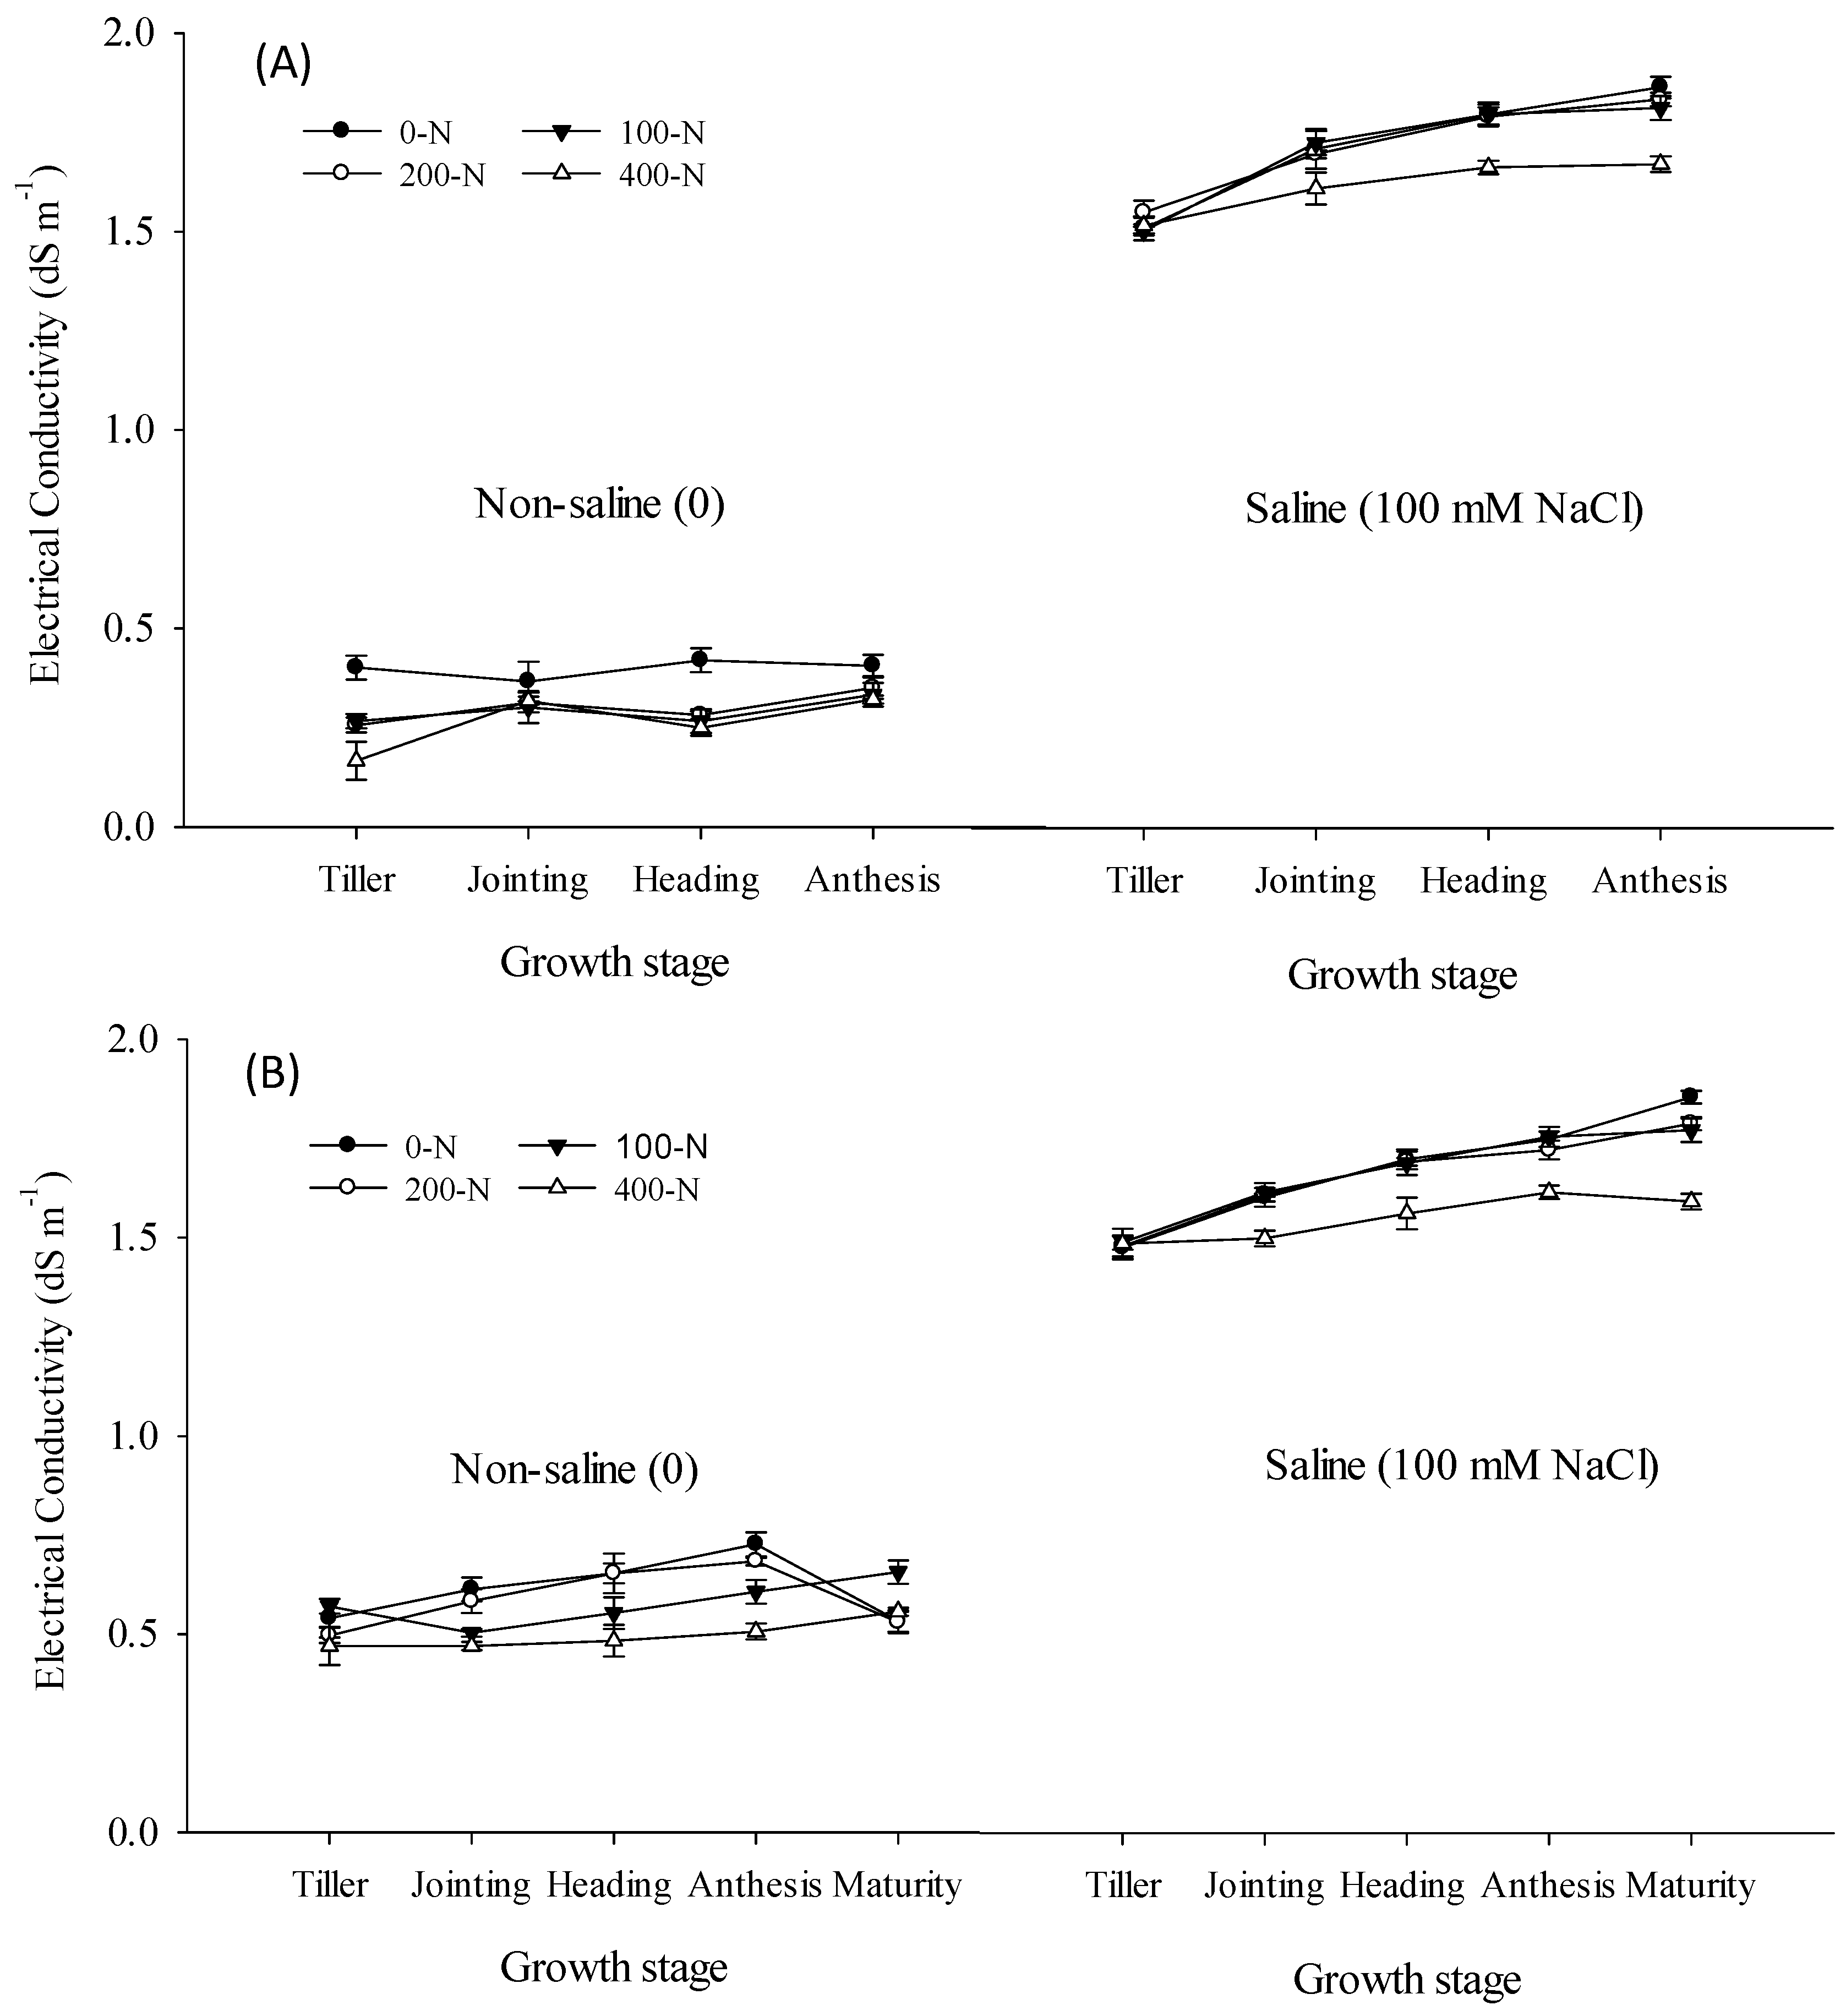
3.1. Electrical Conductivity

The EC reading of the potting media was tested between 0.4 and 0.7 dS m−1 for the non-saline treatments at all N levels, but the readings were higher than 1.5 dS m−1 for the saline treatments at all N levels (Figure 1). The readings of EC were slightly lower at the higher N rates than the lower N rates during the growing season of oat plants. As the growth proceeded, the EC reading increased gradually.

3.2. Gas Exchange

Analysis of variance showed that the photosynthetic rate and transpiration rate varied significantly across salinity levels, nitrogen rates, and their interaction (Table 1 and Table 2). Plants in non-saline soils have higher photosynthetic rate, stomatal conductance, and transpiration rate, and as the salinity increased, the parameters significantly decreased for both genotypes (Table 3 and Table 4). On average, the saline treatment reduced the photosynthetic rate, stomatal conductance, and transpiration rate by 6.2%, 4.9%, and 8.1% for genotype SA and by 9.0%, 13.1%, and 6.3% for genotype ND. In contrast, fertilized plants had a higher photosynthetic rate, stomatal conductance, and transpiration rate in saline soils compared to non-fertilized treatments. For example, on average, the photosynthetic rate was increased by 38.7%, 74.1%, and 98.8% for genotype SA, and by 49.8%, 77.6%, and 110% for genotype ND, respectively, under N rates of 100, 200, and 400 mg N pot−1. Stomatal conductance and transpiration rate had a similar trend to the N rate with the photosynthetic rate. As compared with SA, the salt-sensitive genotype ND had a lower photosynthetic rate, stomatal conductance, and transpiration rate. In general, the performance of photosynthetic productivity was enhanced with increasing the N application rates for both genotypes, despite of their contrasting salt tolerance characteristics. As N rates increased from 100 to 400 mg N pot−1, the decline of the photosynthetic rate caused by saline stress was diminished from 11.6% to 5.0% for genotype SA, and from 16.1% to 5.4% for genotype ND (Figure 2A).

3.3. Chlorophyll Fluorescence

Salinity and nitrogen affected photochemical quantum efficiency of PSII (ΦPSII) and non-photochemical quenching (NPQ) (Table 5 and Table 6). Significant interactions were found between salinity and nitrogen in NPQ and electron transfer rate (ETR). There were no significant reductions in PSII maximum efficiency (Fv/Fm), qP and ETR subjected to saline treatments but a significant decrease in NPQ was detected (Table 7 and Table 8). As N fertilizer increased, chlorophyll fluorescence parameters significantly increased for both genotypes. For genotype SA, Fv/Fm increased by 4.9%, 8.3%, and 7.8% and ΦPSII by 3.1%, 11.4%, and 4.6%, as N rates increased from 100, 200, to 400 mg N pot−1. Similarly, for genotype ND, Fv/Fm increased by 2.2%, 4.7%, and 6.9% and ΦPSII by 10.4%, 13%, and 26%, respectively. The response patterns of qP and ETR to the N rate were the same as Fv/Fm and ΦPSII. However, the NPQ showed different responses to NaCl and N treatment, compared with Fv/Fm and ΦPSII; and increasing N rates decreased the values of NPQ. With increasing N rates from 0 to 400 mg N pot−1, there was only a minor reduction in Fv/Fm for both genotypes (from 0.41% to −0.38% for SA and from 0.54% to −0.38% for ND, respectively) under saline conditions (Figure 2B).

3.4. Nitrogen Use Efficiency

Salinity and N fertilization affected agronomic nitrogen use efficiency (aNUE), physiological nitrogen efficiency (pNUE), and apparent nitrogen recovery (ANR), and significant interactions between salinity and N were found for theses parameters (Table 9). In general, saline stress caused significant reductions in different expressions of nitrogen use efficiency (NUE), except for pNUE in genotype SA (Table 10). The values of aNUE, pNUE, and ANR in the saline treatments were decreased by 17.3%, 5.5%, and 11.9% for SA, and by 14.1%, 17.4%, and 16.1% for ND, respectively, compared with the non-saline treatment. For the same salinity level, on average, there were higher aNUE and ANR for SA than for ND, while the highest values of aNUE and ANR were recorded for both genotypes with the 200 mg N pot−1 treatment. For pNUE, the highest values were found in the lower N rate (100 mg N pot−1) and a downward trend was observed as N rates increased.

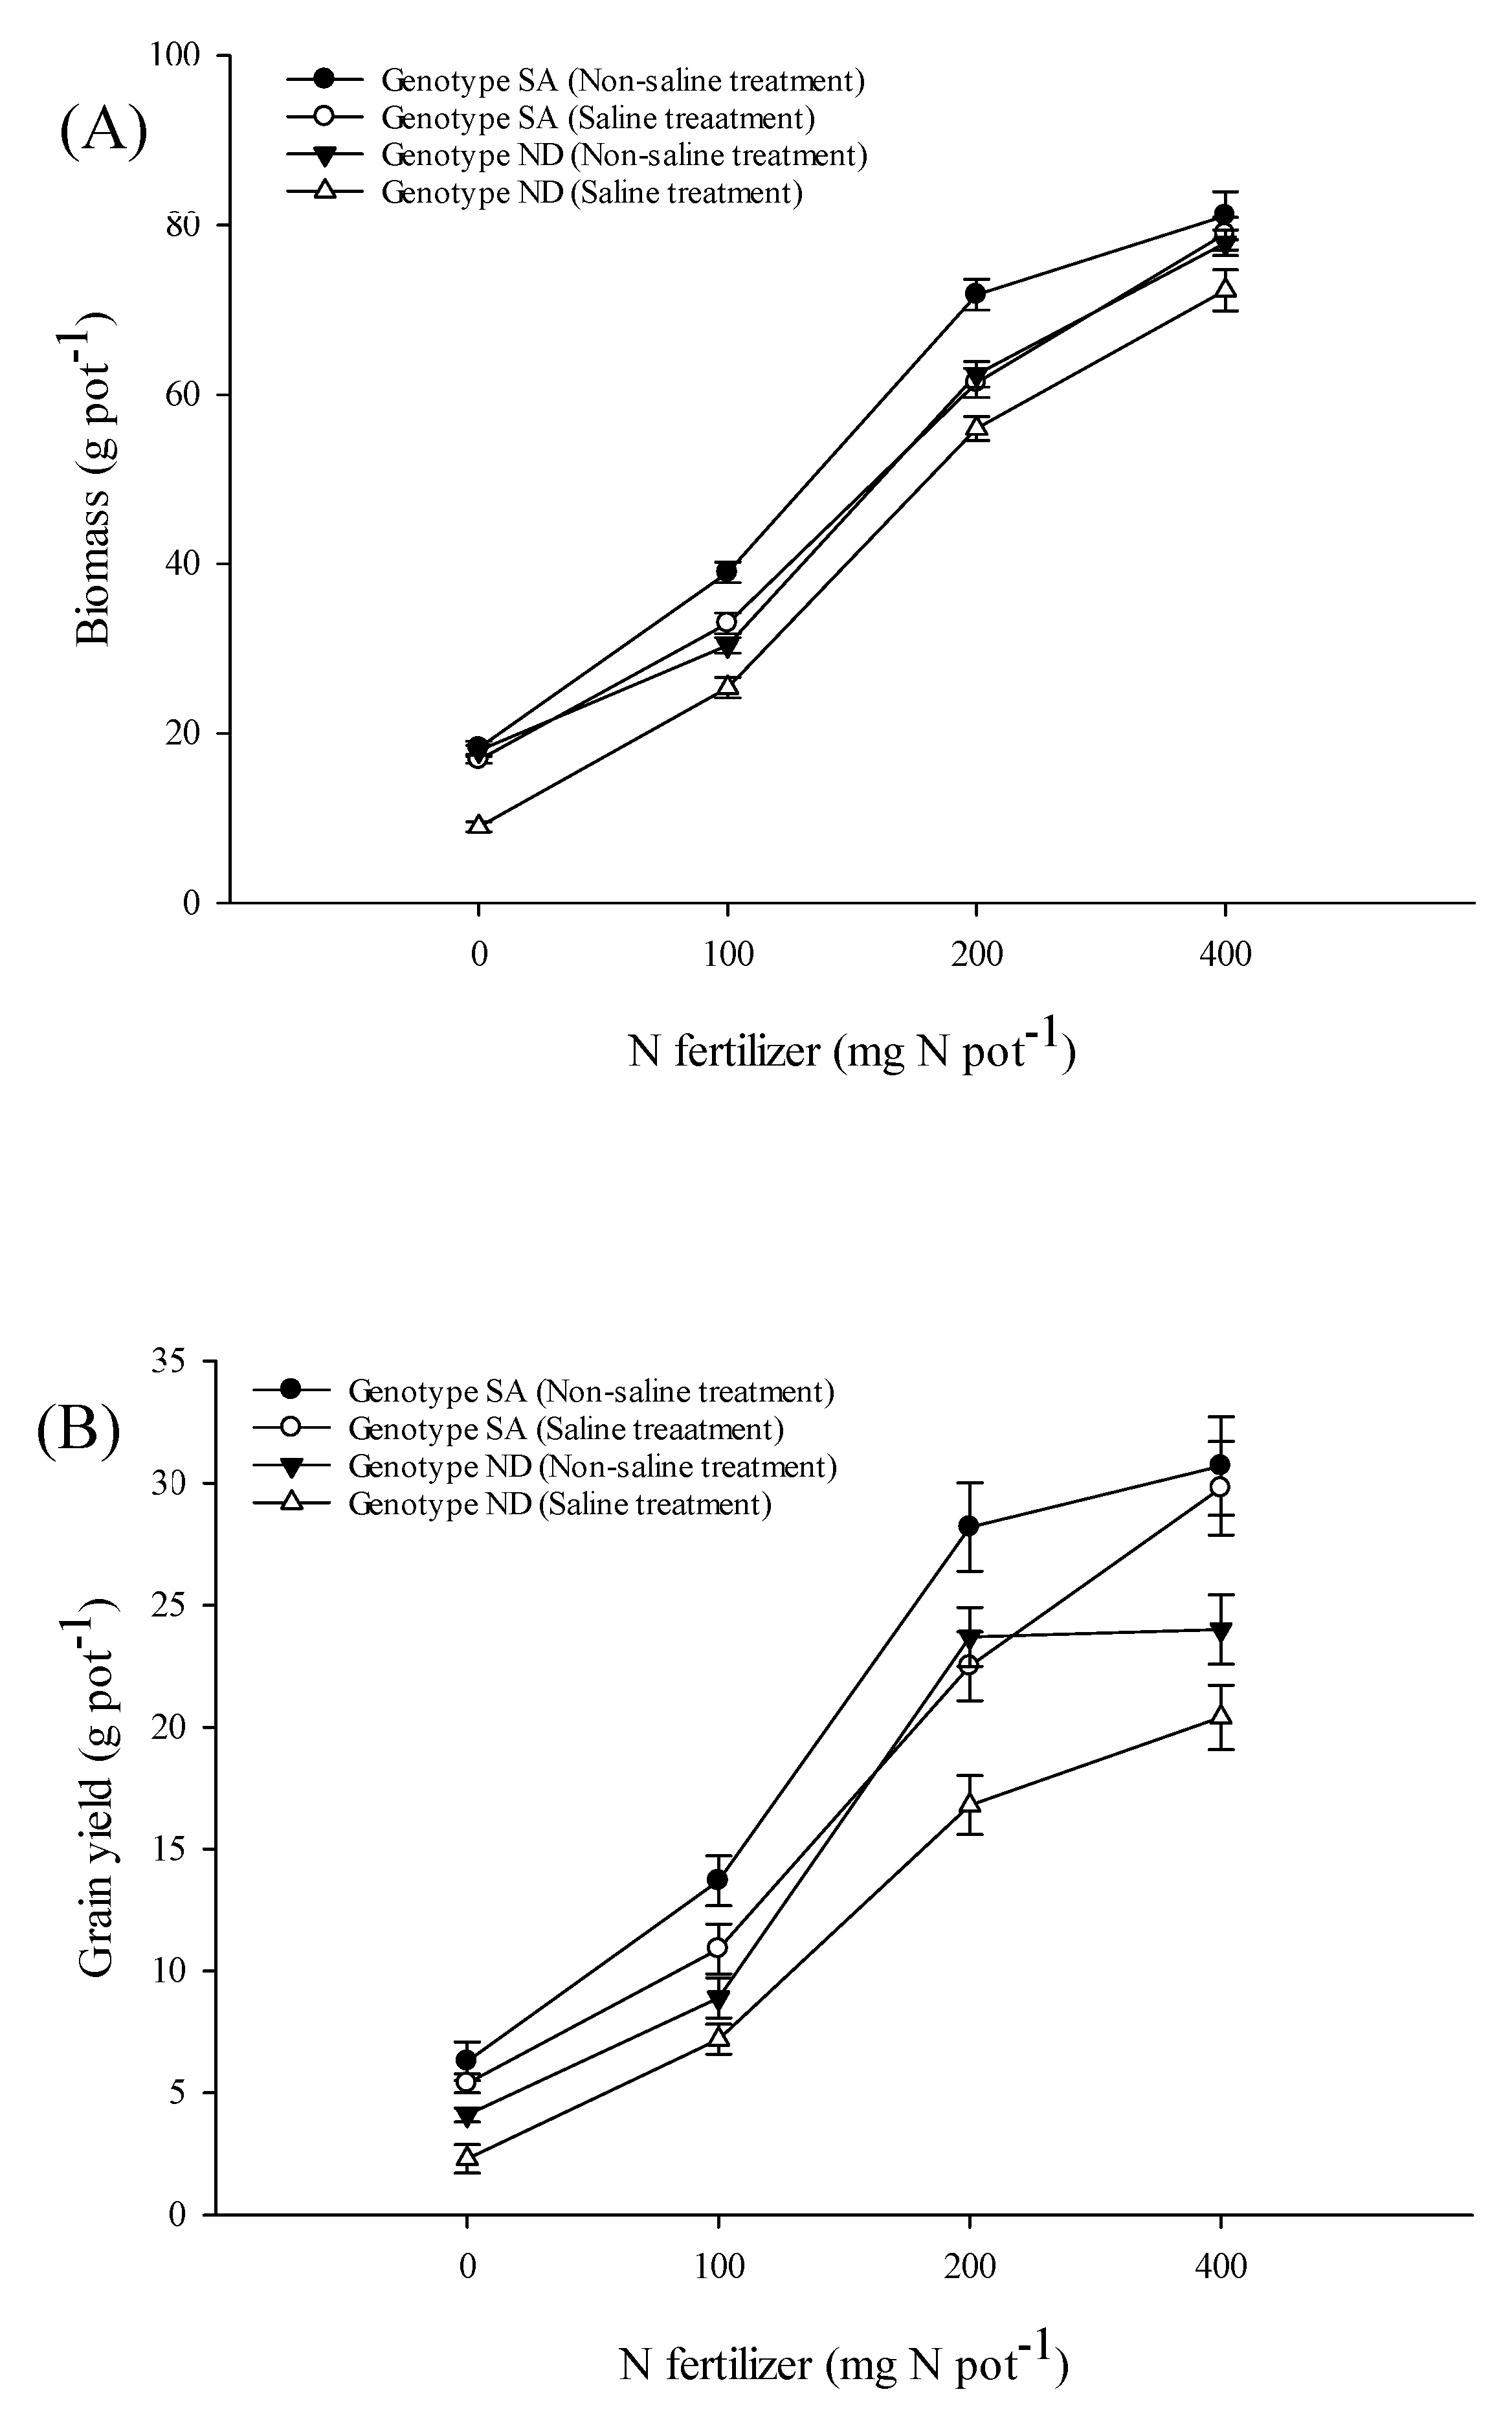
3.5. Growth and Yield Parameters
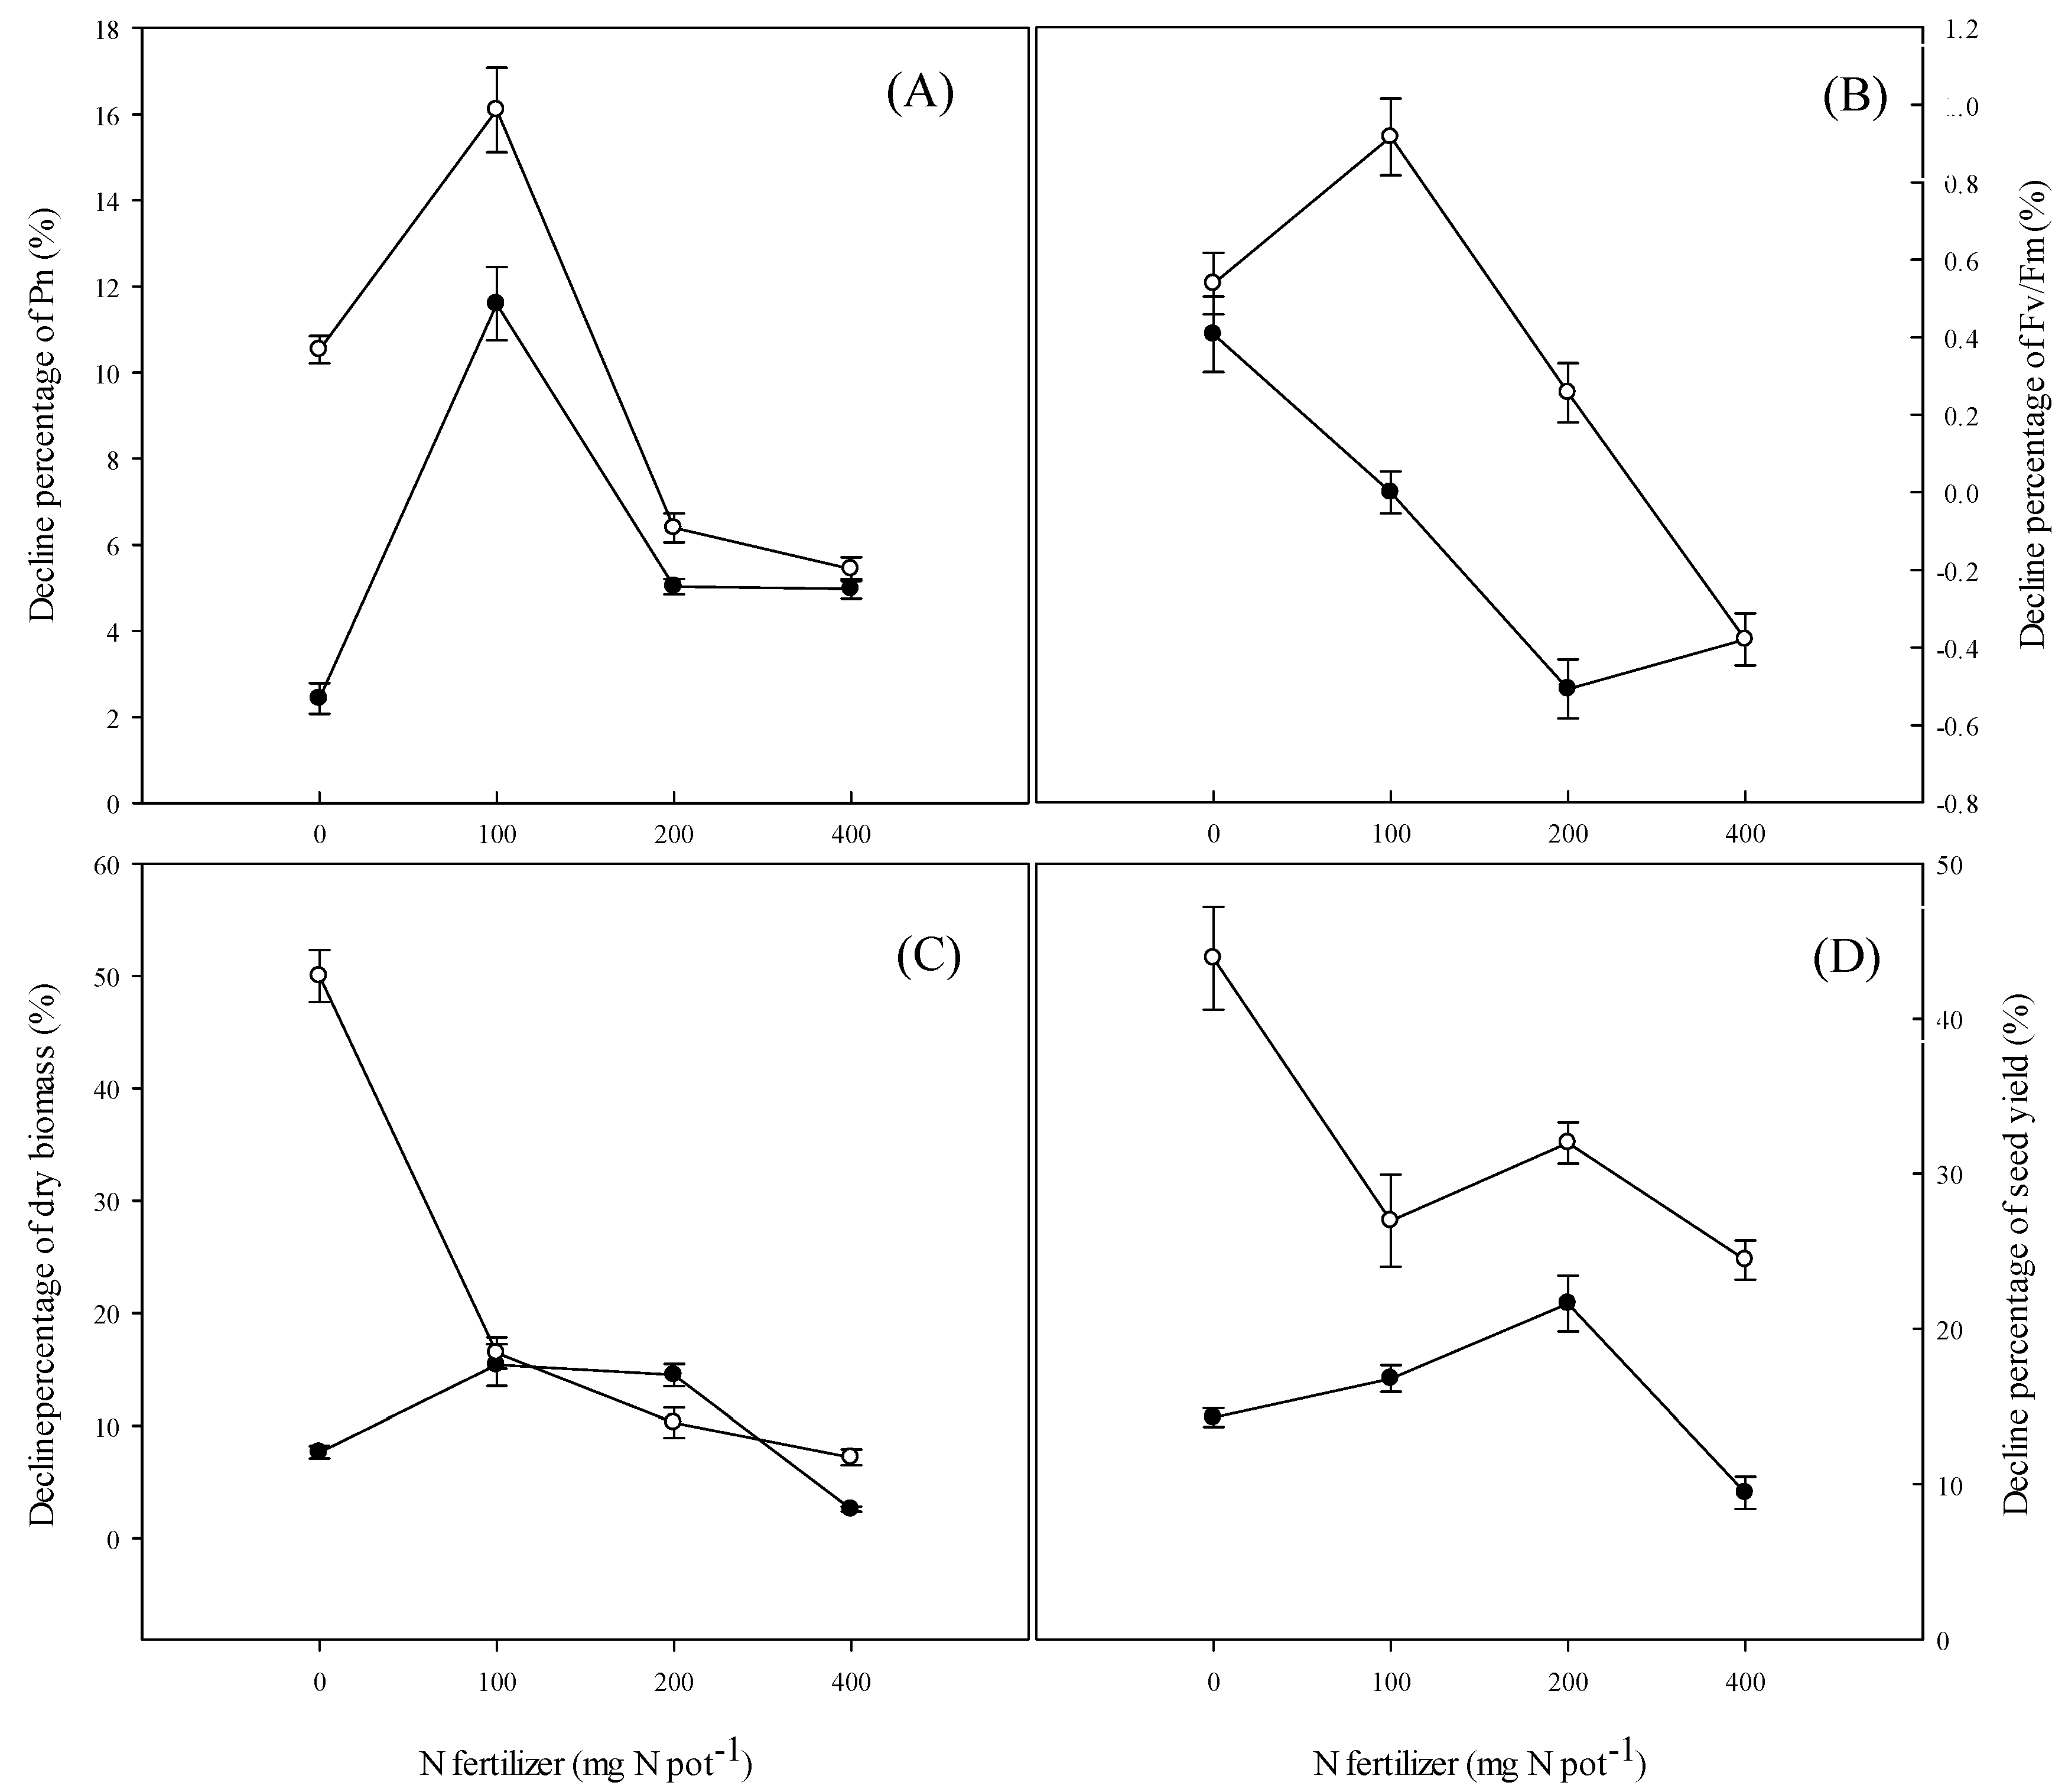
Plant height, panicle length, tiller number, seed number, dry biomass, and grain yield were considerably affected by genotype, salinity level, and nitrogen rate (Table 11). Significant interactions were found between salinity and N for plant height, panicle length, seed number, and grain yield. When two genotypes were subjected to salinity stress, plant height, dry biomass, spike length, seed number, and grain yield were significantly decreased (Table 12 and Figure 3). N fertilization increased growth and yield parameters at saline treatments, and with N rates increased, they increased significantly for both genotypes. Plant height was also affected by salinity level, N supply, and their interactions (Table 11). In the saline treatments, plant height was increased with increasing N rates, despite the fact that there was no significant difference between the N rates of 200 mg N pot−1 and 400 mg N pot−1. Compared with the non-fertilized treatments, the tiller number in saline treatments were increased by 40.3%, 67.5%, and 72.0% for SA and by 40.3%, 65.8%, and 69.9% for ND, respectively, in the 100, 200, and 400 mg N pot−1 treatments. By increasing N rates from 0 to 400 mg N pot−1, grain yield increased by 80.6% for genotype SA and by 88.7% for genotype ND. The general response patterns were also similar in tiller number and seed number. As the N rates increased from 0 to 400 mg N pot−1, the decline percentage of dry matter in the saline treatment was dropped from 9.1% to 2.3% for SA, and from 50.2% to 8.9% for ND (Figure 2C). Similarly, the decline percentage of grain yield was also diminished from 13.1% to 3.7% for SA and from 45.3% to 14.9% for ND (Figure 2D).

4. Discussion

Understanding the interaction between salinity and N fertilization is of a great agronomic and economic importance for crop production [10,20]. Most studies in salinity and nitrogen have focused either on salinity as a limiting factor for crop growth [16,18] or on the N influence on crop growth [17], while their interactive effects are still not fully understood. In our study, we found that the photosynthetic rate, nitrogen use efficiency, plant height, and grain yield were significantly affected by the interaction of salinity stress and N fertilization. Our experimental results also showed that N fertilization can alleviate the negative effects induced by salinity stress and improve plant growth and yield by maintaining the integrity of the physiological processes of oat plants. The present study has added new knowledge to the common perception that N fertilization can be seen as an important agronomic strategy for improving plant performance when subjected to saline conditions. In addition, the amelioration of the adverse effects resulting from salinity by N application was reported to be attributed to the accumulation of amino acids in the plant tissue [21]. They concluded that amino acids playing as one of the osmoprotectants were likely to counterbalance the increased osmotic potential from NaCl solution and protect membranes and metabolites by scavenging reactive oxygen species (ROS), thus protecting cells from further damage.
However, it was reported that additional N supply might exaggerate soil salinity and decrease pod yield of pepper plants [22]. The contrasting observations in pepper and oat plants might be caused by the N application method, N rate, salinity level, and crop species [23]. For example, in the previous study, nitrogen was applied only once after pepper seedling transplanting [24]. The plants at the seedling stage cannot absorb large amounts of nitrogen and more nitrogen remaining in the soil solution may lead to a secondary salinization. In our study, however, nitrogen was applied proportionately at four growth stages, which conforms with the nutritious demand of crop plants during the whole growing season [17]. Fertilizer should be applied in amounts that increase with plant need over the growing season. Similarly, it was reported that supplementary urea could overcome the effects of high salinity on fruit yield and whole plant biomass in pepper plants [22].
The reductions of physiological and growth responses to salinity in various N treatments were higher for ND than for SA, indicating a greater tolerance to salinity of genotype SA than of ND. Similar results were also reported as screening 262 oat genotypes for tolerance to salinity and alkalinity [18]. Although SA was more salt tolerant than ND, the performance of physiology, growth, and yield of both genotypes to soil salinity enhanced with the increased N rates, as the mechanism for increasing N rates to alleviate salt stress worked in the same mode of action for both genotypes. In addition, the effect of N fertilization also varied from the level of NaCl of treatment. It was reported that the growth inhibition of cotton can be significantly alleviated by fertilizer application at lower to medium soil salinity, but it didn’t have an effect in the higher NaCl treatment [10]. In our study, salinity level did not reach the fatal concentration even for the salt-sensitive oat genotype [21]; and both genotypes showed better response to N application under saline soils.
In the study, electrical conductivity, gas exchange, chlorophyll fluorescence, growth and yield parameters, and nitrogen use efficiency (NUE) were measured. Determination of gas exchange combined with chlorophyll florescence was a direct and non-destructive approach to understand the interactive effects of N and salinity on photosynthetic productivity and they also related to carbon assimilation, plant growth, and final grain yield. Nutrition availability, especially N availability, is often reported to be one of the major limiting factors for plants growth in salt-affected regions. In order to study the nitrogen availability in salinity conditions, NUE was also measured in the present study. And they were discussed as following.

4.1. Electrical Conductivity

In the present study, the readings of EC were lower at the higher N rates than the lower N rates in the potting media during the growing season of oat plants, although these decreases were not significant. We speculated that the better plant performance in higher N supply would have produced more plant tissues to compartmentalize salts from soils and thereby led to a decreased EC in soils. There were some studies that showed that halophyte species could take up and compartmentalize salt in their special tissues to adapt to salt conditions [8]. In our study, salts may also be absorbed by plants and play as an osmoprotectant to generate sufficient turgor for plant growth under salt stress, since oat was also recognized as one of medium salt-tolerant crops [16]. However, further studies are needed to test the ionic concentration of oat plants in various nitrogen treatments to assure the explanation.

4.2. Gas Exchange

In our study, the photosynthetic rate and transpiration rate were strongly impaired by salt stress, nitrogen and their interaction. Similar findings were described in wheat, which reported that as the salt concentrations increased, the photosynthetic rate, stomatal conductance, and transpiration rate were decreased [25]. The decrease in photosynthetic capacity under saline stress is mostly because of the decrease in photosynthetic pigments [26,27]. The significant combination of nitrogen and salinity treatment showed a positive impact of nitrogen on the photosynthetic rate observed in plants treated with nitrogen fertilizer. Related results were reported in maize [13]. This improvement might result from the synthesis of more photosynthetic pigments and increased cell wall rigidity under N treatments [10].

4.3. Chlorophyll Fluorescence

Chlorophyll fluorescence parameters can be used to estimate the influence of the interactive effects between saline stress and N fertilization on growth and yield performance, since these traits were closely correlated with the carbon exchange rate [28].
Some researchers have reported that saline stress affected crops by altering chlorophyll fluorescence of PSII [26], whereas others reported that actual quantum yield of PSII (ΦPSII) and maximal efficiency of PSII (Fv/Fm) were almost not affected by saline stress. In our experiment, there were no significant reductions in the parameters of chlorophyll fluorescence, such as Fv/Fm, qP, and ETR, whereas NPQ increased significantly in saline treatments. The increase of NPQ under saline stress might be associated with the limitation of CO2 assimilation of salt-stressed plants, posing an imbalance between photochemical activity at photosystem II (PSII) and electron requirement for photosynthesis. This led to an over-excitation of light energy and subsequent photo inhibition, causing the increase of NPQ under saline stress [29]. In addition, at soil salinity, the readings of Fv/Fm, ΦPSII activity and ETR in N treatments were higher than the non-fertilized treatments. The increase of chlorophyll florescence of leaves can extend photosynthetic period, maintain physiological process, and increase accumulation of biomass [29]. In term of two genotypes, ΦPSII was almost not affected by saline stress for SA, but it was decreased significantly in ND. In rice, it was also reported that the reductions of ΦPSII affected by salinity were more in salt-sensitive genotypes than salt-tolerant ones [14].

4.4. Nitrogen Use Efficiency

Nitrogen loss from crop production system is a serious concern as residual active N in the crop-soil-atmosphere systems had a negative impact on soil, water, and air quality [9]. Optimization of N input and genotype improvement with better NUE is one of the main goals of research on plant nutrition [19,30,31]. Our study showed that the values of NUE in the saline treatments were significantly lower than those in the non-saline treatments, because salt-stressed plants did not take up and utilize the N fertilizer as effectively as plants under non-saline condition. Several authors attributed this reduction to Cl- antagonism of nitrate uptake [10]. It was reported that inhibition of nitrogen uptake may occur by NO3/Cl interaction at the sites of ion transport, because chloride results in severe membrane depolarization in plants which has been linked to non-competitive inhibition of nitrate uptake [8]. Such an interaction can result in diminished N uptake and decreased plant growth at saline conditions. In addition, some studies indicated that an increase of nitrate application can decrease Cl uptake and accumulation, which can alleviate the deleterious effect of salinity on plants [21]. In addition, we observed that the values of nitrogen use efficiency were higher in SA than that of ND in saline conditions and thus the higher nitrogen use efficiency of SA may be the reason which results in a greater tolerance of salinity of SA.
On the other hand, water availability may also influence NUE [12]. The plants could not take up the water and N because of the high osmotic water potential induced by saline stress, thus saline stress reduced accumulation of inorganic N of plants from soils [32]. A new conception named water-N colimitation was also proposed, that explains the relationship between the water and N use efficiency in the agriculture field [33]. These studies agree to the theory: High yield and smaller yield gaps were associated with high colimitation between water and N. In addition, the higher water-N colimitation could also be achieved by increased N application, which improved plant performance and have smaller yield gaps in saline soils.
The values of ANR were lower at the highest N rate (400 mg N pot−1) than at 200 mg N pot−1 in either non-saline or saline treatments, but the highest grain yield was achieved at 400 mg N pot−1. The similar findings are also reported on cotton and sweet corn, where increasing N rates can improve corn grain yield [21], and significantly promoted the growth and N uptake of cotton in saline conditions [32]. Higher N rates could better alleviate the adverse effects of salts and achieve reasonable grain yield, although the increase in N rates decreased NUE both in non-saline and saline treatments.

4.5. Yield and Yield Components

In our study, yield and yield components were significantly affected by the salinity level and N rate. Saline stress caused reductions in plant biomass and grain yield at harvest time. These reductions are closely related with the reductions in photosynthesis productivity and chlorophyll fluorescence, which was associated with a lower rate of carbohydrate and translocation of assimilates in plants [8]. In addition, our results agree with the study which reported that the overall decreased growth and yield under salt stress is a result of reduction in photosynthetic capacity of plants.
In addition, it was also reported that crop dry matter and yield both decreased as salinity increased but they performed well as the N fertilization was enhanced [32]. Our study also showed that the adverse effects of salinity on grain yield and yield components can be alleviated by increased photosynthetic capacity and nitrogen accumulation through N application. N fertilization minimized the deleterious effect of salt stress on fruit yield and whole plant biomass have been observed in pepper [22] and cotton [10]. They reported that N fertilization was beneficial to biological yield formation of the plants regardless of salinity.
Plant responses to salinity change with growth stage, saline treatment, and nitrogen application method [10]. For cotton, the growth inhibition was alleviated by fertilizer application and N uptake increased with N fertilization at low to moderate soil salinity [10,34]. At higher salinity levels, N uptake was independent of N rates and was mainly influenced by soil salinity. In our study, the plants were treated only by 100 mM NaCl, and the salinity treatment was not a fatal concentration for oat plants, and thus the responses of oat plants to higher salinities may need further study. In addition, although it showed that increased N fertilization was effective in mitigating the detrimental effects of salinity on plant performance in the present study, it was known that excess nitrogen may also reduce grain yield by promoting excessive vegetative growth, causing crop lodging, and delaying maturity either in non-saline and saline soils. The threshold of nitrogen application may also need to be observed in future studies. And further studies are needed to test the ionic concentration to assure whether salts may also be absorbed by plants and play as an osmoprotectant to generate sufficient turgor for plant growth under salt stress.

5. Conclusions

Photosynthetic productivity, grain yield, and nitrogen use efficiency of oat plants were considerably affected by salinity, N fertilizer rate, and their interaction. Increased N fertilization was effective in mitigating the detrimental effects of salinity on plant performance based on the physiological and yield responses of the two oat genotypes exposed to saline stress. The improved growth and grain yield resulting from N application under saline stress were mainly attributed to the higher photosynthetic efficiency and chlorophyll florescence. Although genotype SA was more salt tolerant than ND, the performance of physiology, growth, and yield of both genotypes to soil salinity was enhanced with increased N rates. In the present study, we provided evidence that increased nitrogen application can be regarded as a key agronomic practice for improving oat production in soil salinity, which is essential for agronomists and producers to make proper decisions in fertilization management in salt-affected soils.

Author Contributions

G.Z. (Guisheng Zhou), B.-L.M., and W.Y. designed the study. X.S. and W.W. conducted the experiments. X.S. and I.A. wrote the manuscript. G.Z. (Guanglong Zhu) and X.J. provided direction and supervised the work. All authors contributed to editing the manuscript.

Funding

This research was funded, in part, by the China National Key Research and Development Program (2017YFD0301205), the Agriculture and Agri–Food Canada (AAFC) Growing Forward II Canadian Field Crop Cluster project J–000305 and the Canadian Agricultural Partnership project J-002094 through the Collaborative Research and Development Agreement between AAFC and the Canadian Field Crop Research Alliance (CFCRA), Jiangsu Provincial Agricultural Innovation Fund (CX16(1005)), and the Priority Academic Program Development of Jiangsu Higher Education Institution. The APC was funded by Jiangsu Provincial Key R & D Program (BE2016345) and AAFC-ORDC contribution No. 18-090.

Conflicts of Interest

The authors declare no competing interests.

Statement

For authors B.L. Ma and W. Yan, © Her Majesty the Queen in Right of Canada as represented by the Minister of Agriculture and Agri-Food Canada.

References

  1. Wang, W.X.; Vinocur, B.; Altman, A. Plant responses to drought, salinity and extreme temperatures: Towards genetic engineering for stress tolerance. Planta 2003, 218, 1–14. [Google Scholar] [CrossRef] [PubMed]
  2. Wu, W.; Ma, B.L. Assessment of canola crop lodging under elevated temperatures for adaptation to climate change. Agric. For. Meteorol. 2018, 248, 329–338. [Google Scholar] [CrossRef]
  3. Pooja, S.; Kumar, R. Soil salinity: A serious environmental issue and plant growth promoting bacteria as one of the tools for its alleviation. Saudi J. Biol. Sci. 2015, 22, 123–131. [Google Scholar]
  4. Rozema, J.; Flowers, T. Crops for a salinized world. Science 2008, 322, 1478–1480. [Google Scholar] [CrossRef] [PubMed]
  5. Nimir, E.A.; Lu, S.Y.; Zhou, G.S.; Ma, B.L.; Wang, Y.H. Comparative effects of gibberellic acid, kinetin and salicylic acid on emergence, seedling growth and the antioxidant defense system of sweet sorghum (sorghum bicolor) under salinity and temperature stresses. Crop Pasture Sci. 2015, 66, 145–157. [Google Scholar] [CrossRef]
  6. Zhao, B.P.; Ma, B.L.; Hu, Y.G.; Liu, J.H. Leaf Photosynthesis, Biomass Production and Water and Nitrogen Use Efficiencies of Two Contrasting Naked Vs. Hulled Oat Genotypes Subjected to Water and Nitrogen Stresses. Plant Nutr. 2011, 34, 2139–2157. [Google Scholar] [CrossRef]
  7. Munns, R.; Tester, M. Mechanisms of salinity tolerance. Annu. Rev. Plant Biol. 2008, 59, 651–681. [Google Scholar] [CrossRef] [PubMed]
  8. Farooq, M.; Hussain, M.; Wakeel, A.; Kadambot, H.; Siddique, M. Salt stress in maize: effects, resistance mechanisms, and management. A review. Agron. Sustain. Dev. 2015, 35, 461–481. [Google Scholar] [CrossRef]
  9. Ma, B.L.; Wu, T.Y.; Tremblay, N.; Deen, W.; McLaughlin, N.B.; Morrison, M.J.; Stewart, G. Rate and timing effects of fertilizer nitrogen application to corn on ammonia volatilization in cool and humid regions. Agron. J. 2010, 102, 134–144. [Google Scholar] [CrossRef]
  10. Chen, W.; Hou, Z.; Wu, L.; Liang, Y.; Wei, C. Effects of salinity and nitrogen on cotton growth in arid environment. Plant Soil 2010, 326, 61–73. [Google Scholar] [CrossRef]
  11. El-Sidding, K.; Ludders, P. Interactive effects of nitrogen nutrition and salinity on reproductive growth of apple trees. Gartenbauwiss 1994, 59, 127–131. [Google Scholar]
  12. Duan, M.; Chang, S.X. Nitrogen fertilization improves the growth of lodgepole pine and white spruce seedling under low salt stress through enhancing photosynthesis and plant nutrition. For. Ecol. Manag. 2017, 404, 197–204. [Google Scholar] [CrossRef]
  13. Akram, M.; Ashraf, M.Y.; Jamil, M.; Iqbal, R.M.; Nafees, M.; Khan, M.A. Nitrogen application improves gas exchange characteristics and chlorophyll fluorescence in maize hybrids under salinity conditions. Russ. J. Plant Physiol. 2011, 58, 394–401. [Google Scholar] [CrossRef]
  14. Dionisio-Sese, M.L.; Tobita, S. Effects of salinity on sodium content and photosynthetic responses of rice seedlings differing in salt tolerance. Plant Physiol. 2000, 157, 54–58. [Google Scholar] [CrossRef]
  15. Elgharably, A.; Marschner, P.; Rengasamy, P. Wheat growth in a saline sandy loam soil as affected by N form and application rate. Plant Soil 2010, 328, 303–312. [Google Scholar] [CrossRef]
  16. Zhao, G.Q.; Ma, B.L.; Ren, C.Z. Growth, gas exchange, chlorophyll fluorescence, and ion content of naked oat in response to salinity. Crop Sci. 2007, 47, 123–131. [Google Scholar] [CrossRef]
  17. Zhao, G.Q.; Ma, B.L.; Ren, C.Z. Response of nitrogen uptake and partitioning to critical nitrogen supply in oat cultivars. Crop Sci. 2009, 49, 1040–1048. [Google Scholar] [CrossRef]
  18. Bai, J.; Yan, W.K.; Wang, Y.Q.; Yin, Q.; Liu, J.H.; Wight, C.; Ma, B.L. Screening Oat Genotypes for Tolerance to Salinity and Alkalinity. Front. Plant Sci. 2018, 9, 1–17. [Google Scholar] [CrossRef] [PubMed]
  19. Zhao, B.P.; Liu, J.H.; Wu, J.Y.; Liu, H.J.; Xu, H.L. Effects of salt stress on plasmalemma permeability, osmolyte accumulation and protective enzyme activities in oat plant. J. Food Agric. Environ. 2013, 11, 696–701. [Google Scholar]
  20. Shenker, M.; Ben-Gal, A.; Shani, U. Sweet corn response to combined nitrogen and salinity environmental stress. Plant Soil 2003, 256, 139–147. [Google Scholar] [CrossRef]
  21. Flores, P.; Carvajal, M.; Cerda, A.; Martinez, V. Salinity and ammonium/nitrate interactions on tomato plant development, nutrition, and metabolites. J. Plant Nutr. 2012, 4, 1561–1573. [Google Scholar] [CrossRef]
  22. Kaya, C.; Higgs, D. Relationship between water use and urea application in salt-stressed pepper plants. J. Plant Nutr. 2003, 26, 19–30. [Google Scholar] [CrossRef]
  23. Albassam, B.A. Effect of nitrate nutrition on growth and nitrogen assimilation of pearl millet exposed to sodium chloride stress. J. Plant Nutr. 2001, 24, 1325–1335. [Google Scholar] [CrossRef]
  24. Villa-Castorena, M.; Ulery, A.L.; Catalan-Valencia, E.A.; Remmenga, M.D. Salinity and nitrogen rate effects on the growth and yield of chile pepper plants. Soil Sci. Soc. Am. J. 2003, 67, 1781–1789. [Google Scholar] [CrossRef]
  25. Ibrahim, M.E.; Zhu, X.K.; Zhou, G.S.; Adam, Y.A.; Ahmad, I.; Farah, G.A. Nitrogen fertilizer alleviated negative impacts of NaCl on some physiological parameters of wheat. Pak. J. Bot. 2018, 50, 2097–2104. [Google Scholar]
  26. Netondo, G.W.; Onyango, J.C.; Beck, E. Sorghum and salinity: gas exchange and chlorophyll fluorescence of sorghum under salt stress. Crop Sci. 2004, 44, 806–811. [Google Scholar] [CrossRef]
  27. Delfine, S.; Alvino, A.; Villani, M.C.; Loreto, F. Restrictions to carbon dioxide conductance and photosynthesis in spinach recovering from salt stress. Plant Physiol. 1999, 119, 1101–1106. [Google Scholar] [CrossRef] [PubMed]
  28. Fracheboud, Y.; Haldimann, P.; Stamp, P. Chlorophyll fluorescence as a selection tool for cold tolerance of photosynthesis in maize (Zea mays L.). J. Exp. Bot. 2010, 50, 1533–1540. [Google Scholar] [CrossRef]
  29. Pooja, M.; Jajoo, A.; Sudhakar, S.M. Chlorophyll fluorescence study revealing effects of high salt stress on Photosystem II in wheat leaves. Plant Phy. Biochem. 2010, 48, 16–20. [Google Scholar]
  30. Ma, B.L.; Herath, A.W. Nitrogen fertilizer application timing and rates on canola seed quality and nitrogen use efficiency. Crop Pasture Sci. 2016, 67, 167–180. [Google Scholar] [CrossRef]
  31. Wu, W.; Ma, B.L.; Whalen, J.K. Enhancing rape seed tolerance to heat and drought stresses in a changing climate: perspectives for stress adaptation from root system architecture. Adv. Agron. 2018, 151, 87–159. [Google Scholar]
  32. Hou, S.; Hou, Z.A.; Ye, J. Cotton growth and nitrogen uptake in response to rates of water and nitrogen under drip irrigation with saline water. Xinjiang Agric. Sci. 2010, 47, 1882–1887. [Google Scholar]
  33. Cesar, M.C.; Sadras, V.O. Water–Nitrogen Colimitation in Grain Crop. Adv. Agron. 2018, 5, 231–247. [Google Scholar]
  34. Zhang, D.M.; Li, W.J.; Xin, C.S.; Tang, W.; Enejia, A.E.; Dong, H.Z. Lint yield and nitrogen use efficiency of field-grown cotton vary with soil salinity and nitrogen application rate. Field Crop Res. 2012, 138, 63–70. [Google Scholar] [CrossRef]
Figure 1. Changes in electrical conductivity (EC) of potting media at a 15 cm depth during the whole growth stage. (A) represents the first run. (B) represents the second run.
Agronomy 09 00115 g001
Figure 2. Alleviation of nitrogen fertilization on the decline percentage (compared to the non-saline control treatment) of photosynthetic rate (A), PSII maximum quantum efficiency (B), dry biomass (C) and seed yield (D), by saline soil treatment. The black circle represents genotype SA and the white circle represents genotype ND.
Agronomy 09 00115 g002
Figure 3. Effects of salinity and nitrogen rates on seed yield (A) and dry biomass (B) under non-saline and saline treatments.
Agronomy 09 00115 g003
Table 1. Summary of analysis of variance for the photosynthetic rate (Pn), stomatal conductance (gs), and transpiration rate (E) at the flowering stage in the first run of a controlled greenhouse study.
Source of VariationPn (µmol m−2 s−1)gs (mmol m−2 s−1)E (mmol m−2 s−1)
Genotype (G)******
Salinity (S)******
Nitrogen (N)******
(G × S)ns***
(G × N)nsns**
(S × N)***ns
(G × S × N)ns*ns
* significant at ≤0.05; ** significant at ≤0.01.
Table 2. Summary of analysis of variance for the photosynthetic rate (Pn), stomatal conductance (gs), and transpiration rate (E) at the flowering stage in the second run of a controlled greenhouse study.
Source of VariationPn (µmol m−2 s−1)gs (mmol m−2 s−1)E (mmol m−2 s−1)
Genotype (G)**ns*
Salinity (S)******
Nitrogen (N)******
(G × S)nsnsns
(G × N)******
(S × N)**ns*
(G × S × N)nsnsns
* significant at ≤0.05; ** significant at ≤0.01.
Table 3. Effects of salinity and nitrogen rate on the photosynthetic rate (Pn), stomatal conductance (gs), and transpiration rate (E) of the two oat genotypes (SA vs. ND) at the flowering stage in the first run of a controlled greenhouse study.
NaCl
(mM)
N RatesPn (µmol m−2 s−1)gs (mmol m−2 s−1)E (mmol m−2 s−1)
(mg pot−1)SANDSANDSAND
0010.9 ± 0.6 c8.9 ± 0.4 d0.09 ± 0.005 b0.07 ± 0.005 d2.1 ± 0.3 d1.7 ± 0.1 d
10017.3 ± 1.2 b15.7 ± 0.6 c0.11 ± 0.007 b0.08 ± 0.007 c3.1 ± 0.1 c2.3 ± 0.2 c
20020.5 ± 0.5 a18.4 ± 0.5 b0.13 ± 0.006 a0.10 ± 0.006 b3.4 ± 0.7 b3.0 ± 0.3 b
40021.5 ± 1.0 a20.3 ± 0.7 a0.14 ± 0.005 a0.12 ± 0.001 a3.6 ± 0.2 a3.3 ± 0.2 a
Mean17.6 A15.8 A0.12 A0.10 A3.1 A2.9 A
100010.3 ± 0.4 d8.3 ± 0.4 d0.06 ± 0.005 c0.07 ± 0.010 c1.9 ± 0.1 c1.6 ± 0.2 c
10014.2 ± 0.6 c12.5 ± 0.1 c0.10 ± 0.002 b0.08 ± 0.005 b3.0 ± 0.2 b2.4 ± 0.2 b
20017.9 ± 0.7 b14.8 ± 0.6 b0.12 ± 0.002 a0.09 ± 0.004 ab3.3 ± 0.1 a2.9 ± 0.1 a
40020.4 ± 0.5 a17.5 ± 0.3 a0.12 ± 0.003 a0.10 ± 0.006 a3.5 ± 0.1 a3.0 ± 0.2 a
Mean15.7 B13.3 B0.09 B0.09 B2.6 B2.5 B
Mean values ± SD are shown. Within a column means followed by the same letter are not significantly different at the 0.05 probability level. Lower-case and upper-case letters indicate the comparison among nitrogen and between two saline soil treatments, respectively.
Table 4. Effects of salinity and nitrogen rate on the photosynthetic rate (Pn), stomatal conductance (gs), and transpiration rate (E) of the two oat genotypes (SA vs. ND) at the flowering stage in the second run of a controlled greenhouse study.
NaCl
(mM)
N RatesPn (µmol m−2 s−1)gs (mmol m−2 s−1)E (mmol m−2 s−1)
(mg pot−1)SANDSANDSAND
0014.0 ± 0.7 d13.8 ± 0.1 d0.08 ± 0.02 b0.07 ± 0.01 c2.5 ± 0.2 c2.2 ± 0.1 c
10023.3 ± 1.3 c20.2 ± 0.2 c0.10 ± 0.01 ab0.11 ± 0.01 b3.4 ± 0.3 b3.2 ± 0.4 b
20027.1 ± 0.4 b24.8 ± 0.5 b0.10 ± 0.01 ab0.12 ± 0.01 a3.5 ± 0.1 b3.6 ± 0.3 a
40028.8 ± 0.6 a27.1 ± 0.1 a0.12 ± 0.01 a0.13 ± 0.02a3.8 ± 0.1a3.7 ± 0.2 a
Mean23.3 A21.4 A0.10 A0.11 A3.3 A3.2 A
100013.5 ± 0.7 d12.0 ± 0.5 d0.08 ± 0.01 b0.06 ± 0.01 d2.5 ± 0.2 b2.2 ± 0.1 c
10020.2 ± 0.2 c17.0 ± 0.4 c0.09 ± 0.01 b0.08 ± 0.01 c2.8 ± 0.1 b2.8 ± 0.3 b
20024.8 ± 0.8 b23.2 ± 0.6 b0.11 ± 0.02 a0.10 ± 0.02 b3.4 ± 0.2 a3.5 ± 0.1 a
40027.1 ± 0.7 a25.6 ± 0.4 a0.11 ± 0.01a0.12 ± 0.01 a3.5 ± 0.1 a3.4 ± 0.2 a
Mean21.8 B19.4 B0.10 A 0.09 B3.0 B3.0 B
Mean values ± SD are shown. Within a column means followed by the same letter are not significantly different at the 0.05 probability level. Lower-case and upper-case letters indicate the comparison among nitrogen and between two saline soil treatments, respectively.
Table 5. Summary of analysis of variance for maximum quantum efficiency of PSII (Fv/Fm), actual photochemical quantum efficiency of PSII (ΦPSII), photochemical quenching (qP), non-photochemical quenching (NPQ) and electron transfer rate (ETR) at the flowering stage in the first run of a controlled greenhouse study.
Source of VariationFv/FmΦPSIIqPNPQETR
Genotype (G)******ns
Salinity (S)****ns****
Nitrogen (N)**********
(G × S)nsnsns***
(G × N)nsnsnsnsns
(S × N)nsnsnsnsns
(G × S × N)nsnsnsnsns
* significant at ≤0.05; ** significant at ≤0.01.
Table 6. Summary of analysis of variance for maximum quantum efficiency of PSII (Fv/Fm), actual photochemical quantum efficiency of PSII (ΦPSII), photochemical quenching (qP), non-photochemical quenching (NPQ) and electron transfer rate (ETR) at the flowering stage in the second run of a controlled greenhouse study.
Source of VariationFv/FmΦPSIIqPNPQETR
Genotype (G)*ns***ns
Salinity (S)ns**ns**ns
Nitrogen (N)**********
(G × S)ns**nsnsns
(G × N)**nsns***
(S × N)ns*ns****
(G × S × N)nsnsns****
* significant at ≤0.05; ** significant at ≤0.01.
Table 7. Effects of salinity and nitrogen rate on maximal quantum yield of PSII (Fv/Fm), actual photochemical quantum efficiency of PSII (ΦPSII), photochemical quenching (qP), non-photochemical quenching (NPQ) and electron transfer rate (ETR) of the two oat genotypes (SA vs. ND) at the flowering stage in the first run of a controlled greenhouse study
NaCl
(mM)
N RateFv/FmΦPSIIqPNPQETR
(mg pot−1)SANDSANDSANDSANDSAND
000.72 ± 0.01 d0.71 ± 0.01 c0.31 ± 0.01 c0.30 ± 0.02 c0.61 ± 0.02 c0.61 ± 0.01 c1.30 ± 0.01 a1.43 ± 0.10 a25.6 ± 0.6 d24.8 ± 1.3 c
1000.74 ± 0.02 c0.73 ± 0.02 b0.33 ± 0.01 b0.36 ± 0.01 b0.65 ± 0.02 b0.63 ± 0.01 bc1.10 ± 0.10 b1.26 ± 0.10 b27.2 ± 0.6 c27.9 ± 1.3 b
2000.76 ± 0.01 b0.75 ± 0.02 a0.43 ± 0.01 a0.42 ± 0.01 a0.70 ± 0.01 a0.67 ± 0.01 ab0.85 ± 0.01 c0.87 ± 0.10 c31.3 ± 0.6 b32.9 ± 0.8 a
4000.77 ± 0.01 a0.76 ± 0.01 a0.44 ± 0.01 a0.43 ± 0.01 a0.67 ± 0.01 b0.68 ± 0.02 a0.76 ± 0.01 c0.75 ± 0.03 c32.7 ± 0.8 a33.4 ± 1.9 a
Mean0.75 A0.74 A0.38 A0.37 A0.65 A0.65 A1.00 B1.08 B29.2 A29.7 A
10000.72 ± 0.02 c0.71 ± 0.01 c0.30 ± 0.02 b0.30 ± 0.02 c0.60 ± 0.01 c0.59 ± 0.02 c1.46 ± 0.05 a1.66 ± 0.09 a23.8 ± 1.0 d22.7 ± 0.7 d
1000.74 ± 0.01 b0.72 ± 0.01 b0.32 ± 0.01 b0.34 ± 0.01 b0.64 ± 0.01 b0.62 ± 0.01 b1.24 ± 0.05 b1.37 ± 0.03 b26.3 ± 0.1 c24.8 ± 0.8 c
2000.74 ± 0.01 b0.74 ± 0.02 a0.42 ± 0.01 a0.42 ± 0.01 a0.69 ± 0.02 a0.68 ± 0.01 a0.89 ± 0.02 c1.01 ± 0.07 c30.3 ± 0.6 b30.1 ± 1.4 b
4000.76 ± 0.02 a0.75 ± 0.02 a0.43 ± 0.01 a0.43 ± 0.02 a0.69 ± 0.02 a0.68 ± 0.02 a0.76 ± 0.03 d0.98 ± 0.06 c32.2 ± 0.4 a32.0 ± 0.7 a
Mean0.74 B0.73 B0.36 B0.36 B0.65 A0.64 A1.09 A1.26 A28.1 B27.4 B
Mean values ± SD are shown. Within a column means followed by the same letter are not significantly different at the 0.05 probability level. Lower-case and upper-case letters indicate comparison among nitrogen and between two saline soil treatments, respectively.
Table 8. Effects of salinity and nitrogen rate on maximum quantum efficiency of PSII (Fv/Fm), actual photochemical quantum efficiency of PSII (ΦPSII), photochemical quenching (qP), non-photochemical quenching (NPQ) and electron transfer rate (ETR) of the two oat genotypes (SA vs. ND) at the flowering stage in the second run of a controlled greenhouse study.
NaCl
(mM)
N RateFv/FmΦPSIIqPNPQETR
(mg pot−1)SANDSANDSANDSANDSAND
000.74 ± 0.01 c0.74 ± 0.01 d0.31 ± 0.02 c0.32 ± 0.03 c0.63 ± 0.05 b0.64 ± 0.02 b1.15 ± 0.04 a1.35 ± 0.02 a25.8 ± 0.7 d26.5 ± 0.9 c
1000.77 ± 0.02 b0.76 ± 0.04 c0.35 ± 0.02 b0.38 ± 0.02 b0.65 ± 0.06 b0.67 ± 0.02 b0.98 ± 0.05 b1.22 ± 0.04 b30.2 ± 0.7 c30.9 ± 2.0 b
2000.79 ± 0.01 a0.78 ± 0.03 b0.45 ± 0.02 a0.45 ± 0.02 a0.68 ± 0.03 a0.74 ± 0.02 a0.63 ± 0.06 c0.81 ± 0.05 c33.9 ± 1.4 b38.1 ± 1.0 a
4000.79 ± 0.03 a0.79 ± 0.02 a0.47 ± 0.01 a0.46 ± 0.01 a0.70 ± 0.05 a0.64 ± 0.02 b0.51 ± 0.04 d0.81 ± 0.03 c36.7 ± 1.3 a31.1 ± 2.1 b
Mean0.77 A0.77 A0.39 A0.41 A0.66 A0.67 A0.82 B1.05 B31.7 A31.7 A
10000.73 ± 0.01 c0.74 ± 0.04 d0.31 ± 0.01 c0.27 ± 0.03 c0.62 ± 0.03 b0.60 ± 0.04 c1.33 ± 0.04 a1.68 ± 0.05 a24.4 ± 1.3 d22.5 ± 1.7 b
1000.77 ± 0.02 b0.76 ± 0.03 c0.36 ± 0.03 b0.36 ± 0.05 b0.64 ± 0.03 b0.67 ± 0.01 bc1.13 ± 0.09 c1.41 ± 0.01 b29.1 ± 0.7 c27.2 ± 0.8 b
2000.79 ± 0.01 a0.78 ± 0.09 b0.40 ± 0.05 b0.39 ± 0.07 b0.70 ± 0.05 a0.69 ± 0.03 ab0.85 ± 0.03 d0.85 ± 0.05 c34.2 ± 0.8 b34.5 ± 3.3 a
4000.79 ± 0.01 a0.79 ± 0.07 a0.45 ± 0.07 a0.44 ± 0.04 a0.65 ± 0.01 ab0.76 ± 0.05 a0.52 ± 0.05 e0.83 ± 0.04 c36.1 ± 1.0 a38.0 ± 0.9 a
Mean0.77 A0.77 A0.38 A0.36 B0.65 A0.68 A0.96 A1.19 A31.0 A30.6 A
Mean values ± SD are shown. Within a column means followed by the same letter are not significantly different at the 0.05 probability level. Lower-case and upper-case letters indicate comparison among nitrogen and between two saline soil treatments, respectively.
Table 9. Summary of analysis of variance for agronomic nitrogen use efficiency (aNUE), physiological nitrogen efficiency (pNUE), and apparent nitrogen recovery (ANR) in a controlled greenhouse study.
Source of VariationaNUE (%)pNUE (%)ANR (%)
Genotype (G)**ns**
Salinity (S)******
Nitrogen (N)******
(G × S)nsnsns
(G × N)ns****
(S × N)*****
(G × S × N)nsnsns
* significant at ≤0.05; ** significant at ≤0.05.
Table 10. Effects of salinity and nitrogen rate on agronomic nitrogen use efficiency (aNUE), physiological nitrogen efficiency (pNUE) and apparent nitrogen recovery (ANR) of the two oat genotypes (SA vs. ND) in a controlled greenhouse study.
NaCl
(mM)
N RateaNUE (%)pNUE (%)ANR (%)
(mg pot−1)SANDSANDSAND
010036.0 ± 1.7 b24.4 ± 2.0 b66.1 ± 1.4 a90.4 ± 4.3 a55.5 ± 3.3 b39.4 ± 1.7 b
20043.8 ± 1.9 a39.2 ± 2.2 a59.7 ± 2.6 a60.1 ± 3.9 b72.8 ± 1.3 a60.4 ± 2.7 a
40024.4 ± 0.4 c19.9 ± 1.5 b58.4 ± 2.1 a46.9 ± 2.1 c41.8 ± 2.7 c41.1 ± 2.0 b
Mean34.7 A27.8 A61.4 A65.8 A56.7 A47.0 A
10010027.8 ± 2.0 ab23.9 ± 2.3 b60.3 ± 1.9 a61.9 ± 3.3 a47.4 ± 3.3 b26.4 ± 1.9 c
20034.1 ± 1.6 a28.9 ± 2.2 a59.2 ± 3.2 a54.1 ± 2.8 ab57.5 ± 2.1 a53.6 ± 2.9 a
40024.3 ± 1.0 b17.9 ± 1.5 c54.6 ± 4.4 a46.7 ± 2.0 b44.9 ± 2.1 b37.4 ± 2.5 b
Mean28.7 B23.6 B58.0 A54.3 B49.9 B39.1 B
Mean values ± SD are shown. Within a column means followed by the same letter are not significantly different at the 0.05 probability level. Lower-case and upper-case letters indicate the comparison among nitrogen and between two saline soil treatments, respectively.
Table 11. Summary of analysis of variance for plant height (cm), yield components, above ground dry biomass (g), and grain yield (g) in the second run of a controlled greenhouse study.
Source of VariationPlant HeightPanicle NumberTiller NumberSeed NumberDry BiomassGrain Yield
Genotype (G)************
Salinity (S)************
Nitrogen (N)************
(G × S)**nsnsnsnsns
(G × N)**nsns**ns**
(S × N)****ns**ns**
(G × S × N)****nsnsnsns
* significant at ≤0.05; ** significant at ≤0.05.
Table 12. Effects of salinity and nitrogen rate on plant height (cm) and yield components of the two oat genotypes (SA vs. ND) in the second run of a controlled greenhouse study.
NaCl
(mM)
N RatePlant Height (cm)Panicle Length (cm)Tiller Number (pot−1)Seed number (pot−1)
(mg pot−1)SANDSANDSANDSAND
0093.2 ± 2.1 c117.8 ± 2.5 c16.0 ± 0.8 b15.2 ± 0.4 c5.0 ± 1.0 c4.0 ± 0.0 c184.7 ± 12 d128.7 ± 8.0 d
100100.7 ± 2.1 b126.5 ± 2.0 b18.6 ± 0.6 a16.2 ± 0.2 b7.3 ± 0.6 b7.0 ± 1.0 b347.3 ± 17 c282.0 ± 12.7 c
200111.2 ± 1.2 a132.8 ± 1.0 a19.4 ± 0.1 a18.6 ± 0.3 a14.0 ± 1.0 a12.7 ± 1.2 a702.0 ± 9.1 b669.7 ± 18.1 b
400108.3 ± 3.9 a128.2 ± 1.9 b19.4 ± 0.4 a18.3 ± 0.3 a15.0 ± 1.0 a14.0 ± 1.0 a883.0 ± 18.3 a905.7 ± 3.8 a
Mean103.3 A126.3 A18.4 A17.1 A10.3 A9.4 A529.3 A496.5 A
100092.5 ± 1.5 c89.8 ± 3.9 c15.8 ± 0.3 b13.9 ± 0.6 d4.0 ± 0.0 d4.0 ± 0.0 d172.7 ± 10.9 d73.0 ± 5.9 d
10098.5 ± 1.3 b114.8 ± 3.1 b16.7 ± 0.9 b16.1 ± 0.8 c6.7 ± 1.2 c6.7 ± 0.6 c269.0 ± 14.0 c196.7 ± 12.4 c
200107.3 ± 2.6 a122.7 ± 1.6 a18.8 ± 0.3 a17.8 ± 0.3 b12.3 ± 0.6 b11.7 ± 0.6 b575.0 ± 14.5 b537.7 ± 15.5 b
400107.2 ± 1.8 a122.3 ± 0.7 a19.6 ± 0.3 a18.7 ± 0.2 a14.3 ± 0.6 a13.3 ± 0.6 a787.7 ± 11.8 a820.7 ± 18.9 a
Mean101.4 B112.4 B17.72 B16.64 B9.45 A9.0 A451.1 B407.2 B
Mean values ± SD are shown. Within a column means followed by the same letter are not significantly different at the 0.05 probability level. Lower-case and upper-case letters indicate comparison among nitrogen and between two saline soil treatments, respectively.

