Description and Preliminary Simulations with the Italian Vineyard Integrated Numerical Model for Estimating Physiological Values (IVINE)


Abstract
:1. Introduction
2. Materials and Methods
2.1. The IVINE Model
2.2. Input Data
2.3. Model Validation
2.4. Sensitivity Analysis
2.5. Long-Term Simulations and Statistical Analysis
3. Results
3.1. Model Validation
3.1.1. Phenological Stages
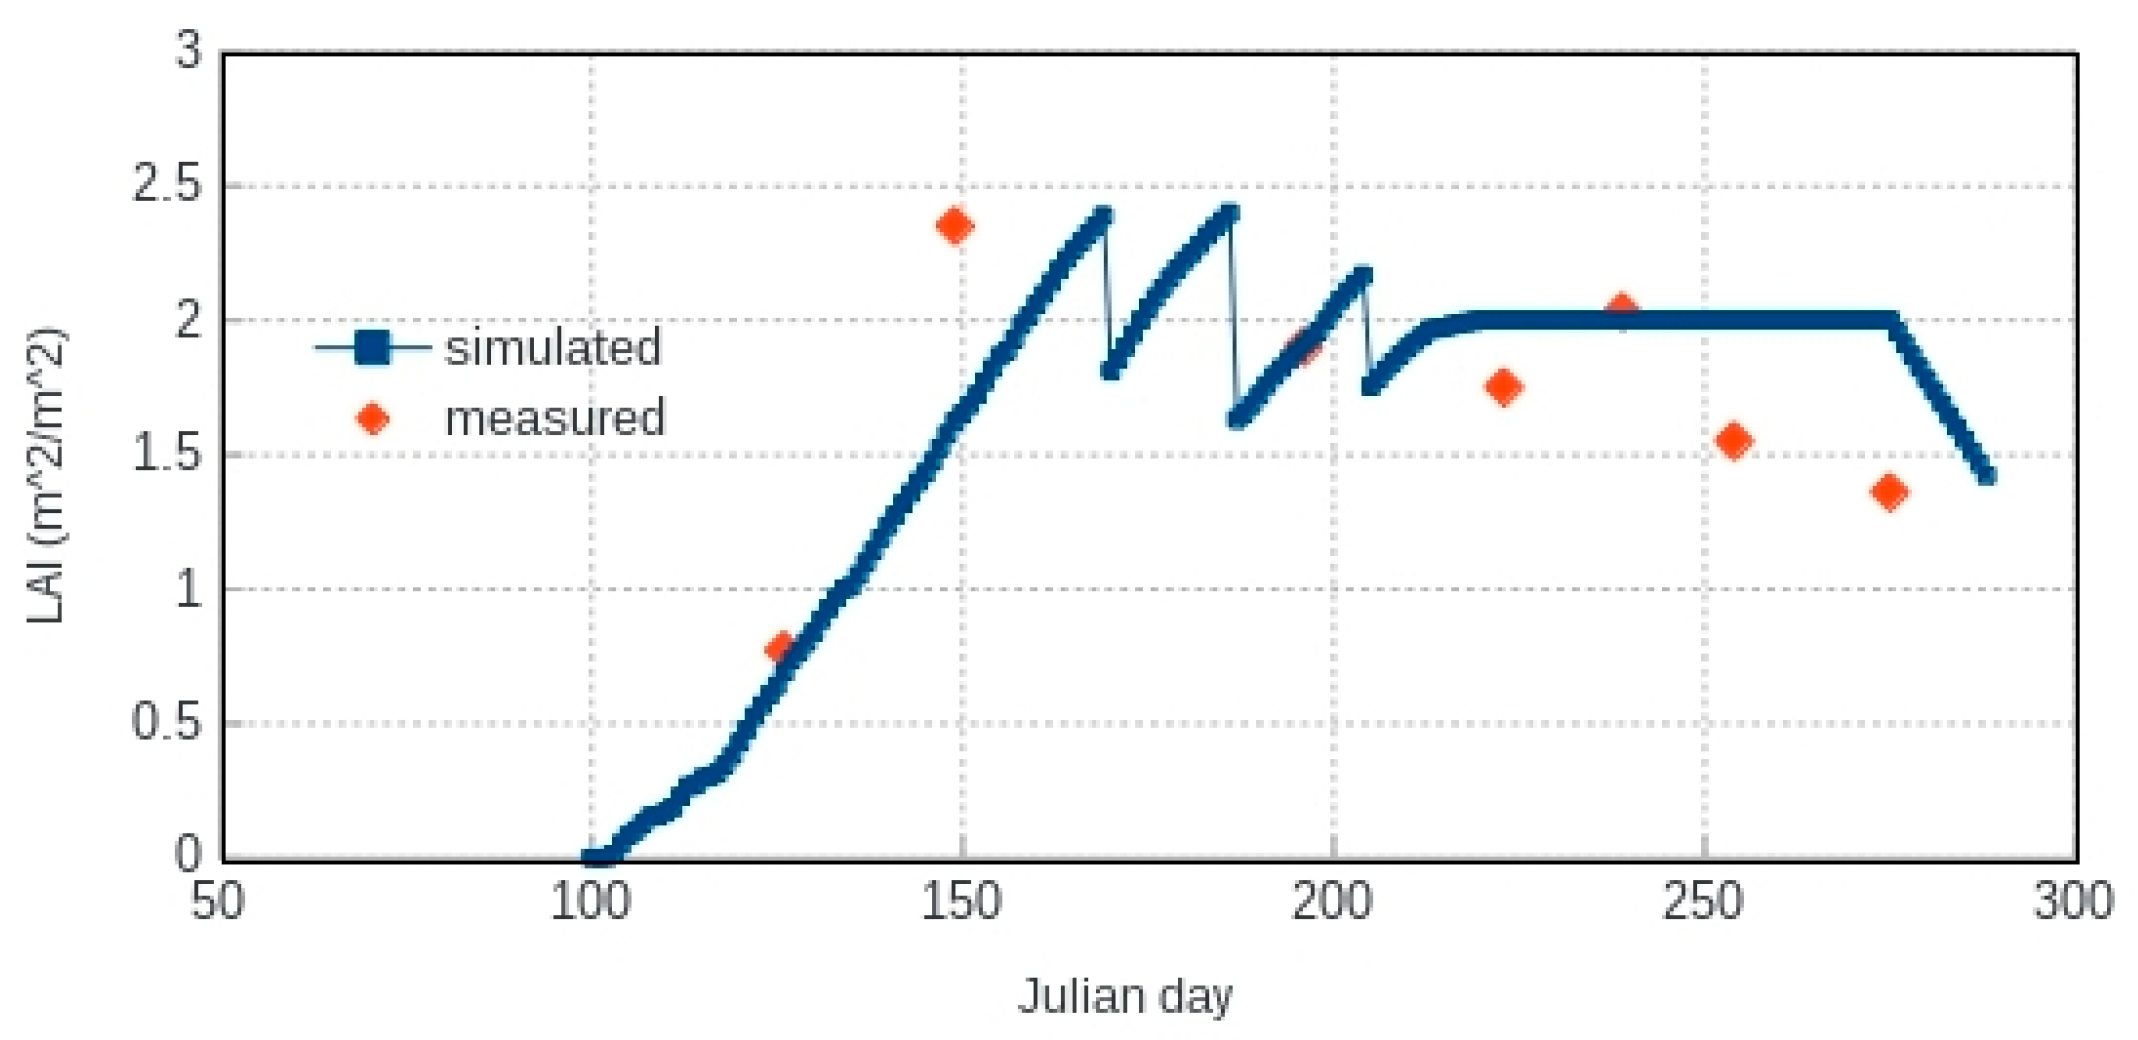
3.1.2. Leaf Area Index (LAI)
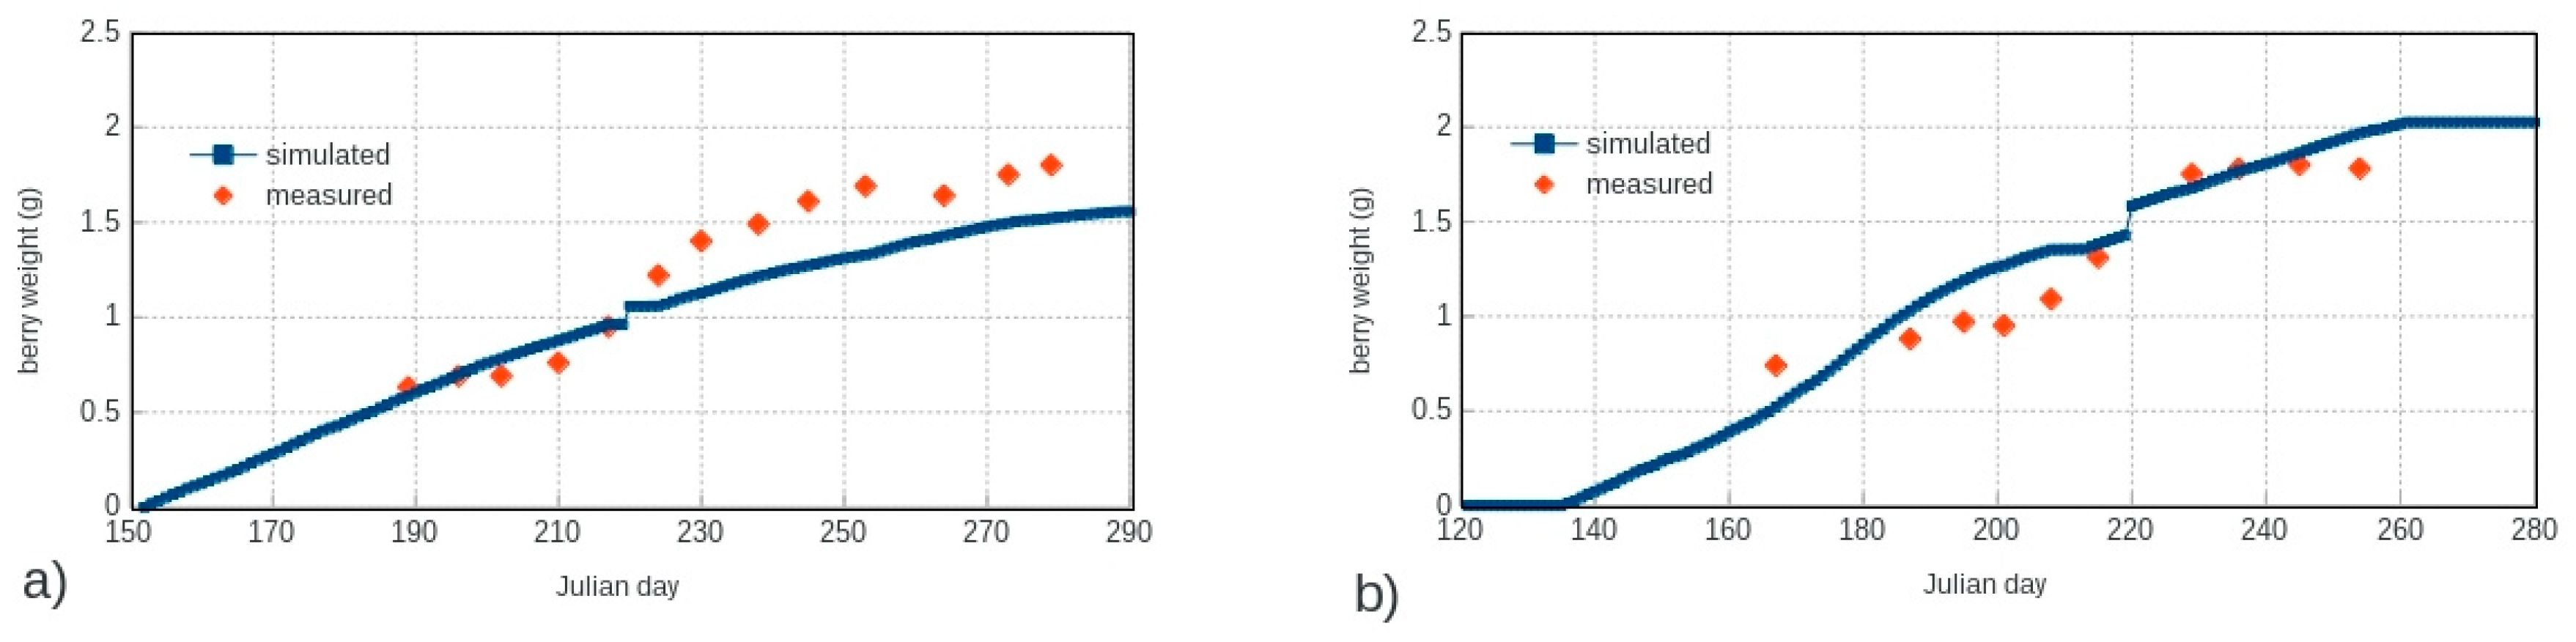
3.1.3. Berry Growth
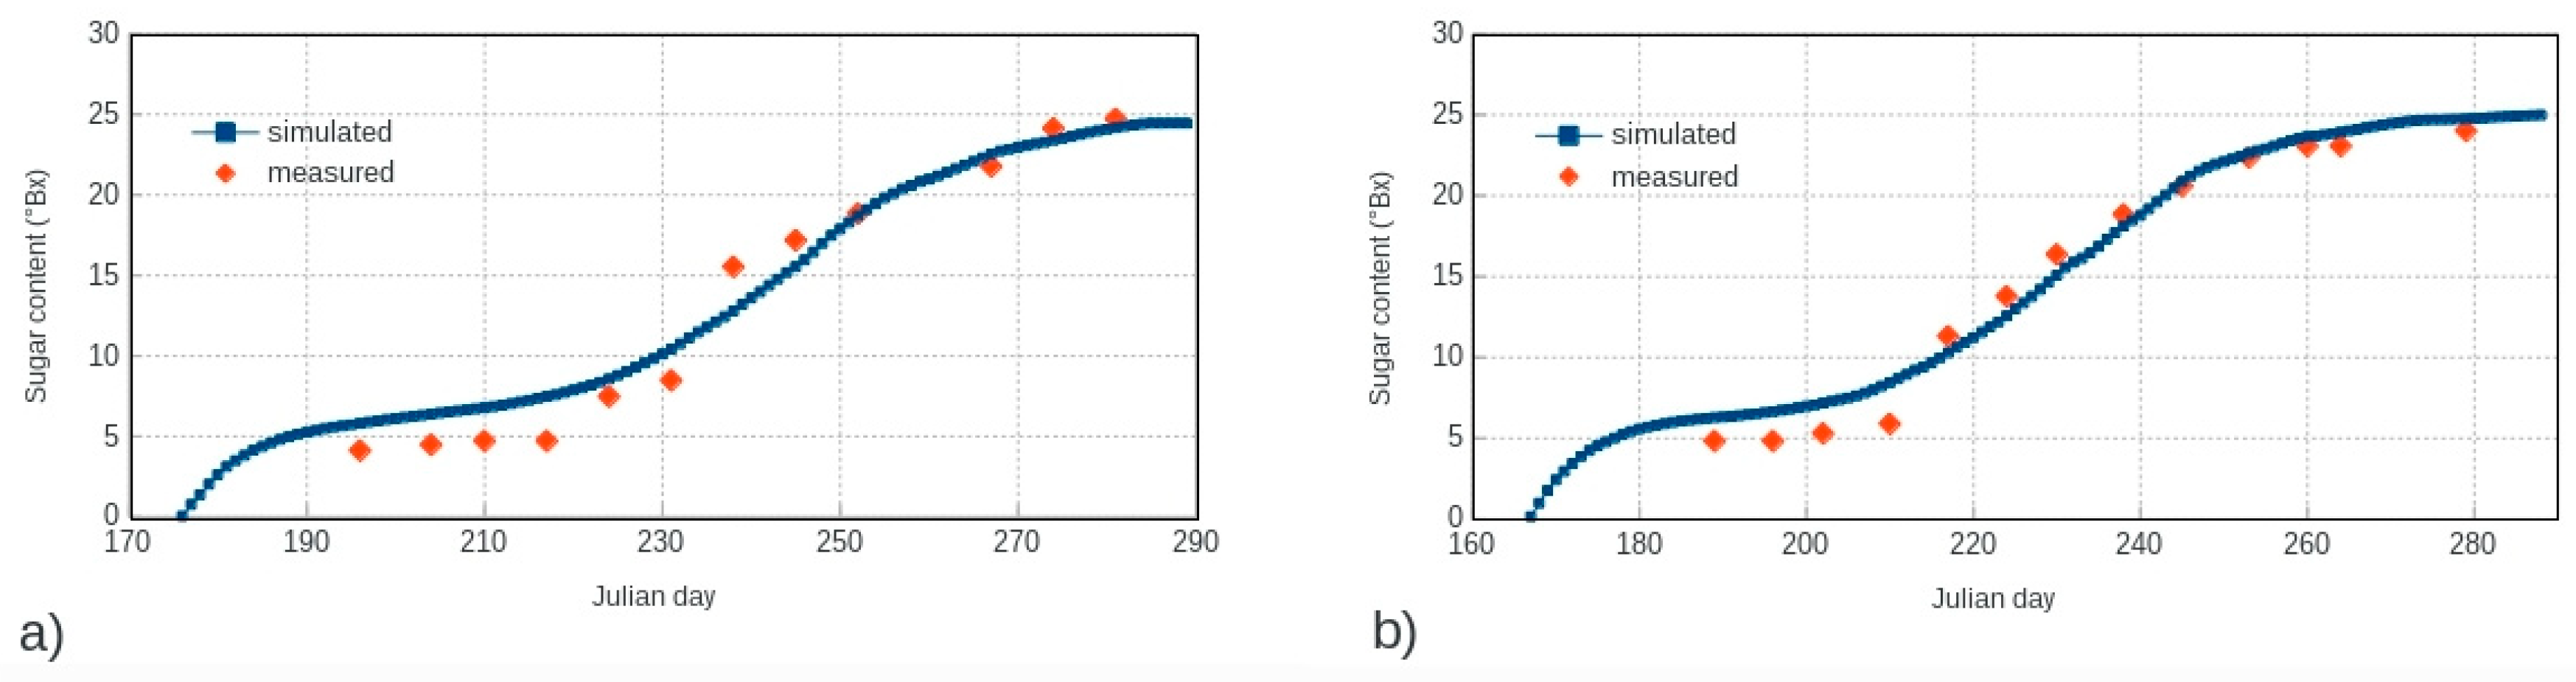
3.1.4. Berry Sugar Content
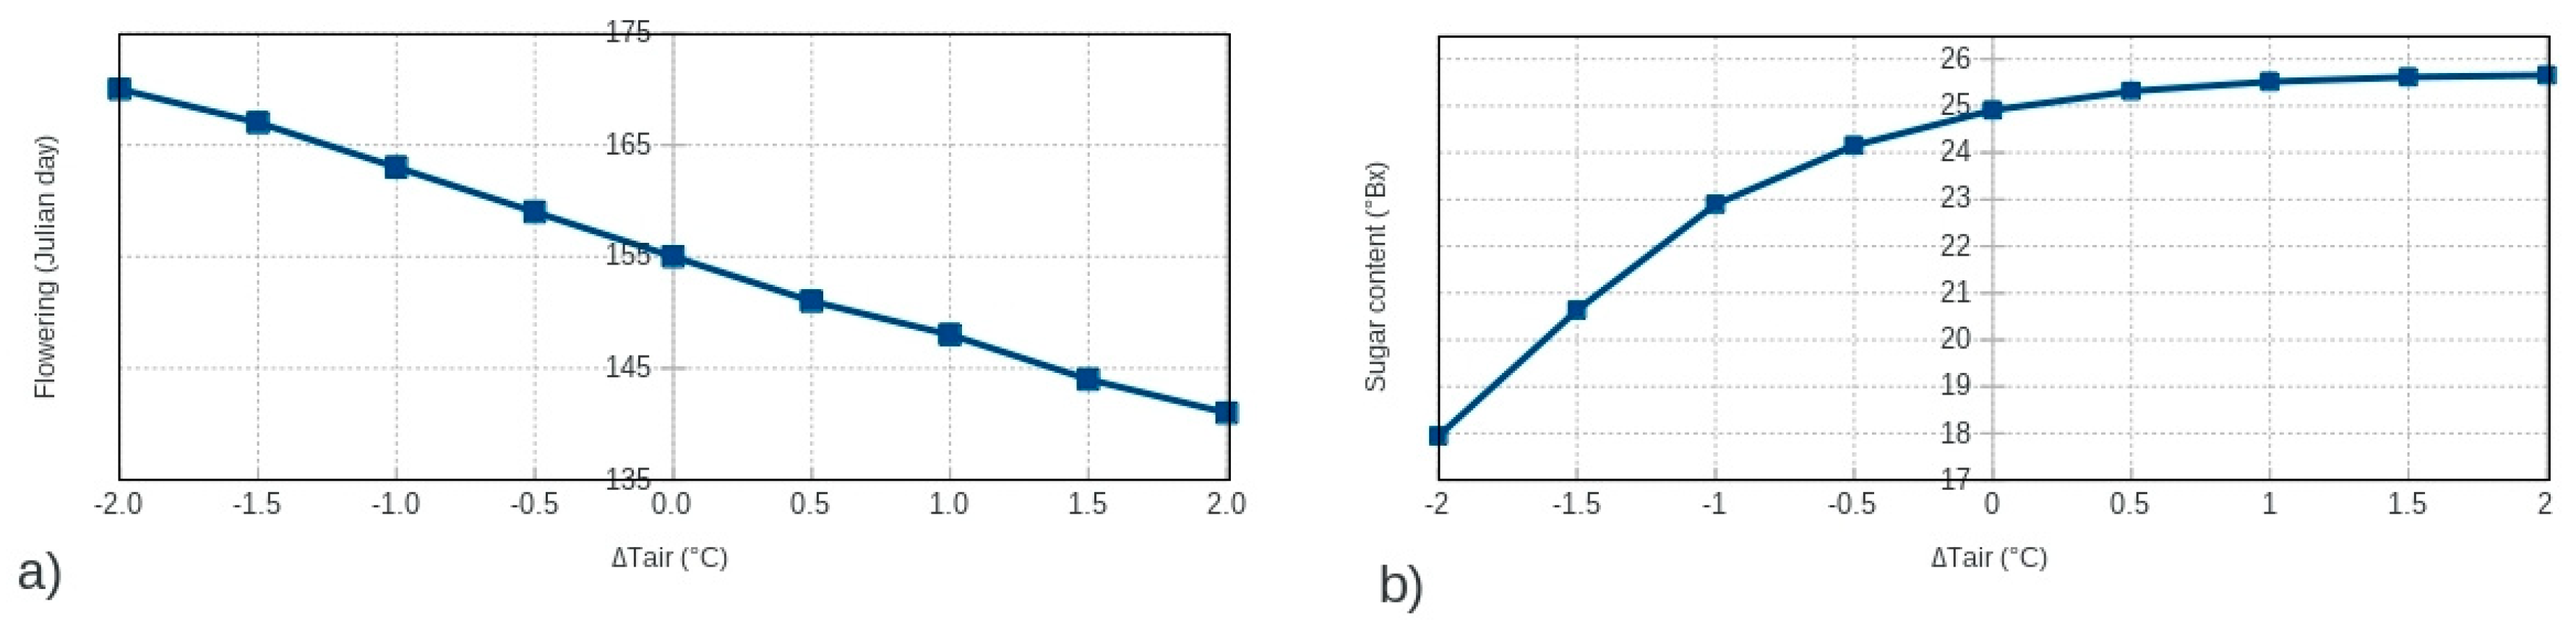
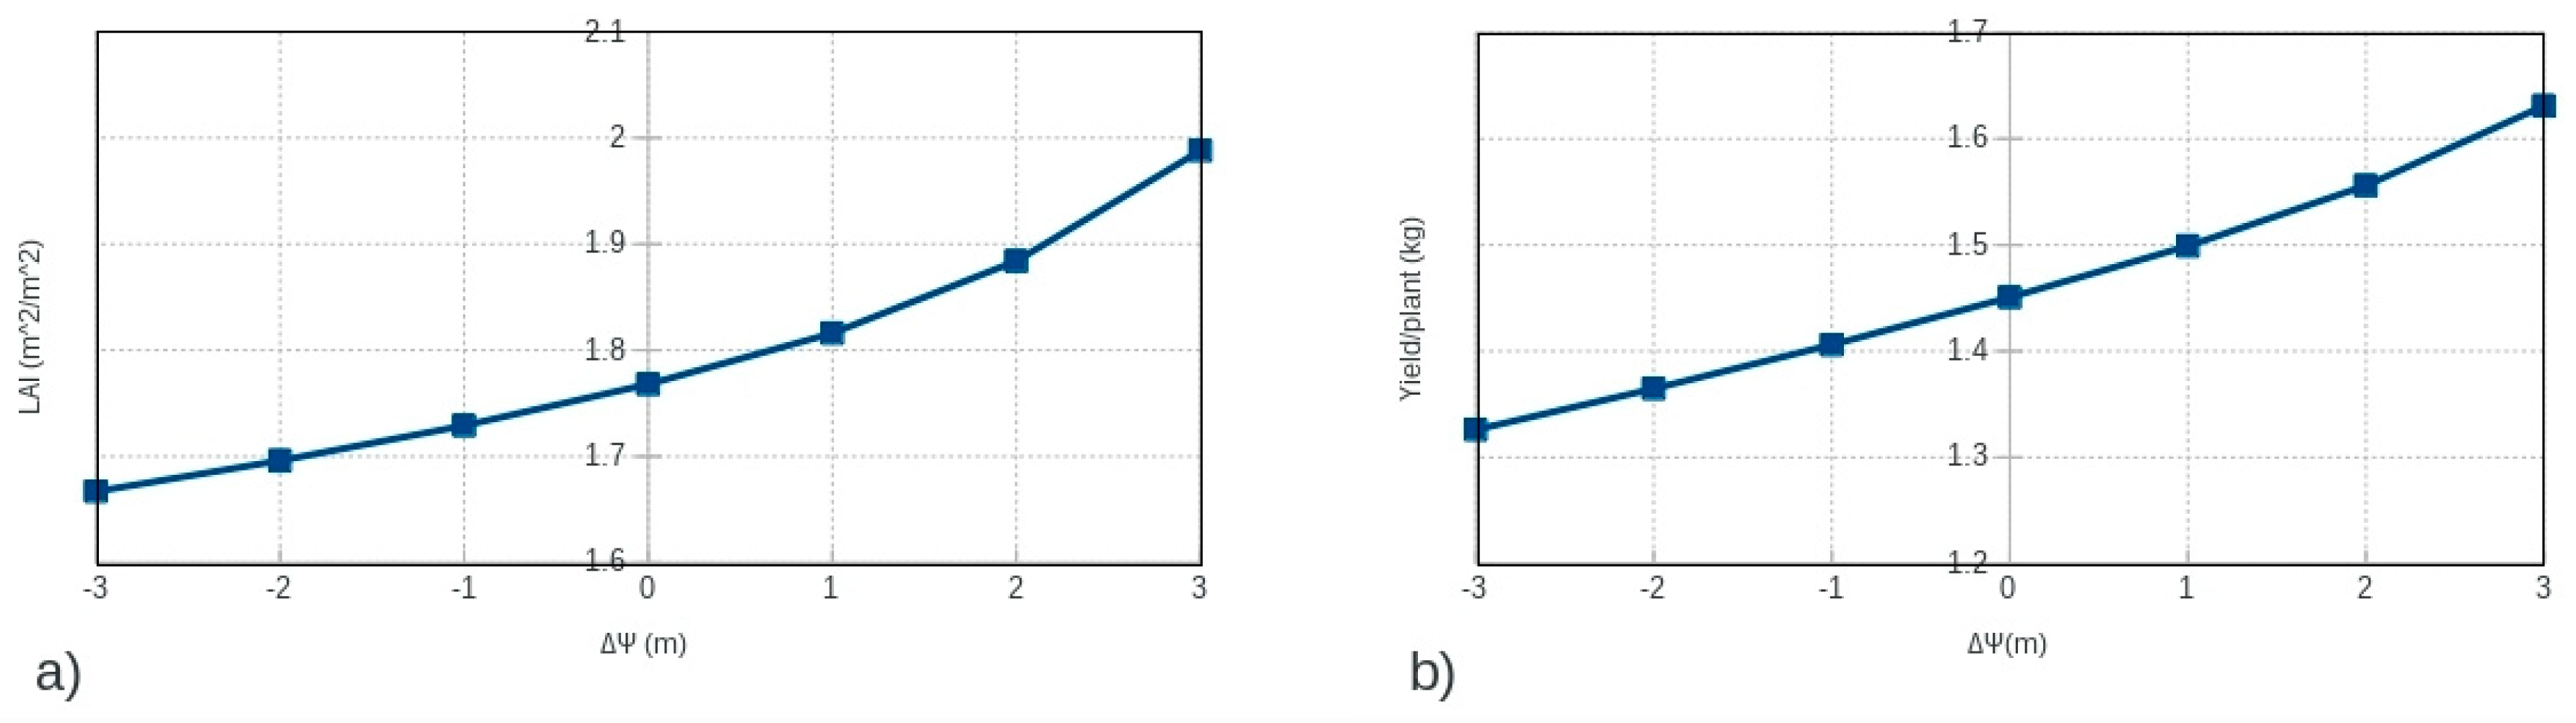
3.2. Sensitivity Analysis
3.3. Long-Term Simulations
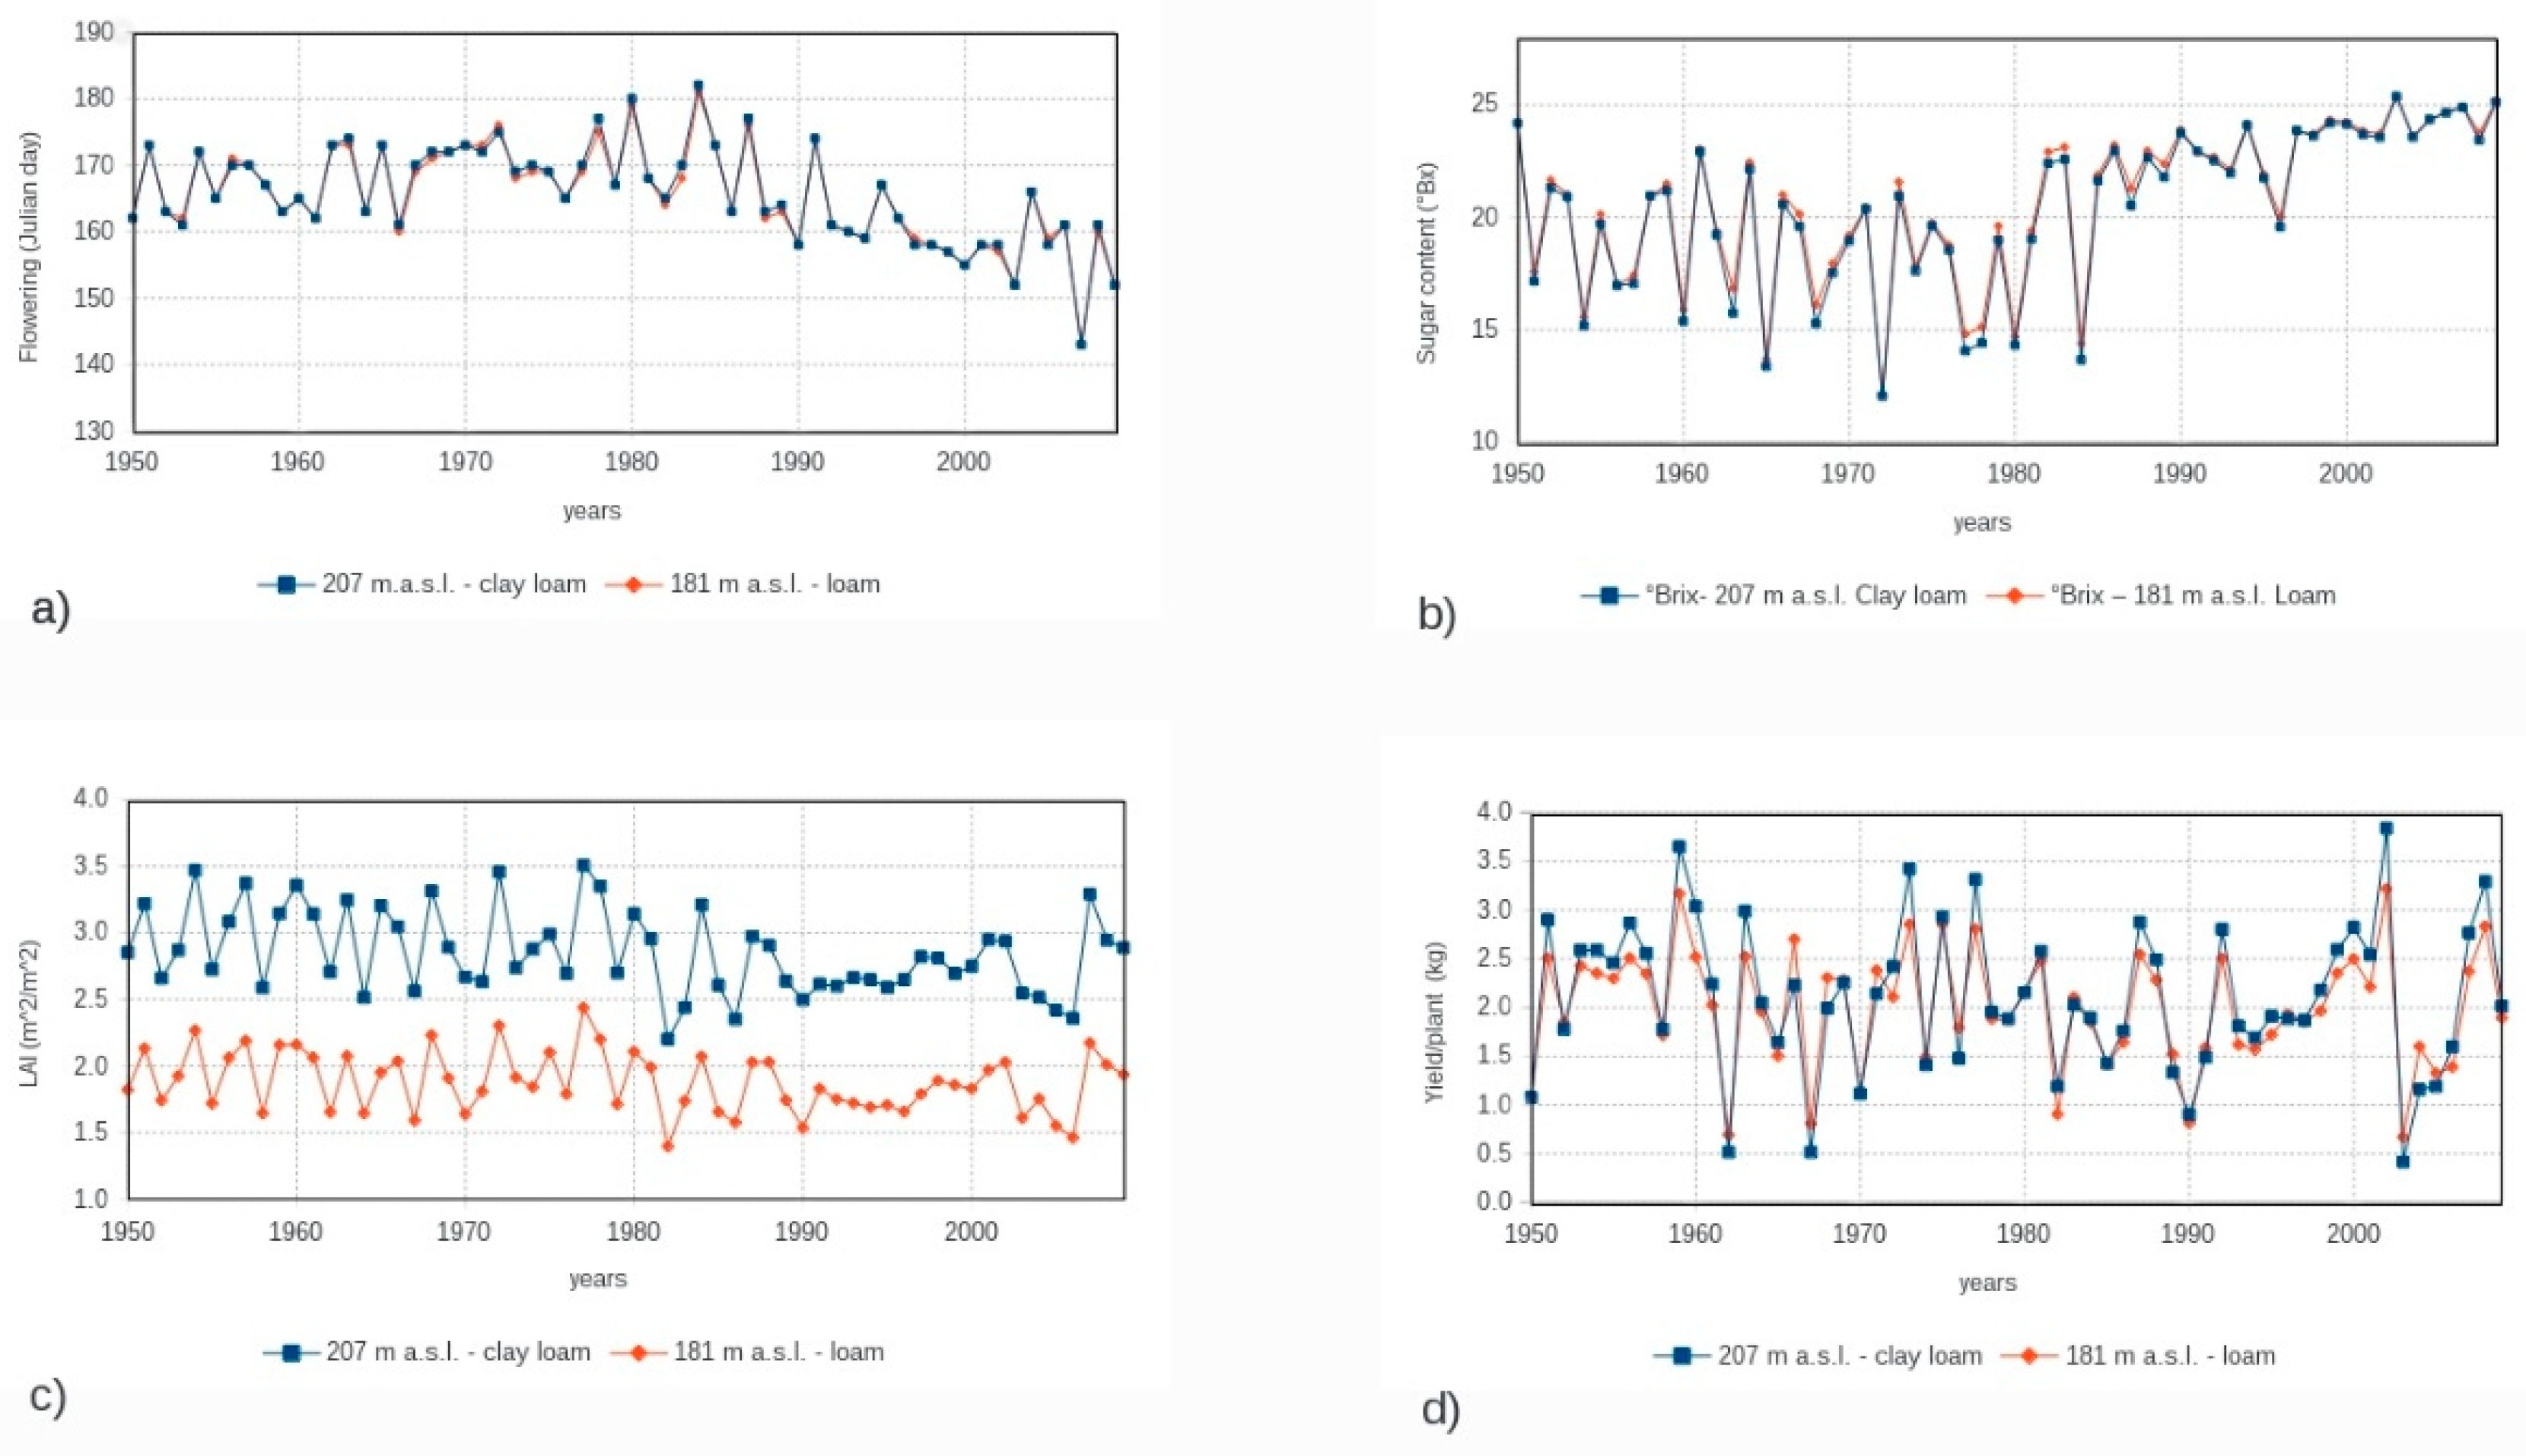
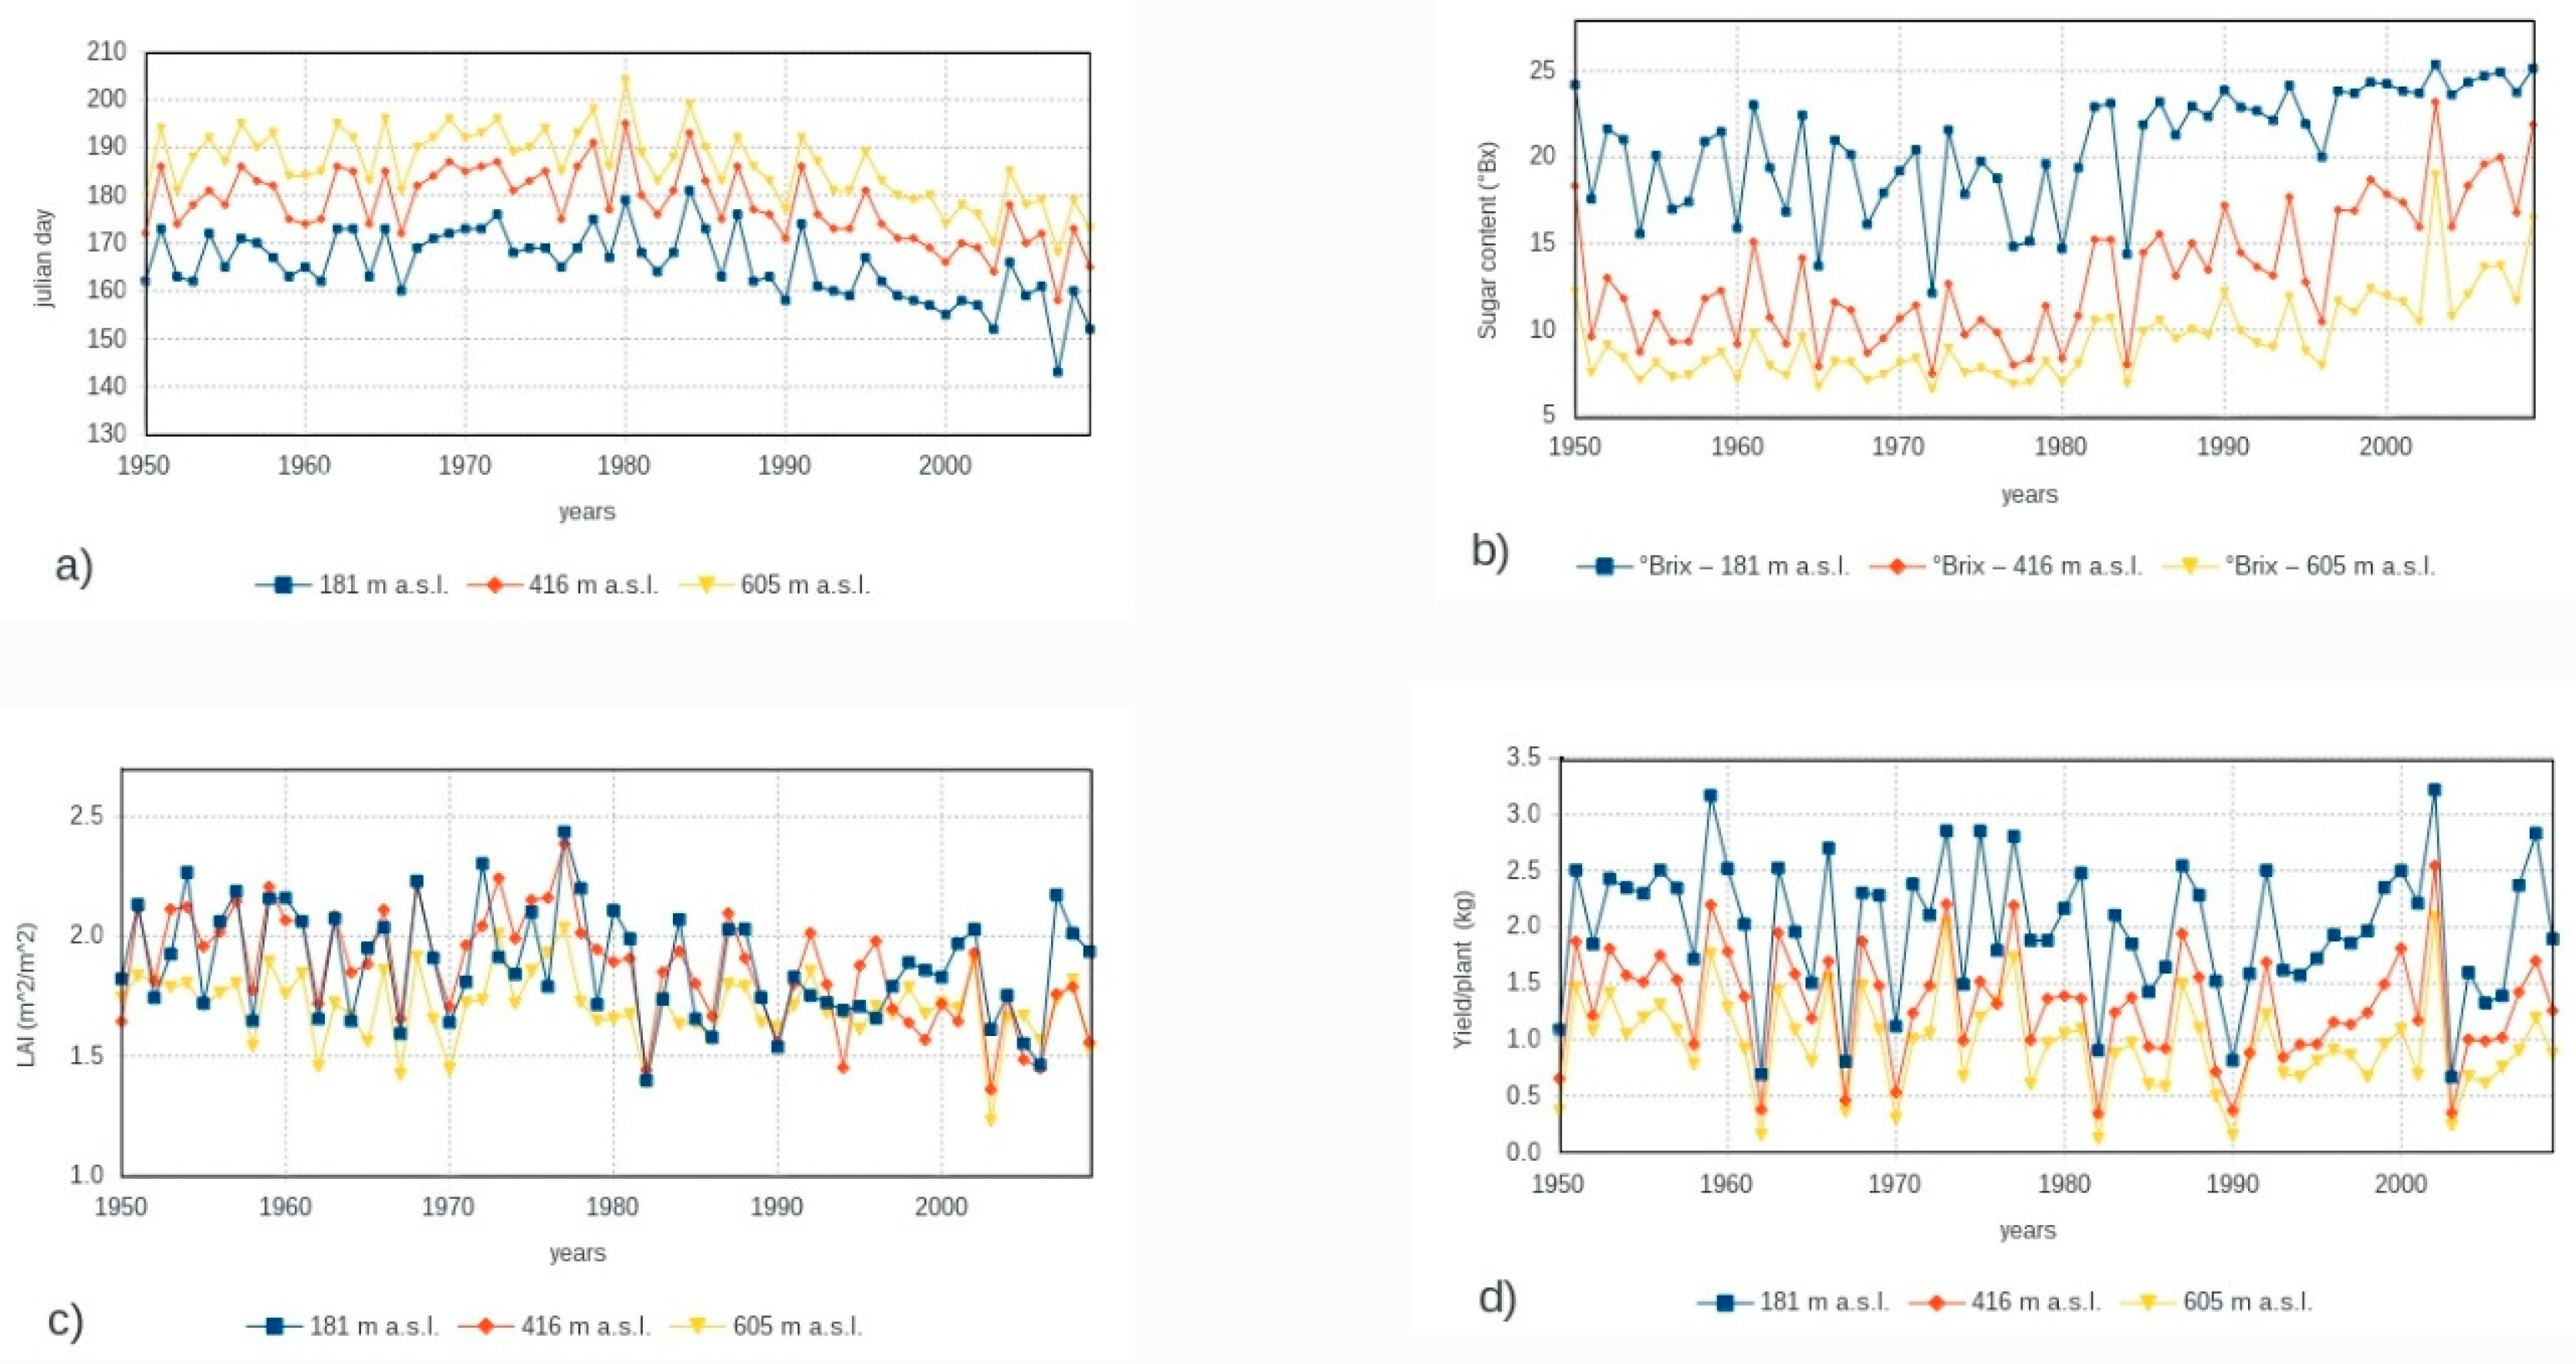
3.3.1. Effect of Elevation
3.3.2. Effect of Soil Texture
3.4. Slopes of Regression Trends
4. Discussion
5. Conclusions
Supplementary Materials
Author Contributions
Funding
Acknowledgments
Conflicts of Interest
References
- Olesen, J.E.; Trnka, M.; Kersebaum, K.C.; Skjelvag, A.O.; Seguin, B.; Peltonen-Sainio, B.; Rossi, F.; Koryra, J.; Micale, F. Impacts and adaptation of European crop production systems to climate change. Eur. J. Agron. 2011, 34, 96–112. [Google Scholar] [CrossRef]
- Challinor, A.J.; Simelton, E.S.; Fraser, E.; Hemming, D.; Collins, M. Increased crop failure due to the climate change: Assessing adaptation options using models and socio-economic data for wheat in China. Env. Res. Lett. 2010, 5, 034012. [Google Scholar] [CrossRef]
- Olesen, J.E.; Bindi, M. Consequences of climate change for European agricultural productivity, land use and policy. Eur. J. Agron. 2002, 16, 239–262. [Google Scholar] [CrossRef]
- Rotter, R.R.P.; Palosuo, T.; Kersebaum, K.K.C.; Angulo, C.; Bindi, M.; Ewert, F.; Ferrise, R.; Hlavinka, P.; Moriondo, M.; Nendel, C.; et al. Simulation of spring barley yield in different climatic zones of Northern and Central Europe. A comparison of nine crop models. Field Crops Res. 2012, 133, 23–36. [Google Scholar] [CrossRef]
- Brouwer, F.; Van Ittersum, M. Environmental and Agricultural Modelling. Integrated Approach for Policy Impact Assessment; Springer: Dordrecht, The Netherlands, 2010. [Google Scholar]
- Ewert, F.; Angulo, C.; Rumbaur, C.; Lock, R.; Enders, A.; Adenauer, M.; Heckelei, T.; Van Ittersum, M.K.; Wolf, J.; Rotter, R. (AgriAdapt) Project of the Research Program Climate Change and Spatial Planning. Scenario Development and Assessment of the Potential Impacts of Climate and Market Changes on Crops in Europe; Climate Changes Spatial Planning Programme: Wageningen, The Netherlands, 2011; p. 49. [Google Scholar]
- Basso, B.; Cammarano, D.; Sartori, L. A strategic and tactical management approach to select optimal N fertlizer rates for wheat in a spatially variable field. Eur. J. Agron. 2011, 35, 215–222. [Google Scholar] [CrossRef]
- Thorp, K.R.; Dejong, K.C.; Kaleita, A.L.; Batchelor, W.D.; Paz, J.O. Methodology for the use of DSSAT models for precision agriculture decision support. Comp. Elect. Agric. 2008, 64, 276–285. [Google Scholar] [CrossRef]
- Rossi, V.; Salinari, F.; Poni, S.; Caffi, T.; Bettati, T. Addressing the implementation problem in agricultural decision support systems: The example of vite.net. Comp. Elect. Agric. 2014, 2014, 88–99. [Google Scholar] [CrossRef]
- Costa, R.; Fraga, H.; Malheiro, A.C.; Santos, J.A. Application of crop modelling to portuguese viticulture: Implementation and added-values for strategic planning. Cienc. Tec. Vitiv. 2015, 30, 29–42. [Google Scholar] [CrossRef]
- Van Ittersum, M.K.; Leffelaar, P.A.; Van Keulen, H.; Kropff, M.J.; Bastiaans, L.; Goudriaan, J. On approaches and applications of the Wageningen crop models. Eur. J. Agron. 2003, 18, 201–234. [Google Scholar] [CrossRef]
- De Wit, C.T.; Goudriaan, J.; van Laar, H.H.; Penning de Vries, F.W.T.; Rabbinge, R.; van Keulen, H.; Louwerse, W.; Sibma, L.; de Jonge, C. Simulation of Assimilation, Respiration and Transpiration of Crops (Simulation Monographs); Pudoc, Center for Agricultural Publishing and Documentation: Wageningen, The Netherlands, 1978. [Google Scholar]
- Goudriaan, J. Crop Micrometeorology: A Simulation Study. Simulation Monographs; Pudoc, Center for Agricultural Publishing and Documentation: Wageningen, The Netherlands, 1977. [Google Scholar]
- Van Keulen, H.; Van Heemst, H.D.J. Crop Response to the Supply of Macronutrients; Centre for Agricultural Publishing and Documentation, Pudoc: Wageningen, The Netherlands, 1982; p. 46. [Google Scholar]
- Van Keulen, H.; Wolf, J. Modelling of Agricultural Production: Weather, Soils and Crops; Centre for Agricultural Publishing and Documentation, Pudoc: Wageningen, The Netherlands, 1986; p. 46. [Google Scholar]
- Penning de Vries, F.W.T.; Jansen, D.; Ten Berge, H.F.M.; Bakema, A. Simulation of Ecophysiological Processes of Growth in Several Annual Crops; Pudoc/IRRI: Wageningen, The Netherlands; Los Banos, Philippines, 1989; Volumn 29. [Google Scholar]
- Boumann, B.A.M.; Kropff, M.J.; Tuong, T.P.; Wopereis, M.C.S.; Ten Berge, H.F.M.; Van Laar, H. ORYZA2000: Modelling Lowland Rice; International Rice Research Institute/University and Research Centre: Los Banos, Philippines; Wageningen, The Netherlands, 2001. [Google Scholar]
- Brisson, N.; Mary, B.; Ripoche, D.; Jeuffroy, M.H.; Ruget, F.; Nicoullaud, B.; Gate, P.; Devienne-Barret, F.; Antonioletti, R.; Durr, C.; et al. STICS: A generic model for the simulation of crops and their water and nitrogen balances. I. Theory and parameterization applied to wheat and corn. Agronomie 1998, 18, 311–346. [Google Scholar] [CrossRef]
- Brisson, N.; Gary, C.; Justes, E.; Roche, R.; Mary, B.; Ripoche, D.; Zimmer, D.; Sierra, J.; Bertuzzi, P.; Burger, P.; et al. An overview of the crop model STICS. Eur. J. Agron. 2003, 18, 309–332. [Google Scholar] [CrossRef]
- Bindi, M.; Miglietta, F.; Gozzini, B.; Orlandini, S.; Seghi, L. A simple model for simulation of growth and development in grapevine (Vitis vinifera L.). I. Model description. Vitis 1997, 36, 67–71. [Google Scholar]
- Vivin, P.; Castelan, M.; Gaudillere, J.P. A source/sink model to simulate seasonal allocation of carbon in grapevine. Acta Hort. 2002, 584, 43–56. [Google Scholar] [CrossRef]
- Cola, G.; Mariani, L.; Salinari, F.; Civardi, S.; Bernizzoni, F.; Gatti, M.; Poni, S. Description and testing of a weather-base model for predicting phenology, canopy development and source-sink balance in Vitis vinifera L. cv. Barbera. Agric. For. Meteorol. 2014, 184, 117–136. [Google Scholar] [CrossRef]
- Poni, S.; Palliotti, A.; Bernizzoni, F. Calibration and Evaluation of a STELLA Software-based Daily CO2 Balance Model in Vitis vinifera L. J. Amer. Soc. Hort. Sci. 2006, 131, 273–283. [Google Scholar] [CrossRef]
- Zhu, J.; Génard, M.; Poni, S.; Gambetta, G.A.; Vivin, P.; Vercambre, G.; Trought, M.C.T.; Ollat, N.; Delrot, S.; Dai, Z. Modelling grape growth in relation to whole-plant carbon and water fluxes. J. Exp. Bot. 2018. [Google Scholar] [CrossRef] [PubMed]
- Garcia de Cortazar Atauri, I. Adapatation du Model STICS a la Vigne (Vitis vinifera L.). Utilisations dans le Cadre D’une Etude D’impact du Changement Climatique a L’echelle de la France. Ph.D. Thesis, Ecole Nationale Superiore Agronomique de Montpellier, Ecole Doctarale, Montpellier, France, 2006. [Google Scholar]
- Valdes-Gomez, H.; Celette, F.; Garcia de Cortazar Atauri, I.; Jara-Rojas, F.; Gary Ortega-Farias, C.C. Modelling soil water content and grapevine growth and development with the STICS crop-soil model under two different water management strategies. J. Int. Sci. Vigne. Vin. 2009, 43, 13–28. [Google Scholar] [CrossRef]
- Fraga, H.; Costa, R.; Moutinho-Pereira, J.; Correia, C.M.; Dinis, L.T.; Goncalves, I.; Silvestre, J.; Eiras-Dias, J.; Malheiro, A.C.; Santos, J. Modeling phenology, water status, and yield components of three portuguese grapevines using the STICS crop model. Am. J. Enol. Vitic. 2015, 66, 482–491. [Google Scholar] [CrossRef]
- Garcia de Cortazar Atauri, I.; Brisson, N.; Gaudillere, J.P. Performance of several models for predicting budburst date of grapevine (Vitis vinifera L.). Int. J. Biometeorol. 2009, 53, 317–326. [Google Scholar] [CrossRef] [PubMed]
- Parker, A.K.; Garcia de Cortazar Atauri, I.; Van Leeuwen, C.; Chuine, I. General phenological model to characterise the timing of flowering and veraison of Vitis vinifera L. Aust. J. Grape Wine Res. 2011, 17, 206–216. [Google Scholar] [CrossRef]
- Garcia de Cortazar Atauri, I.; Daux, V.; Garnier, E.; Yiou, P.; Viovy, N.; Seguin, B.; Boursiquot, J.M.; van Leeuwen, C.; Parker, A.K.; Chuine, I. Climate reconstructions from grape harvest dates: Methodology and uncertainties. Holocene 2010, 20, 1–10. [Google Scholar] [CrossRef]
- Tomasi, D.; Jones, G.; Giust, M.; Lovat, L.; Gaiotti, F. Grapevine phenology and climate change: Relationships and trends in the Veneto region of Italy for 1964–2009. Am. J. Enol. Vitic. 2011, 62, 329–339. [Google Scholar] [CrossRef]
- Brillante, L.; Mathieu, O.; Lévêque, J.; Bois, B. Ecophysiological modeling of grapevine water stress in Burgundy terroirs by a machine-learning. Front. Plant Sci. 2016, 7, 796. [Google Scholar] [CrossRef] [PubMed]
- Andreoli, V.; Cassardo, C.; Cavalletto, S.; Ferrarese, S.; Guidoni, S.; Mania, E.; Spanna, F. Representation of Micrometeorological and Physiological Parameters with Numerical Models Influencing the Vineyard Ecosystem: The Case of Piemonte (Italy); European Geophysics Union: Vienna, Austria, 2017; Volumn 19. [Google Scholar]
- Cassardo, C.; Andreoli, V.; Spanna, F.; Ferrarese, S.; Picco, S. Climatology of Phenological and other Micrometeorological Variables Parameters in Regional Vineyard Ecosystem in Piedmont (Italy); European Geophysics Union: Vienna, Austria, 2018; Volumn 20. [Google Scholar]
- Saxton, K.E.; Rawls, W.J. Soil Water Characteristic Estimate by Texture and Organic Matter for Hydrologic Solutions. Soil Sci. Soc. Am. J. 2006, 70, 1569–1578. [Google Scholar] [CrossRef]
- Clapp, R.B.; Hornberger, G.M. Empirical Equations for Some Soil Hydraulic Properties. Water Resour. Res. 1978, 14, 601–604. [Google Scholar] [CrossRef]
- McCumber, M.C.; Pielke, R.A. Simulation of the effects of surface fluxes of heat and moisture in a mesoscale numerical model: 1. J. Geophys. Res. 1981, 86, 9929–9938. [Google Scholar] [CrossRef]
- Tremback, C.J.; Kessler, R.L. A Surface Temperature and Moisture Parametrization for Use in Mesoscale Numerical Models, 7th Conference on Numerical Weather Prediction; American Meteorological Society: Boston, MA, USA, 1985. [Google Scholar]
- Brillante, L.; Mathieu, O.; Lévêque, J.; Van Leeuwen, C.; Bois, B. Water status and must composition in grapevine cv. Chardonnay with different soils and topography and a mini meta-analysis of the δ13C/water potentials correlation. J. Sci. Food Agric. 2017, 98, 691–697. [Google Scholar] [CrossRef] [PubMed]
- Bidabe, B. Controle de l’epoque de floraison du pommier per une nouvelle conception de l’action de temperature. Comptes Rendus Séances L’Acad. D’Agric. Fr. 1965, 49, 934–945. [Google Scholar]
- Bidabe, B. L’action des Temperatures sur l’Evolution des Bourgeons de L’entrée en Dormance à la Floraison; Société Pomologique de France: Lyon, France, 1965. [Google Scholar]
- Richardson, E.A.; Seeley, S.D.; Walker, R.D. A model for estimating the completation of rest for Redhaven and Elberta peach trees. HortScience 1974, 9, 331–332. [Google Scholar]
- Richardson, E.A.; Seeley, S.D.; Walker, R.D.; Ashcroft, G. Pheno-climatology of spring peach bud development. HortScience 1975, 10, 236–237. [Google Scholar]
- Winkler, A.J.; Cook, J.A.; Kliewer, W.M.; Lider, L.A. General Viticulture; Cerruti, L., Ed.; University of California Press: Oakland, CA, USA, 1974. [Google Scholar]
- Singels, A.; de Jager, J.M. Refinement and validation of the PUTU wheat crop growth model. 2. Leaf area expansion. Afr. J. Plant Soil 1991, 8, 67–72. [Google Scholar] [CrossRef]
- Brisson, N. Notices Concepts et Formalismes STICS Version 5.0; INRA-Bioclimatologie Avignon: Avignon, France, 2002. [Google Scholar]
- Letchov, G.; Roichev, V. Growth kinetics of grape berry density (Vitis vinifera L. ‘Black Corinth’). Vitis 2017, 56, 155–159. [Google Scholar]
- Garcia de Cortazar Atauri, I.; Brisson, N.; Ollat, N.; Jacquet, O.; Payan, J.-C. Asynchronous dynamics of grapevine (Vitis vinifera) maturation: Experimental study for a modelling approach. J. Int. Sci. Vigne. Vin. 2009, 43, 83–97. [Google Scholar] [CrossRef]
- Rui, H.; Beaudoing, H. README Document for NASA GLDAS Version 2 Data Products; Goddart Earth Sciences Data and Information Services Center (GES DISC): Greenbelt, MD, USA, 2018.
- Rodell, M.; Houser, P.R.; Jambor, U.; Gottschalck, J.; Mitchell, K.; Meng, C.-J.; Arsenault, K.; Cosgrove, B.; Radakovich, J.; Bosilovich, M.; et al. The Global Land Data Assimilation System. Bull. Am. Meteor. Soc. 2004, 85, 381–394. [Google Scholar] [CrossRef]
- Cassardo, C. The University of Torino Model of Land Process Interaction with Atmosphere (UTOPIA) Version 2015; CCCPR/SSRC, Ewha Womans University: Seoul, Korea, 2015; p. 80. [Google Scholar]
- Lazzarato, F. Reconstruction of Parameters Useful to Define the Microclimate of Piedmontese Vineyards Using Simulations (in Italian). Master’s Thesis, Department of Physics, University of Torino, Torino, Italy, 2017. [Google Scholar]
- Picco, S. Climatology of Piedmontese Wine-Vocated Zones, with Particular Attention to Phenological and Physiological Parameters (In Italian). Master’s Thesis, Department of Physics, University of Torino, Torino, Italy, 2017. [Google Scholar]
- Andreoli, V.; Bertoni, D.; Cassardo, C.; Ferrarese, S.; Francone, C.; Spanna, F. Analysis of micrometeorological conditions in Piedmontese vineyards. Ital. J. Agrometeorol. 2018, 2018, 27–40. [Google Scholar] [CrossRef]
- Bleiholder, H.; Weber, E.; Feller, C.; Hess, M.; Wicke, H.; Meier, U.; van den Boom, T.; Lancashire, P.D.; Buhr, L.; Hack, H.; et al. Growth Stages of Mono-and Dicotyledonous Plants; BBCH Monograph, Federal Biological Research Centre for Agriculture and Forestry: Berlin and Braunschweig, Germany, 2001. [Google Scholar]
- Francone, C. Study of the Atmospheric Boundary Layer Processes over Sloping Terrain Covered by Sparse Canopy. Ph.D. Thesis, Dottorato in Fluidodinamica, Politecnico di Torino, Torino, Italy, 2011–2012. [Google Scholar]
- Paesano, G. Health and Environment Report 2008. The State of Environmental Components. Climate; Agenzia Regionale Protezione Ambientale: Piemonte, Italy, 2008; pp. 149–169. [Google Scholar]
- Cassardo, C.; Mercalli, L.; Cat Berro, D. Characteristics of the summer 2003 heat wave in Piedmont, Italy, and its effects on water resources. J. Korean Meteorol. Soc. 2007, 43, 195–221. [Google Scholar]
- Mirás-Avalos, J.M.; Uriarte, D.; Lakso, A.N.; Intrigliolo, D.S. Modeling grapevine performance with ‘VitiSim’, a weather-based carbon balance model: Water status and climate change scenarios. Sci. Hortic. 2018, 240, 561–571. [Google Scholar] [CrossRef]
- Bindoff, N.L.; Stott, P.A.; AchutaRao, K.M.; Allen, M.R.; Gillett, N.; Gutzler, D.; Hansingo, K.; Hegerl, G.; Hu, Y.; Jain, S.; et al. 2013: Detection and Attribution of Climate Change: From Global to Regional. In Climate Change 2013: The Physical Science Basis. Contribution of Working Group I to the Fifth Assessment Report of the Intergovernmental Panel on Climate Change; Stocker, T.F., Qin, D., Plattner, G.-K., Tignor, M., Allen, S.K., Boschung, J., Nauels, A., Xia, Y., Bex, V., Midgley, P.M., Eds.; Cambridge University Press: Cambridge, UK; New York, NY, USA, 2013. [Google Scholar]


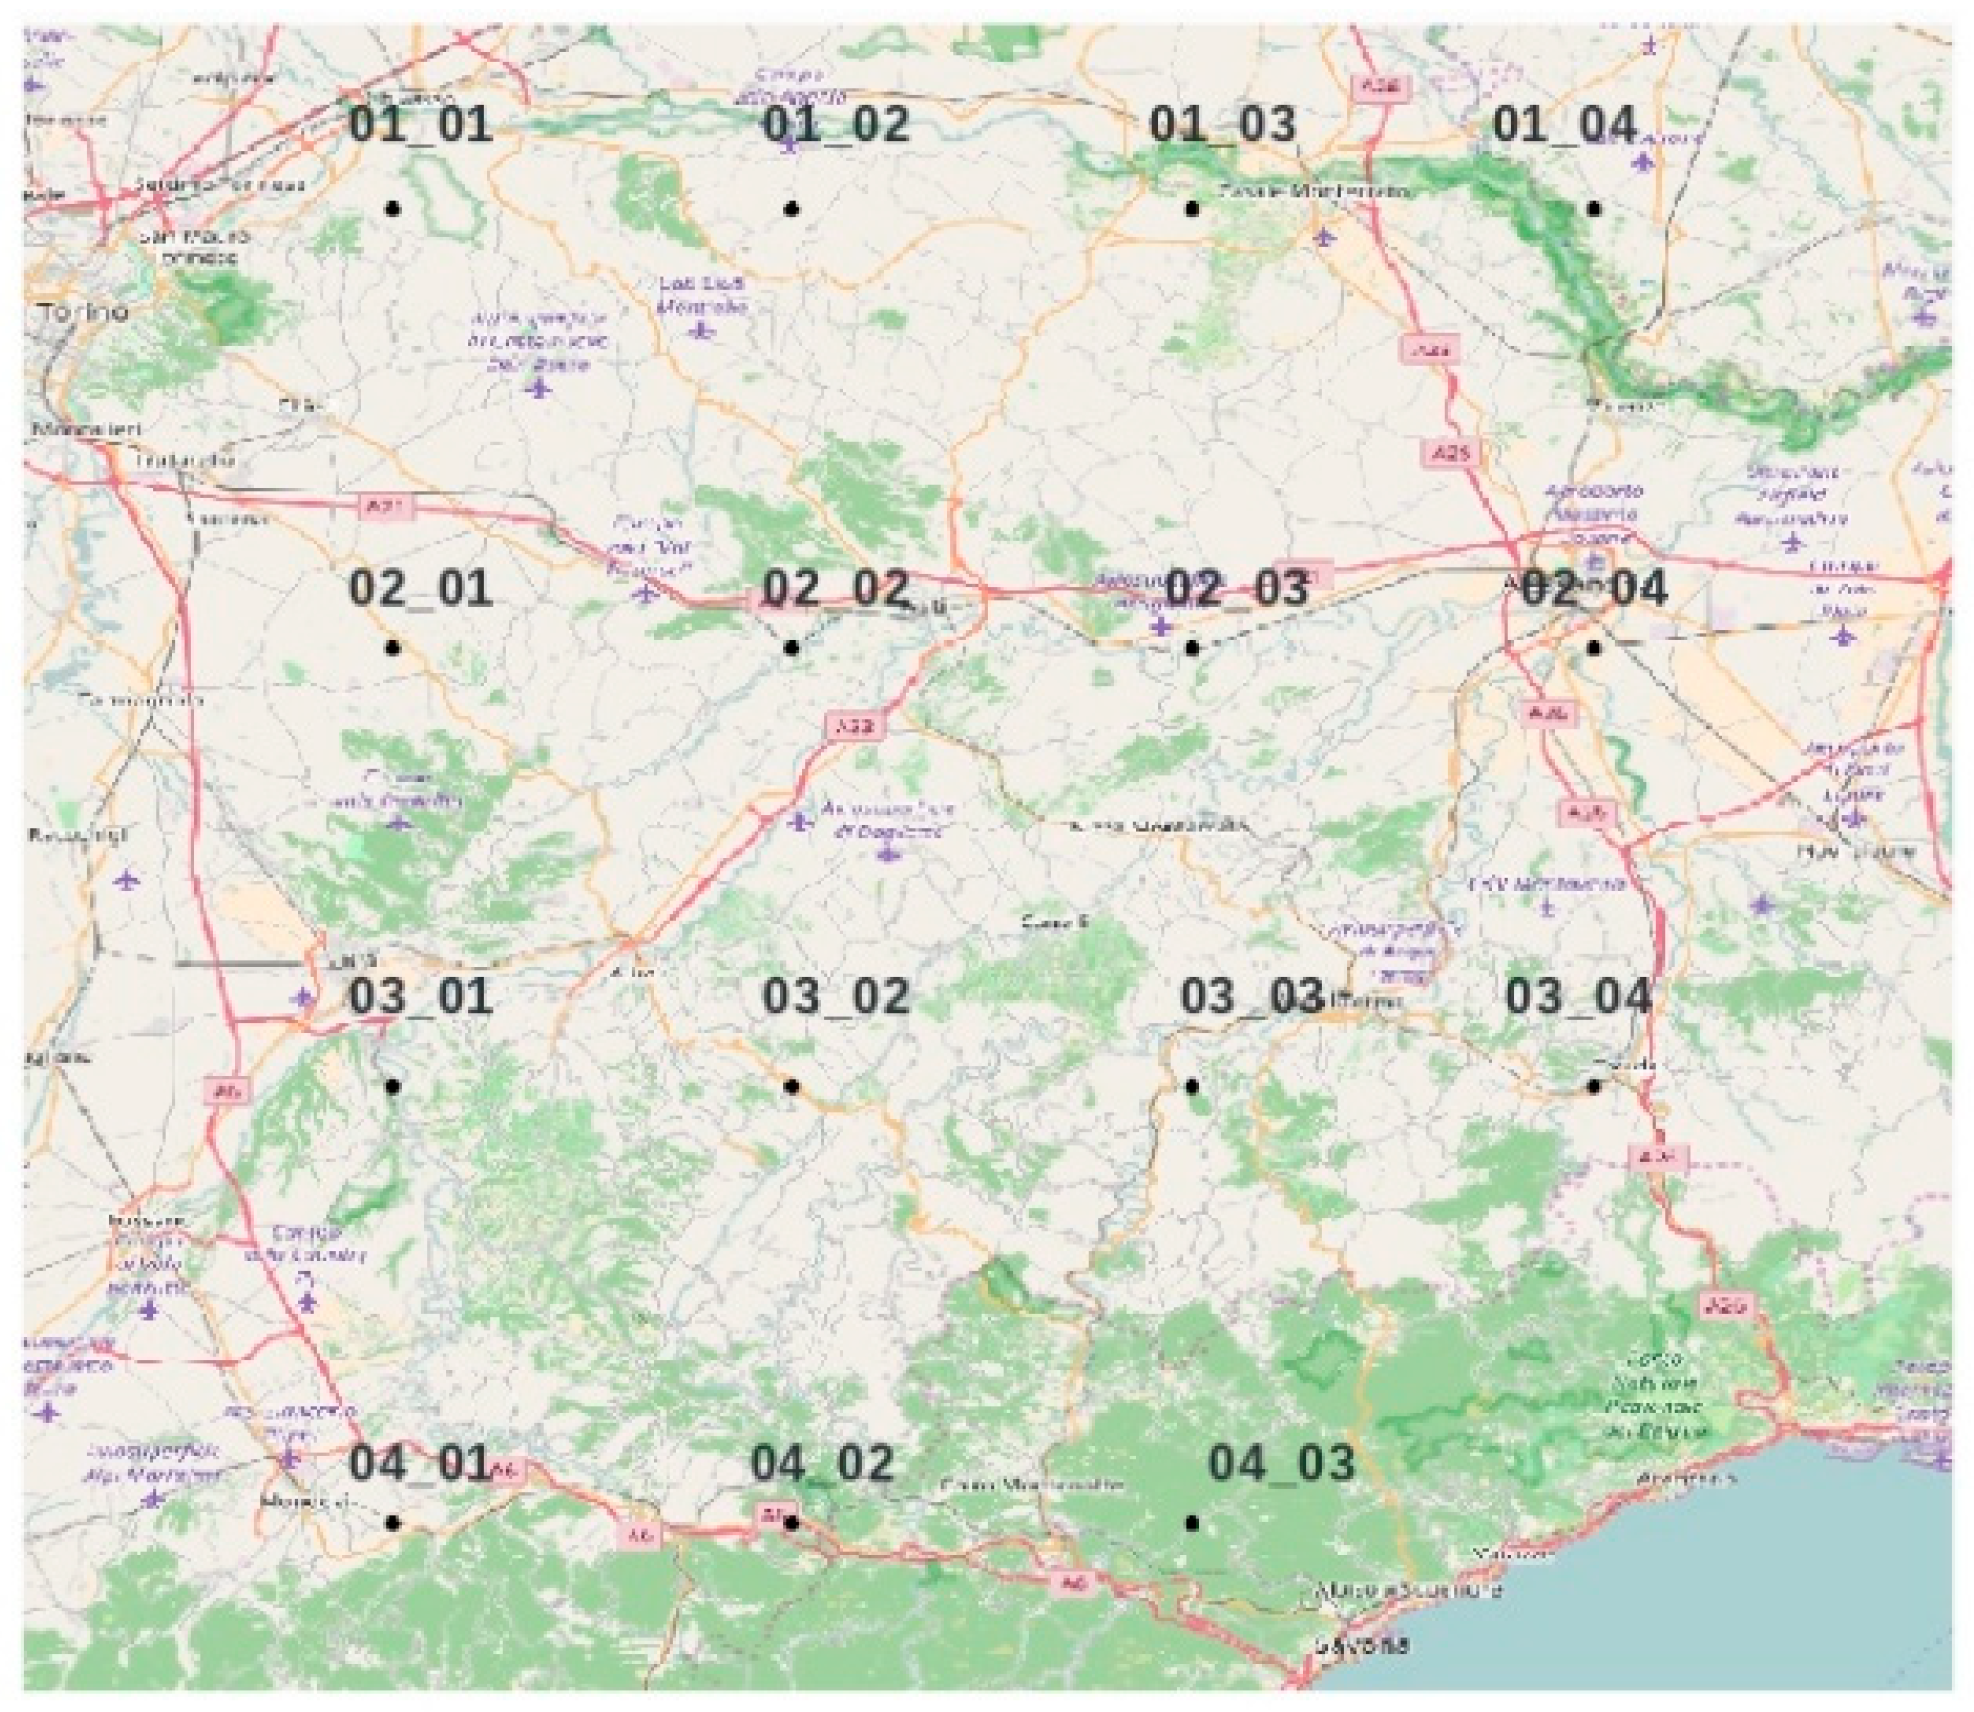
| Grid Points | Coordinates | Elevation (m a.s.l.) | Soil Texture |
|---|---|---|---|
| 01_01 | 7.875, 45.125 | 269 | Clay loam-8 |
| 01_02 | 8.125, 45.125 | 207 | Clay loam-8 |
| 01_03 | 8.375, 45.125 | 154 | Clay loam-8 |
| 01_04 | 8.625, 45.125 | 95 | Clay loam-8 |
| 02_01 | 7.875, 44.875 | 257 | Loam-5 |
| 02_02 | 8.125, 44.875 | 181 | Loam-5 |
| 02_03 | 8.375, 44.875 | 153 | Clay loam-8 |
| 02_04 | 8.625, 44.875 | 107 | Clay loam-8 |
| 03_01 | 7.875, 44.625 | 294 | Loam-5 |
| 03_02 | 8.125, 44.625 | 416 | Loam-5 |
| 03_03 | 8.375, 44.625 | 322 | Loam-5 |
| 03_04 | 8.625, 44.625 | 342 | Loam-5 |
| 04_01 | 7.875, 44.375 | 605 | Loam-5 |
| 04_02 | 8.125, 44.375 | 623 | Loam-5 |
| 04_03 | 8.375, 44.375 | 402 | Loam-5 |
| Phenological Stage, Castiglione Falletto | Year | Simulated | Achieved | ||
|---|---|---|---|---|---|
| Julian Day | BBCH Stage | Julian Day | BBCH Stage | ||
| Bud-break | 2008 | 96 | 7 | 109 | 11 |
| Flowering | 2008 | 165 | 65 | 161 | 63 |
| Veraison | 2008 | 236 | 83 | 223 | 81 |
| Harvest | 2008 | 300 | 89 | 289 | 89 |
| Bud-break | 2009 | 101 | 7 | 112 | 13 |
| Flowering | 2009 | 148 | 65 | 145 | 61 |
| Veraison | 2009 | 220 | 83 | 213 | 81 |
| Harvest | 2009 | 262 | 89 | 279 | 89 |
| Flowering | 2010 | 155 | 65 | 155 | 63 |
| Veraison | 2010 | 218 | 83 | 207 | 81 |
| Harvest | 2010 | 285 | 89 | 286 | 89 |
| Phenological Stage, Fubine | Year | Simulated | Achieved | ||
|---|---|---|---|---|---|
| Julian Day | BBCH Stage | Julian Day | BBCH Stage | ||
| Bud-break | 2008 | 117 | 7 | 120 | 17 |
| Flowering | 2008 | 172 | 65 | 148 | 60 |
| Fruit-set | 2008 | 175 | 71 | 171 | 73 |
| Veraison | 2008 | 244 | 83 | 240 | 83 |
| Fruit-set | 2009 | 164 | 71 | 160 | 73–75 |
| Beginning of ripening | 2009 | 230 | 81 | 224 | 81–83 |
| Veraison | 2009 | 237 | 83 | 224 | 81–83 |
| Year | Experimental Site | Variable | Average MAE | Standard Deviation |
|---|---|---|---|---|
| 2004 | Castagnito | Berry weight (g) | 0.15 | 0.11 |
| 2005 | Castagnito | Berry weight (g) | 0.19 | 0.12 |
| 2006 | Castagnito | Berry weight (g) | 0.16 | 0.08 |
| 2007 | Castagnito | Berry weight (g) | 0.16 | 0.1 |
| 2004 | Castagnito | Sugar content (°Bx) | 1.5 | 0.85 |
| 2005 | Castagnito | Sugar content (°Bx) | 1.12 | 0.7 |
| 2006 | Castagnito | Sugar content (°Bx) | 1.99 | 1.15 |
| 2007 | Castagnito | Sugar content (°Bx) | 1.51 | 0.74 |
| 2009 | Castiglione Falletto | Leaf Area Index (m2/m2) | 0.31 | 0.3 |
| 2009 | Fubine | Leaf Area Index (m2/m2) | 0.68 | 0.47 |
| Variable/Elevation | 181 m a.s.l. | 416 m a.s.l. | 605 m a.s.l. |
|---|---|---|---|
| Flowering Stage (JD year−1) | −0.2 | −0.2 | −0.2 |
| Berry Sugar Content (°Bx year−1) | 0.1 | 0.1 | 0.1 |
| LAI Maximum Value (m2 m−2 year−1) | −0.004 | −0.009 | −0.003 |
| Yield (kg year−1) | −0.004 | −0.005 | −0.005 |
| Variable/Elevation | 181 m a.s.l. | 416 m a.s.l. | 605 m a.s.l. |
|---|---|---|---|
| Flowering Stage (JD year−1) | −0.7 | −0.7 | −0.7 |
| Berry Sugar Content (°Bx year−1) | 0.2 | 0.3 | 0.2 |
| LAI Maximum Value (m2 m−2 year−1) | −0.001 | −0.008 | 0.000 |
| Yield (kg year−1) | 0.007 | 0.008 | 0.004 |
© 2019 by the authors. Licensee MDPI, Basel, Switzerland. This article is an open access article distributed under the terms and conditions of the Creative Commons Attribution (CC BY) license (http://creativecommons.org/licenses/by/4.0/).
Share and Cite
Andreoli, V.; Cassardo, C.; La Iacona, T.; Spanna, F. Description and Preliminary Simulations with the Italian Vineyard Integrated Numerical Model for Estimating Physiological Values (IVINE). Agronomy 2019, 9, 94. https://doi.org/10.3390/agronomy9020094
Andreoli V, Cassardo C, La Iacona T, Spanna F. Description and Preliminary Simulations with the Italian Vineyard Integrated Numerical Model for Estimating Physiological Values (IVINE). Agronomy. 2019; 9(2):94. https://doi.org/10.3390/agronomy9020094
Chicago/Turabian StyleAndreoli, Valentina, Claudio Cassardo, Tiziana La Iacona, and Federico Spanna. 2019. "Description and Preliminary Simulations with the Italian Vineyard Integrated Numerical Model for Estimating Physiological Values (IVINE)" Agronomy 9, no. 2: 94. https://doi.org/10.3390/agronomy9020094
APA StyleAndreoli, V., Cassardo, C., La Iacona, T., & Spanna, F. (2019). Description and Preliminary Simulations with the Italian Vineyard Integrated Numerical Model for Estimating Physiological Values (IVINE). Agronomy, 9(2), 94. https://doi.org/10.3390/agronomy9020094