Article

Screening Tolerance to Phosphorus Deficiency and Validation of Phosphorus Uptake 1 (Pup1) Gene-Linked Markers in Thai Indigenous Upland Rice Germplasm

1
Department of Agronomy, Faculty of Agriculture, Khon Kaen University, Khon Kaen 40002, Thailand
2
Department of Agronomy, Faculty of Agriculture at Kamphaeng Saen, Kasetsart University, Kamphaeng Saen, Nakhon Pathom 73140, Thailand
3
Associate Fellow of the Royal Society of Thailand, Sanam Suea Pa, Dusit, Bangkok 10300, Thailand
*
Author to whom correspondence should be addressed.
Agronomy 2019, 9(2), 81; https://doi.org/10.3390/agronomy9020081
Submission received: 2 January 2019 / Revised: 28 January 2019 / Accepted: 11 February 2019 / Published: 12 February 2019
(This article belongs to the Special Issue Soil Phosphorus Dynamics: Agronomic and Environmental Impacts)

Abstract

:
Phosphorus (P) deficiency is a major factor limiting rice yield throughout the world. Fortunately, some rice accessions are tolerant and can thrive well, even in soils with low P content. The ability to uptake P is heritable, and thus can be incorporated into rice cultivars through standard breeding methods. The objective of this study was to screen for tolerance to phosphorus deficiency and validate the tolerant accessions with phosphorus uptake 1 (Pup1) gene-linked markers in Thai indigenous upland rice germplasm. One hundred sixty-eight rice varieties were screened in a solution culture and assigned a phosphorus deficiency tolerance index and plant symptom score. Eleven upland rice accessions (ULR026, ULR031, ULR124, ULR145, ULR180, ULR183, ULR185, ULR186, ULR213, ULR260, and ULR305), together with the lowland rice cultivar (PLD), were classified as tolerant. They were each validated by nine markers linked to the Pup1 locus and observed for the expected polymerase chain reaction (PCR) product of 0 to 9 markers. The presence or absence of the tolerant allele at the Pup1 locus showed only a slight relationship with the tolerance. Moreover, some lines such as ULR183 and ULR213 expressed high tolerance without the Pup1-linked gene product. Both accessions are useful for the exploration of novel genes conferring tolerance to phosphorus deficiency.

1. Introduction

Phosphorus (P) is an essential element for normal cell growth and cell division in all organisms. P is a major limiting factor for crop production in Thai upland areas because of its low soil availability and its insoluble properties [1]. P deficiency is often found in soils that are acidic [2], aluminum-toxic [3], manganese- or ferric-toxic [4], drought-prone [4,5], and high in pH [6]. Rice grown under these conditions often shows P deficiency problems.
P-deficient tolerance, or P-efficient uptake, in rice is a useful trait to improve. Rice usually develops morphological, physiological, biochemical, and molecular adaptations to overcome P deficiency [7]. Koyama et al. [8] reported the first genotypic difference for P-deficient tolerance in rice. Since then, the development of cultivars with improved P uptake is considered more effective than relying only on strategic fertilizer application. So far, rice breeders have concentrated their efforts on screening the existing cultivars and lines under P-deficient conditions and evaluating the variable traits related to the tolerance [9,10,11,12]. Information on the inheritance of P-deficient tolerance and P-efficient uptake traits is valuable in initiating an effective breeding program in rice. Chaubey et al. [12] and Majumder et al. [13] found that P-deficient tolerance is a quantitatively inherited trait with a mostly additive gene action.
Since the reports of Wissuwa et al. in 1998 [14], ‘Kasalath’ (O. sativa)—a lowland rice from Karimganj, Assam, India—has been used as a donor parent in consecutive studies on P uptake. For example, detection of the phosphorus uptake 1 (Pup1) quantitative trait loci (QTL) gene (for P-deficient tolerance) was discovered to relate to high P-uptake, an increase in tillering ability, and an improvement in root growth under P-deficient upland conditions [15,16]. The gene was also linked to the induction of root elongation [1,6]. Sarkar et al. [17] screened the local rice genotypes for P-deficient tolerance and validated two Pup1-linked Indel markers as diagnostic values for selection. They recommended three Bengal Landraces, ‘Bhutmuri’, ‘Gobindabhog’, and ‘Radhunipagol’, as donor parents for introgression of the high P uptake allele into IR36 and IR64, based on the banding pattern of Pup-1-K42 and Pup-1-K29 markers for foreground selection. The application of Pup1 sequences (GenBank accession no. AB458444.1) was analyzed by Chin et al. [18,19]. Interestingly, the protein kinase gene OsPupK46-2 (protein kinase domain) was closely associated with P-deficient tolerance and was highly conserved in the stress-adapted rice accessions. The above research suggests that P-deficient tolerance, especially in the Pup1 gene family, was highly conserved in stress-adapted rice accessions. This gene might also be conserved in indigenous upland rice. Pup1 can be investigated by screening for P-deficient tolerance and validating the Pup1-linked markers.
The objective of this study is to assess the genotypic variation in P-deficient tolerance in a set of Thai indigenous upland rice, aiming to exploit the trait for upland rice improvement.

2. Materials and Methods

2.1. Plant Materials

One hundred sixty (160) indigenous upland rice varieties collected from major growing areas in Thailand, comprising 5 upland and 3 lowland rice cultivars, were screened for P-deficient solution in a greenhouse and validated by Pup1-linked markers.

2.2. Greenhouse Evaluation

Seeds of the rice accessions were soaked for 24 h and then moistened for 3 more days. The germinated seeds were individually placed in the holes of a 50 cm × 57 cm polystyrene sheet. Each hole was 1.5 cm in diameter, with a total of 128 holes on each sheet. The sheets floated in a plastic tank containing 40 L tap water. The experiment was conducted in a Randomized Complete Block Design (RCBD) with three replications. In each replication, three seeds of each variety were sown in three adjacent holes. One week after germination, the seedlings were evaluated in two hydroponic solutions, one with sufficient phosphorus (+P) and the other with deficient phosphorus (−P). Both +P and −P treatments contained normal nutrient solution with and without 0.32 mM NaH2PO4, respectively. The basic concentration used was determined from the Yoshida solution [20], as modified by Shimizu et al. [1]. It consisted of 1.43 mM NH4NO3, 0.32 mM NaH2PO4, 0.51 mM K2SO4, 1.00 mM CaCl2, 1.64 mM MgSO4, 9.11 M MnCl2, 0.07 M (NH4)6Mo7O24, 18.49 M H3BO3, 0.15 M ZnSO4, 0.16 M CuSO4, and 35.77 M FeCl3. The nutrient solution was changed every four days, and maintained at a pH of 5.0 with 1 M NaOH or HCl added daily as needed.
At 15 days after treatment (DAT), the leaf symptom score was recorded following the procedure described by International Rice Research Institute (IRRI) [21]. Then, plant height and tiller number were determined, and shoot and root were collected and dried to measure for dry weight. The experiment was conducted for two seasons (2016 and 2017) at Khon Kaen University, Mueang Khon Kaen, Khon Kaen Province, Thailand. The phosphorus deficiency tolerance index (PDTI) was calculated from the data obtained from the plants grown in −P/+P conditions in all traits, except for plant symptom score (SC). The dry weight reduction of the rice seedlings was calculated from:
[(TDW under +P condition − TDW under −P condition)/ (TDW under +P condition)] × 100,
where TDW = total seedling dry weight, +P = seedling dry weight from tank with phosphorus, and −P = seedling dry weight from tank without phosphorus. Dry weight of the seedlings was determined by oven-drying the seedlings at 80 °C for 3 days.

2.3. DNA Extraction and Pup1 Gene Validation

Total genomic DNA was extracted from young leaves of each variety following the previously described method [22], with a slight modification. The DNA was quantified against lambda DNA on 1.0% agarose gel stained with ethidium bromide and diluted to 5 ng/µL for PCR amplification. Nine previously reported Pup1-linked markers [18,19,23] were validated for P-deficient tolerance in the upland rice using PCR components and conditions from the method by Sarkar et al. [17]. The markers used were: Pup1-K42, Pup1-K43, Pup1-K46, Pup1-K52, Pup1-K41, PSTol-1, K1, K5, and K29-1.

2.4. Statistical Analysis

Analyses of variance (ANOVA), correlation, and linear regression were applied on the observed data using R program version 2.10.0 [24].

3. Results and Discussion

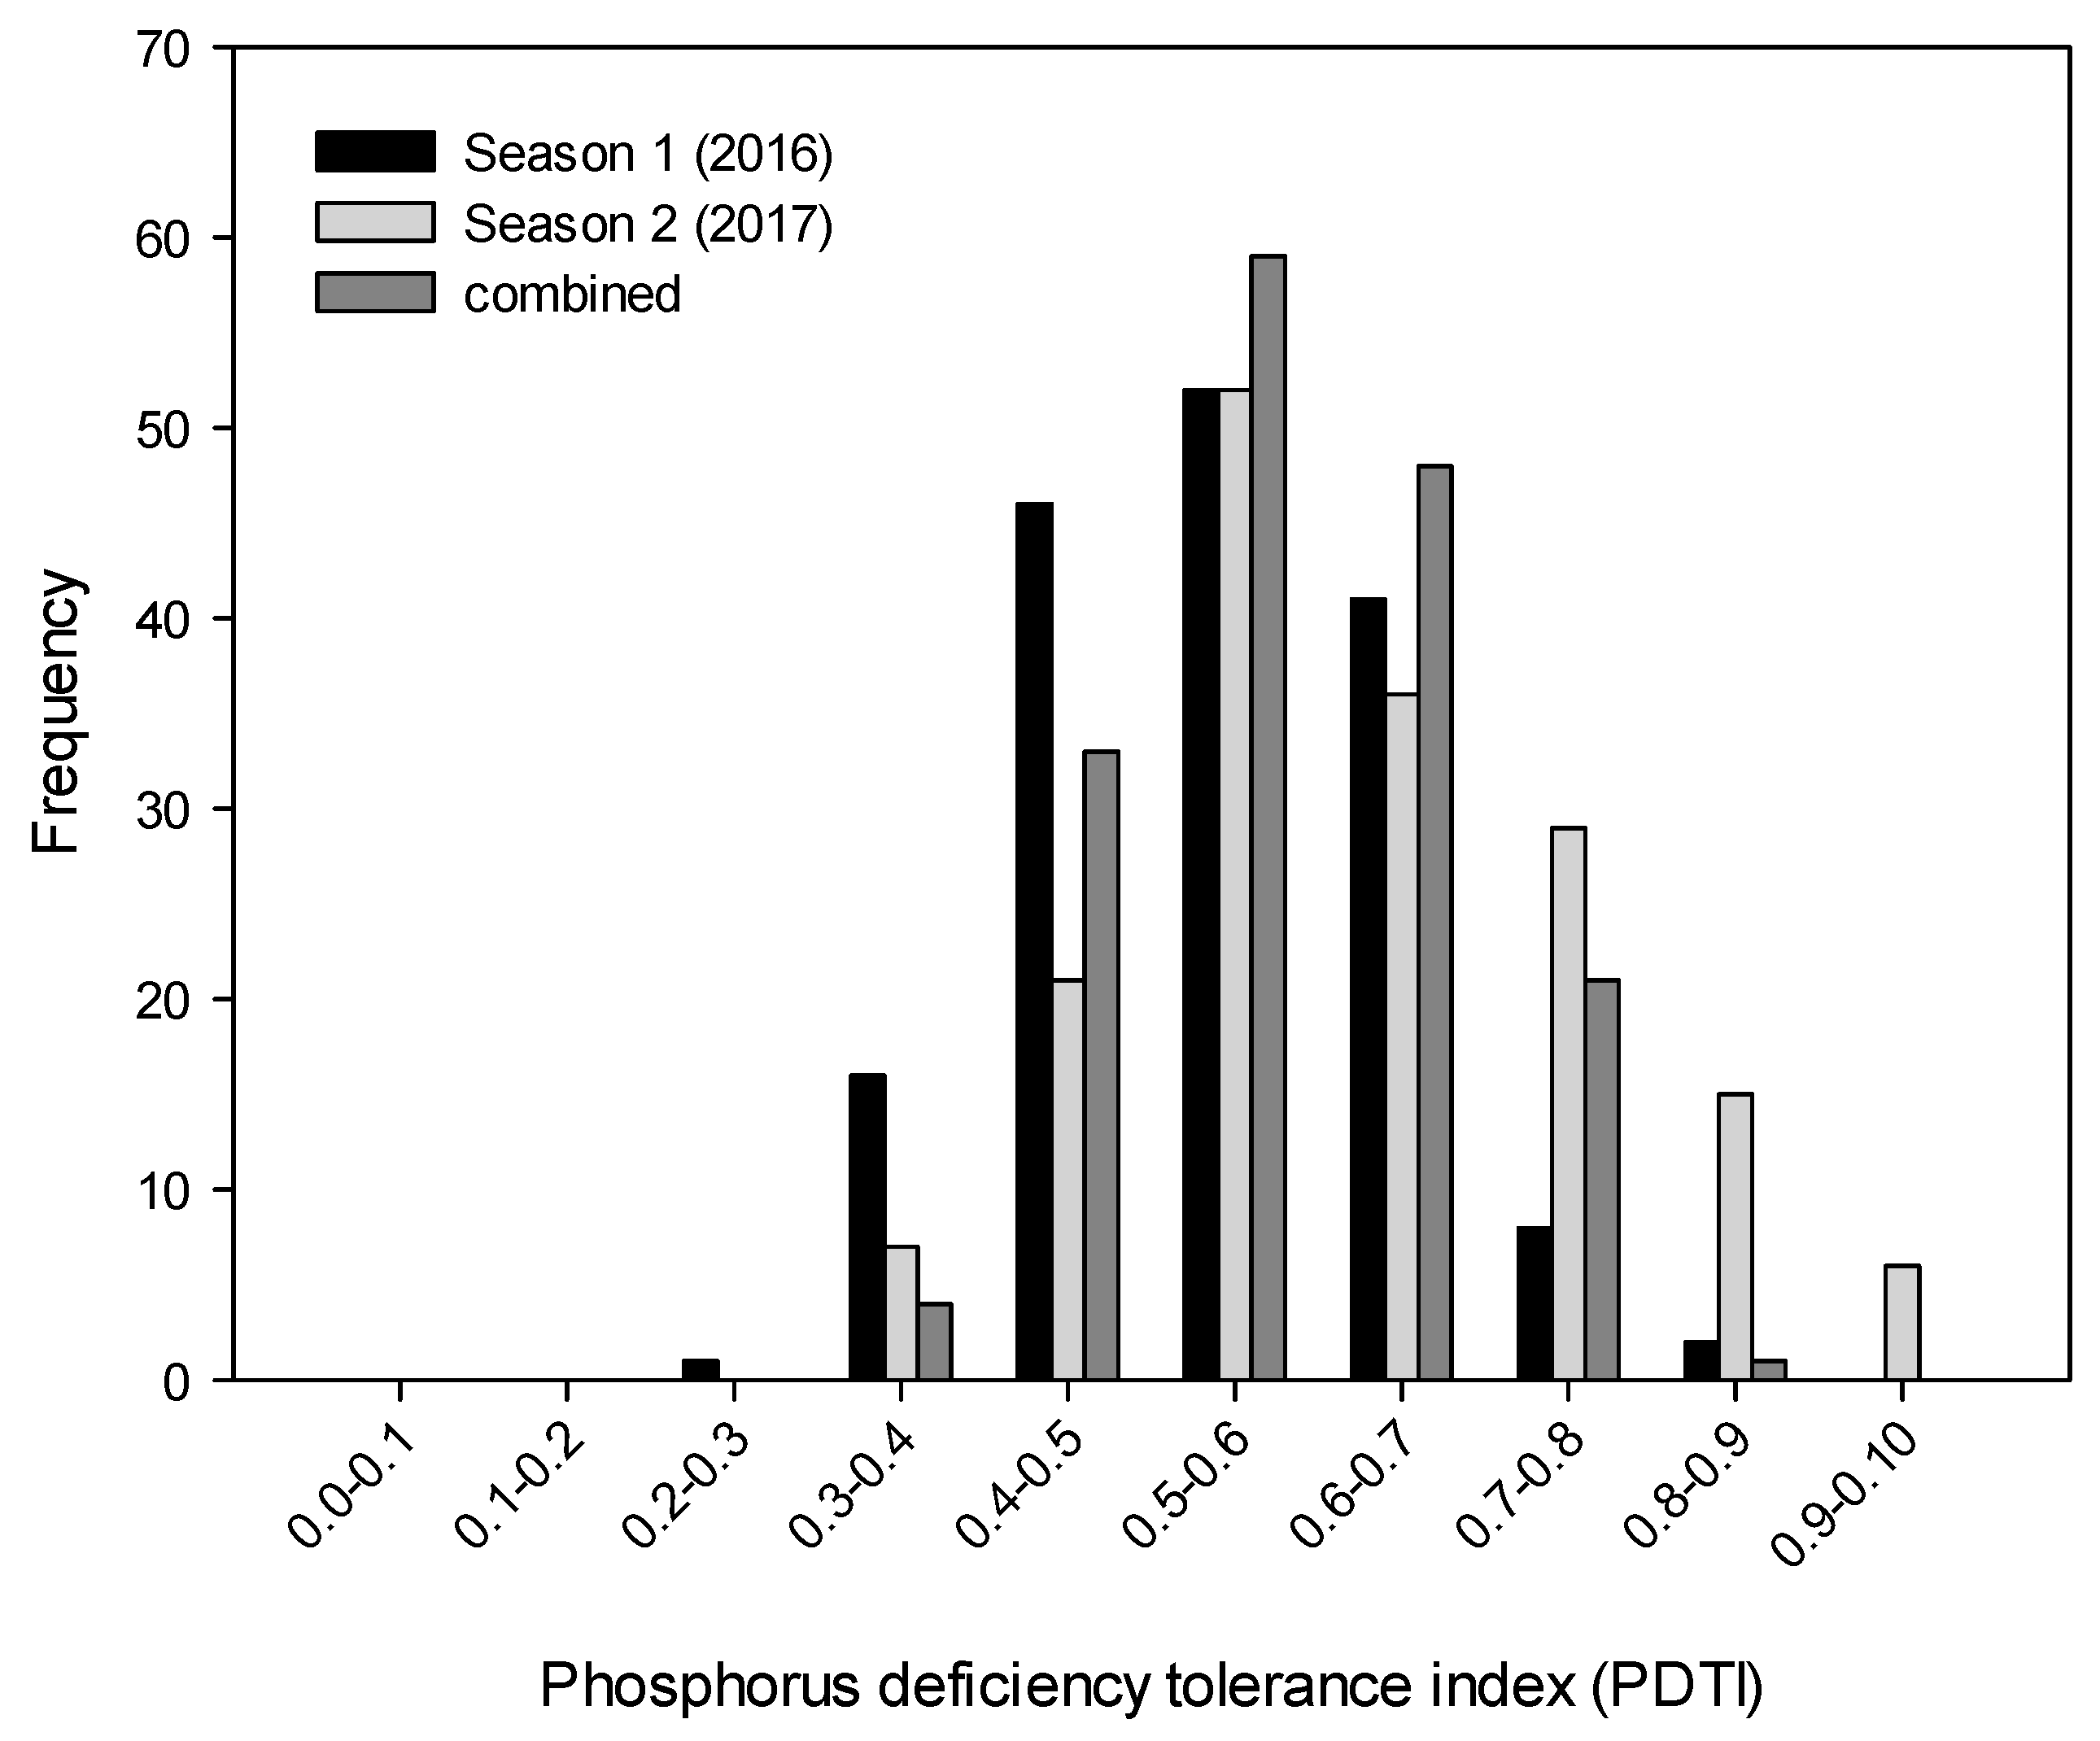
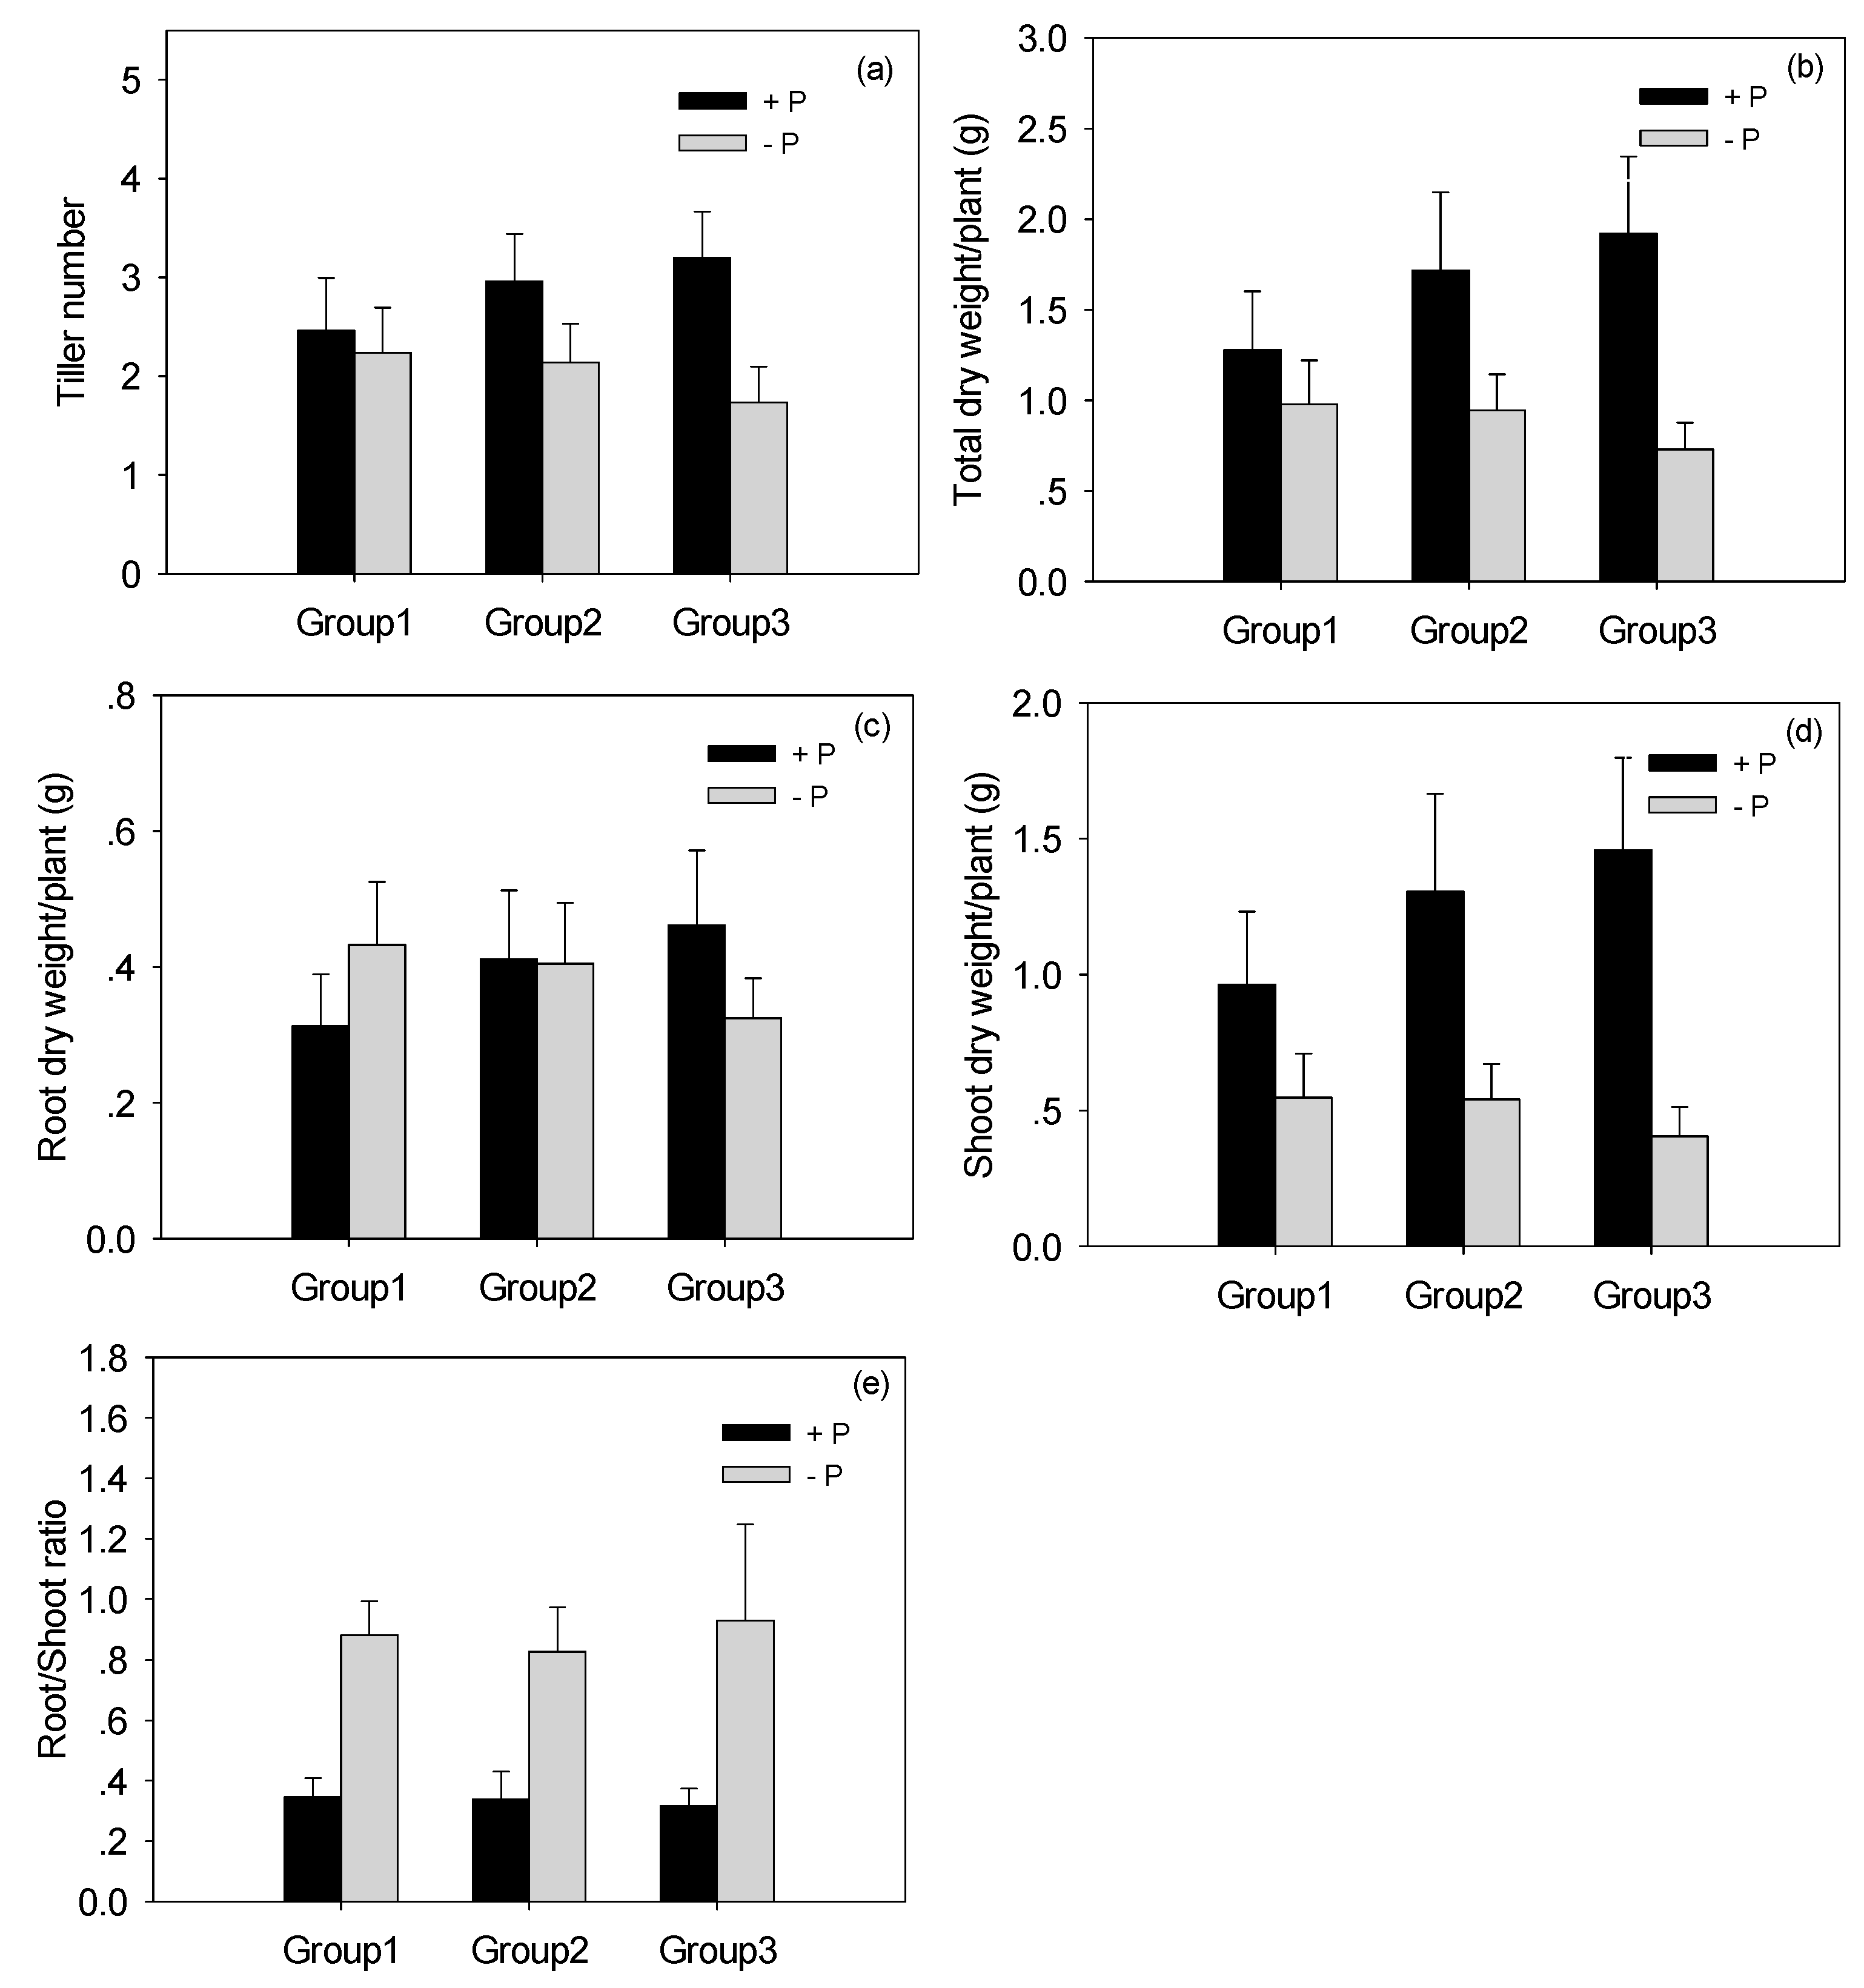
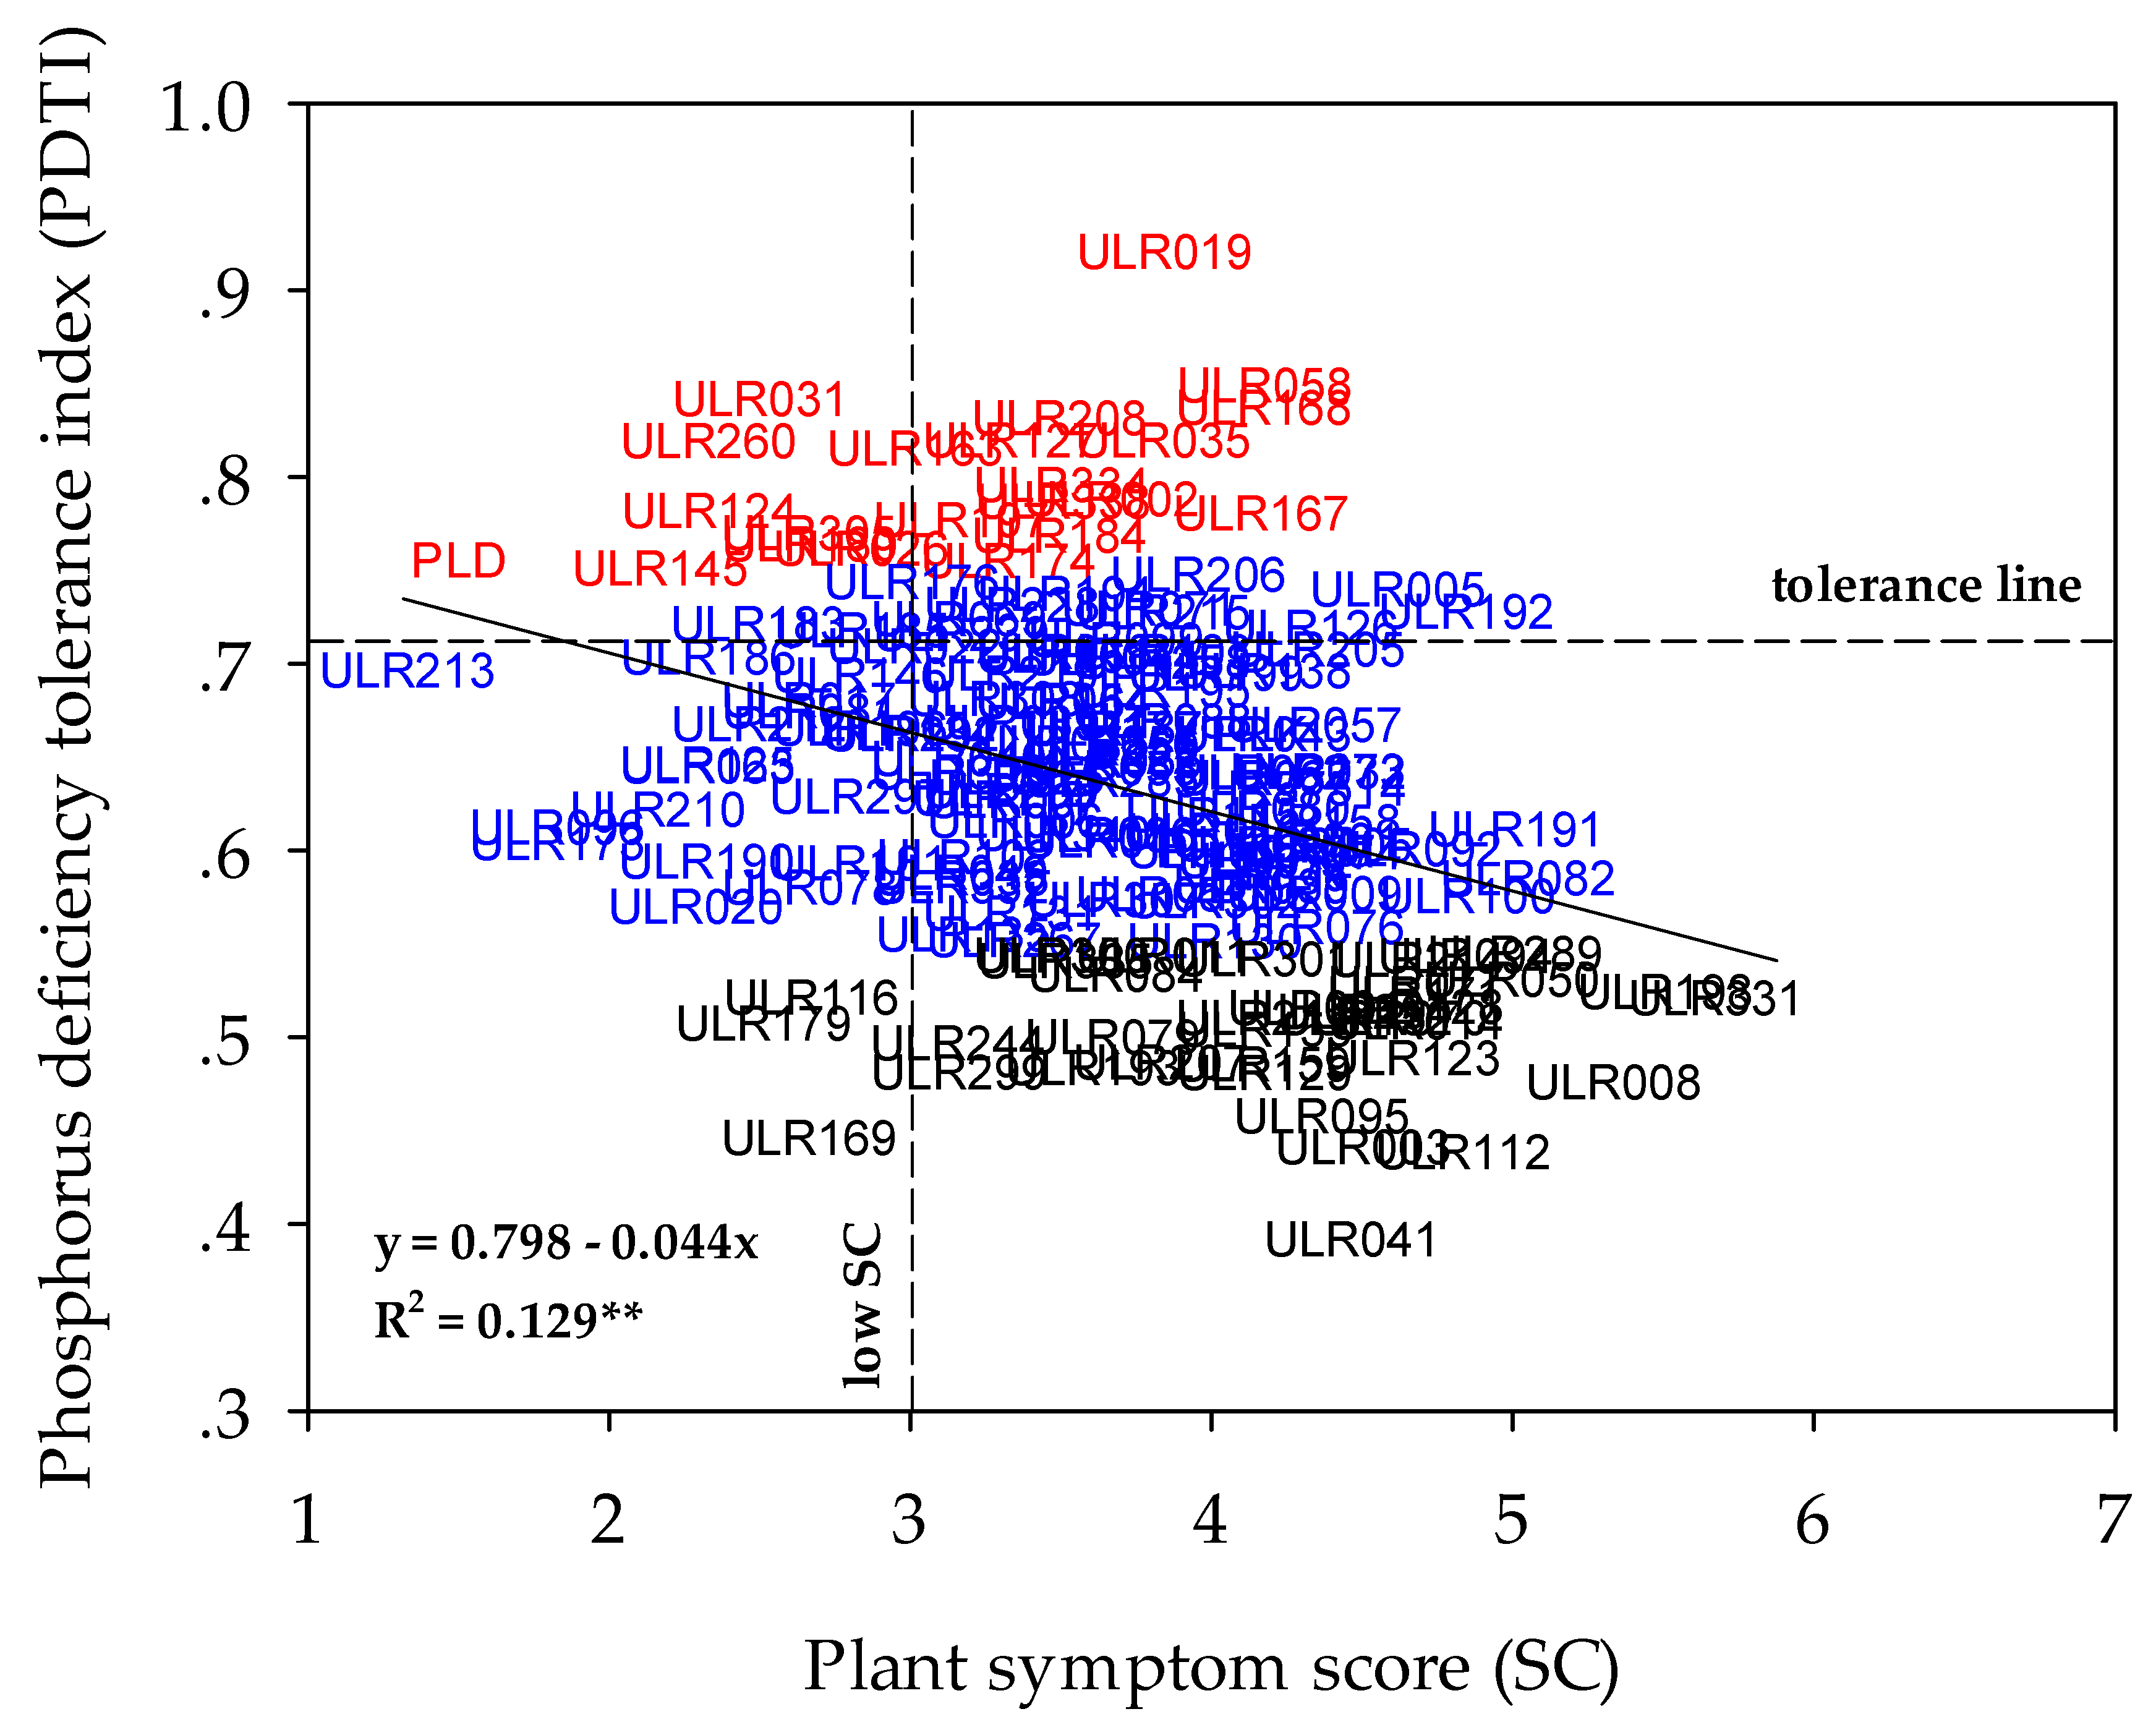
3.1. Phenotypic Response of Tolerance to Phosphorus (P) Deficiency

The phenotypic response of 168 rice genotypes under both years is shown in Table 1. In 2016 (Season 1), the genotypes showed different responses under both +P and −P conditions in terms of tiller number (TN), plant height (PH), shoot dry weight (SDW), root dry weight (RDW), and total dry weight (TDW). Root/shoot ratio (RSR) of the rice varieties was not significant under +P but different under −P conditions. The plant symptom score (SC) and dry weight reduction (DWR) under −P were highly significant (Table 1). In 2017 (Season 2), all traits were significant under both phosphorus regimes. The reduction in dry weight was 48% in Season 1 and 34% in Season 2, confirming the severity of P deficiency. The symptom scores were also higher in Season 1 than in Season 2 (Table 1). The effects of season and genotype were significant in all the observed parameters. The season × genotype interaction was significant for all characteristics, except for PH and RSR in the +P regime, and TN, RSR, and DWR in the −P regime. The SC was different depending on seasons, genotypes, and season × genotype interactions (Table 1). Variability among the genotypes was significant in all traits, especially under −P with reasonable coefficient of variation (CVs) between 7.3% and 15.9% (Table 1). Seasonal variation was the major cause of the difference in symptom severity caused by environmental factors, especially humidity, temperature, and light intensity. Although hydroponic screening was conducted in a greenhouse, the ambient conditions depended mainly on environmental factors. Total dry weight under −P in Season 1 was generally lower than in Season 2 due to higher temperatures during the testing period. The reduction in plant dry weight was greatly correlated with SC under −P conditions in rice. P deficiency was associated with growth and development of plants [25], particularly growth retardation, development of small and curly leaves, and reduction in number of tillers [26]. Shoot dry weight under the −P regime was lower than that under the +P regime, while SDW was considered the best parameter to assess P-deficient tolerance, which was directly proportional to P-efficient uptake [27].
Correlations between the observed traits under both +P and −P conditions were significant between any two traits, except for RDW and RSR, SC and RSR, and DWR and RSR under −P conditions (Table 2). Correlation coefficients under +P conditions were generally similar to those under −P conditions. Dry weight traits, such as RDW, SDW, and TDW, showed relatively high correlations under both P regimes. Under +P conditions, TN was significantly correlated with TDW, RDW, and SDW at 0.645, 0.535, and 0.634, respectively. Under −P conditions, TN was significantly correlated with TDW, RDW, and SDW at 0.606, 0.536, and 0.579, respectively (Table 2). DWR was negatively correlated with TN, TDW, SDW, and RDW under −P conditions, indicating that P deficiency caused a reduction in plant size. The accessions with high TN are more tolerant to P deficiency. This observation is in agreement with the work by Wissuwa and Ae [15], who reported that rice accessions with high TN tended to be more efficient in P uptake. Some rice genotypes were able to produce a large number of tillers even under −P conditions [27].
RDW and SDW can be used as indicators of P uptake in plants to demonstrate general P-deficient adaptation [15], and used as reliable criteria to identify tolerance in P-deficient genotypes. The accessions with low SCs usually had large root systems and SDWs. A larger root system can provide sufficient P to maintain normal shoot growth [15]. The increase in RDW under −P conditions also increased the total root surface area available for soil exploration and acquisition of nutrients [28], resulting in low SCs for the plant.
P-deficient tolerance in upland rice is interesting, because the plant is grown in soil where phosphorus is fixed in soil particles [1]. In our study, the genotypic variation in P-deficient tolerance was high (Table 1). Based on the PDTI, genotypes observed with more positive indices were more tolerant to P deficiency (Figure 1), and some accessions were highly tolerant. A few previous reports, although not entirely systematic, evaluated P-deficient tolerance in a large number of rice cultivars with diverse origins and plant types [27,29]. A large-scale screening is needed as a preliminary guideline to group the genotypes for further studies. The response of genotypes in terms of PDTI in Season 2 (2017) was higher than that in Season 1 due to the lower average temperature (28 °C). The average temperature in Season 1 (2016) was 32 °C. The availability of P decreased when the temperature reached to 30 °C [30].
Based on the combined PDTI, the genotypes in our study were divided into 3 groups: Group 1, comprising 22 accessions showing high tolerance with PDTI values greater than 0.8; Group 2, comprising 107 accessions showing moderate tolerance with PDTI values between 0.6 and 0.8; and Group 3, comprising 37 accessions showing low tolerance with PDTI values lower than 0.6. Notably, two accessions were missing. The reduction in TN was greater in Group 3 than in Groups 1 and 2, similar to the response in TDW. SDW showed more reduction than RDW in all genotypic groups. Under −P conditions, there was an increase in RDW, especially in genotypic Group 1, which was highly tolerant to P deficiency. The root/shoot ratio was higher in −P conditions than in +P conditions in all genotypic groups (Figure 2). The −P condition caused a reduction in the size of the plant shoots. The genotypes more tolerant to P deficiency showed less reduction, and were able to maintain the shoot and root growth more consistently than the susceptible ones.
PDTI was a key selection criterion in this study, indicating a trait suitable for large-scale screening at the seedling stage, rather than observing the final yield. SC was reported earlier to be an effective index for screening P-deficient tolerance in a rather diverse population. PDTI required a number of factors to calculate, so it was a more appropriate measurement. Grouping of the rice genotypes based on PDTI (Figure 2) showed that the high-tolerance group showed high TN, SDW, RDW, and TDW. Zhang et al. [31] used a low phosphorus tolerance index (LPTI) and low phosphorus performance index (LPPI) as selection criteria for maize seedlings tested under low phosphorus conditions. Many studies combined a number of traits to form an index, such as a phosphorus efficiency index [32], LPTI, and LPPI [31]. In our study, the correlation between PDTI and SC was rather low (Figure 3). However, rice accessions with a very high PDTI and a very low SC can be used to preliminarily group the genotypes for further studies.
Therefore, in this study, 11 upland rice accessions (ULR026, ULR031, ULR124, ULR145, ULR180, ULR183, ULR185, ULR186, ULR213, ULR260, and ULR305), together with one lowland rice cultivar (PLD) showing a high PDTI and a low SC (<3) (Figure 3, Table 3), were selected.

3.2. Validating the Tolerance of Accessions by Pup1-Linked Markers

Nine Pup1-linked markers were validated on all 168 rice accessions. When the PCR product for one of the nine linked markers was present (“1” in Table 3) in an accession, it was possible that this accession possessed the tolerant allele at Pup1 [17]. Although amplified bands ranging from 0 to 9 markers were observed, the relationship between the markers and the tolerance was rather low (data not shown). K1 and K29-1 were the most efficient markers for distinguishing between the tolerance and susceptible lines. The Pup1 gene family was reported as candidate genes encoding for a putative fatty acid oxygenase, aspartic proteinase, and a putative protein kinase [33]. Several reports showed that the Pup1 gene family was highly conserved in stress-adapted rice accessions [18,19]. In our study, the Pup1-linked markers were not associated with the degree of tolerance of these accessions. Genotyping of the top 12 tolerance genotypes by Pup1-linked markers against the SC and PDTI is shown in Table 3. Some indigenous upland rice lines, such as UlR183 and ULR213, showed high tolerance abilities without Pup1-linked gene products (Table 3). These varieties are suitable for future studies, as they may carry unknown P-deficient tolerance genes.

4. Conclusions

Large-scale screening at the seedling stage is useful, although environmental factors can cause variation in the expression of the genotypes. The P deficiency tolerance index (PDTI) can be used together with the plant symptom score (SC) as selection criteria to identify a number of tolerance accessions. The genotypes with high TN, SDW, RDW, and TDW were more tolerant than those with low dry weight. Eleven upland genotypes (ULR026, ULR031, ULR124, ULR145, ULR180, ULR183, ULR185, ULR186, ULR213, ULR260, and ULR305), together with the indigenous lowland rice variety PLD, were identified as tolerant to P deficiency. The tolerant genotypes in this study were not associated with the allele at Pup1. It is worth identifying new allele(s) for P-deficient tolerance in these genotypes in the future.

Author Contributions

Data curation, S.C., W.P., and T.M.; Formal analysis, S.C. and T.M.; Funding acquisition, S.C.; Methodology, S.C., W.P., T.M., and J.S.; Resources, S.C., T.M., and J.S.; Software, T.M.; Supervision, J.S. and P.S.; Validation, S.C., T.M.; Writing—Original draft, S.C. and T.M.; Writing—Review and editing, W.K., J.S., and P.S.

Funding

This research received no external funding.

Acknowledgments

This research is financially supported by the Thailand Research Fund (TRF) (Project code: TRG5880019) and Khon Kaen University to S.C. as a New research Scholar. Our gratitude is also extended to the Plant Breeding Research Center for Sustainable Agriculture, and Research Center of Agricultural Biotechnology for Sustainable Economy, Khon Kaen University.

Conflicts of Interest

The authors declare no conflict of interest.

References

  1. Shimizu, A.; Kato, K.; Komatsu, A.; Motomura, K.; Ikehashi, H. Genetic analysis of root elongation induced by phosphorus deficiency in rice (Oryza sativa L.): Fine QTL mapping and multivariate analysis of related traits. Theor. Appl. Genet. 2008, 117, 987–996. [Google Scholar] [CrossRef]
  2. Kirk, G.J.D.; George, T.; Courtois, B.; Senadhira, D. Opportunities to improve phosphorus efficiency and soil fertility in rainfed lowland and upland rice ecosystems. Field Crops Res. 1998, 56, 73–92. [Google Scholar] [CrossRef]
  3. Pinheiro, B.S.; Castro, E.; Guimarães, C.M. Sustainability and profitability of aerobic rice production in Brazil. Field Crops Res. 2006, 97, 34–42. [Google Scholar] [CrossRef]
  4. Yugi, R.A.; Hidayat, P.; Susanto, U. Drought tolerance, phosphorus efficiency and yield characters of upland rice lines. Emir. J. Food Agric. 2014, 26, 25–34. [Google Scholar]
  5. Ozturk, L.; Eker, S.; Torun, B.; Cakmak, I. Variation in phosphorus among 73 bread and durum wheat genotypes grown in phosphorus deficient calcareous soil. Plant Soil 2005, 269, 69–80. [Google Scholar] [CrossRef]
  6. Shimizu, A.; Yanagihara, S.; Kawasaki, S.; Ikehashi, H. Phosphorus deficiency-induced root elongation and its QTL in rice (Oryza sativa L.). Theor. Appl. Genet. 2004, 109, 1361–1368. [Google Scholar] [CrossRef] [PubMed]
  7. Raghothama, K.G.; Karthikeyan, A.S. Phosphate acquisition. Plant Soil 2005, 274, 37–49. [Google Scholar] [CrossRef]
  8. Koyama, T.; Chammek, C.; Snitwonge, P. Varietal differences of Thai rice in the resistance to phosphorus deficiency. Tech. Bull. Trop. Agric. Res. Cent. 1973, 4, 32. [Google Scholar]
  9. IRRI. IRRI Annual Report for 1984; International Rice Research Institute: Manila, Philippines, 1985. [Google Scholar]
  10. Hung, H.H. Studies on Tillering Ability of Rice Under Phosphorus Stress. Ph.D. Thesis, Texas A and M University, College Station, TX, USA, 1985. [Google Scholar]
  11. Fageria, N.K.; Morais, O.P.; Baligar, V.C.; Wright, R.J. Response of rice cultivars to phosphorus supply on an oxisol. Fertil. Res. 1988, 16, 195–206. [Google Scholar] [CrossRef]
  12. Chaubey, C.N.; Senadhira, D.; Gregorio, G.B. Genetic analysis of tolerance for phosphorus deficiency in rice (Oryza sativa L.). Theor. Appl. Genet. 1994, 89, 313–317. [Google Scholar] [CrossRef] [PubMed]
  13. Majumder, N.D.; Borthakur, D.N.; Rakshit, S.C. Heterosis in rice under phosphorus stress. Indian J. Genet. 1989, 49, 231–235. [Google Scholar]
  14. Wissuwa, M.; Yano, M.; Ae, N. Mapping of QTLs for phosphorus-deficiency tolerance in rice (Oryza sativa L.). Theor. Appl. Genet. 1998, 97, 777–783. [Google Scholar] [CrossRef]
  15. Wissuwa, M.; Ae, N. Genotypic variation for tolerance to phosphorus deficiency in rice and the potential for its exploitation in rice improvement. Plant Breed. 2001, 120, 43–48. [Google Scholar] [CrossRef]
  16. Wissuwa, M.; Wegner, J.; Ae, N.; Yano, M. Substitution mapping of Pup1: A major QTL increasing phosphorus uptake of rice from a phosphorus-deficient soil. Theor. Appl. Genet. 2002, 105, 890–897. [Google Scholar] [CrossRef] [PubMed]
  17. Sarkar, S.; Yelne, R.; Chatterjee, M.; Das, P.; Debnath, S.; Chakraborty, A.; Mandal, N.; Bhattacharya, K.; Bhattacharyya, S. Screening for phosphorus (P) tolerance and validation of Pup-1 linked markers in indica rice. Indian J. Genet. 2011, 71, 209–213. [Google Scholar]
  18. Chin, J.H.; Gamuyao, R.; Dalid, C.; Bustamam, M.; Prasetiyono, J.; Moeljopawiro, S.; Wissuwa, M.; Heuer, S. Developing rice with high yield under phosphorus deficiency: Pup1sequence to application. Plant Physiol. 2011, 156, 1202–1216. [Google Scholar] [CrossRef] [PubMed]
  19. Chin, J.H.; Lu, X.; Haefele, S.M.; Gamuyao, R.; Ismail, A.; Wissuwa, M.; Heuer, S. Development and application of gene-based markers for the major rice QTL phosphorus uptake 1. Theor. Appl. Genet. 2010, 120, 1073–1086. [Google Scholar] [CrossRef] [PubMed]
  20. Yoshida, S.; Forno, D.A.; Cock, J.H.; Gomez, K.A. Laboratory Manual for Physiological Studies of Rice, 3rd ed.; IRRI: Manila, Philippines, 1976. [Google Scholar]
  21. IRRI. Standard Evaluation System for Rice (SES); International Rice Research Institute: Manila, Philippines, 2002. [Google Scholar]
  22. Lodhi, M.A.; Ye, G.N.; Weeden, N.F.; Reisch, B.I. A simple and efficient method for DNA extraction from grapevine cultivars and Vitis species. Plant Mol. Biol. Rep. 1994, 12, 6–13. [Google Scholar] [CrossRef]
  23. Gamuyao, R.J.; Chin, H.; Tanaka, J.P.; Pesaresi, P.; Catausan, S.; Dalid, C.; Loedin, I.S.; Mendoza, E.M.T.; Wissuwa, M.; Heuer, S. The protein kinase Pstol1 from traditional rice confers tolerance of phosphorus deficiency. Nature 2012, 488, 535–540. [Google Scholar] [CrossRef]
  24. R Development Core Team. R: A Language and Environment for Statistical Computing; R Foundation for Statistical Computing: Vienna, Austria, 2008. [Google Scholar]
  25. Marschner, H. Marschner’s Mineral Nutrition of Higher Plants; Academic Press: New York, NY, USA, 2012; pp. 158–165. [Google Scholar]
  26. Dobermann, A.; Fairhurst, T. Rice: Nutrient Disorders and Nutrient Management; Oxford Graphic Printers: Manila, Philippines, 2000; p. 203. [Google Scholar]
  27. Aluwihare, Y.C.; Ishan, M.; Chamikara, M.D.M.; Weebadde, C.K.; Sirisena, D.N.; Samarasinghe, W.L.G.; Sooriyapathirana, S.D.S.S. Characterization and selection of phosphorus deficiency tolerant rice genotypes in Sri Lanka. Rice Sci. 2016, 23, 184–195. [Google Scholar] [CrossRef]
  28. Raghothama, K.G. Phosphate acquisition. Ann. Rev. Plant Physiol. Plant Mol. Biol. 1999, 50, 665–693. [Google Scholar] [CrossRef] [PubMed]
  29. Saito, K.; Linquist, B.; Atlin, G.N.; Phanthaboon, K.; Shiraiwa, T.; Horie, T. Response of traditional and improved upland rice cultivars to N and P fertilizer in northern Laos. Field Crops Res. 2006, 96, 216–223. [Google Scholar] [CrossRef]
  30. Ercoli, L.; Mariotti, M.; Masoni, A.; Massantini, F. Effect of temperature and phosphorus fertilization on phosphorus and nitrogen uptake by sorghum. Crop Sci. 1996, 2, 348–354. [Google Scholar] [CrossRef]
  31. Zhang, H.; Xu, R.; Xie, C.; Huang, C.; Liao, H.; Xu, Y.; Wang, J.; Li, W. Large-scale evaluation of maize germplasm for low-phosphorus tolerance. PLoS ONE 2015, 10, e0124212. [Google Scholar] [CrossRef] [PubMed]
  32. Koide, R.T.; Dickie, I.A.; Goff, M.D. Phosphorus deficiency, plant growth and the phosphorus efficiency index. Funct. Ecol. 1999, 13, 733–736. [Google Scholar]
  33. Heuer, S.; Lu, X.; Chin, J.H.; Tanaka, J.P.; Kanamori, H.; Matsumoto, T.; De Leon, T.; Ulat, V.J.; Ismail, A.M.; Yano, M.; et al. Comparative sequence analyses of the major quantitative trait locus phosphorus uptake 1 (Pup1) reveal a complex genetic structure. Plant Biotechnol. J. 2009, 7, 456–457. [Google Scholar] [CrossRef] [PubMed]
Figure 1. Frequency distribution of the phosphorus deficiency tolerance index (PDTI) of 168 Thai indigenous upland rice cultivars in Season 1, Season 2, and in combination.
Agronomy 09 00081 g001
Figure 2. Mean and standard deviation of five traits related to Phosphorus deficiency tolerance index (PDTI) in three genotypic groups under +P and −P. Groups 1, 2, and 3 represent high, moderate, and low tolerances under phosphorus deficiency. Number of rice accessions in Groups 1, 2, and 3 are 22, 107, and 37, respectively. (a) the tiller number under +P and −P of three genotypes groups, (b) total dry weight per plant of three genotypes group under +P and −P, (c) the root dry weight per plant of three genotypes groups under +P and −P, (d) the shoot dry weight of each genotypes group under +P and −P and (e) is the root/shoot ratio of each genotypes groups under +P and −P.
Agronomy 09 00081 g002
Figure 3. The relationship between plant symptom score (SC) and phosphorus deficiency tolerance index (PDTI) of 168 indigenous upland rice genotypes; red = Group 1, blue = Group 2, and black = Group 3.
Agronomy 09 00081 g003
Table 1. The means of observed traits under sufficient phosphorus (+P) and deficient phosphorus (−P) conditions, as compared by analysis of variance in each season and in combination.
Traits 1Season 1 (2016)Season 2 (2017)Combined 2
+PCV (%)−PCV (%)+PCV (%)−PCV (%)+PCV (%)−PCV (%)
SGS × GSGS × G
Tiller number3.13 **23.52.28 **25.22.75 **31.01.83 **17.9*****4.9****ns9.1
Plant height84.08 **9.543.57 **8.964.71 **23.744.91 **17.9****ns18.5****13.7
SDW1.35 **46.00.45 **28.31.24 **39.70.57 **44.0******10.3******9.1
RDW0.51 **34.60.41 **25.70.31 **51.10.37 **36.7******9.6******7.3
TDW1.86 **39.00.85 **23.21.55 **39.20.94 **36.7******9.3******7.4
RSR0.40 ns47.10.97 **30.00.27 *61.90.75 *56.3***ns12.5****ns9.8
SCNANA4.04 **28.2NANA3.28 *32.9NANANANA******7.3
DWR (%)NANA47.74 **41.8NANA34.14 *97.1NANANANA****ns15.9
1 SDW = shoot dry weight, RDW = root dry weight, TDW = total dry weight, RSR = root/shoot ratio, SC = plant symptom score, DWR = dry weight reduction (%). 2 S = season, G = genotypes, S × G = season × genotype interaction. CV = coefficient of variation. NA = data not available; ns = non-significant at p ≤ 0.05; *, ** = significant at p ≤ 0.05 and p ≤ 0.01, respectively.
Table 2. Correlations between traits related to phosphorus (P) deficiency under +P and −P conditions using combined data from seasons 1 and 2.
+P
Trait 1TNTDWRDWSDW
+PTDW0.645 **
RDW0.535 **0.819 **
SDW0.634 **0.986 **0.712 **
RSR−0.256 **−0.235 **0.162 *−0.336 **
−P
TNTDWRDWSDWRSRSC
−PTDW0.606 **
RDW0.536 **0.881 **
SDW0.579 **0.952 **0.695 **
RSR−0.224 **−0.307 **0.056−0.499 **
SC−0.293 **−0.291 **−0.356 **−0.216 **−0.098
DWR−0.225 **−0.334 **−0.371 **−0.274 **0.0720.361 **
1 TN = tiller number, SDW = shoot dry weight, RDW = root dry weight, TDW = total dry weight, RSR = root/shoot ratio, SC = plant symptom score, DWR = dry weight reduction (%). *, ** = significant at p ≤ 0.05 and p ≤ 0.01, respectively.
Table 3. Genotyping of the top 12 rice genotypes tolerant to P deficiency by Pup1-linked markers against plant symptom (SC) and Phosphorus deficiency tolerance index (PDTI) scores.
Acc.Pup1-K42 1Pup1-K43Pup1-K46Pup1-K52Pup1-K41PSTol-2K1K5K29-2Total Pup1 Linked Marker BandsSC 2PDTI 3
PLD10011101161.500.76
ULR02600010000122.840.76
ULR03100000001012.500.84
ULR12410001110152.330.78
ULR14510011110162.170.75
ULR18000000010012.670.76
ULR183 400000000002.490.72
ULR18500000010122.840.72
ULR18600000111032.330.70
ULR213 400000000001.330.70
ULR26010001101152.330.82
ULR30500000000112.660.77
1 The expected polymerase chain reaction (PCR) product of Pup1-linked markers, present (1) absent (0); 2 plant symptom score; 3 phosphorus deficiency tolerance index; and 4 rice accessions tolerant without expected PCR product.

