Article

Biochar Amendment Affects Soil Water and CO2 Regime during Capsicum Annuum Plant Growth

1
Institute of Soil Sciences and Agricultural Chemistry, Centre for Agricultural Research, Hungarian Academy of Sciences, Herman O. St. 15, 1022 Budapest, Hungary
2
Norwegian Institute of Bioeconomy Research, Frederik A. Dahls vei 20, 1430 Ås, Norway
*
Author to whom correspondence should be addressed.
Agronomy 2019, 9(2), 58; https://doi.org/10.3390/agronomy9020058
Submission received: 20 December 2018 / Revised: 24 January 2019 / Accepted: 25 January 2019 / Published: 28 January 2019

Abstract

:
Recent studies on using soil enhancer material, such as biochar, provide varying results from a soil hydrological and chemical perspective. Therefore, research focusing on soil-biochar-plant interactions is still necessary to enhance our knowledge on complex effects of biochar on soil characteristics. The present study investigated the changes in soil water content (SWC) and soil respiration (belowground CO2 production) over time during the growth of Capsicum annuum (pepper) in pot experiments. Concurrently, we investigated the influence of grain husk biochar with the amount of 0, 0.5%, 2.5%, and 5.0% (by weight) added to silt loam soil. Pepper plants were grown under natural environmental conditions to better represent field conditions, and additional irrigation was applied. SWC among treatments showed minor changes to precipitation during the beginning of the study while plants were in the growing phase. The highest water holding throughout the experiment was observed in the case of BC5.0. CO2 production increased in biochar amended soils during the first few days of the experiments; while the overall cumulative CO2 production was the highest in control and the lowest in BC2.5 treatments. We used the HYDRUS 1D soil hydrological model to simulate changes in SWC, using the control treatment without biochar as a reference data source for model calibration. The simulated SWC dynamics fitted well the measured ones in all treatments. Therefore, the HYDRUS 1D can be an exceptionally valuable tool to predict the hydrological response of different amount of biochar addition to silt loam soil including plant growth.

1. Introduction

In rainfed agricultural lands the available soil water for plants to grow and produce yield is a crucial factor. The current climatic trend predicts drier and hotter growing seasons in temperate regions for the future [1], where soil moisture content becomes a crucial limiting factor of crop production [2]. This emphasizes the need for more research to enhance our knowledge in mitigating the negative effects of changes in environmental conditions and to help decision making processes in the field of agriculture.
Use of soil enhancer materials such as biochar in current agricultural management is gaining popularity especially in areas where biochar addition to degraded soils can improve soil characteristics and consequently result in higher crop or fruit yields. Charcoal and biochar amendments to soils can lead to different ranges of hydrological [3,4] and soil microbial responses [5,6,7]. Many studies focused on improving properties of sandy soils by biochar addition [8,9], as their water holding capacities are relatively poor. Sandy soils can strictly determine the types of plants that can be cultivated on, especially in semi-arid to arid environments. However, biochar addition might enhance water holding capacities in more porous soils as well, e.g., silt loam [10,11], which in changing environmental conditions, such as areas prone to increased drought periods might be exceptionally beneficial. Biochar addition to sandy soils can impact hydrological processes directly through increasing water retention, while biochar addition to clay or silt soils can reduce water infiltration as a result of improved plant biomass and evaporative surfaces [12]. As biochars are made using different techniques (e.g., various pyrolysis temperatures) and from different raw materials their effects on soil quality might have less positive or even negative outcomes on plant response. Yao et al. [13] studied the effects of 13 different types of biochars on soil nutrients, and found that many of the biochar types were able to remove nitrate and phosphate (8 or 9 out of 13, respectively) from aqueous solution, only a few removed ammonium. Mukherjee and Zimmerman [14] also observed varying results on how different types of biochars can regulate nutrient availability for plants, via their adsorption and retention potentials.
Mathematical models are great tools to better estimate potential outcomes of hypothetical conditions and scenarios based on measured data. Modeling soil water content in unsaturated subsurface can help better understand water flow in a given soil, which can further help decision making processes, particularly in agricultural settings. Soil amendments to enhance water holding capacities of a given soil, often in the case of sandy soils, have been investigated in the last decades by several studies [11,15,16]. Some studies also included mathematical modeling of the effects of these soil amendments, including biochar [17,18]. However, most cases involved laboratory experiments, or bare soils without investigating the further impacts of plant growth on biochar amended soils. In the present study we used a pot experiment to gather many necessary input information (e.g., plant heights, root density, soil hydrologic parameters such as saturated hydraulic conductivity). These are crucial factors to better simulate and understand the effects of biochar on soil hydrological properties. Literature on biochar effects on soil water movement through unsaturated soil is still limited, especially including plant growth, therefore the present study can greatly help to enhance our current knowledge on the subject. Although biochar application can influence nutrient availability as mentioned before, it also can affect soil pH, bulk density, soil organic carbon content [19], or electrical conductivity [20]. However, in this paper we put focus on soil physical processes with emphasis on soil water regime and CO2 production.
The continuing increase in atmospheric concentration of greenhouse gases, especially carbon dioxide (CO2), nitrous oxide (N2O), and methane (CH4) can result in unforeseeable long-term effects on ecosystems as a feedback with climate change [21,22,23,24]. Terrestrial ecosystems currently act as a net sink of anthropogenic carbon emission, the soil itself storing 290 times larger amount of carbon than the 2009 global anthropogenic emissions [25]. Hence it is crucial to maintain or possibly increase this role of terrestrial ecosystems. CO2 production in soils can be mainly attributed to roots and soil microbial communities releasing approximately 50–77 × 1015 gC/yr to the atmosphere in the process of soil respiration, globally [26,27]. Biochar application has been of interest as a potential mitigation strategy of greenhouse gas emission, and a potential enhancer of long-term carbon storage in agricultural soils [15,28]. It can greatly influence soil physical characteristics, still, these changes alone do not necessarily contribute directly to alterations in soil respiration values [29]. It has been reported that biochar amendment to soils can increase overall biochar related soil CO2 production [30], and also non-biochar related soil respiration as a result of higher biomass production [31]. Biochar addition can suppress microbial activities initially, which can lead to decrease in greenhouse gas emissions, including CO2 production [32]. Biochar addition and biochar types (both the technique and the original substance the biochar was made of) can alter the composition of the native microbial community, thus altering plant-microbe interactions, plant growth and vitality [33], or soil respiration [15,34,35].
In general, the impacts of these soil enhancer materials on soil physical, chemical, and biological properties under diverse environmental conditions need further investigations to minimize any unforeseen negative effects to occur, and also to determine the most economic amount of the enhancer that a specific soil should receive. Therefore, the aim of the present study was to investigate changes in i) soil water content and ii) soil CO2 emissions at different plant growing and maturing stages as influenced by nutrient enrichment and commercially available paper fiber sludge and grain husk based biochar addition at differing concentrations. We tested our understanding of the underlying processes using mathematical modeling to estimate biochar effects on soil water content (SWC). Our study provides new insight into biochar effects on soil hydrological and biological parameters in soil matrices, especially during different plant growth and maturing phases, which has been currently less studied.

2. Materials and Methods

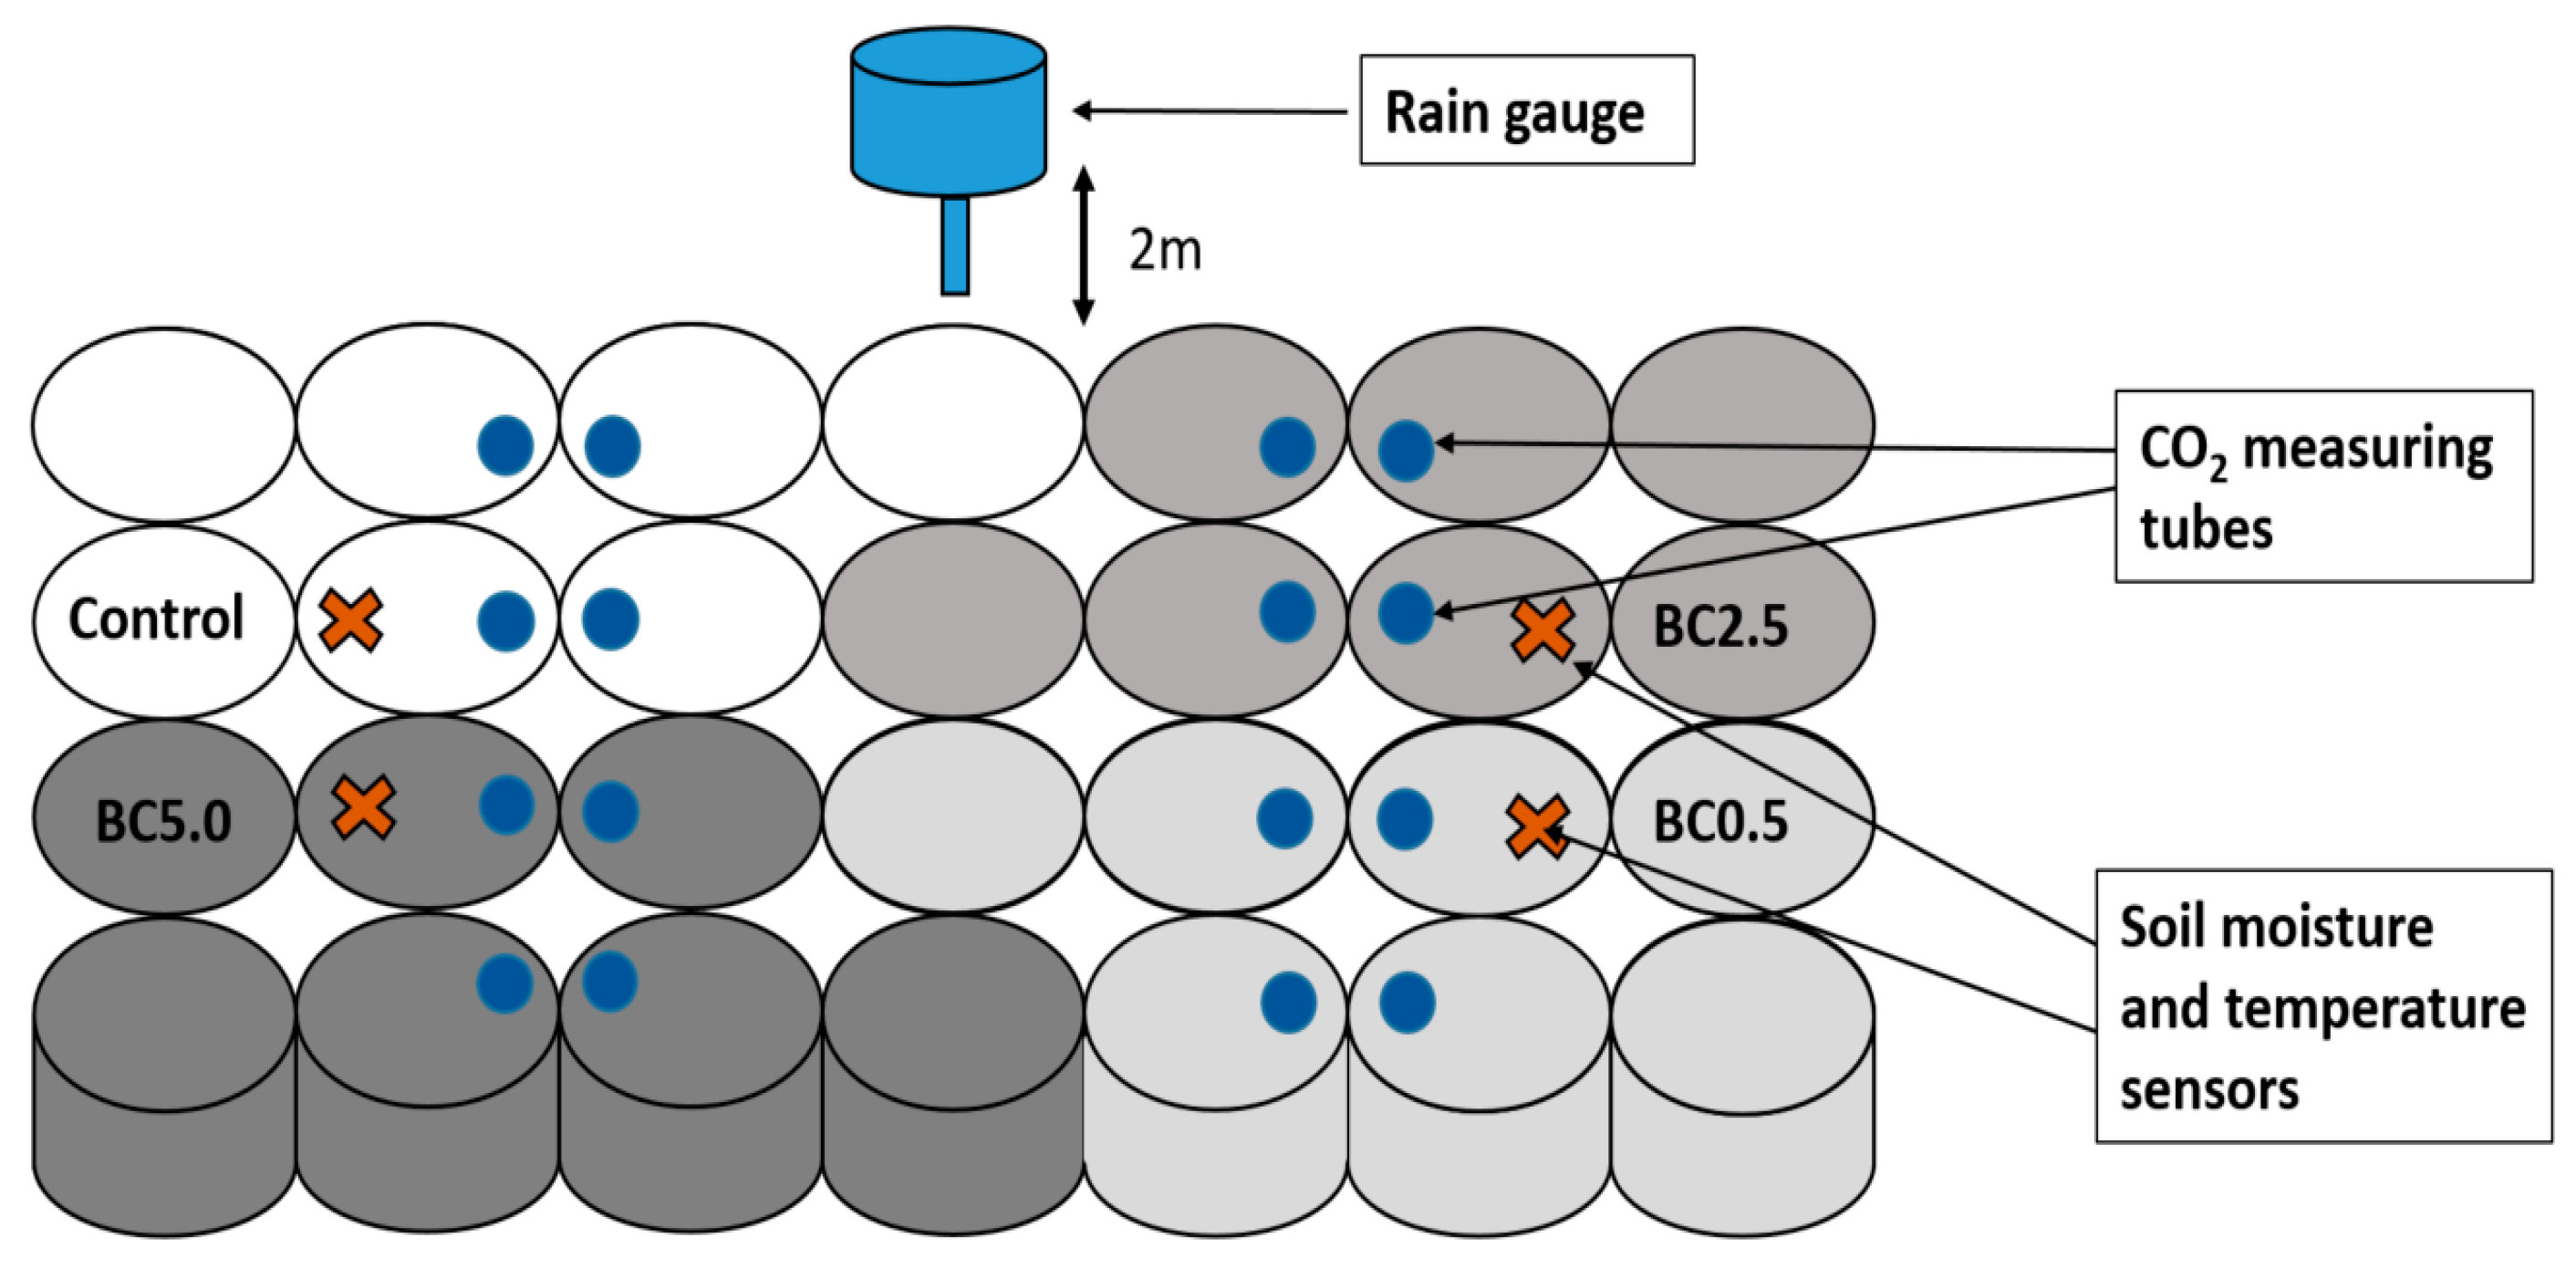
2.1. Soil Collection Site Information and Experimental Setup

Soil samples were collected from a silt loam (ca. Alfisol), freshly tilled arable soil at an area of a known long-term (>10 years) agricultural use (46.92936 °N, 17.67033 °E, temperate climate zone). The average amount of annual daylight in the study area is 1870–2000 daylight hours; the annual average air temperature is 9.5–9.7 °C, during the vegetation period the average air temperature is 16.5 °C. The average annual precipitation is around 600 mm, out of which 340–360 mm fall during the vegetation. The average daily wind speed is below 3 m/s most of the year [36]. The soil samples were taken from the upper 28 cm on June 5, 2016, and homogenized thoroughly prior to the experiment. Specific soil chemical and physical characteristics were analyzed using standard wet chemical techniques (Section 2.3). The schematics of the experimental setup is shown in Figure 1.
Plants (Capsicum annuum, pepper) were grown from seeds (sowed late February) prior to the experiment. Pepper plants subsequently were placed into pots (sized: 14 cm height and 18 cm in diameter) after reaching the two to four leaf stage to minimize plant growth differences prior to receiving the different treatments. Plant growth stages were determined based on weekly observation of plant tillers and leave numbers, and also quantifying the flowers and fruits under different stages of developments per plant as shown in Figure 2. Pepper plant was chosen for the study as it is a very common vegetable to grow in the continental European climatic region. Plants were watered frequently as required by the absence of precipitation, as shown in Figure 3 (irrigation is represented by light blue bars).
Fertilizer (N:P:K of 20:20:20 in a concentration equal to 400 mg N/kg soil, manufacturer Elixir Zorka, Šabac, Serbia) was added to the soil at Week 3 (30 June 2016) of the experiment to eliminate nutrient deficiency as a limiting factor for plant growth. The nitrogen addition amount was based on information found in literature [37,38].

2.2. Biochar Used in the Experiment

Commercially available biochar was purchased for the experiment, which has a European Biochar Certificate (EBC), indicating similar physical and chemical characteristics for different batches; however biochar from a single batch was used in the present study. According to the manufacturer (SonnenErde GmbH, Riedlingsdorf, Austria), the biochar was made of paper fiber sludge and grain husks from spelt (1:1 w/w) by Pyreg-reactor technology at 600 °C using slow pyrolysis technique with a residence time of 20 minutes [39]. The chemical properties of the biochar used in the experiment are presented in Table 1. Other measured properties not presented in the table include total nitrogen (Ntot) = 11,100 mg/kg and NH4+-N = 1.9 ± 0.1 mg/kg [40]. The total metal content of the biochar is given in the supplementary information Table S1.
Three treatments plus the control were investigated in 7 replicates each with two plants per pot, at the start of the experiment. The experiment setup included one control (0%), and three biochar amended treatments receiving 0.5%, 2.5%, and 5.0% biochar (by weight; further referred to as C, BC0.5, BC2.5, and BC5.0, respectively). Control treatments received no biochar addition only pepper plants. The biochar was applied to the soil and thoroughly homogenized prior to planting the peppers. The percent of biochar was calculated on a mass base. The length of the experiment was 86 days (from 11 June 2016 until 4 September 2016) under natural environmental conditions.

2.3. Physical and Chemical Characteristics of the Soil

Soil water content (SWC) at the beginning of the experiment was determined by oven drying soil samples of known volume (24 h; 105 °C) and SWC is given as volumetric water content throughout the study. All dry weight values of the soils were corrected to the measured SWC (26.5% at the beginning of the experiment) when preparing soil and biochar mixtures for planting. Continuous SWC and soil temperature monitoring was implemented using 5TM (Decagon Devices Inc, Pullman, WA, USA) soil moisture and temperature sensors. These sensors were calibrated specifically to the soil used in the present study, and collected data in 10 minute intervals.
Particle size distribution was determined using the sieve-pipette method. Soil total organic carbon (TOC) contents were measured by wet digestion using the Tyurin method, and the total nitrogen was determined using the modified Kjeldahl method (ISO 11261:1995). CaCO3 contents were measured using Scheibler calcimeter. Soil element concentrations are reported as mg/kg dry weight soil.

2.4. CO2 Measurements and GC-FID Analyses

During the course of the study CO2 measurements were taken 33 times using the static chamber technique, with three times per week frequency during the first 9 weeks, and twice weekly during the last three weeks. Gas samples were collected after a 20 min incubation time into evacuated 10 mL exetainer vials. All CO2 samplings started at exactly the same time of every measurement day (i.e., from 17:00 to 17:20 in the afternoon) to minimize additional interference from other diurnal environmental factors affecting soil respiration and plant response differences, such as leaf transpiration or net CO2 assimilation, during morning or in the evening [41]. Irrigations were always done on the same days when CO2 measurements were performed. Respiration samples were taken from the headspace of 12.5 cm high and 5 cm diameter columns equipped with a rubber septum on top, placed 2.5 cm deep into the soil. Air samples were taken at each sampling times in duplicates and were used as controls, while respiration measurements were done in triplicates for each treatment.
CO2 concentration of the samples was quantified using a FISION 8000 gas chromatograph (FISONS Instruments, UK) with a flame ionization detector (FID) equipped with a methanizer. GC-FID instrument column parameters were 2 m by 3 mm, Porapak Q 80–100 mesh. The method used a splitless injection with nitrogen carrier gas (pressure: 90 kPa; flow: 30 mL/min). The injection volume of 250 µL was used. The detector temperature was set at 150 °C, while the oven temperature was kept constant at 80 °C for the duration of 180 s. The methanizer temperature was set at 350 °C. Calibration standards of 1000 and 5000 mg/kg CO2 were run prior and after each sample runs, containing approximately 14 samples. CO2 production was calculated from the concentration changes. Concentrations are presented as mg/kg.

2.5. HYDRUS 1D Modeling

For better interpretation of the pot experiment data, we performed computer simulations using the HYDRUS 1D [42] model for SWC changes. Our model setup was based on the actual pot experiment. The modeling effort included simulations for soil water flow, root water uptake, and soil water storage changes. The van Genuchten–Mualem single porosity model was used with no hysteresis, as our soil in the experiment was carefully homogenized prior to use. For the same reason, only one material type was assumed throughout the soil column, with the following base hydrological parameters: ϴr = 0.05; ϴs = 0.59; α = 0.079 1/cm; n = 1.62; I = 0.5, where ϴr and ϴs are the residual and saturated water content, respectively, α and n are fitting parameters, and I is the tortuosity factor. Ks is the hydraulic conductivity of the soil, and was measured frequently throughout the study and varied among soil treatments (Ks = 66.02, 71.87, 94.87, and 125.79 cm/d for C, BC0.5, BC2.5, and BC5.0, respectively, where n = 3). The upper boundary condition (BC) was set at atmospheric BC with surface layer, while the lower BC at free drainage. The initial condition was given in the pressure head. The root water uptake model based on Feddes et al. [43] was applied, with no solute stress. Evaporation, transpiration, and evapotranspiration were not measured during the experiment, therefore we used the modeling approach to estimate potential changes in these water balance elements over time. Meteorological conditions were detected either on site (precipitation) of the experiment, or were retrieved from a nearby meteorological station (air temperature, wind speed, humidity, sunshine hours, Veszprém station, Hungary approximately 27 km from the experiment site). Due to frequent irrigation during the investigated time where known amount of water was applied directly to the soil surface, we assumed the interception to be negligible in the present setup. Crop data such as plant heights or root depths were quantified weekly or at selected pots’ disassembling times, respectively, and given as a daily input in the model using linear interpolation between measurements.

2.6. Statistical Analyses

The one-way ANOVA application was used to analyze the data, using STATISTICA 13 software. Tukey’s Honestly Significant Difference (HSD) test was used to further analyze significant interactions within groups. Statistical significance of the data sets was determined at p < 0.05 and p < 0.01. Error is reported as standard deviation.
For model evaluation we used the root square mean error (RMSE) and the RMSE-observation standard deviation ratio (RSR), which was calculated from the measured and simulated values. The ratio of RMSE to the standard deviation of measured data is a commonly used error index statistics. It is generally accepted that the lower the RMSE the better is the model fit. RSR was developed to provide a guideline to what is considered as low RMSE [44]. The following equation was used for the RSR calculations:
R S R   =   R M S E S T D E V o b s   =   [ i = 1 n ( Y i o b s   Y i s i m ) 2 ] [ i = 1 n ( Y i o b s   Y m e a n ) 2 ]
where Y i o b s is the ith observation for the constituent being evaluated, Y i s i m is the ith simulated value for the constituent being evaluated, Y m e a n is the mean of observed data for the constituent being evaluated, and n is the total number of observations [44]. The lower the RSR value, the better the model performance is (i.e., RSR = 0 indicates perfect model simulation or fitting to the measured data).
Estimation of measurement uncertainty of SWC was assessed to be 1.5% based on the soil moisture sensors’ factory guidance after soil specific calibration.

3. Results

3.1. Physical and Chemical Characteristics of the Soil and Biochar Used

Some of the basic components of the biochar and the soil used in the experiment are summarized in Table 1 and Table S2. Biochar addition to the soil resulted in an increase in the mixed soil’s sand fraction and reduced its overall clay content concurrent with the rate of biochar amount.

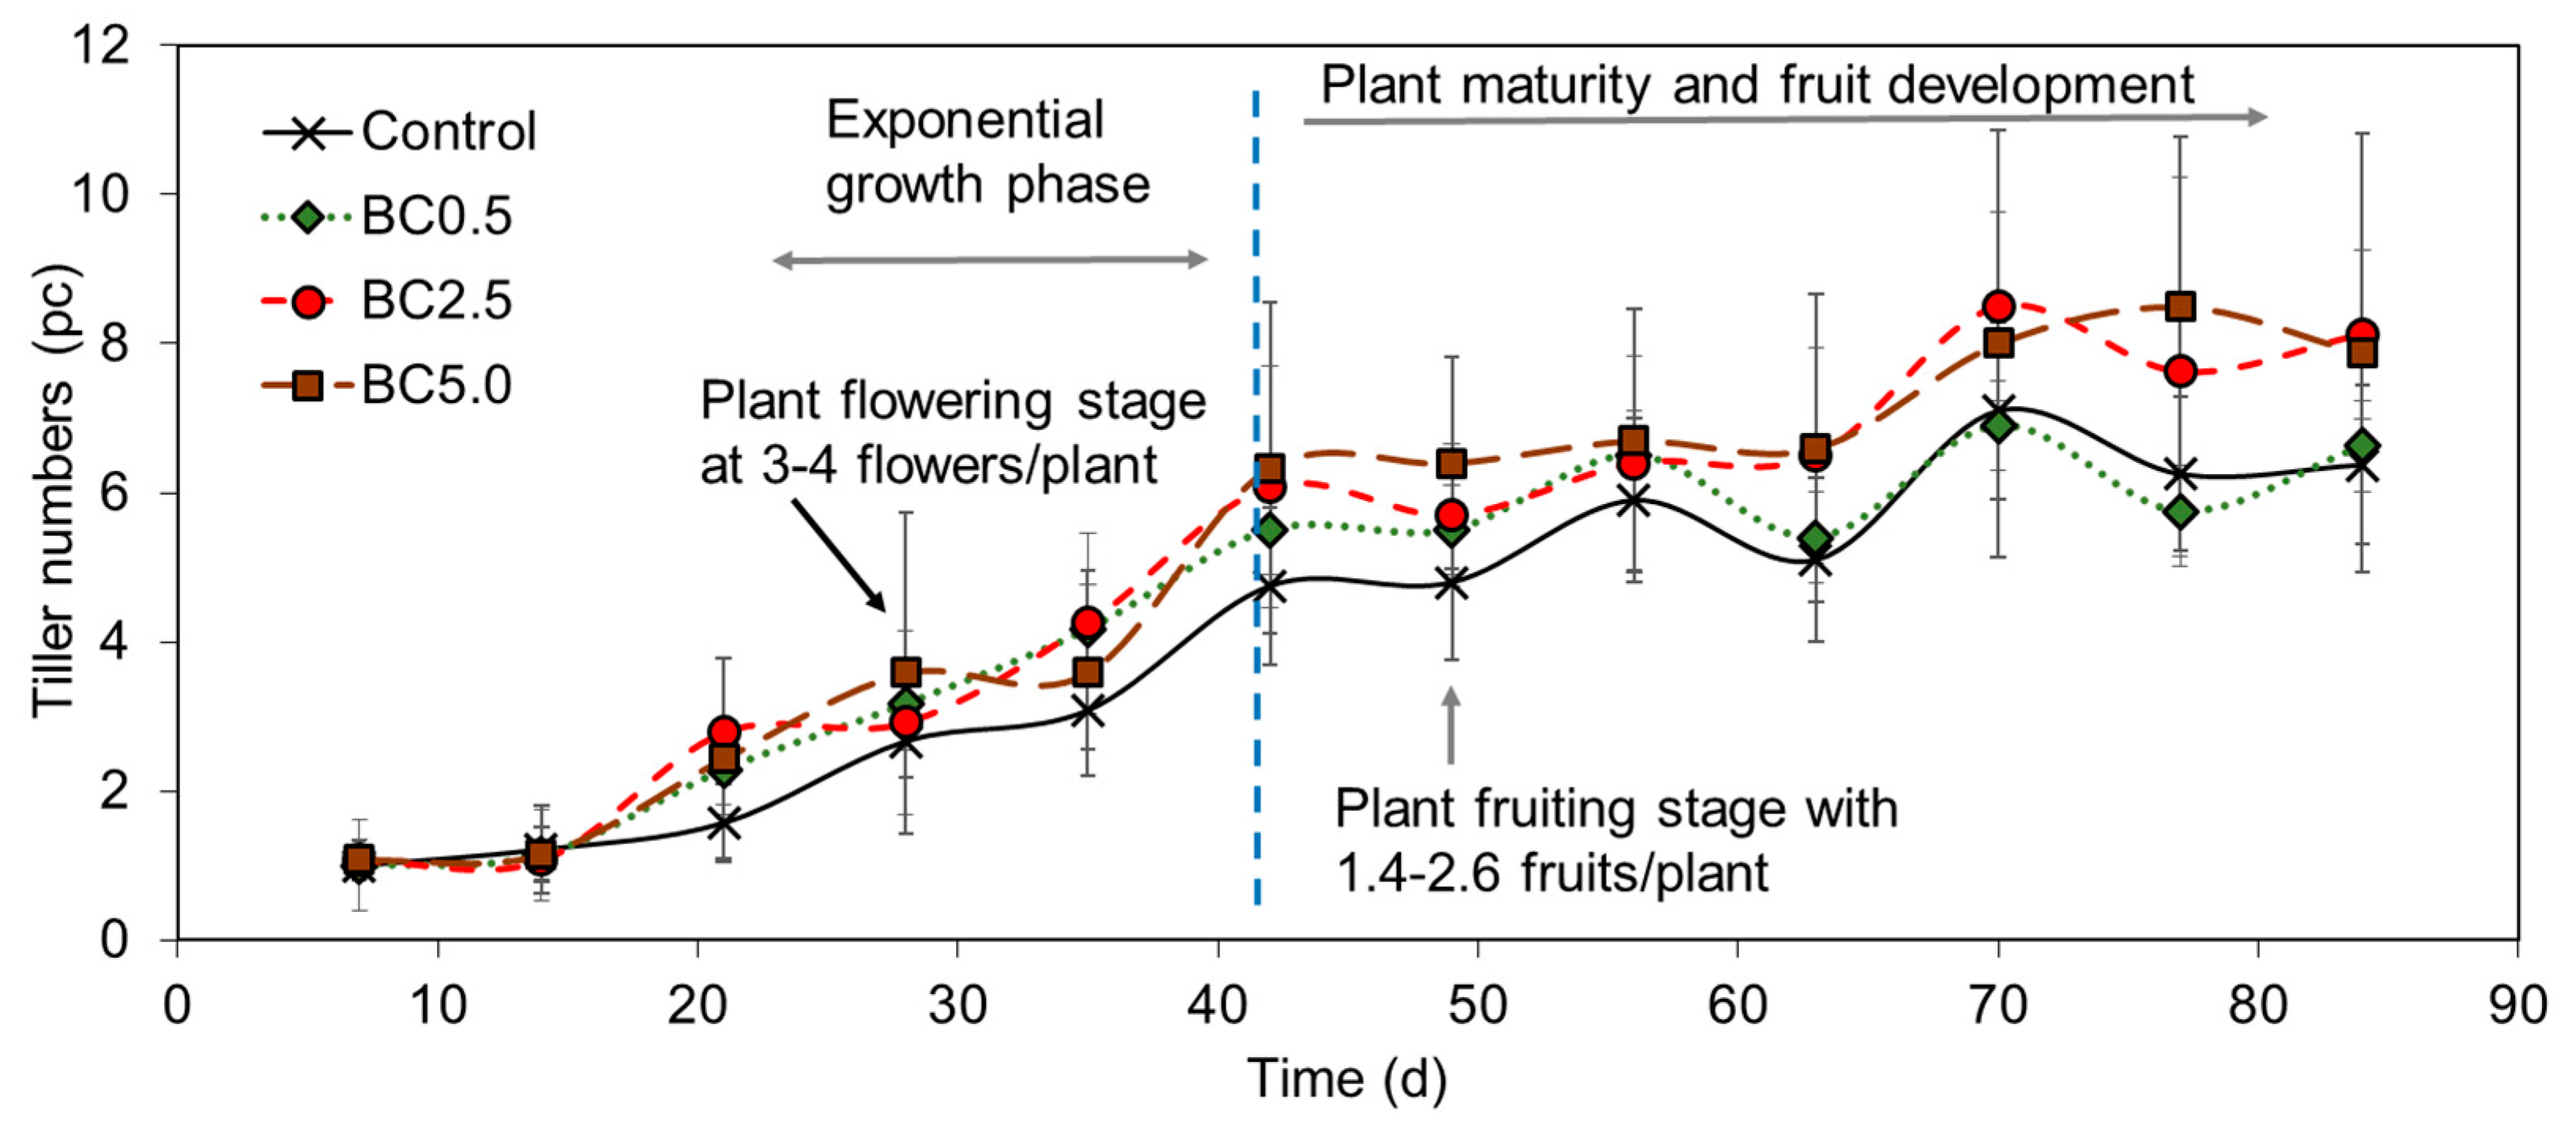
3.2. Plant Development

The overall growth developments of the Capsicum Annuum (pepper) plants observed in the different treatments are shown in Figure 2 based on weekly measurements of tiller numbers. The early stage of plant development was relatively similar among treatments, showing minimal differences in tiller numbers during the first four weeks of the study (p = 0.93). The control treatment had the smallest growth rate; however, BC0.5 slowed down for the last four weeks of the experiment resulting in very similar tiller numbers for both treatments. This slow rate resulted in a marginal difference between control and BC0.5 (3.9%) in contrast to BC2.5 and BC5.0 where 27.4% and 23.5% higher tiller numbers were observed compared to control, respectively (Figure 2); however, no significant differences between tiller numbers were observed during the overall experiment (p = 0.684).

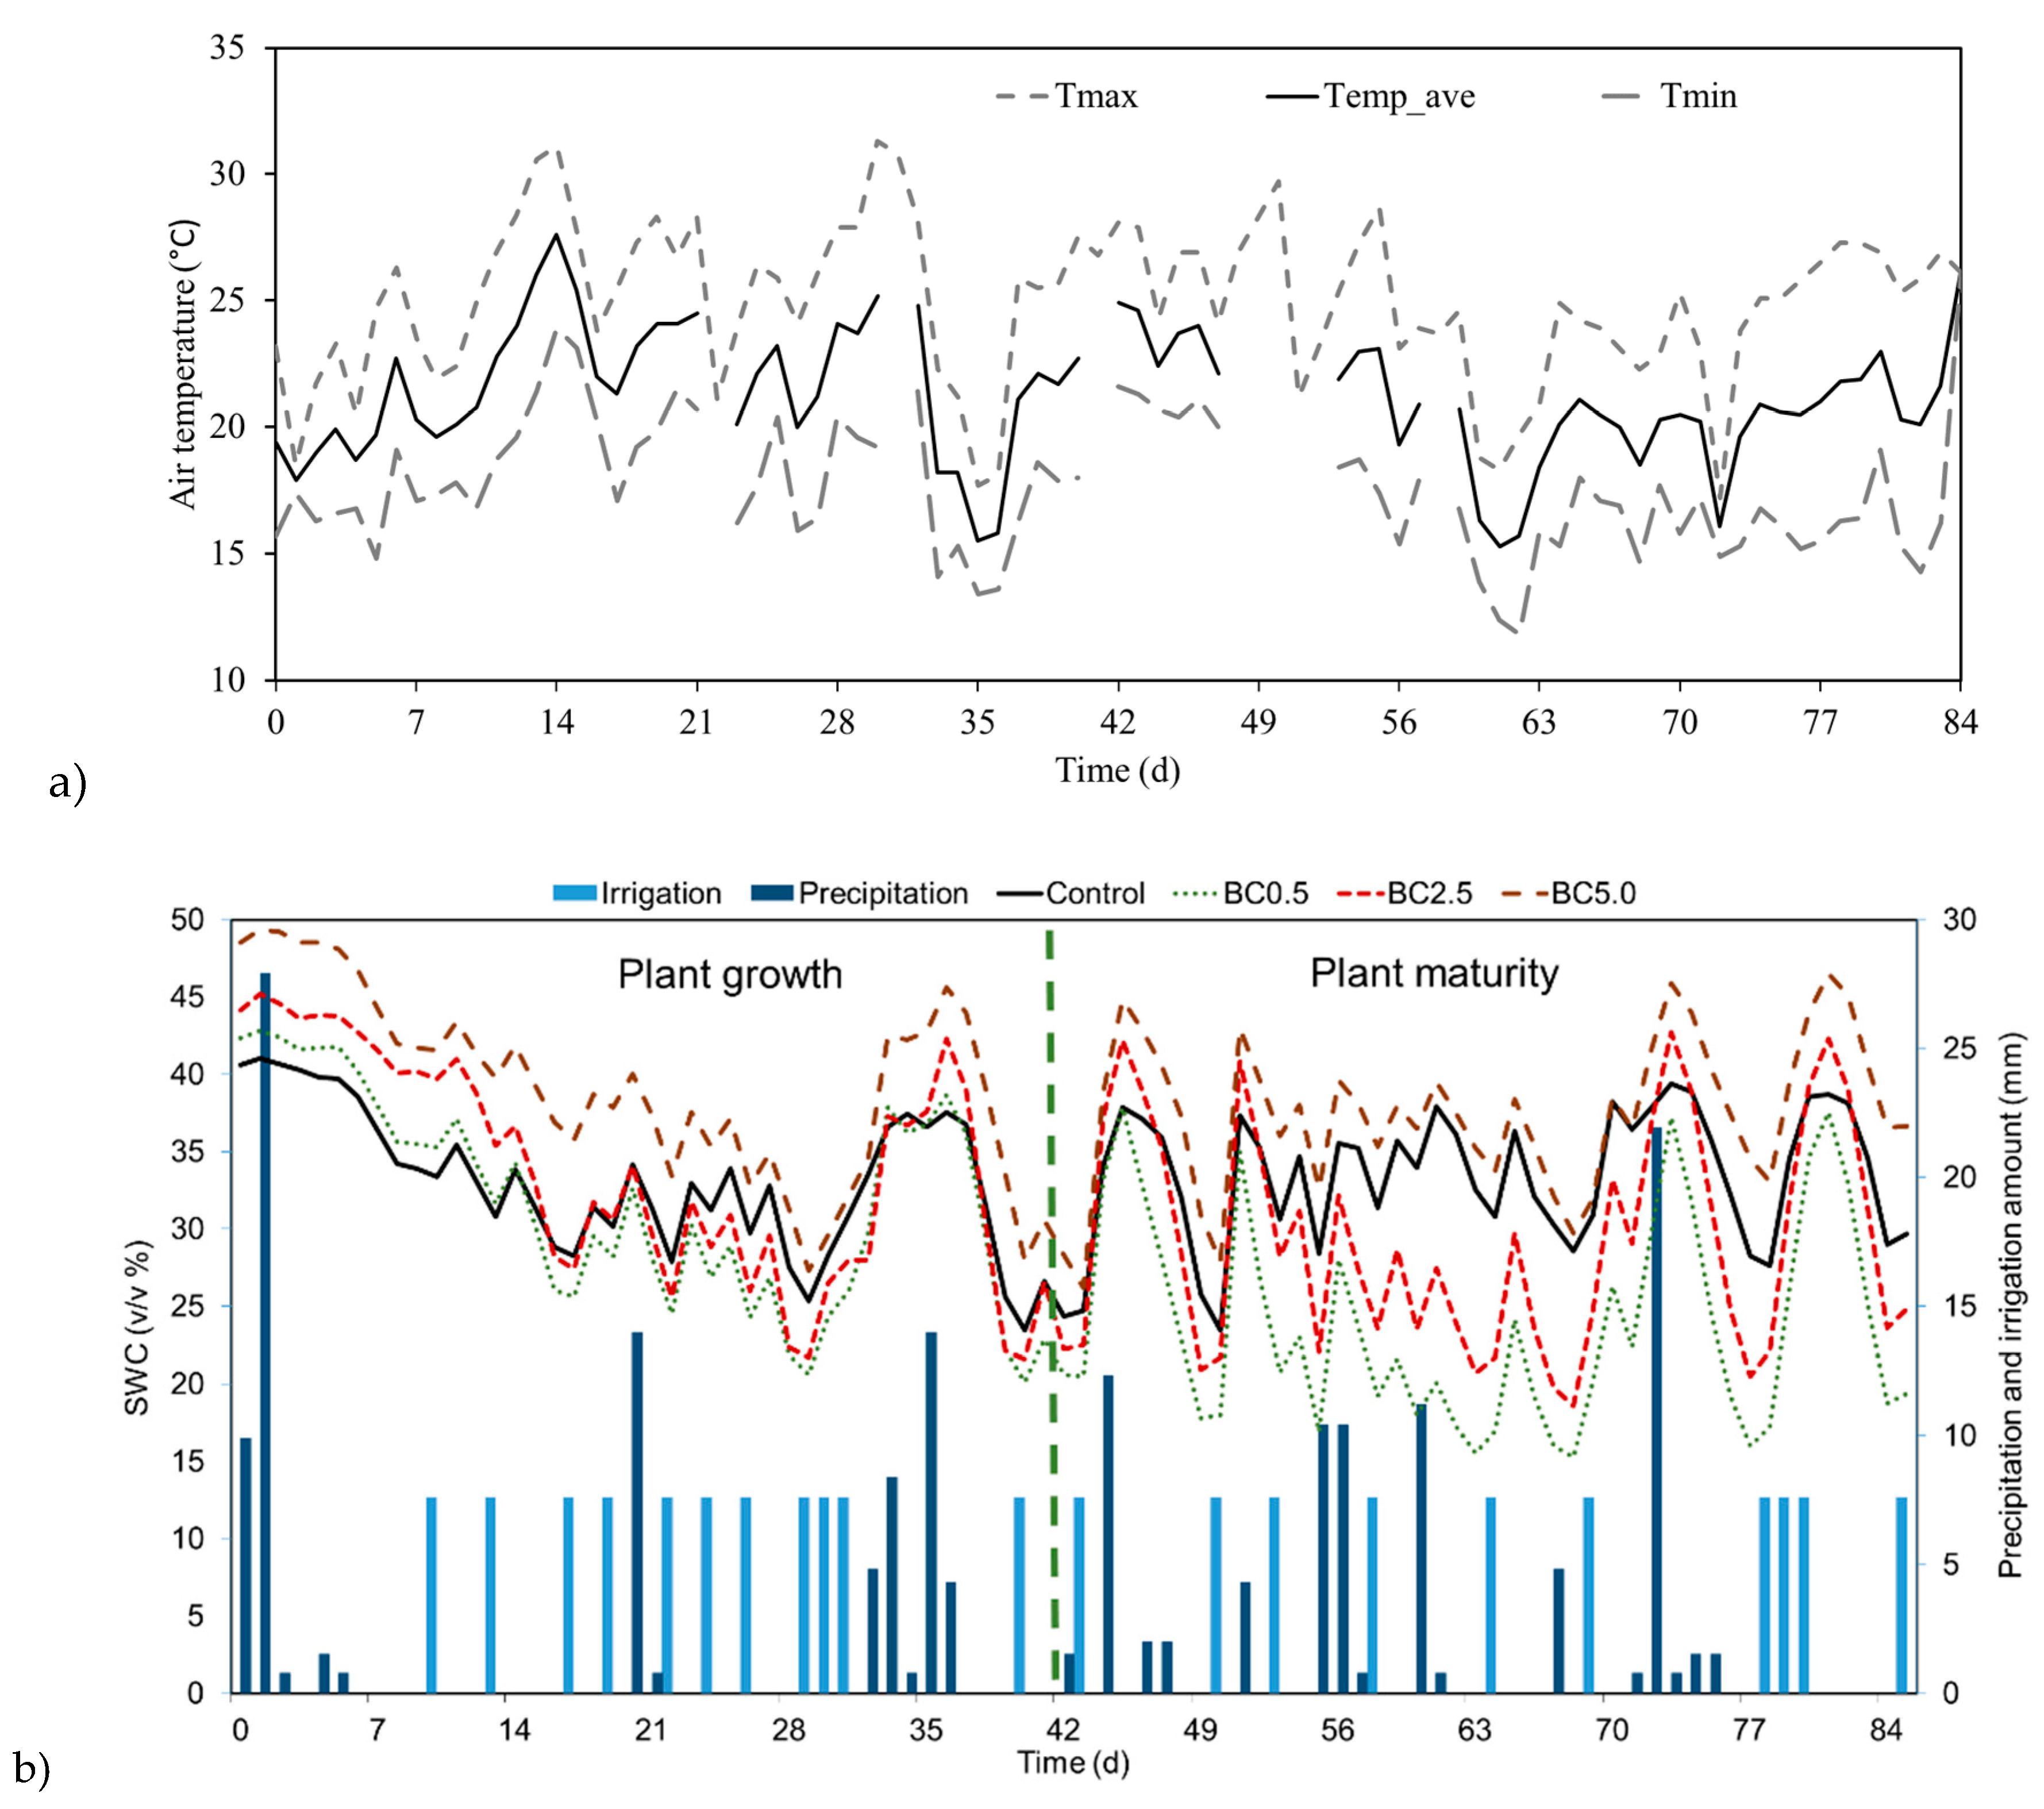
3.3. Rainfall and Irrigation Caused SWC Changes Over Time

Soil water content measurements showed two distinct time periods when biochar addition notably affected the water status of the soil. The first period was during the vegetation growing phase, until approximately the 6–7th week of the experiment. During this time relatively similar trends in soil water content changes were observed as a response to both irrigation and rain, but the SWC differed among treatments (all but BC0.5 and BC2.5 treatments’ SWC values showed significant differences; p < 0.01; Figure 3). After the pepper plants reached their maturity (around day 40–45), the BC0.5 and BC2.5 treatments showed substantial decrease in SWC during hot periods in contrast to control and BC5.0 (between 12.2 and 36.0% less SWC), where no such drying trend could be observed (Figure 3). Among the four treatments, we observed the highest SWC amount throughout the experiment in the case of BC5.0 (38.4% average SWC compared to 33.3% SWC in the case of control). In general, between the treatments we found statistically significant differences (p < 0.001; Table S3). All treatments’ overall SWC were significantly different from each other (p < 0.0016), except between control and BC2.5 (p = 0.073). Soil temperatures were monitored concurrently with the SWC measurements; however, their values showed very minimal changes between treatments due to the pot setups (unlike field soil planting), which enabled fast soil temperature adjustments to changes in air temperatures. Therefore, the influence of biochar addition on soil temperature is not discussed here.

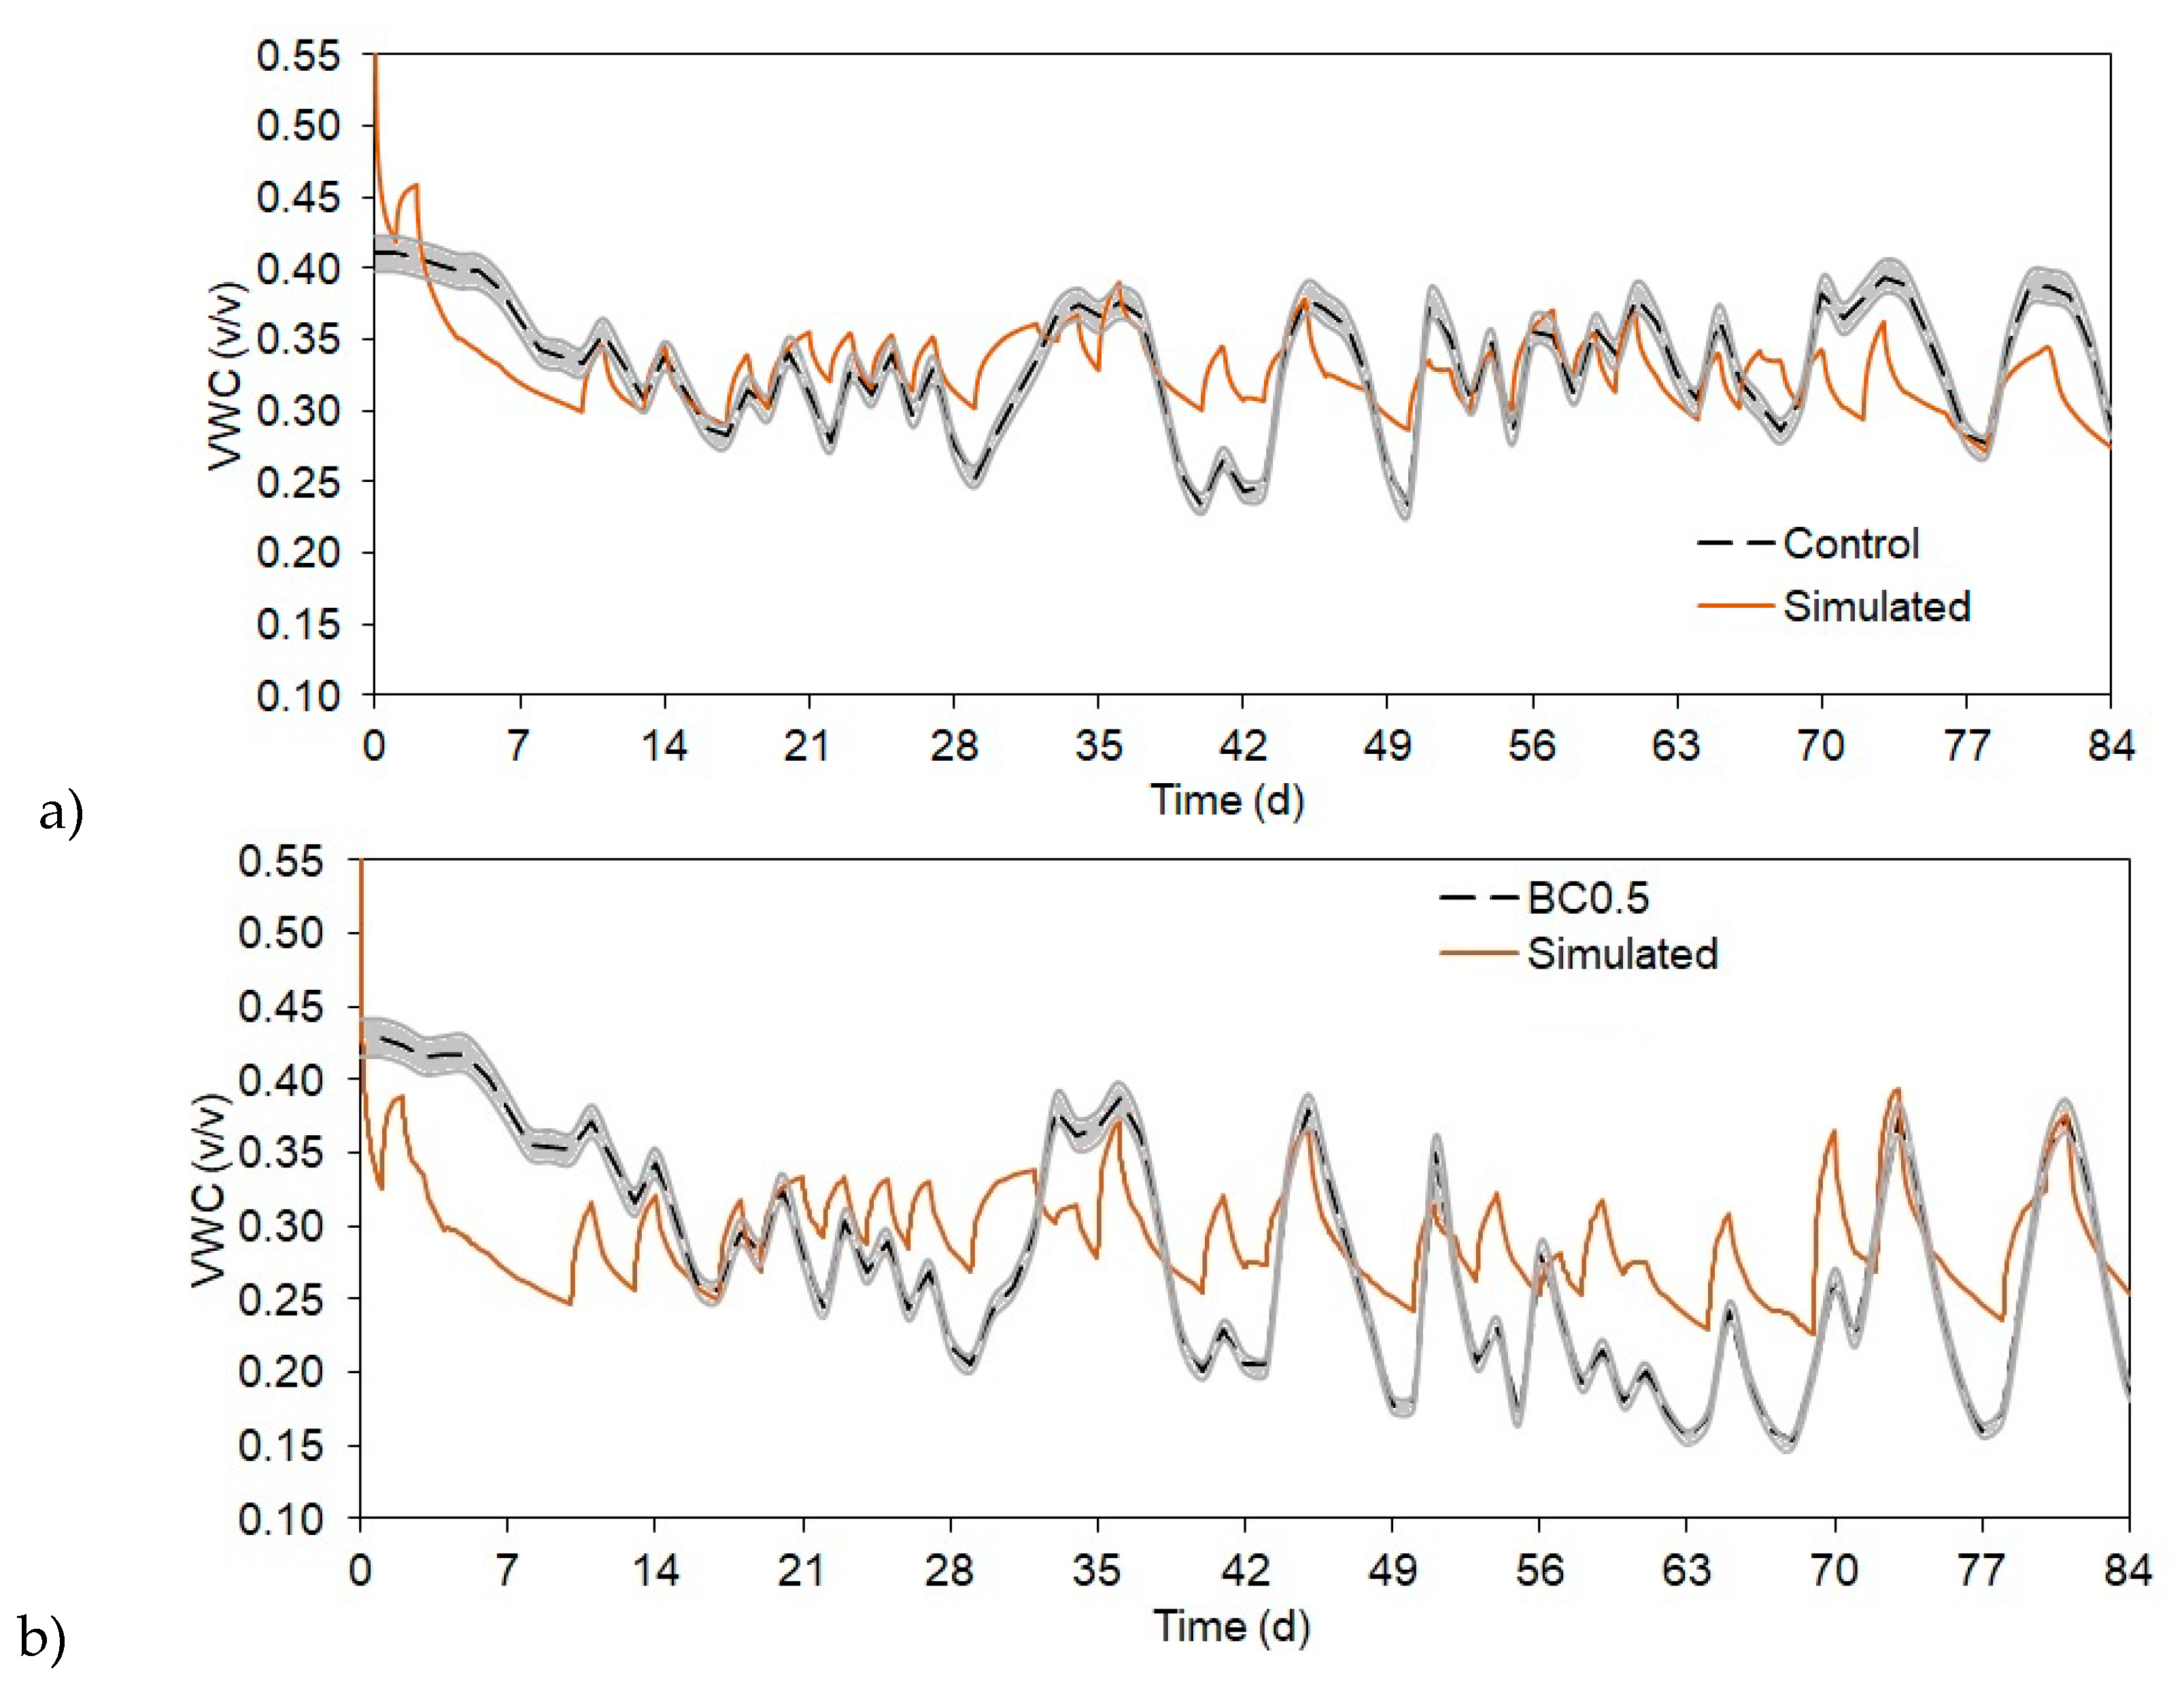
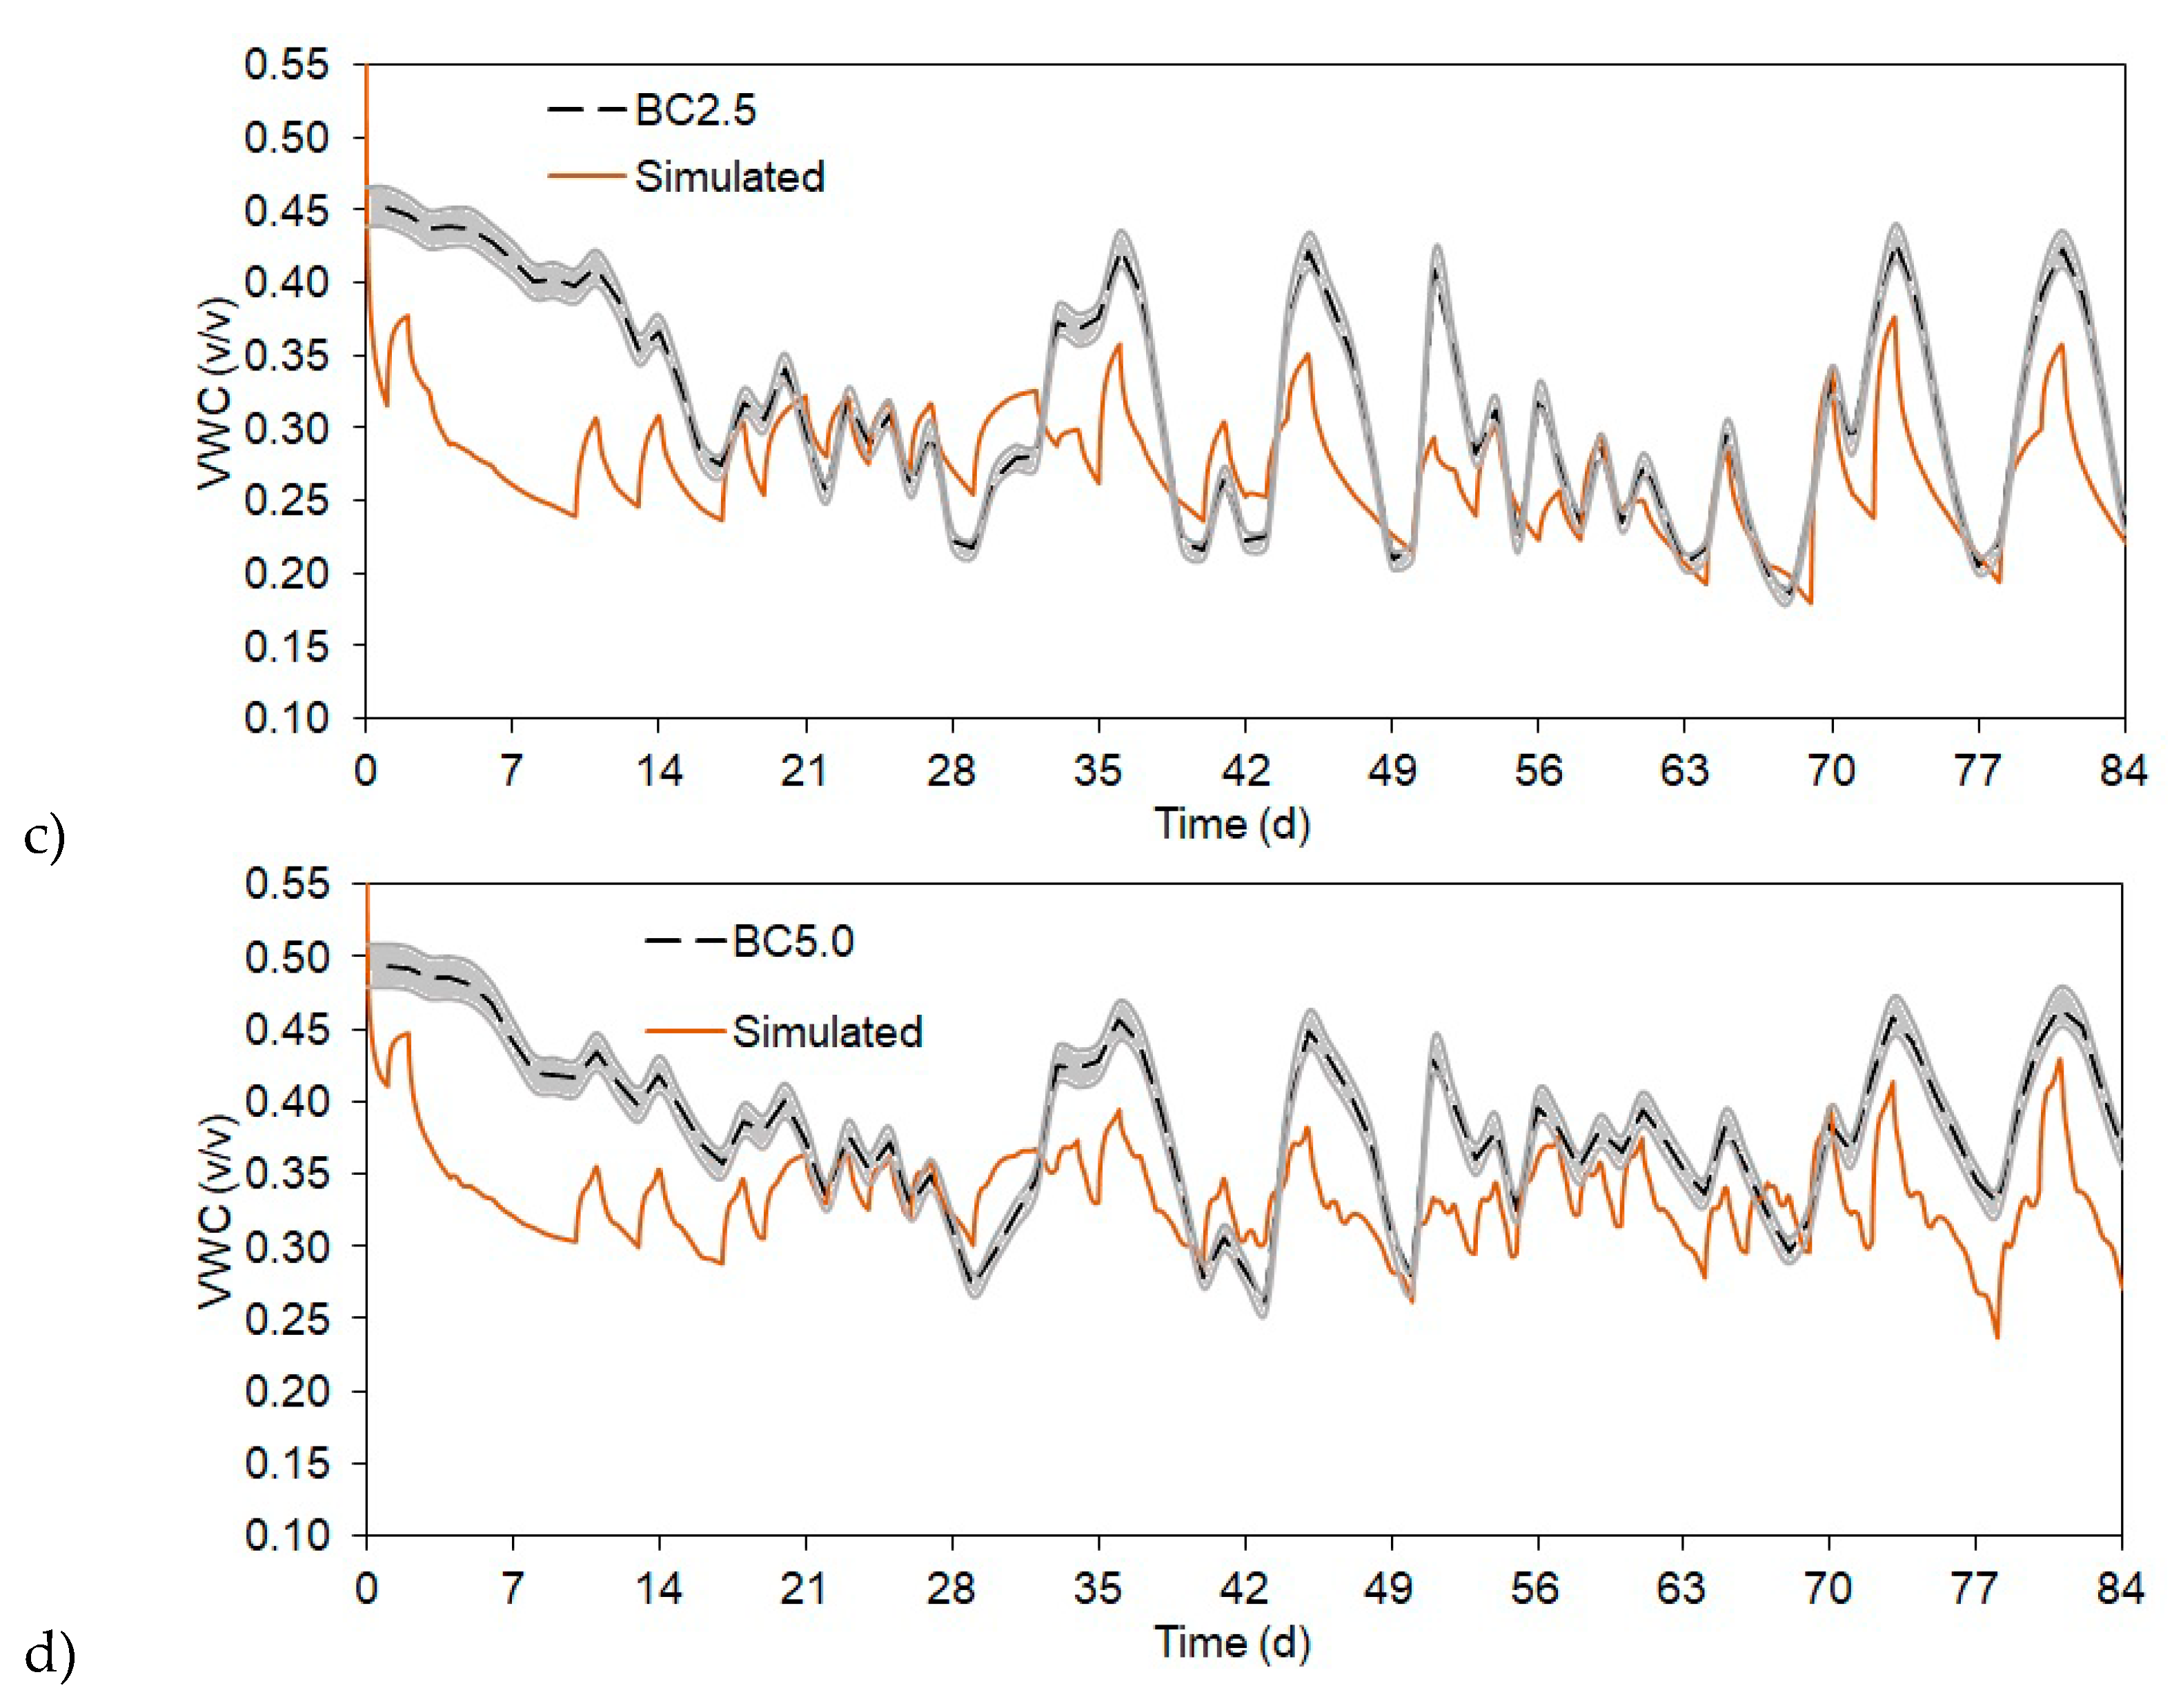
3.4. Modeling SWC Changes as Affected by Biochar Amendment

Based on model calibrated for control treatment, we simulated the model for the treatments of BC0.5, BC2.5, and BC5.0. The input parameters, which were specified to reflect differences among the different treatments were the measured Ks values, plant heights, and root information. Other parameters were uniform for the treatments. While the higher biochar amended treatments showed statistically very good simulation fitting (RSR ≤ 0.29) to the observed data (Figure 4c,d), the BC0.5 model run was close to good (RSR = 0.48) result (Figure 4b, Table 2) [44]. For the statistical analyses, the first week of SWC data was omitted from the calculations, as the soil moisture sensors needed some time to start measuring SWC properly (e.g., precipitation helps to compress soil around the sensor head, therefore no larger air pockets can influence moisture measurements).
In general, our model was somewhat underestimating changes in SWC when high biochar amount was added to the soils, especially during higher rain events. These changes were also concurrent with plant biomass amount, as BC2.5 and BC5.0 had the highest plants and denser roots, which were important input parameter differences in the biochar amended models. Simulated BC0.5 SWC (Figure 4b) showed more overestimation of moisture content compared to the measured data and to the other treatments simulation results, moreover, this model performed the least accurate (RSR = 0.5361) compared to the other simulations (Table 2).

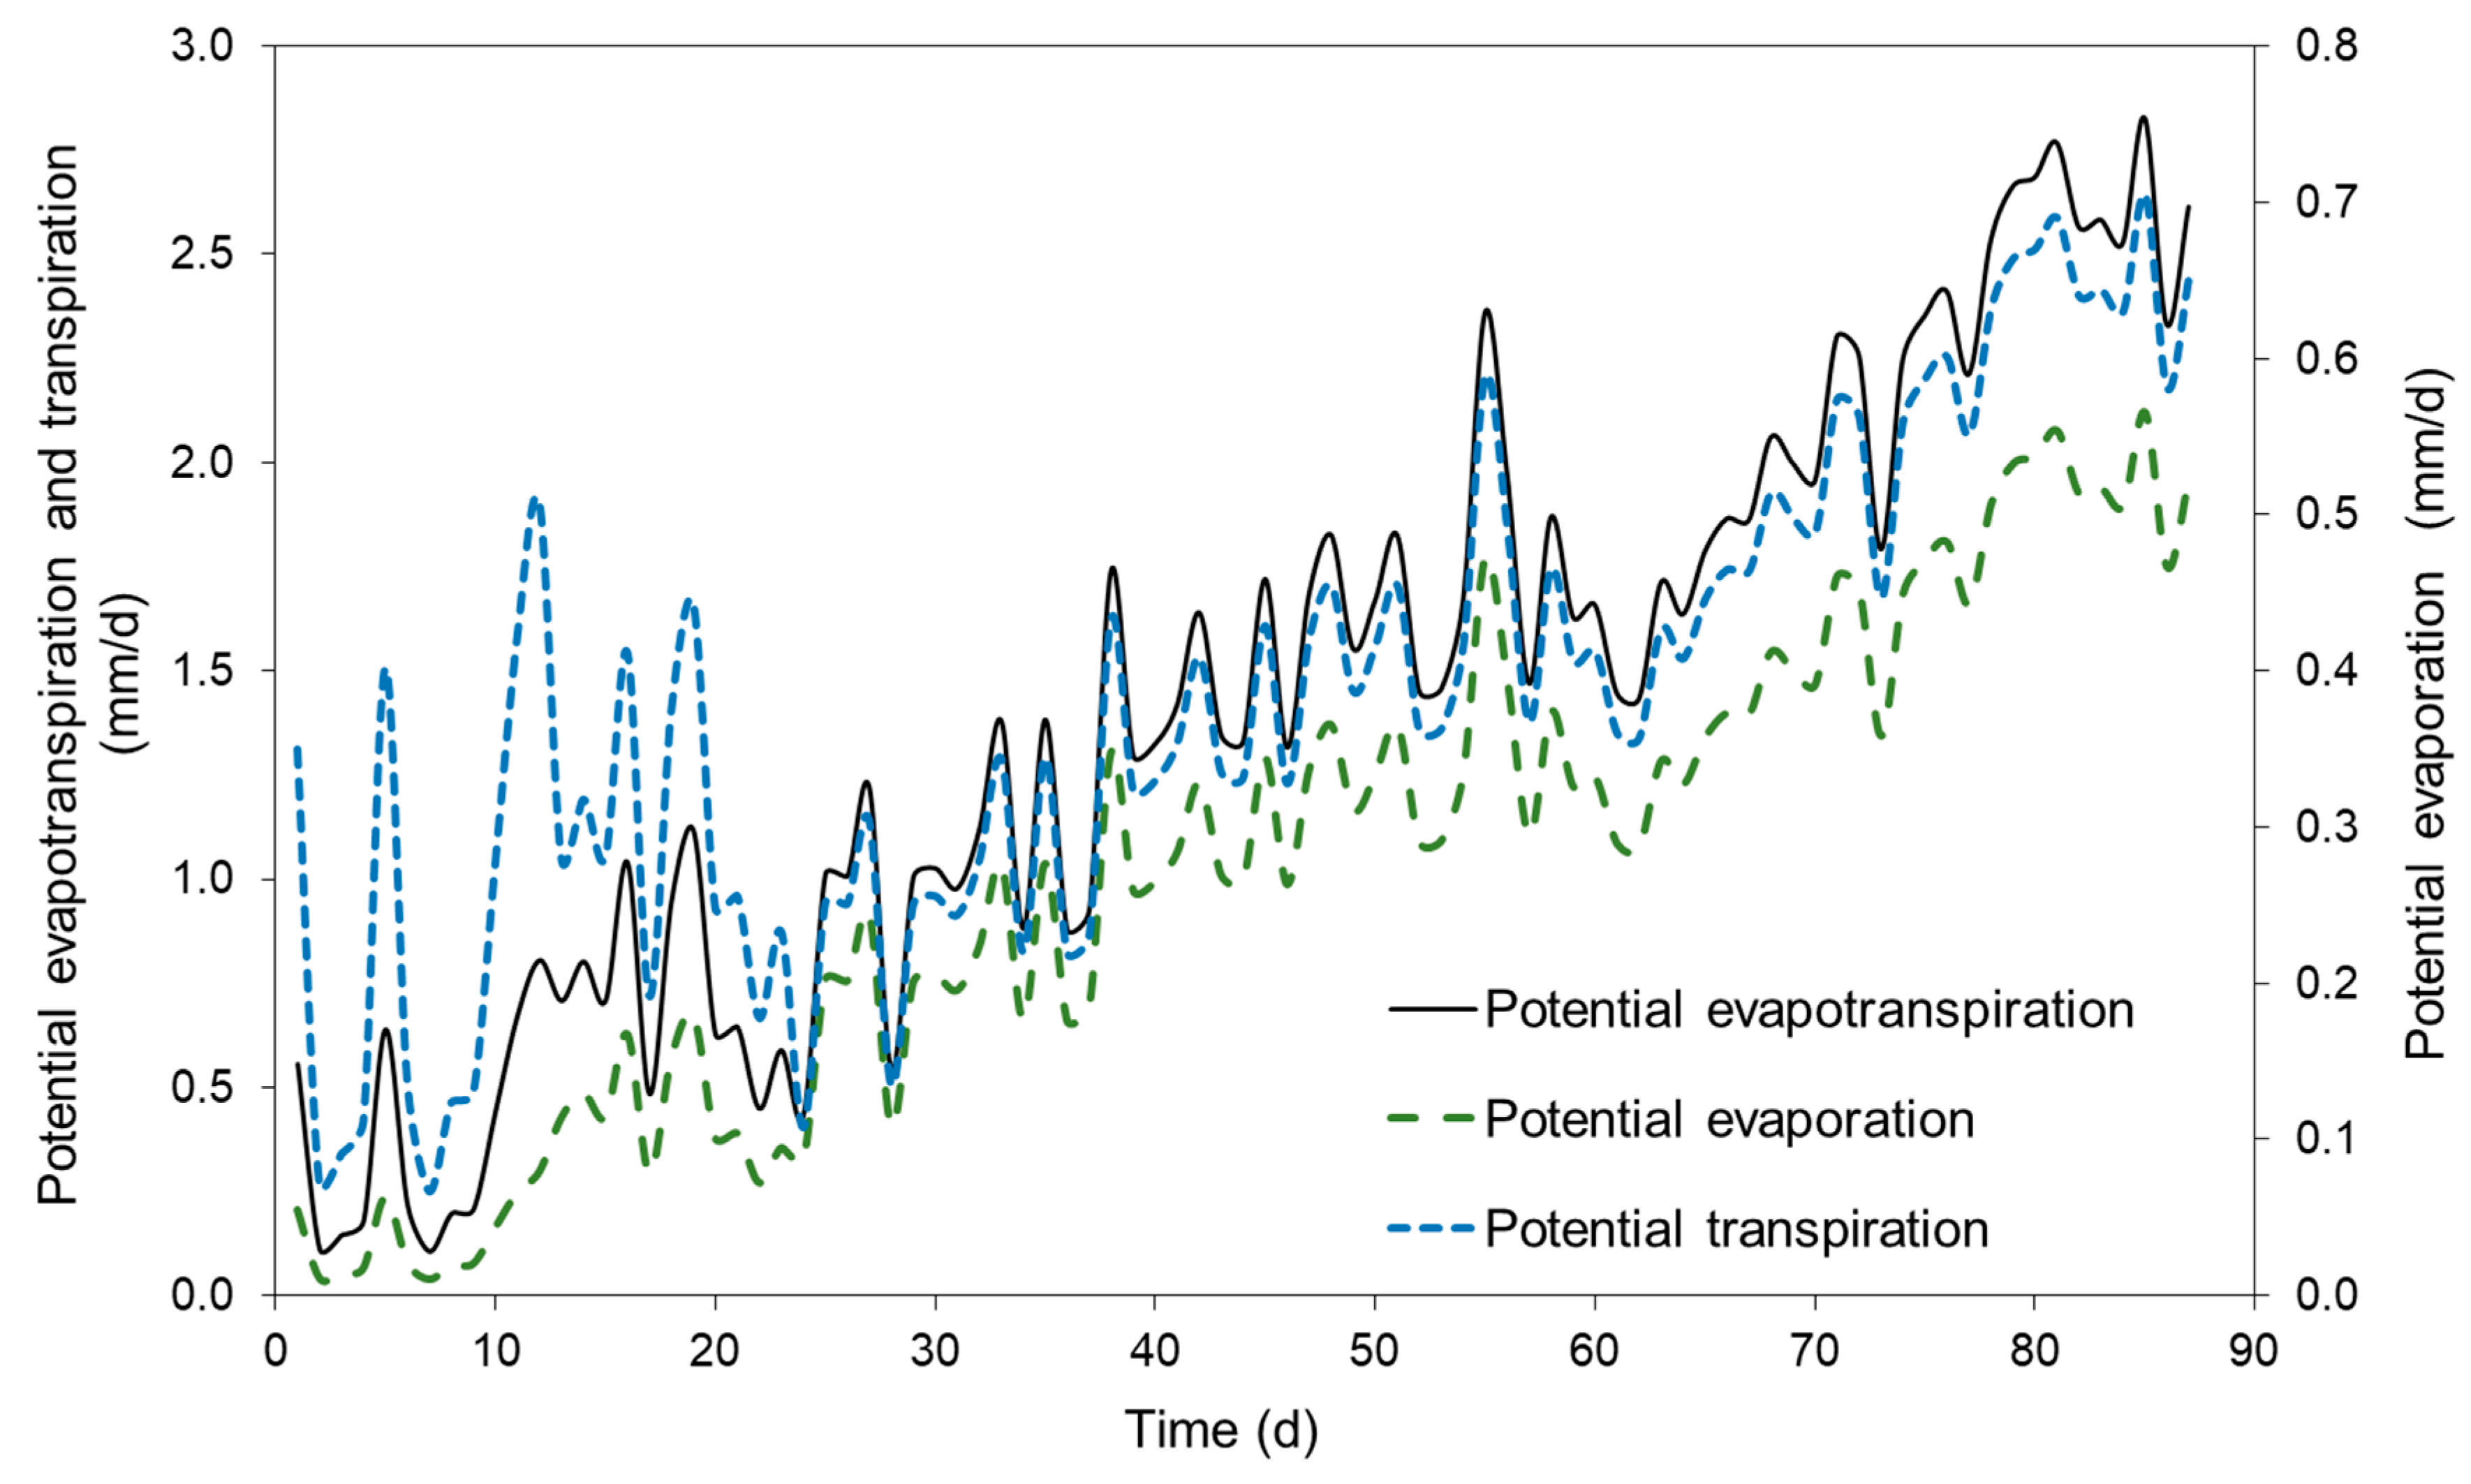
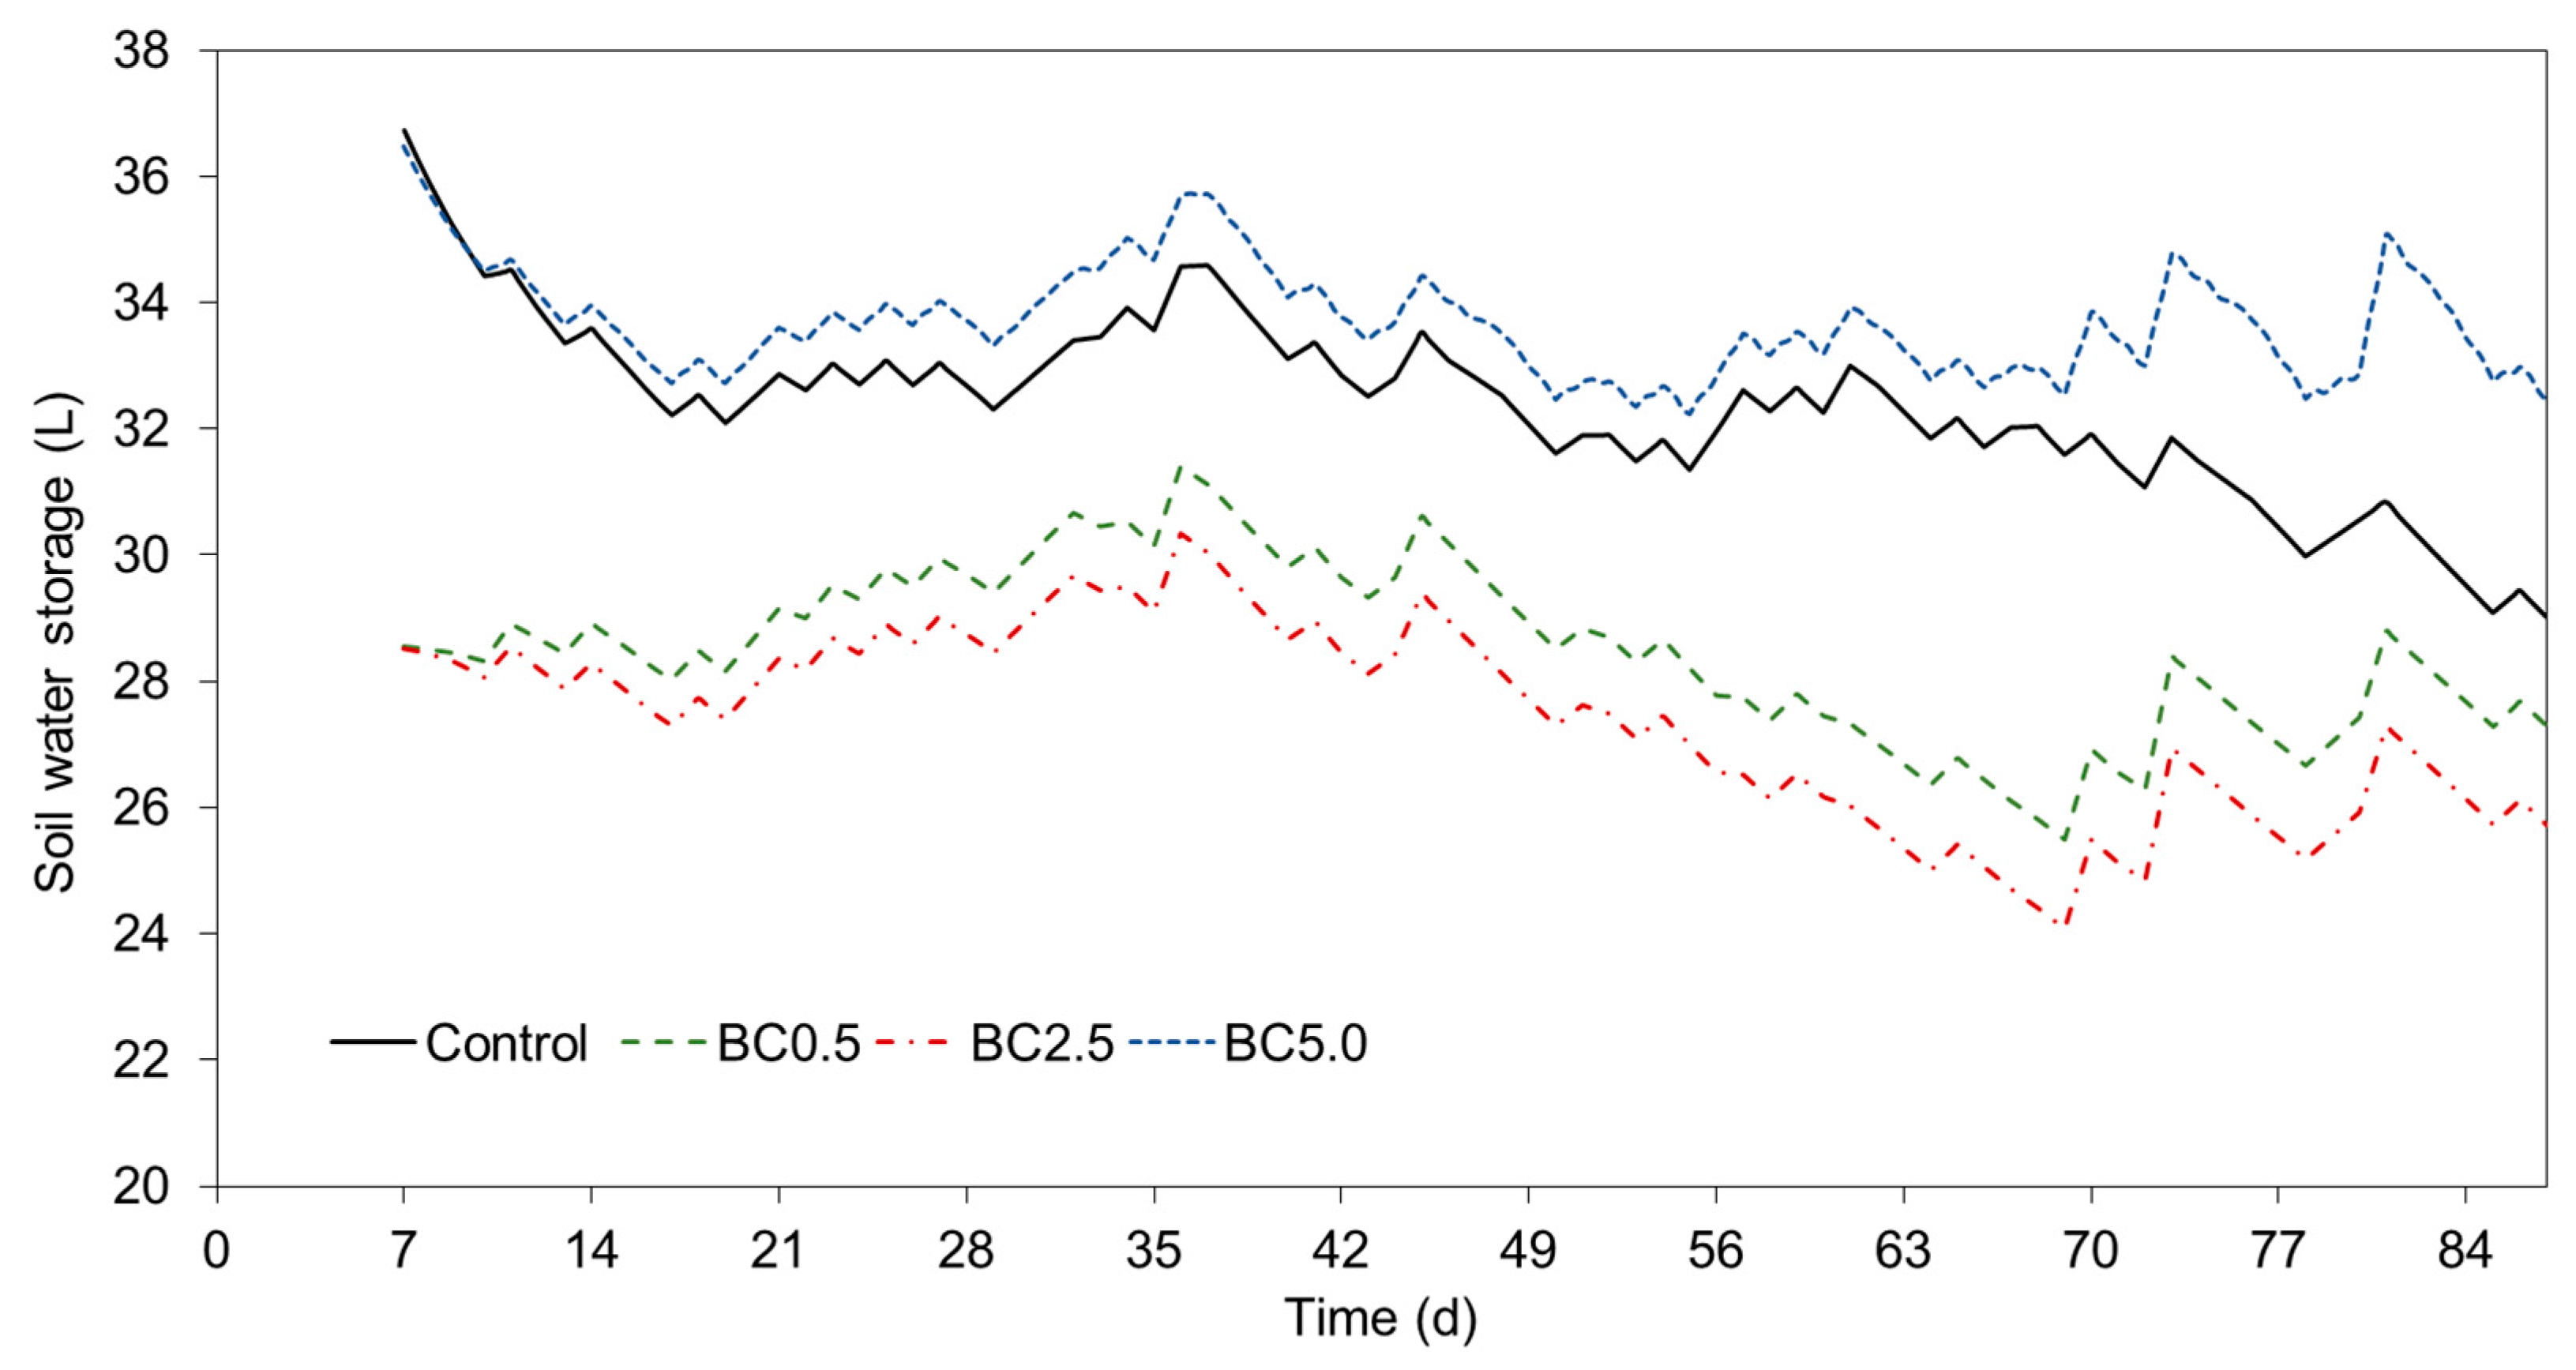
3.5. Modeling Potential Evapotranspiration (ET) and Soil Water Storage

Using data retrieved from the hydrological models, we illustrated the potential evaporation, transpiration, and evapotranspiration changes of the control treatment over time during the different plant growth phases in Figure 5. All four treatments showed similar trends of potential evaporation, transpiration, and ET changes driven by air and soil temperature changes. Potential evaporation values were larger in the treatments during the first three weeks of the study (average evaporation was 0.3745 mm/d during the first three weeks), especially at precipitation or irrigation events. Potential evaporation values leveled out during the third to sixth weeks, and increased during the last four weeks of the study (Figure 5; average potential evaporation was 0.4148 mm/d).
Overall potential evaporation (PET) values were continuously increasing during the course of the study simultaneously with plant growth and fruit maturity (Figure 6). The highest PET was observed in the case of BC2.5 (average PET was 1.6953 mm/d), while the lowest in the case of control and BC5.0 (average PET was 1.6065 mm/d). These results, among the plant growth differences, are also related to the soil moisture data, as higher average soil moisture contents were also observed in the control and BC5.0 treatments.
The HYDRUS 1D model is able to estimate the soil water storage changes over time calculated from changes in SWC. Figure 6 illustrates these changes, where SWC and water storage trends between treatments are noticeably correlates. Based on model simulations, C and BC5.0 had the highest volume of stored volume during the study, while BC0.5 and BC2.5 treatments showed 13.44 and 16.63% less stored water during the investigated period compared to control treatment (Figure 6). In the case of BC5.0 5.44% more stored water was estimated compared to control, resulting in the highest water storage volume among the treatments.

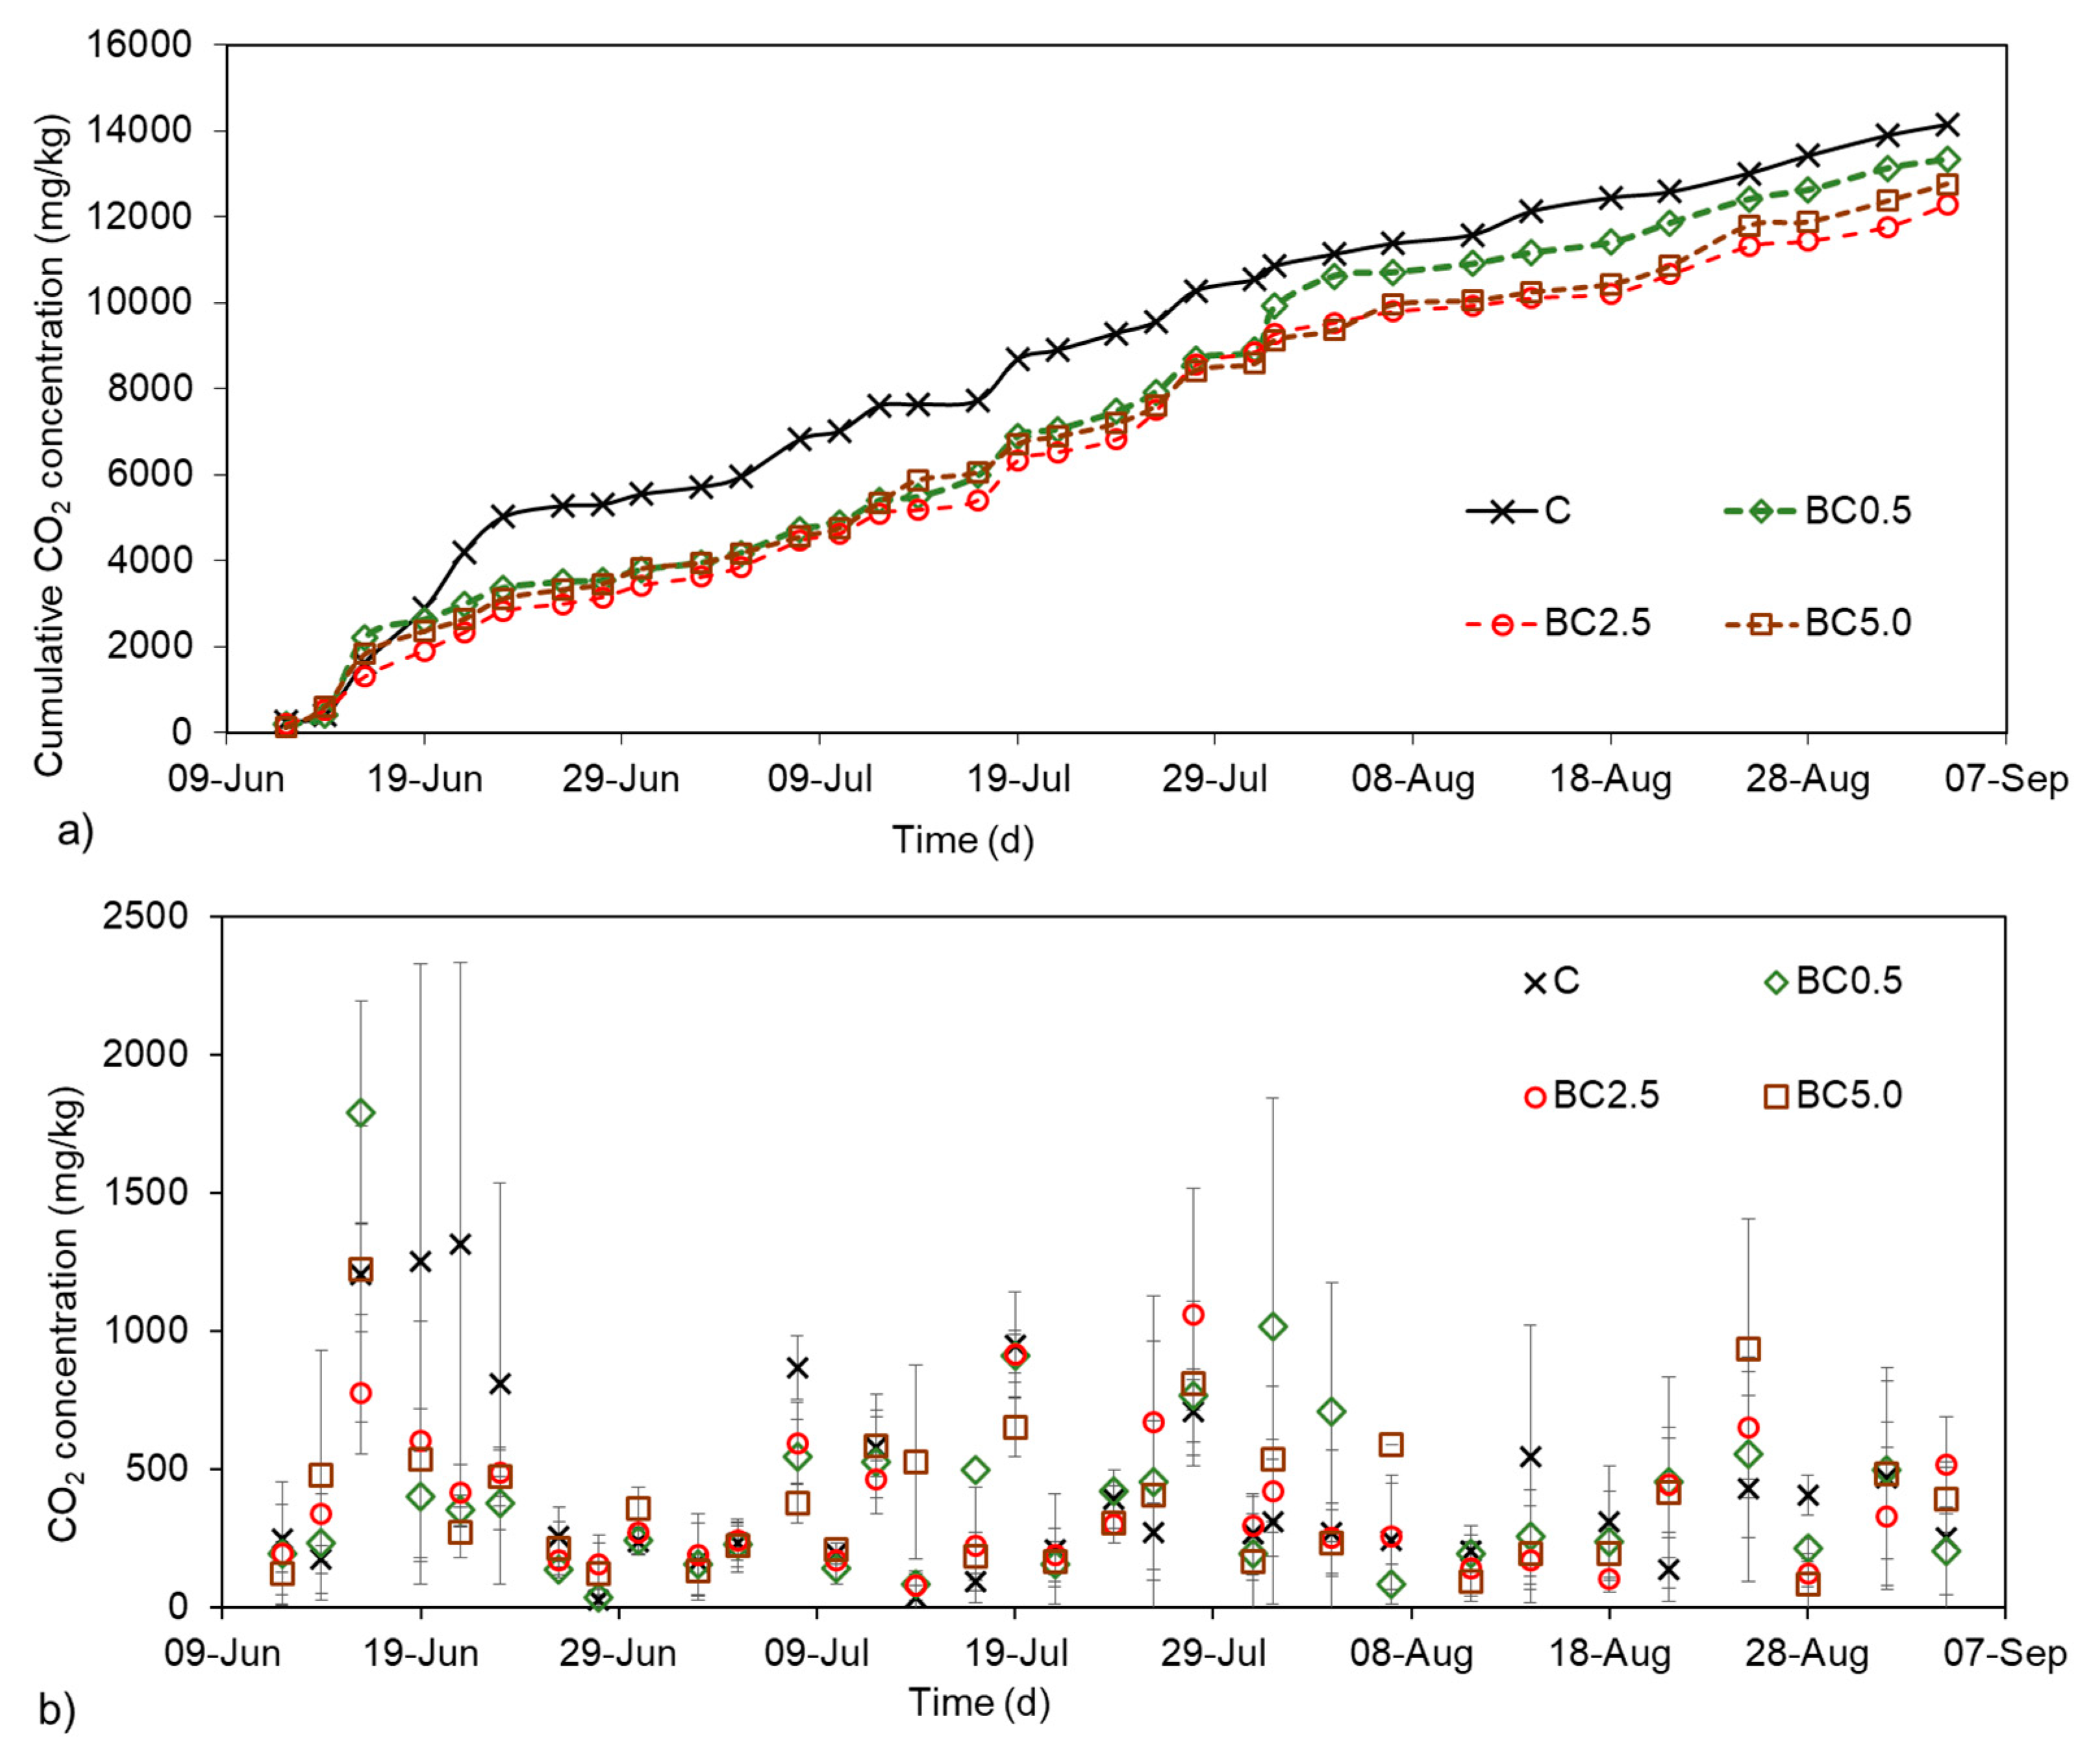
3.6. Soil CO2 Production during Plant Growth

Soil respiration was investigated as final average concentration values (at the end of the 20 min incubation period) of the replicated measurements, and also as cumulative CO2 concentrations over time for visualization purposes obtained from the discrete data points (Figure 7). Sudden increases in CO2 amounts were noticed after adding biochar amendments during the first few days, which was followed by periods of more and later less intense CO2 productions. The most pronounced differences between CO2 concentrations were detected in the cumulative measurements, where the control treatment showed a steadier increase of CO2 values during the first two weeks, while at the same time all other treatments CO2 concentration increases were much smaller (Figure 7). Around day 51 (8th week), BC0.5 showed a sudden increase in respiration values (Figure 7), resulting in much less difference compared to control treatments. In general, at the end of the experiment, the control treatments showed the highest and BC2.5 treatments showed the lowest cumulative CO2 concentrations, with 15.1% differences observed between the two treatments. This finding supports the possible carbon sequestration potential of the biochar, even after an initial increase in CO2 values. In overall however, daily soil respiration values did not differ significantly among treatments (p > 0.05).
Correlations between SWC or soil temperature and CO2 production had been investigated in several studies [15,45,46]. In the present experiment only weak or no relationship could be observed (R2 < 0.211). However, our data were collected during the same time period of each day during summer, therefore our dataset only includes a few lower and higher SWC or temperature values compared to average values.

4. Discussions

4.1. Effects of Biochar Addition on SWC

The SWC changes over time showed that biochar addition to soils can increase the soil’s moisture holding; however, water content was decreasing significantly in BC0.5 and BC2.5 treatments during dryer periods (p < 0.009; Figure 3). As the used soil type was silt loam, the intensive irrigation could cause a more compacted soil due to increased water content [47,48]. This was especially notable in the case of control treatment, as indicated by the lower hydraulic conductivity values, i.e., less porosity. The frequent application of irrigation water could also cause a soil sealing layer at the top of the soil column, reducing evaporation values, which was particularly observed in the case of control treatment. Biochar addition can reduce soil bulk density concurrent with increase in saturated hydraulic conductivity [19,49]. In the present study the 5% biochar addition resulted in the highest water storage volume, which indicates that soil compaction and changes in some of the soil physical properties have their limitation and higher biochar amount might override some of its impacts on soil hydrological properties.
However, the type of the biochar being used as soil enhancer can greatly affect the rate of changes in soil physical changes, especially SWC or soil water holding capacities (WHC) [50]. In general, we observed the highest SWC in the case of BC5.0 throughout the experiment, indicating that soil water content could be increased with increasing biochar amount; however, only when plant growth is not accounted for. Different amount of biochar affects plant growth at various levels. Bruun et al. [51] found that 2% of biochar addition increased root density the most compared to all other amount, including 4 wt%, while adding straw-biochar to the soil the 1% addition resulted in the greatest root density in the case of barley root growth. Therefore, the root growth can benefit from the increased water retention [51], while at lower depth level decreasing oxygen levels with increasing water content can negatively influence root development [52]. In the present study, 2.5% biochar addition resulted in the highest plant biomass production, including plant root density, where soil water uptake by the plant and also the potential transpiration could be higher compared to 5.0% biochar added treatments, or the possible soil oxygen limitation was greater in the case of BC5.0 treatments. Therefore, plant growth might influence soil moisture at a greater level than biochar amount alone. Higher water retention in biochar amended soils could be a reason of the biochars’ porous structure [9], which makes biochar beneficial for many soil types in maintaining suitable soil water content [53]. Dugan et al. [10] investigated silt loam soil amended with different amounts and types of biochars and found that WHC of soils could increase significantly; however, these changes were not as pronounced at higher biochar additions. These findings were somewhat similar to our findings (Figure 3) during the first few weeks of the experiment, when plant growths were not as prominent yet. During later weeks however, biochar addition of 0.5 and 2.5% decreased WHC at rain events, while the highest biochar amount showed the highest WHC.

4.2. Changes in Soil CO2 Rates

The overall daily CO2 production values showed no distinguishable changes over the course of the study (Figure 4), where we did not find any significant differences between the treatments’ overall CO2 production (p ≥ 0.50; Table S4a). However, when the different treatments’ CO2 concentrations were investigated over time, we observed significant differences between the treatments (p < 0.001; Table S4b), indicating that soil temperature was a more influencing factor than biochar amendment alone. Our finding was somewhat similar to results observed in a study where short-term effects (up to 48 hours) of biochar was investigated on soil CO2 evolution [29]. The authors found a sudden surge in CO2 production caused by biochar addition, compared to control. Our data after the first few days shifted from higher CO2 production in biochar amended treatments to higher values observed in the controls, where the highest overall CO2 production lasting till the end of the investigated period. Soil WHC up to 60% is known to be optimal for aerobic microbial activities [54], where soil respiration is not limited by oxygen availability. In the present study, SWC was not occurring above 60% of WHC or below wilting point, therefore SWC changes were assumed not to be a major limiting factor for aerobic CO2 production and the space in the water filled pores most likely included enough oxygen for microbial respiration. The influence of other factors such as soil compaction might play crucial roles in soil greenhouse gas emissions [45,55]. As previously mentioned, soil compaction was observed in the case of control treatment, however it took several weeks to be notable. Similarly on the respiration data, during the first few weeks CO2 concentrations were much higher compared to other treatments, while at later weeks, especially Weeks 7 and 11, control showed relatively low CO2 values. This finding can correlate to irrigation and rain water related possible soil compactions and its effect on soil respiration.
The cumulative CO2 production at the end of the experiment better reflects the difference observed between plant growth and soil physical changes, as the largest variations of CO2 concentrations were detected in BC2.5 treatments concurrent with the fastest plant growth and overall biomass production. The lower amount of emitted CO2 measured in biochar amended soils compared to controls during the course of the study was in accordance with other studies investigating CO2 emission reductions using biochars [56] or showing only minimal changes in CO2 emissions [57]. However, increase in CO2 production can also be observed, especially as a short-term effect from biochar application [29]. As most biochar mineralization occurs during the first year of field application [31], long-term CO2 decrease could be expected in amended soils. However, biochar types and their effects on different soils might vary significantly based on soil respiration production or consumption [32].
Overall, in the present experiment we found that there is an optimal biochar rate to apply for agricultural soils, which mainly depends on soil types and plants to be sowed. High amount of biochar did not produce significantly better plant biomass, plant yield, soil moisture, or soil respiration results compared to medium amount of biochar; therefore the best amount of biochar addition to achieve the highest biomass and fruit production for the studied soil was defined as 2.5% in the present study. The mathematical modeling used demonstrated to be a very valuable tool that can be used to estimate changes in soil moisture content when different biochar amounts are added to the investigated soils. The used model; however, needed to have measured input values on the different soil hydraulic properties, which were changed as more biochar amendment was present in the soils. In general, our study supports the possible carbon sink potential of biochar use in agricultural soils; hence its use might help mitigate negative effects from greenhouse gases originating from soils. The present experiment aimed at enhancing our current knowledge on SWC and CO2 production changes over time during plant growth, maturing, fruit development, and harvest, which was attained; however, investigating more vegetation growth periods, especially using the same soil, could further improve our understanding on soil hydrology and respiration changes on the long term.

Supplementary Materials

The following are available online at https://www.mdpi.com/2073-4395/9/2/58/s1, Table S1: Metal concentration analysis of the biochar used in the experiment. Table S2: pH measurements and particle size distribution of soil and biochar soil mix at the beginning (Day 1) and at the end of the experiment (Day 86). n = 3; ±SD. Table S3: ANOVA analysis for SWC of the different treatments. Table S4: ANOVA analysis for soil CO2 concentrations of the different treatments (a) between overall treatment CO2 data and (b) over time.

Author Contributions

Conceptualization, A.H.; methodology, A.H., E.T. and M.D.; formal analysis, A.H. and M.D.; resources, C.F.; writing—original draft preparation, A.H.; writing—review and editing, C.F., M.D., G.G., A.H. and E.T.; project administration, A.H.; funding acquisition, A.H.

Funding

This research was funded by the Hungarian National Research Fund, project number NKFI/OTKA PD-116157. The APC was funded by the Hungarian National Research Fund, project number NKFI/OTKA PD-116157.

Acknowledgments

The authors would like to thank Dániel and Tamás Csehovics their help during data collection and experimental setup. This paper was supported by the János Bolyai Research Scholarship of the Hungarian Academy of Sciences.

Conflicts of Interest

The authors declare no conflicts of interest. The funders had no role in the design of the study; in the collection, analyses, or interpretation of data; in the writing of the manuscript, or in the decision to publish the results.

References

  1. IPCC. Mitigation of Climate Change. In Contribution of Working Group III to the Fifth Assessment Report of the Intergovernmental Panel on Climate Change; Cambridge University Press: Cambridge, UK; New York, NY, USA, 2014. [Google Scholar]
  2. Jakab, G.; Madarász, B.; Szabó, J.; Tóth, A.; Zacháry, D.; Szalai, Z.; Kertész, Á.; Dyson, J. Infiltration and soil loss changes during the growing season under ploughing and conservation tillage. Sustainability 2017, 9, 1726. [Google Scholar] [CrossRef]
  3. Sun, F.; Lu, S. Biochars improve aggregate stability, water retention, and pore-space properties of clayey soil. J. Plant Nutr. Soil Sci. 2014, 177, 26–33. [Google Scholar] [CrossRef]
  4. Novak, J.M.; Lima, I.; Xing, B.; Gaskin, J.W.; Steiner, C.; Das, K.C.; Ahmedna, M.; Rehrah, D.; Watts, D.W.; Busscher, W.J.; et al. Characterization of designer biochar produced at different temperatures and their effects on a loamy sand. Ann. Environ. Sci. 2009, 3, 195–206. [Google Scholar]
  5. Schiewer, S.; Horel, A. Biodiesel addition influences biodegradation rates of fresh and artificially weathered diesel fuel in Alaskan sand. J. Cold Reg. Eng. 2017, 31, 04017012. [Google Scholar] [CrossRef]
  6. Anderson, C.R.; Condron, L.M.; Clough, T.J.; Fiers, M.; Stewart, A.; Hill, R.A.; Sherlock, R.R. Biochar induced soil microbial community change: Implications for biogeochemical cycling of carbon, nitrogen and phosphorus. Pedobiologia 2011, 54, 309–320. [Google Scholar] [CrossRef]
  7. Horel, A.; Schiewer, S. Impact of VOC removal by activated carbon on biodegradation rates of diesel, Syntroleum and biodiesel in contaminated sand. Sci. Total Environ. 2016, 573, 106–114. [Google Scholar] [CrossRef] [PubMed] [Green Version]
  8. Basso, A.S.; Miguez, F.E.; Laird, D.A.; Horton, R.; Westgate, M. Assessing potential of biochar for increasing water-holding capacity of sandy soils. GCB Bioenergy 2013, 5, 132–143. [Google Scholar] [CrossRef]
  9. Ulyett, J.; Sakrabani, R.; Kibblewhite, M.; Hann, M. Impact of biochar addition on water retention, nitrification and carbon dioxide evolution from two sandy loam soils. Eur. J. Soil Sci. 2014, 65, 96–104. [Google Scholar] [CrossRef]
  10. Dugan, E.; Verhoef, A.; Robinson, S.; Sohi, S.; Gilkes, R.; Prakpongkep, N. Bio-char from sawdust, maize stover and charcoal: Impact on water holding capacities (WHC) of three soils from Ghana. In Proceedings of the 19th World Congress of Soil Science, Brisbane, Australia, 1–6 August 2010; IUSS: Wien, Austria, 2010. [Google Scholar]
  11. Karhu, K.; Mattila, T.; Bergström, I.; Regina, K. Biochar addition to agricultural soil increased CH4 uptake and water holding capacity—Results from a short-term pilot field study. Agric. Ecosyst. Environ. 2011, 140, 309–313. [Google Scholar] [CrossRef]
  12. Major, J.; Steiner, C.; Downie, A.; Lehmann, J. Biochar effects on nutrient leaching. In Biochar for Environmental Management Science and Technology; Lehmann, J., Joseph, S., Eds.; Earthscan: London, UK, 2009; Chapter 15; pp. 271–287. [Google Scholar]
  13. Yao, Y.; Gao, B.; Zhang, M.; Inyang, M.; Zimmerman, A.R. Effect of biochar amendment on sorption and leaching of nitrate, ammonium, and phosphate in a sandy soil. Chemosphere 2012, 89, 1467–1471. [Google Scholar] [CrossRef]
  14. Mukherjee, A.; Zimmerman, A.R. Organic carbon and nutrient release from a range of laboratory-produced biochars and biochar–soil mixtures. Geoderma 2013, 193–194, 122–130. [Google Scholar] [CrossRef]
  15. Horel, Á.; Tóth, E.; Gelybó, G.; Dencső, M.; Potyó, I. Soil CO2 and N2O emission drivers in a vineyard (Vitis vinifera) under different soil management systems and amendments. Sustainability 2018, 10, 1811. [Google Scholar] [CrossRef]
  16. Abel, S.; Peters, A.; Trinks, S.; Schonsky, H.; Facklam, M.; Wessolek, G. Impact of biochar and hydrochar addition on water retention and water repellency of sandy soil. Geoderma 2013, 202–203, 183–191. [Google Scholar] [CrossRef]
  17. Mohawesh, O.; Durner, W. Effect of bentonite, hydrogel and biochar amendments on soil hydraulic properties from saturation to oven dryness. Pedosphere 2017, in press. [Google Scholar] [CrossRef]
  18. Dokoohaki, H.; Miguez, F.E.; Archontoulis, S.; Laird, D. Use of inverse modelling and Bayesian optimization for investigating the effect of biochar on soil hydrological properties. Agric. Water Manag. 2018, 208, 268–274. [Google Scholar] [CrossRef]
  19. Zhang, A.; Bian, R.; Pan, G.; Cui, L.; Hussain, Q.; Li, L.; Zheng, J.; Zheng, J.; Zhang, X.; Han, X.; et al. Effects of biochar amendment on soil quality, crop yield and greenhouse gas emission in a Chinese rice paddy: A field study of 2 consecutive rice growing cycles. Field Crops Res. 2012, 127, 153–160. [Google Scholar] [CrossRef]
  20. Randolph, P.; Bansode, R.R.; Hassan, O.A.; Rehrah, D.; Ravella, R.; Reddy, M.R.; Watts, D.W.; Novak, J.M.; Ahmedna, M. Effect of biochars produced from solid organic municipal waste on soil quality parameters. J. Environ. Manag. 2017, 192, 271–280. [Google Scholar] [CrossRef]
  21. Smith, A.K. Introduction. In Nitrous Oxide and Climate Change; Smith, K., Ed.; Earthscan LLC.: Washington, DC, USA, 2010; pp. 1–3. [Google Scholar]
  22. Smith, P.; Martino, D.; Cai, Z.; Gwary, D.; Janzen, H.; Kumar, P.; McCarl, B.; Ogle, S.; O’Mara, F.; Rice, C.; et al. Greenhouse gas mitigation in agriculture. Philos. Trans. R. Soc. B Biol. Sci. 2008, 363, 789–813. [Google Scholar] [CrossRef] [Green Version]
  23. Huang, Y.A.O.; Tang, Y. An estimate of greenhouse gas (N2O and CO2) mitigation potential under various scenarios of nitrogen use efficiency in Chinese croplands. Glob. Chang. Biol. 2010, 16, 2958–2970. [Google Scholar] [CrossRef]
  24. Tóth, E.; Gelybó, G.; Dencső, M.; Kása, I.; Birkás, M.; Horel, Á. Chapter 19—Soil CO2 emissions in a long-term tillage treatment experiment A2—Muñoz, María Ángeles. In Soil Management and Climate Change; Zornoza, R., Ed.; Academic Press: London, UK; San Diego, CA, USA, 2018; pp. 293–307. [Google Scholar]
  25. Sommer, R.; Bossio, D. Dynamics and climate change mitigation potential of soil organic carbon sequestration. J. Environ. Manag. 2014, 144, 83–87. [Google Scholar] [CrossRef] [Green Version]
  26. Raich, J.W.; Schlesinger, W.H. The global carbon dioxide flux in soil respiration and its relationship to vegetation and climate. Tellus B 1992, 44, 81–99. [Google Scholar] [CrossRef]
  27. Schlesinger, W.H.; Andrews, J.A. Soil respiration and the global carbon cycle. Biogeochemistry 2000, 48, 7–20. [Google Scholar] [CrossRef]
  28. Roberts, K.G.; Gloy, B.A.; Joseph, S.; Scott, N.R.; Lehmann, J. Life cycle assessment of biochar systems: Estimating the energetic, economic, and climate change potential. Environ. Sci. Technol. 2010, 44, 827–833. [Google Scholar] [CrossRef]
  29. Jones, D.L.; Murphy, D.V.; Khalid, M.; Ahmad, W.; Edwards-Jones, G.; DeLuca, T.H. Short-term biochar-induced increase in soil CO2 release is both biotically and abiotically mediated. Soil Biol. Biochem. 2011, 43, 1723–1731. [Google Scholar] [CrossRef]
  30. Smith, J.L.; Collins, H.P.; Bailey, V.L. The effect of young biochar on soil respiration. Soil Biol. Biochem. 2010, 42, 2345–2347. [Google Scholar] [CrossRef]
  31. Major, J.; Lehmann, J.; Rondon, M.; Goodale, C. Fate of soil-applied black carbon: Downward migration, leaching and soil respiration. Glob. Chang. Biol. 2010, 16, 1366–1379. [Google Scholar] [CrossRef]
  32. Spokas, K.A.; Reicosky, D.C. Impacts of sixteen different biochars on soil greenhouse gas production. Ann. Environ. Sci. 2009, 3, 179–193. [Google Scholar]
  33. Kolton, M.; Meller Harel, Y.; Pasternak, Z.; Graber, E.R.; Elad, Y.; Cytryn, E. Impact of biochar application to soil on the root-associated bacterial community structure of fully developed greenhouse pepper plants. Appl. Environ. Microbiol. 2011, 77, 4924–4930. [Google Scholar] [CrossRef]
  34. Mitchell, P.J.; Simpson, A.J.; Soong, R.; Simpson, M.J. Shifts in microbial community and water-extractable organic matter composition with biochar amendment in a temperate forest soil. Soil Biol. Biochem. 2015, 81, 244–254. [Google Scholar] [CrossRef]
  35. Lanza, G.; Rebensburg, P.; Kern, J.; Lentzsch, P.; Wirth, S. Impact of chars and readily available carbon on soil microbial respiration and microbial community composition in a dynamic incubation experiment. Soil Tillage Res. 2016, 164, 18–24. [Google Scholar] [CrossRef] [Green Version]
  36. Dövényi, Z. Magyarország Kistájainak Katasztere (in Hungarian); MTA Földrajztudományi Kutatóintézet: Budapest, Hungary, 2010. [Google Scholar]
  37. Schon, M.K.; Compton, M.P.; Bell, E.; Burns, I. Nitrogen concentrations affect pepper yield and leachate nitrate-nitrogen from Rockwool culture. HortScience 1994, 48, 1241–1249. [Google Scholar]
  38. Yasuor, H.; Ben-Gal, A.; Yermiyahu, U.; Beit-Yannai, E.; Cohen, S. Nitrogen management of greenhouse pepper production: Agronomic, nutritional, and environmental implications. HortScience 2013, 50, 1688–1693. [Google Scholar]
  39. Shackley, S. The economic viability and propspects for biochar in Europe: Shifting paradigms in uncertain times. In Biochar in European Soils and Agriculture. Science and Practice; Shackley, S., Ruysschaert, G., Zwart, K., Glaser, B., Eds.; Routledge: London, UK, 2016; pp. 205–226. [Google Scholar]
  40. Horel, A.; Potyó, I.; Szili-Kovács, T.; Molnár, S. Potential nitrogen fixation changes under different land uses as influenced by seasons and biochar amendments. Arab. J. Geosci. 2018, 11, 559. [Google Scholar] [CrossRef]
  41. Flexas, J.; Escalona, J.M.; Medrano, H. Water stress induces different levels of photosynthesis and electron transport rate regulation in grapevines. Plant Cell Environ. 1999, 22, 39–48. [Google Scholar] [CrossRef] [Green Version]
  42. Simunek, J.; Sejna, M.; van Genuchten, M.T. The HYDRUS Software Package for Simulating the Two- and Three-Dimensional Movement of Water, Heat, and Multiple Solutes in Variably-Saturated Media; PC-Progress: Prague, Czech Republic, 2007. [Google Scholar]
  43. Feddes, R.A.; Hoff, H.; Bruen, M.; Dawson, T.; DeRosnay, P.; Dirmeyer, P.; Jackson, R.B.; Kabat, P.; Kleidon, A.; Lilly, A.; et al. Modeling root water uptake in hydrological and climate models. Bull. Am. Meteorol. Soc. 2001, 82, 2797–2809. [Google Scholar] [CrossRef]
  44. Moriasi, D.N.; Arnold, J.G.; Van Liew, M.W.; Bingner, R.L.; Harmel, R.D.; Veith, T.L. Model evaluation guidelines for systematic quantification of accuracy in watershed simulations. Trans. ASABE 2007, 50, 885–900. [Google Scholar] [CrossRef]
  45. Ruser, R.; Flessa, H.; Russow, R.; Schmidt, G.; Buegger, F.; Munch, J.C. Emission of N2O, N2 and CO2 from soil fertilized with nitrate: Effect of compaction, soil moisture and rewetting. Soil Biol. Biochem. 2006, 38, 263–274. [Google Scholar] [CrossRef]
  46. Wan, S.; Norby, R.J.; Ledford, J.; Weltzin, J.F. Responses of soil respiration to elevated CO2, air warming, and changing soil water availability in a model old-field grassland. Glob. Chang. Biol. 2007, 13, 2411–2424. [Google Scholar] [CrossRef]
  47. Da Silva, A.P.; Imhoff, S.; Corsi, M. Evaluation of soil compaction in an irrigated short-duration grazing system. Soil Tillage Res. 2003, 70, 83–90. [Google Scholar] [CrossRef]
  48. Bulinski, J.; Sergiel, L. Effect of moisture content on soil density—Compaction relation during soil compacting in the soil bin. Ann. Wars. Univ. Life Sci. 2014, 64, 5–13. [Google Scholar]
  49. Barnes, R.T.; Gallagher, M.E.; Masiello, C.A.; Liu, Z.; Dugan, B. Biochar-induced changes in soil hydraulic conductivity and dissolved nutrient fluxes constrained by laboratory experiments. PLoS ONE 2014, 9, e108340. [Google Scholar] [CrossRef] [PubMed]
  50. Lim, T.J.; Spokas, K.A.; Feyereisen, G.; Novak, J.M. Predicting the impact of biochar additions on soil hydraulic properties. Chemosphere 2016, 142, 136–144. [Google Scholar] [CrossRef] [PubMed]
  51. Bruun, E.W.; Petersen, C.T.; Hansen, E.; Holm, J.K.; Hauggaard-Nielsen, H. Biochar amendment to coarse sandy subsoil improves root growth and increases water retention. Soil Use Manag. 2014, 30, 109–118. [Google Scholar] [CrossRef]
  52. Brockhoff, S.R.; Christians, N.E.; Killorn, R.J.; Horton, R.; Davis, D.D. Physical and mineral-nutrition properties of sand-based turfgrass root zones amended with biochar. Agron. J. 2010, 102, 1627–1631. [Google Scholar] [CrossRef]
  53. Chen, Y.; Shinogi, Y.; Taira, M. Influence of biochar use on sugarcane growth, soil parameters, and groundwater quality. Aust. J. Soil Res. 2010, 48, 526–530. [Google Scholar] [CrossRef]
  54. Linn, D.M.; Doran, J.W. Effect of water-filled pore space on carbon dioxide and nitrous oxide production in tilled and nontilled soils. Soil Sci. Soc. Am. J. 1984, 48, 1267–1272. [Google Scholar] [CrossRef]
  55. Weslien, P.; Klemedtsson, Å.K.; Börjesson, G.; Klemedtsson, L. Strong pH influence on N2O and CH4 fluxes from forested organic soils. Eur. J. Soil Sci. 2009, 60, 311–320. [Google Scholar] [CrossRef]
  56. Liu, Y.; Yang, M.; Wu, Y.; Wang, H.; Chen, Y.; Wu, W. Reducing CH4 and CO2 emissions from waterlogged paddy soil with biochar. J. Soils Sediments 2011, 11, 930–939. [Google Scholar] [CrossRef]
  57. Wang, J.; Zhang, M.; Xiong, Z.; Liu, P.; Pan, G. Effects of biochar addition on N2O and CO2 emissions from two paddy soils. Biol. Fertil. Soils 2011, 47, 887–896. [Google Scholar] [CrossRef]
Figure 1. Schematics of the experimental setup.
Agronomy 09 00058 g001
Figure 2. Overview of plant growth and maturing phases based on average tiller numbers over time. n = 8 to n = 14, ±SD. Dashed line represents the growth phase change from exponential growth to fruit development phase.
Agronomy 09 00058 g002
Figure 3. (a) Air temperature changes over time during the experiment. (b) Soil water content (SWC) changes in the different treatments over time. Values represent daily average values.
Agronomy 09 00058 g003
Figure 4. Observed and simulated soil water content (SWC) as volumetric water content (VWC) changes for the different treatments. (a) control, (b) BC0.5, (c) BC2.5, and (d) BC5.0. Grey area represents measured SWC uncertainty of 1.5%.
Agronomy 09 00058 g004aAgronomy 09 00058 g004b
Figure 5. Calculated evaporation, transpiration, and evapotranspiration time series for the control treatment, estimated using HYDRUS 1D.
Agronomy 09 00058 g005
Figure 6. Changes in volume of soil water storage over time for the different treatments, estimated using HYDRUS 1D simulation.
Agronomy 09 00058 g006
Figure 7. Soil respiration changes as (a) cumulative and (b) discrete data of measured CO2 concentrations (mg/kg) over time between the different biochar added treatments, based on 33 measurement points. n = 3; ±SD.
Agronomy 09 00058 g007
Table 1. Physical and chemical characteristics of the soil and biochar used in the experiment.
ParameterBiocharSoil
Particle size distribution<0.002 mm (%)1.5824.13
0.05–0.002 mm (%)13.950.03
2–0.5 mm (%)84.5225.84
pH10.37.97
CaCO3 (%)n.d. 110.41
TOC (%)47.31.61
VWCinitial (%)-26.5
Specific surface area (m2/g)40.816.1
1 n.d. represents not detectable value, n = 3.
Table 2. Model performance statistics for soil water changes (SWC) changes for the different treatments. RMSE refers to root square mean error and RSR stands for standard deviation ratio.
TreatmentRMSERSR
Control0.03780.1297
BC0.50.09350.4797
BC2.50.06830.2861
BC5.00.06570.2030

