Increasing Ascorbic Acid Content and Salinity Tolerance of Cherry Tomato Plants by Suppressed Expression of the Ascorbate Oxidase Gene


 ,
, 
Abstract
1. Introduction
2. Materials and Methods
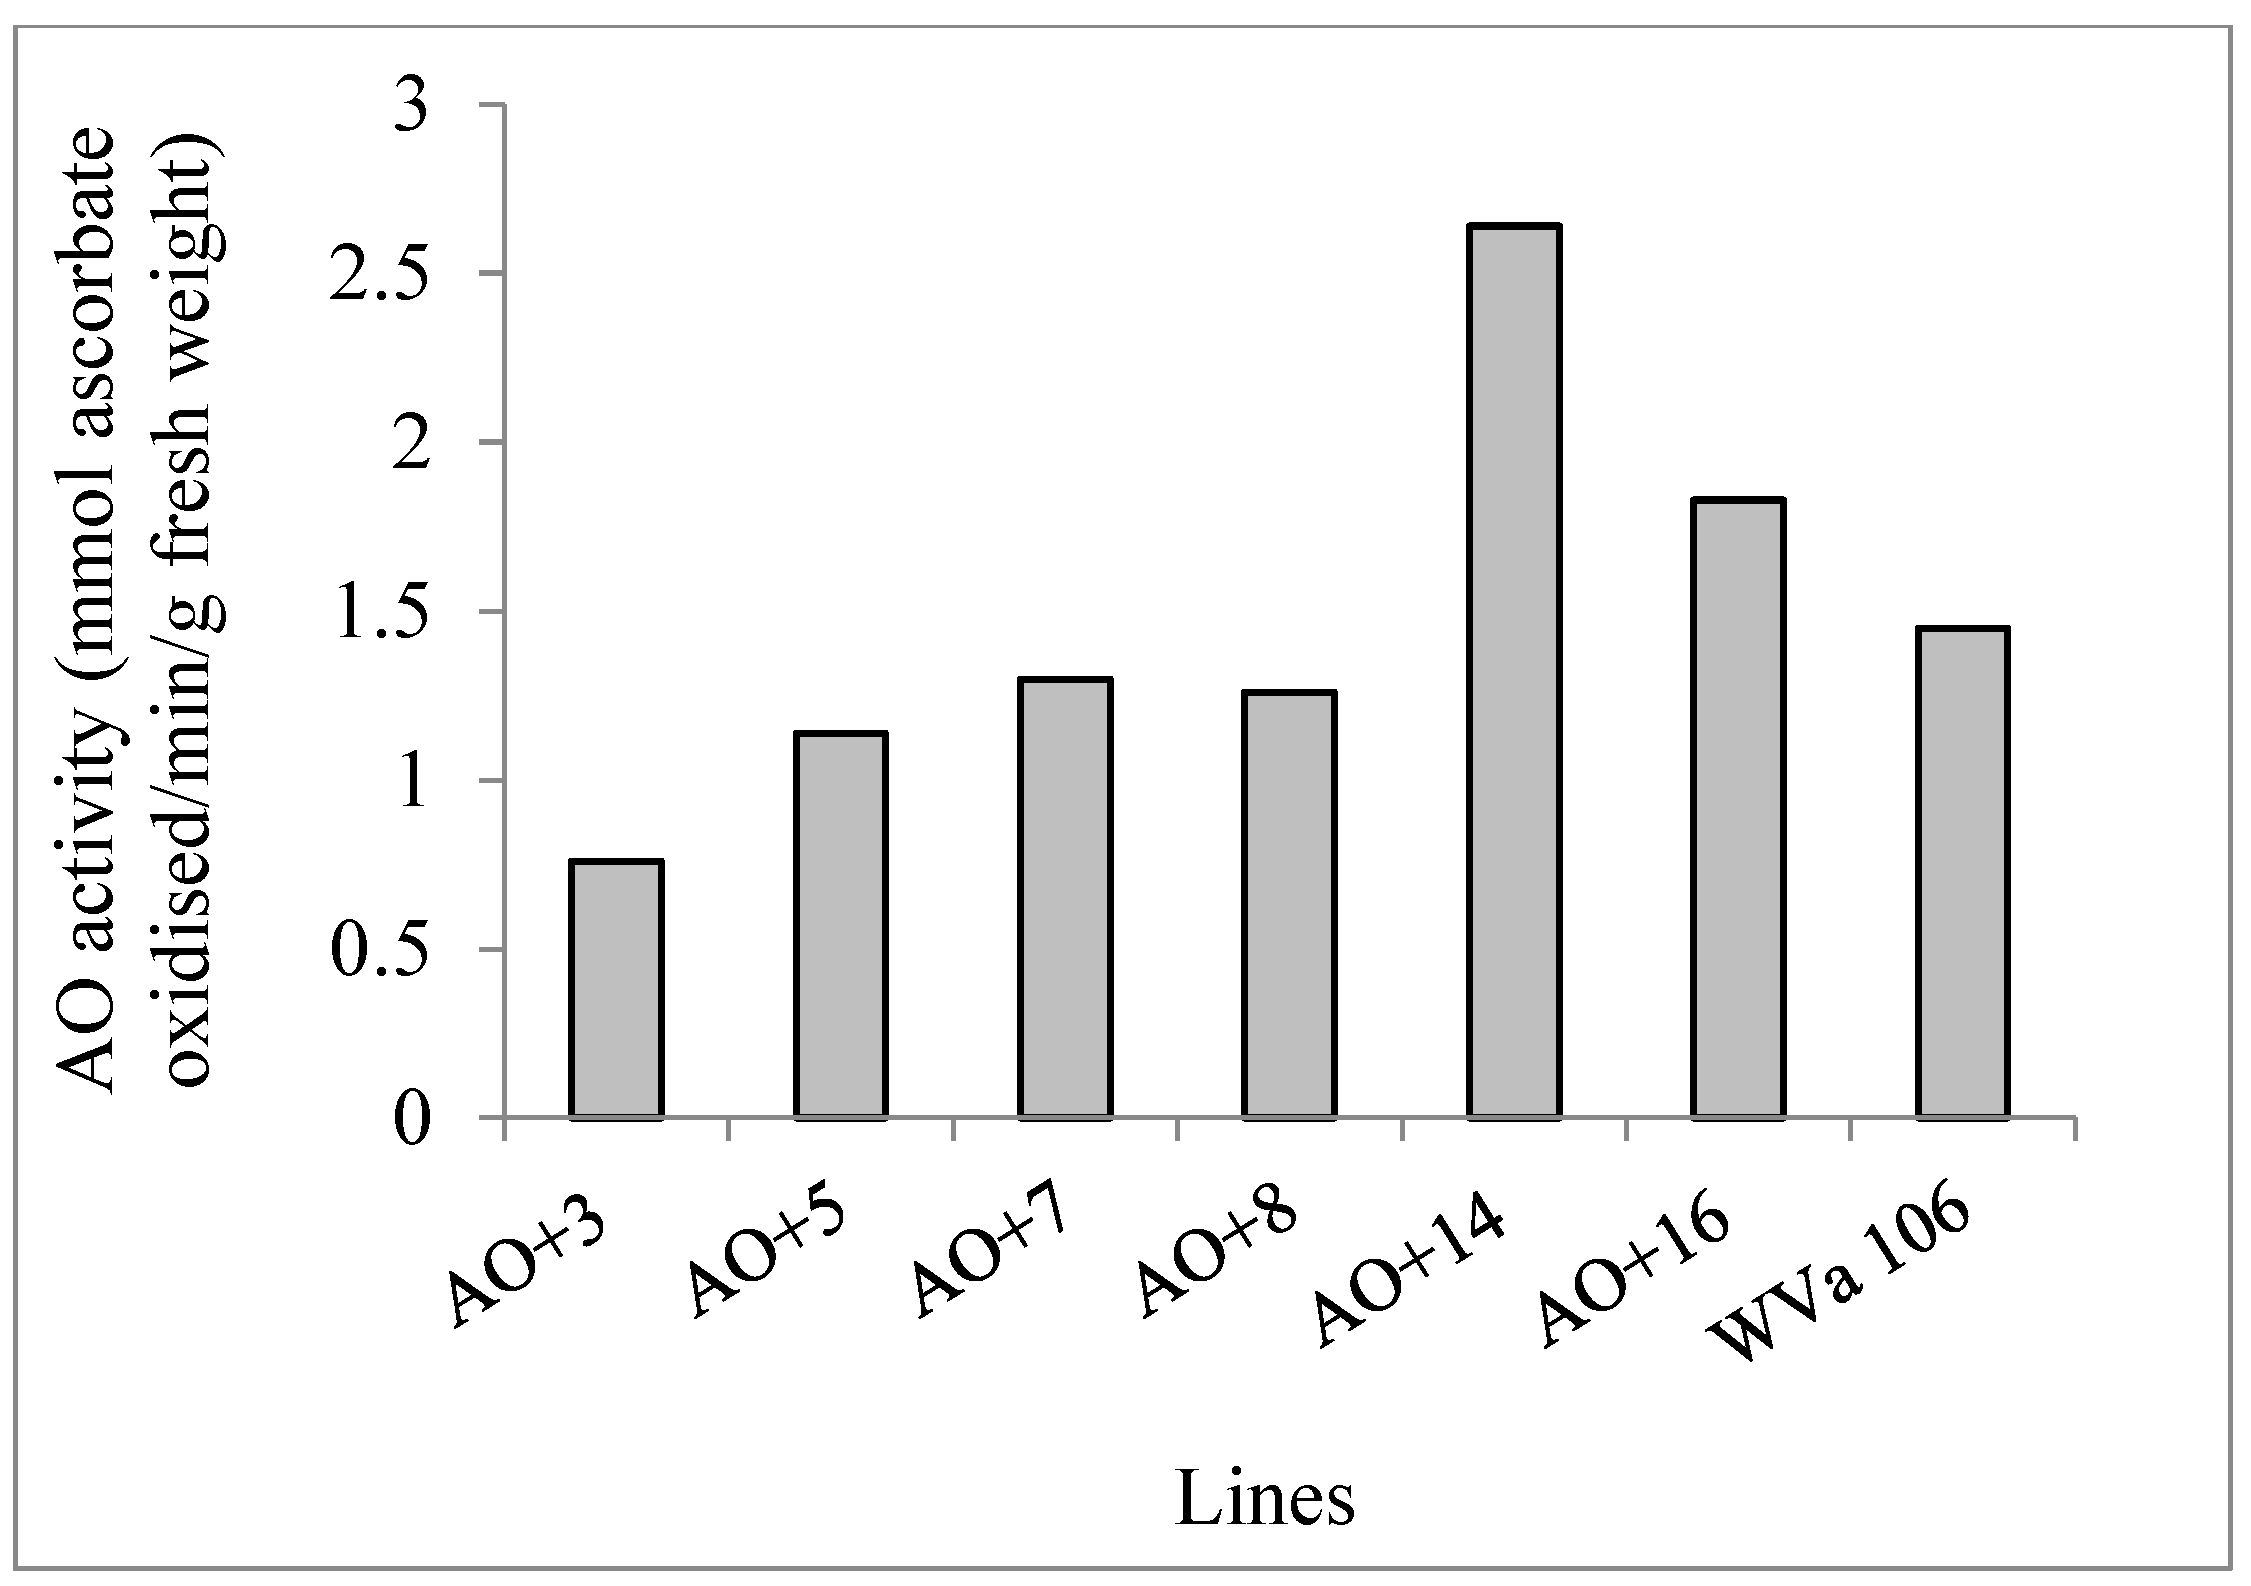
2.1. Development of Cherry Tomato Lines with Modified Ascorbate Oxidase Activity
2.2. Growth Conditions
2.3. Salinity Treatments
2.4. Plant Growth and Yield Characteristics
2.5. Determination of Chlorophyll a and b, β-carotene, Lycopene, and Ascorbic Acid
2.6. Determination of Soluble Solid Content and Firmness
2.7. Statistical Analysis
3. Results
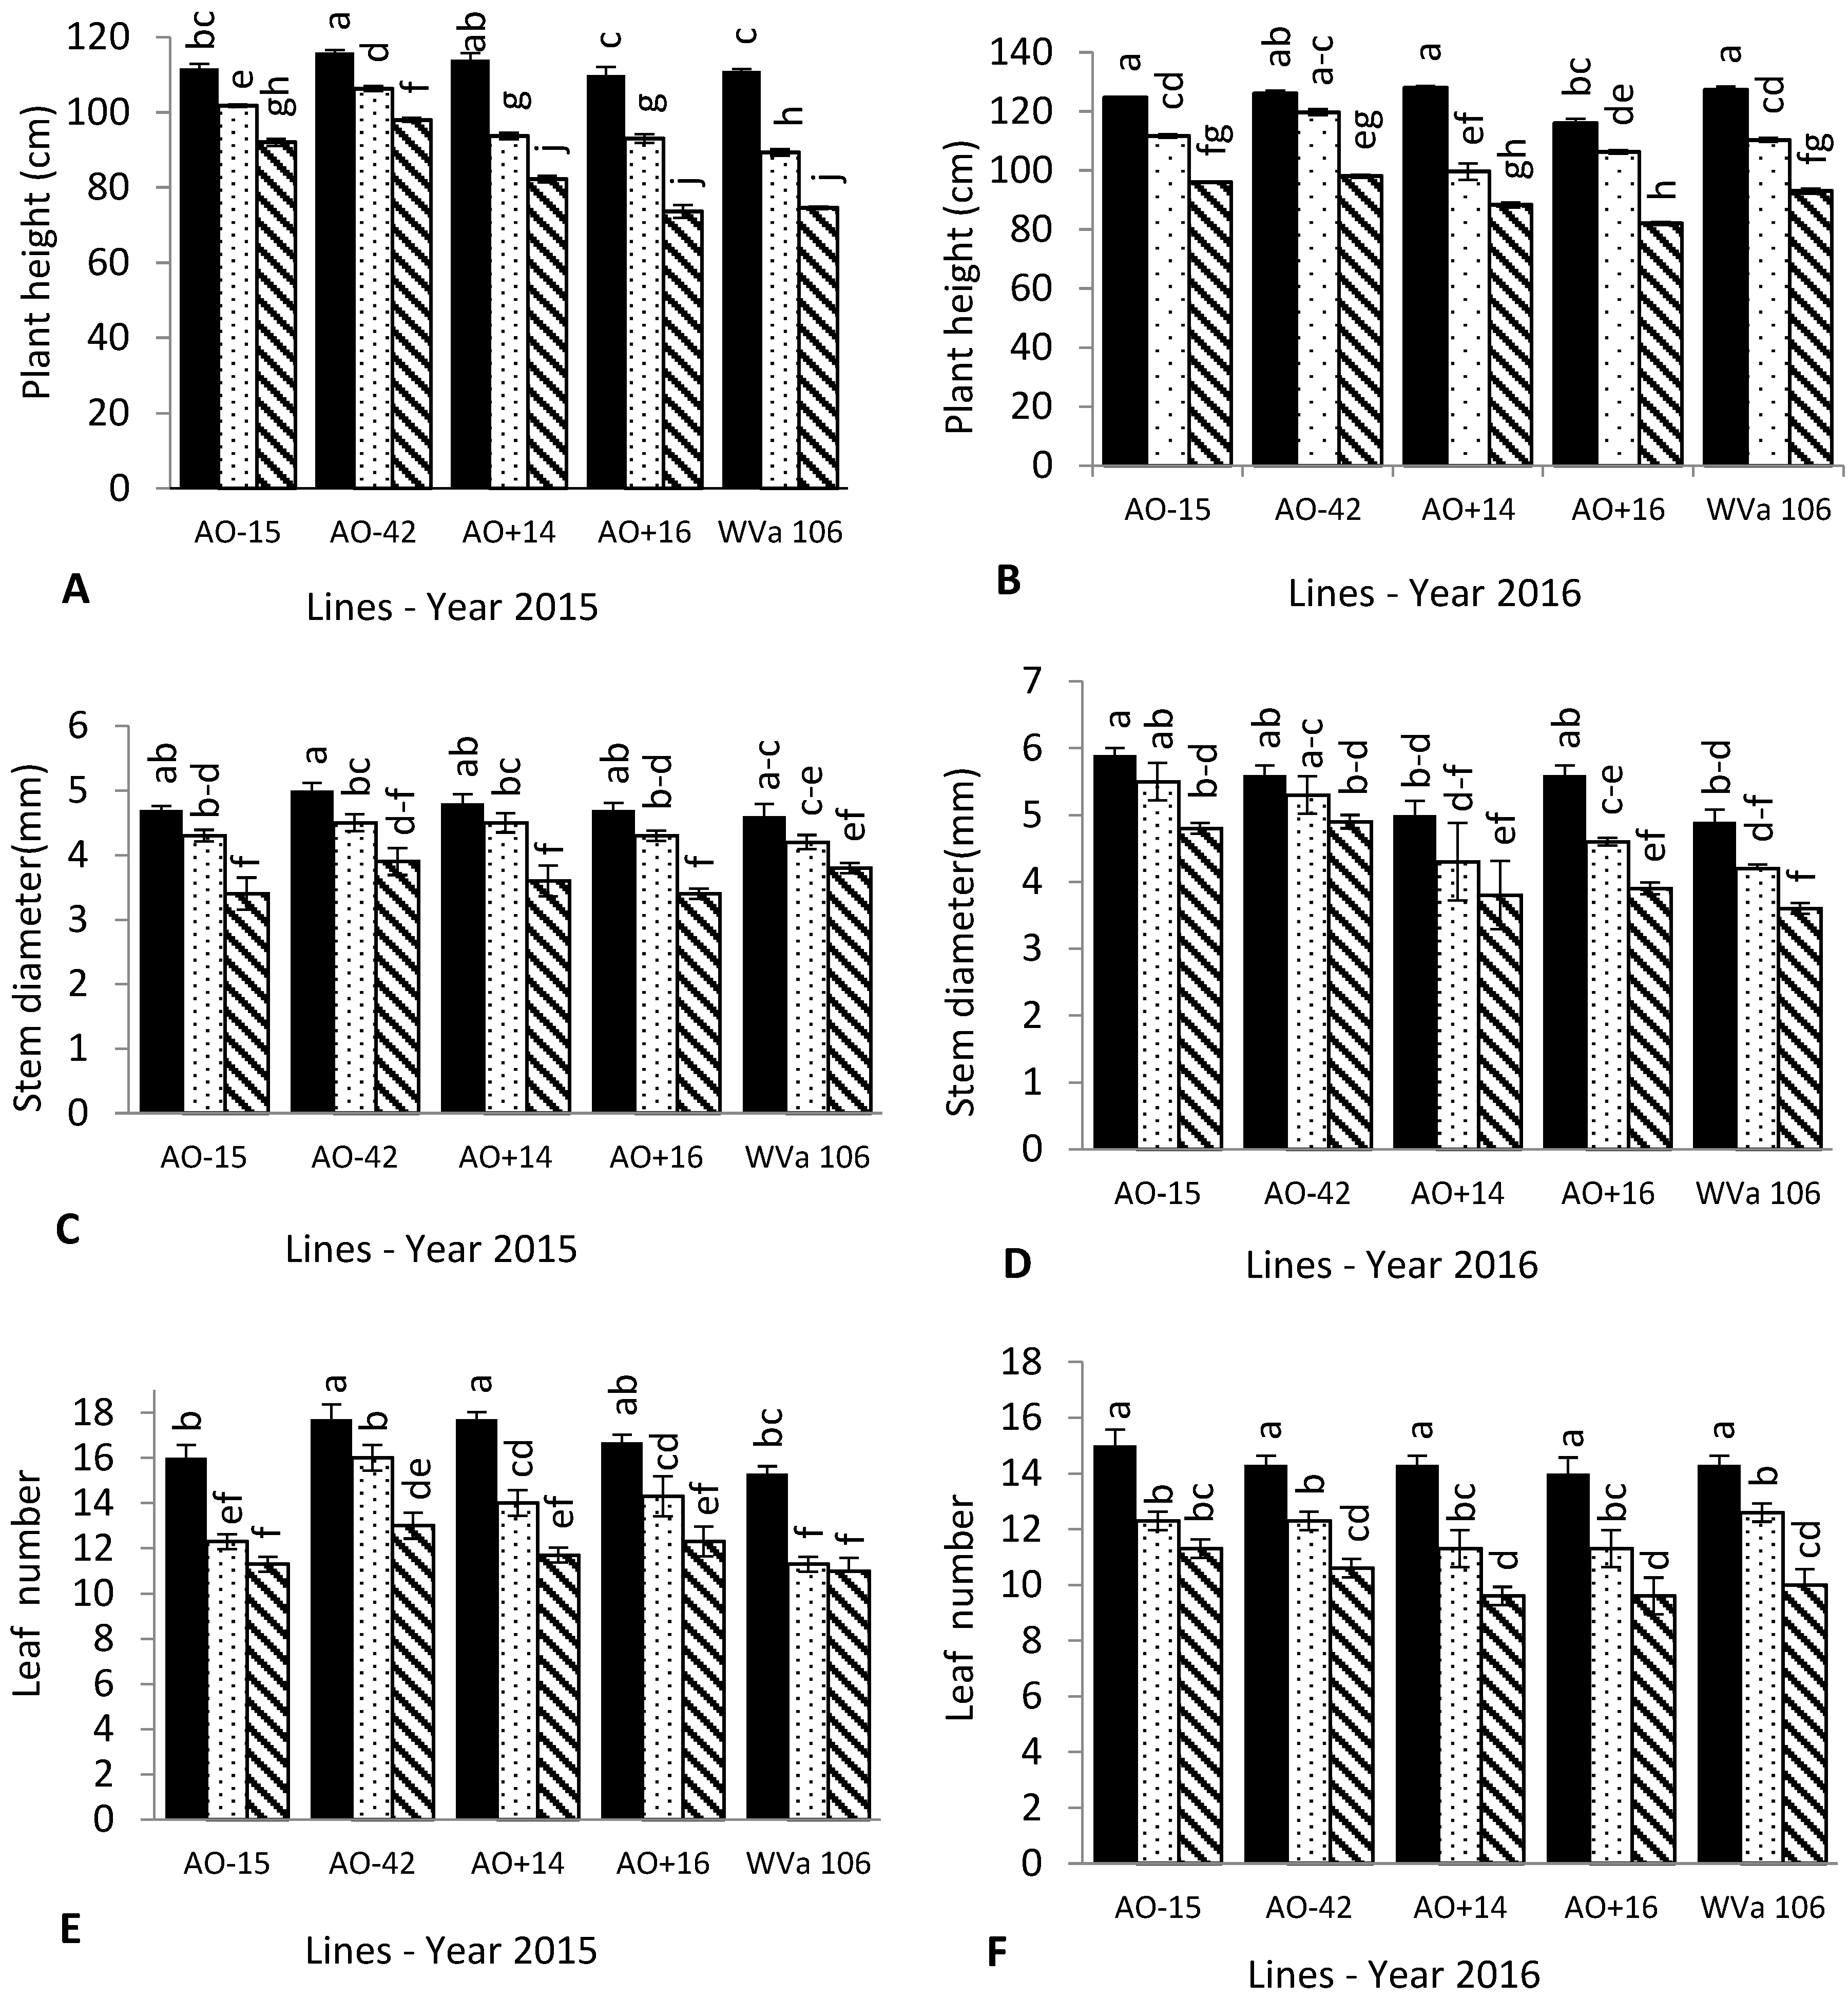
3.1. Plant Growth
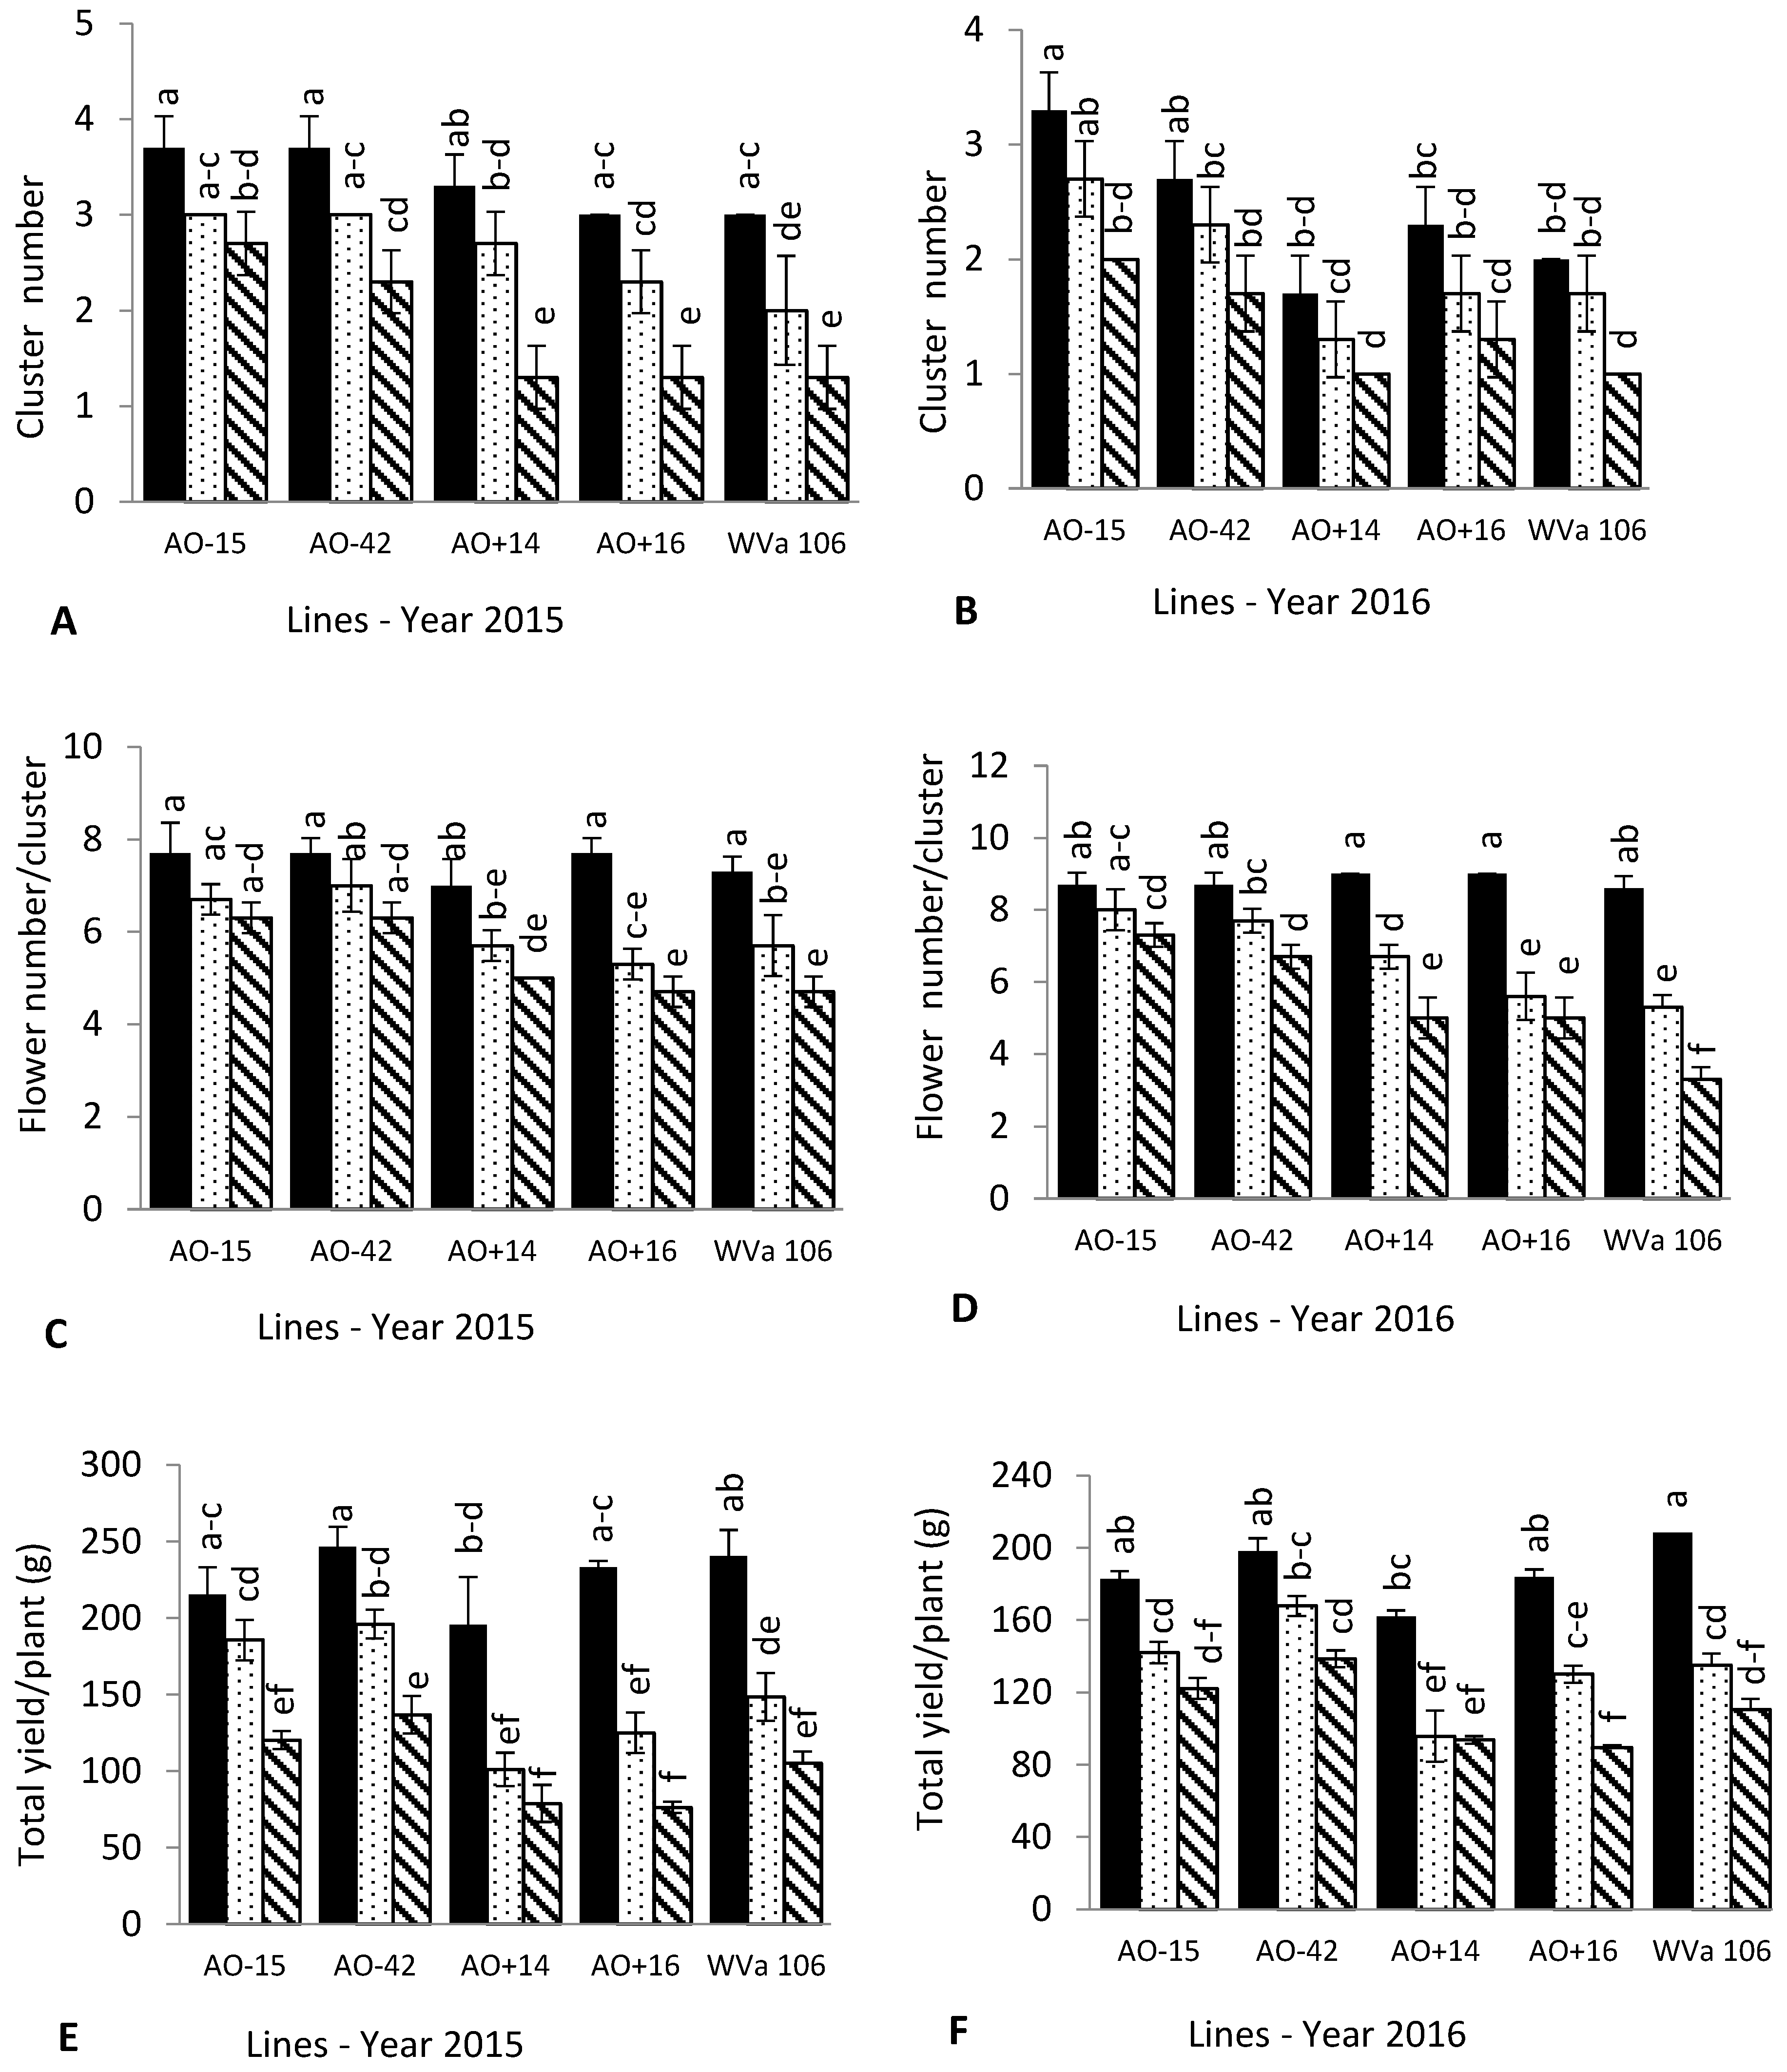
3.2. Cluster and Flower Number
3.3. Fruit Quality and Yield
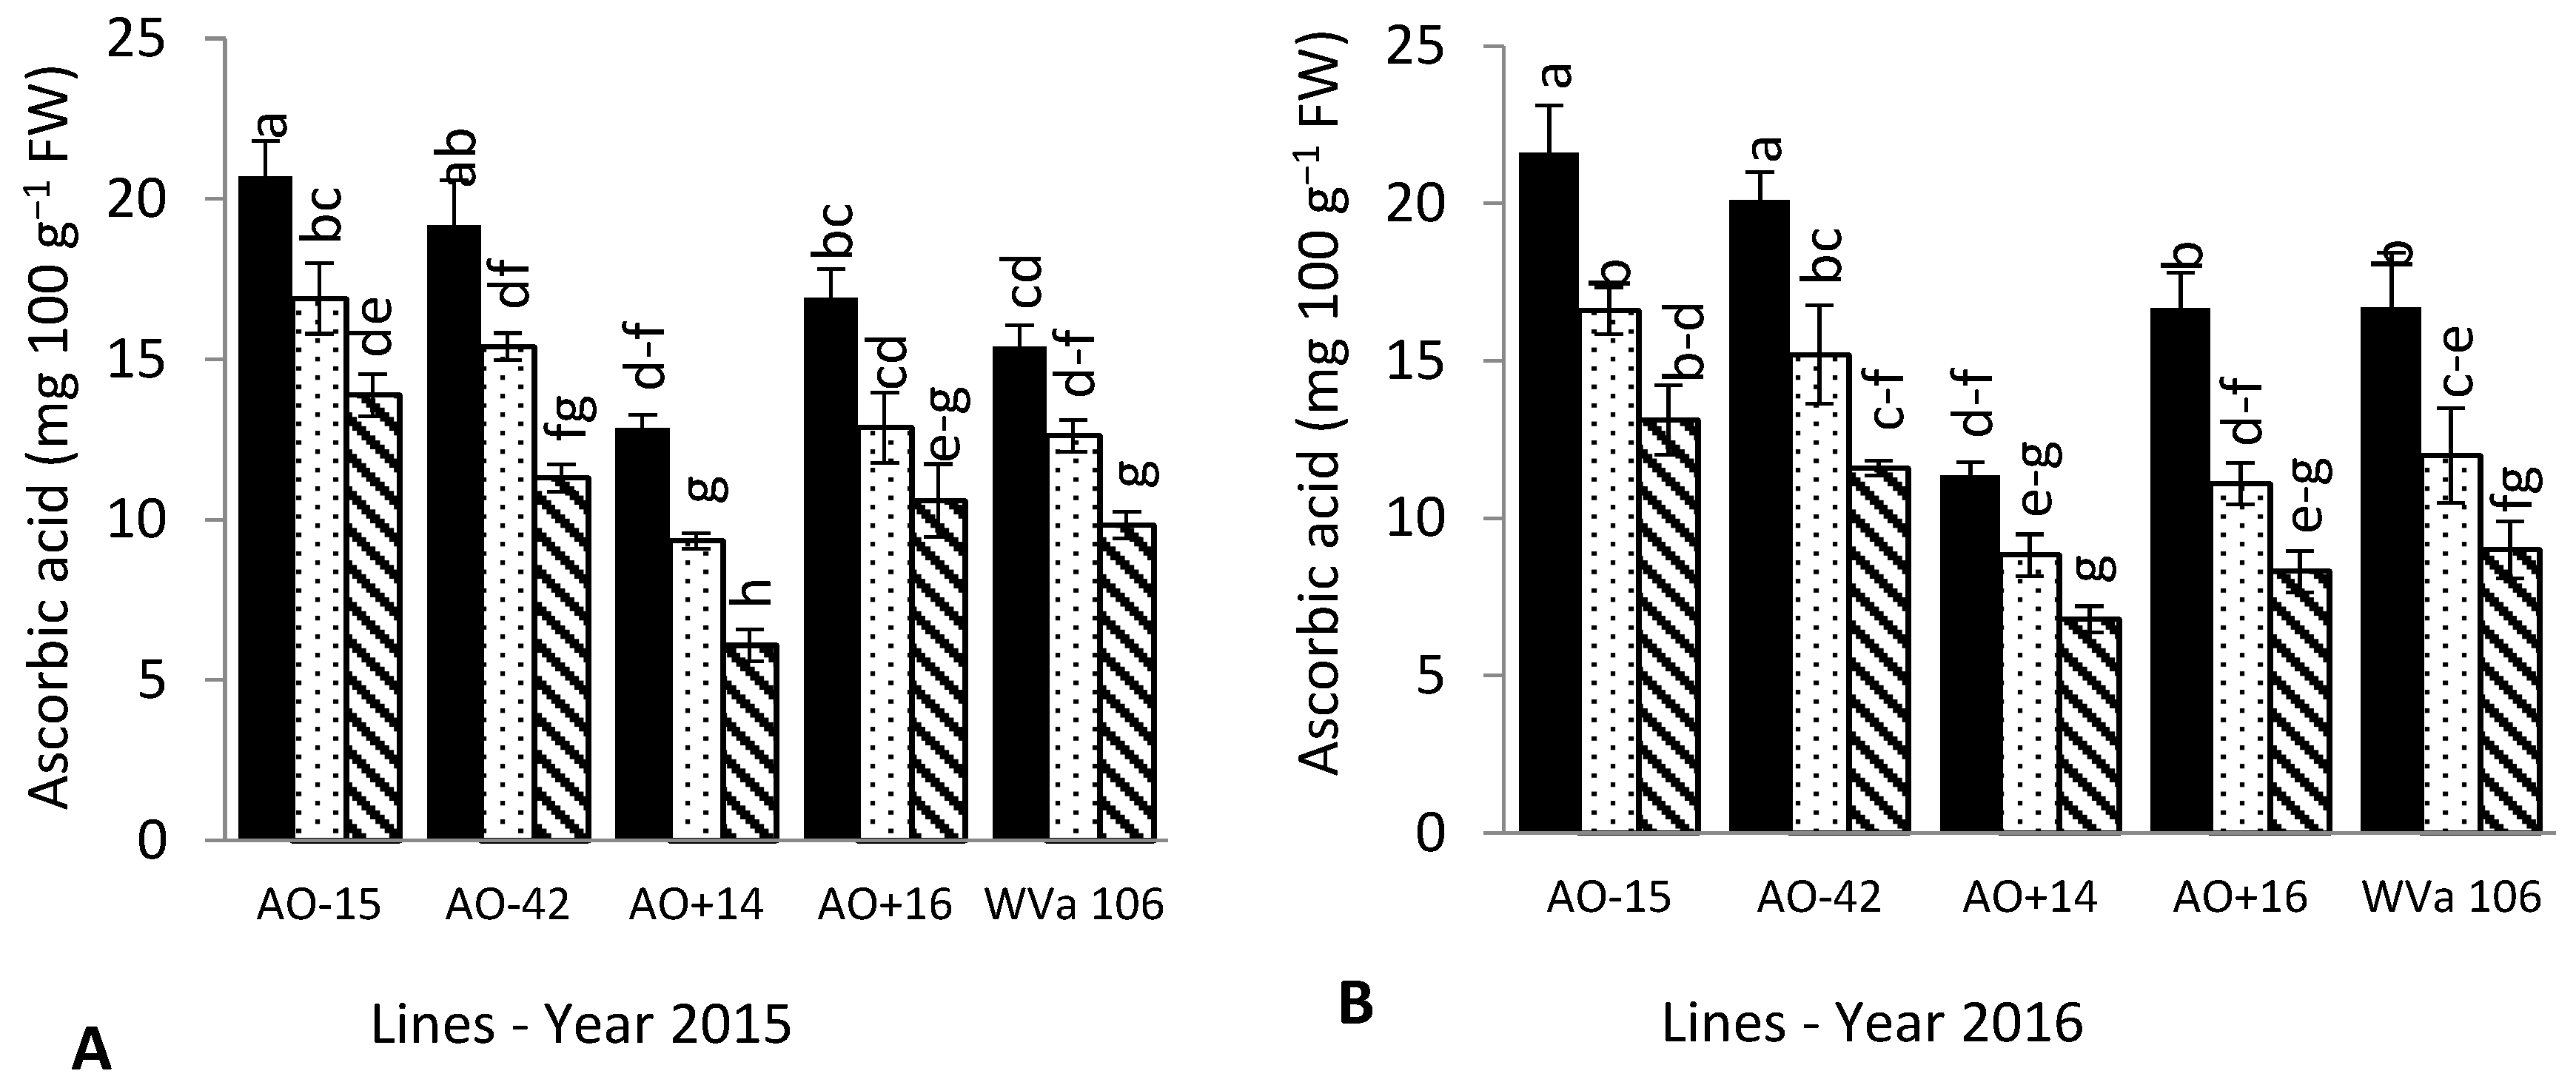
3.4. Fruit Chemical Composition
4. Discussion
5. Conclusions
Supplementary Materials
Author Contributions
Funding
Conflicts of Interest
References
- Zhang, P.; Senge, M.; Dai, Y. Effects of salinity stress at different growth stages on tomato growth, yield, and water-use efficiency. Commun. Soil Sci. Plant Anal. 2017, 48, 624–634. [Google Scholar] [CrossRef]
- Shalata, A.; Neumann, P.M. Exogenous ascorbic acid (vitamin C) increases resistance to salt stress and reduces lipid peroxidation. J. Exp. Bot. 2001, 52, 2207–2211. [Google Scholar] [CrossRef] [PubMed]
- El-Mogy, M.M.; Garchery, C.; Stevens, R. Irrigation with salt water affects growth, yield, fruit quality, storability and marker-gene expression in cherry tomato. Acta Agric. Scand. Sect. B Soil Plant Sci. 2018, 68, 727–737. [Google Scholar] [CrossRef]
- Ballon-Landa, E.; Parsons, J.K. Nutrition, physical activity, and lifestyle factors in prostate cancer prevention. Curr. Opin. Urol. 2018, 28, 55–61. [Google Scholar] [CrossRef] [PubMed]
- Gest, N.; Gautier, H.; Stevens, R. Ascorbate as seen through plant evolution: The rise of a successful molecule? J. Exp. Bot. 2013, 64, 33–53. [Google Scholar] [CrossRef] [PubMed]
- Martí, R.; Leiva-Brondo, M.; Lahoz, I.; Campillo, C.; Cebolla-Cornejo, J.; Roselló, S. Polyphenol and l-ascorbic acid content in tomato as influenced by high lycopene genotypes and organic farming at different environments. Food Chem. 2018, 239, 148–156. [Google Scholar] [CrossRef] [PubMed]
- Fotopoulos, V.; Sanmartin, M.; Kanellis, A.K. Effect of ascorbate oxidase over-expression on ascorbate recycling gene expression in response to agents imposing oxidative stress. J. Exp. Bot. 2006, 57, 3933–3943. [Google Scholar] [CrossRef]
- Dumas, Y.; Dadomo, M.; Di Lucca, G.; Grolier, P. Effects of environmental factors and agricultural techniques on antioxidantcontent of tomatoes. J. Sci. Food Agric. 2003, 83, 369–382. [Google Scholar] [CrossRef]
- Troesch, B.; Hoeft, B.; McBurney, M.; Eggersdorfer, M.; Weber, P. Dietary surveys indicate vitamin intakes below recommendations are common in representative Western countries. Br. J. Nutr. 2012, 108, 692–698. [Google Scholar] [CrossRef]
- Huang, M.; Xu, Q.; Deng, X.X. L-Ascorbic acid metabolism during fruit development in an ascorbate-rich fruit crop chestnut rose (Rosa roxburghii Tratt). J. Plant Physiol. 2014, 171, 1205–1216. [Google Scholar] [CrossRef]
- Garchery, C.; Gest, N.; Do, P.T.; Alhagdow, M.; Baldet, P.; Menard, G.; Rothan, C.; Massot, C.; Gautier, H.; Aarrouf, J.; et al. A diminution in ascorbate oxidase activity affects carbon allocation and improves yield in tomato under water deficit. Plant Cell Environ. 2013, 36, 159–175. [Google Scholar] [CrossRef] [PubMed]
- Ioannidi, E.; Kalamaki, M.S.; Engineer, C.; Pateraki, I.; Alexandrou, D.; Mellidou, I.; Giovannonni, J.; Kanellis, A.K. Expression profiling of ascorbic acid-related genes during tomato fruit development and ripening and in response to stress conditions. J. Exp. Bot. 2009, 60, 663–678. [Google Scholar] [CrossRef] [PubMed]
- Yamamoto, A.; Bhuiyan, M.N.; Waditee, R.; Tanaka, Y.; Esaka, M.; Oba, K.; Jagendorf, A.T.; Takabe, T. Suppressed expression of the apoplastic ascorbate oxidase gene increases salt tolerance in tobacco and Arabidopsis plants. J. Exp. Bot. 2005, 56, 1785–1796. [Google Scholar] [CrossRef] [PubMed]
- Hamza, S.; Chupeau, Y. Re-evaluation of conditions for plant regeneration and agrobacterium-mediated transformation from tomato (Lycopersicon esculentum). J. Exp. Bot. 1993, 44, 1837–1845. [Google Scholar] [CrossRef]
- Strain, H.H.; Svec, W.A. Extraction, separation estimation and isolation of chlorophylls. In The Chlorophylls; Vernon, L.P., Seely, G.R., Eds.; Academic Press: Cambridge, UK, 1966; pp. 21–66. [Google Scholar]
- Nagata, M.; Yamashita, I. Simple Method for Simultaneous Determination of chlorophyll and carotenoids in tomato fruit. Nippon Shokuhin Kogyo Gakkaishi 1992, 39, 925–928. [Google Scholar] [CrossRef]
- Association of Official Analytical Chemistry (AOAC). Official Methods of Analysis of AOAC International, 17th ed.; AOAC: Gaithersburg, MD, USA, 2000. [Google Scholar]
- Shiyab, S.M.; Shatnawi, M.A.; Shibli, R.A.; Al Smeirat, N.G.; Ayad, J.; Akash, M.W. Growth, nutrient acquisition, and physiological responses of hydroponic grown tomato to sodium chloride salt induced stress. J. Plant Nutr. 2013, 36, 665–676. [Google Scholar] [CrossRef]
- Psarras, G.; Bertaki, M.; Chartzoulakis, K. Response of greenhouse tomato to salt stress and K+ supplement. Plant Biosyst. Int. J. Deal. All Asp. Plant Biol. 2008, 142, 149–153. [Google Scholar] [CrossRef]
- Chaichi, M.R.; Keshavarz-Afshar, R.; Lu, B.; Rostamza, M. Growth and nutrient uptake of tomato in response to application of saline water, biological fertilizer, and surfactant. J. Plant Nutr. 2017, 40, 457–466. [Google Scholar] [CrossRef]
- Ushimaru, T.; Nakagawa, T.; Fujioka, Y.; Daicho, K.; Naito, M.; Yamauchi, Y.; Nonaka, H.; Amako, K.; Yamawaki, K.; Murata, N. Transgenic Arabidopsis plants expressing the rice dehydroascorbate reductase gene are resistant to salt stress. J. Plant Physiol. 2006, 163, 1179–1184. [Google Scholar] [CrossRef]
- Jacobs, T. Why do plant cells divide? Plant Cell 1997, 9, 1021–1029. [Google Scholar] [CrossRef]
- Kato, N.; Esaka, M. Changes in ascorbate oxidase gene expression and ascorbate levels in cell division and cell elongation in tobacco cells. Physiol. Plant. 1999, 105, 321–329. [Google Scholar] [CrossRef]
- Pastori, G.M.; Kiddle, G.; Antoniw, J.; Bernard, S.; Veljovic-Jovanovic, S.; Verrier, P.J.; Noctor, G.; Foyer, C.H. Leaf vitamin C contents modulate plant defense transcripts and regulate genes that control development through hormone signaling. Plant Cell 2003, 15, 939–951. [Google Scholar] [CrossRef] [PubMed]
- Munns, R.; Tester, M. Mechanisms of salinity tolerance. Annu. Rev. Plant Biol. 2008, 59, 651–681. [Google Scholar] [CrossRef] [PubMed]
- Assimakopoulou, A.; Nifakos, K.; Salmas, I.; Kalogeropoulos, P. Growth, ion uptake, and yield responses of three indigenous small-sized greek tomato (Lycopersicon esculentum L.) cultivars and four hybrids of cherry tomato under NaCl salinity stress. Commun. Soil Sci. Plant Anal. 2015, 46, 2357–2377. [Google Scholar] [CrossRef]
- Barth, C.; De Tullio, M.; Conklin, P.L. The role of ascorbic acid in the control of flowering time and the onset of senescence. J. Exp. Bot. 2006, 57, 1657–1665. [Google Scholar] [CrossRef] [PubMed]
- Fatma, E.; El-Quesni, M.; El-Aziz, A.; Nahed, G.; Kandil, M.M. Some studies on the effect of ascorbic acid and α-tocopherol on the growth and some chemical composition of Hibiscus rosasineses L. at Nubaria. Ozean J. Appl. Sci. 2009, 2, 159–167. [Google Scholar]
- Del Amor, F.M.; Martinez, V.; Cerda, A. Salt tolerance of tomato plants as affected by stage of plant development. HortScience 2001, 36, 1260–1263. [Google Scholar]
- Smirnoff, N. Ascorbic acid: Metabolism and functions of a multi-facetted molecule. Curr. Opin. Plant Biol. 2000, 3, 229–235. [Google Scholar] [CrossRef]
- Serio, F.; Gara, L.D.; Caretto, S.; Leo, L.; Santamaria, P. Influence of an increased NaCl concentration on yield and quality of cherry tomato grown in posidonia (Posidonia oceanica (L) Delile). J. Sci. Food Agric. 2004, 84, 1885–1890. [Google Scholar] [CrossRef]
- Dorais, M.; Turcotte, G.; Papadopoulos, A.P.; Hao, X.; Gosselin, A. Control of tomato fruit quality and flavor by EC and water management. In Agriculture and Agri-Food Canada Report; Agriculture and Agri-Food Canada: Ottawa, ON, Cananda, 2000; pp. 18–21. [Google Scholar]
- Lester, G.E. Environmental regulation of human health nutrients (ascorbic acid, 13-carotene, and folic acid) in fruits and vegetables. HortScience 2006, 78596, 59–64. [Google Scholar]
- Zhang, Y.; Li, H.; Shu, W.; Zhang, C.; Zhang, W.; Ye, Z. Suppressed expression of ascorbate oxidase gene promotes ascorbic acid accumulation in tomato fruit. Plant Mol. Biol. Rep. 2011, 29, 638–645. [Google Scholar] [CrossRef]
- Barbagallo, R.N.; Di Silvestro, I.; Patane, C. Yield, physicochemical traits, antioxidant pattern, polyphenol oxidase activity and total visual quality of field-grown processing tomato cv. Brigade as affected by water stress in Mediterranean climate. J. Sci. Food Agric. 2013, 93, 1449–1457. [Google Scholar] [CrossRef] [PubMed]
- Pascale, S.D.; Maggio, A.; Fogliano, V.; Ambrosino, P.; Ritieni, A. Irrigation with saline water improves carotenoids content and antioxidant activity of tomato. J. Hortic. Sci. Biotechnol. 2001, 76, 447–453. [Google Scholar] [CrossRef]
- Taber, H.; Perkins-Veazie, P.; Li, S.; White, W.; Rodermel, S.; Xu, Y. Enhancement of tomato fruit lycopene by potassium is cultivar dependent. HortScience 2008, 43, 159–165. [Google Scholar]
- Ali, H.E.M.; Ismail, G.S.M. Tomato fruit quality as influenced by salinity and nitric oxide. Turk. J. Bot. 2014, 38, 122–129. [Google Scholar] [CrossRef]
- Riggi, E.; Patanè, C.; Ruberto, G. Content of carotenoids at different ripening stages in processing tomato in relation to soil water availability. Aust. J. Agric. Res. 2008, 59, 348–353. [Google Scholar] [CrossRef]
- Moya, C.; Oyanedel, E.; Verdugo, G. Increased electrical conductivity in nutrient solution management enhances dietary and organoleptic qualities in soilless culture tomato. HortScience 2017, 52, 868–872. [Google Scholar] [CrossRef]
- Huang, C.; Peng, F.; You, Q.; Xue, X.; Wang, T.; Liao, J. Growth, yield and fruit quality of cherry tomato irrigated with saline water at different developmental stages. Acta Agric. Scand. Sect. B Soil Plant Sci. 2016, 66, 317–324. [Google Scholar] [CrossRef]
- Al-Ismaily, S.S.; Al-Yahyai, R.A.; Al-Rawahy, S.A. Mixed fertilizer can improve fruit yield and quality of field-grown tomatoes irrigated with saline water. J. Plant Nutr. 2014, 37, 1981–1996. [Google Scholar] [CrossRef]
- Ruiz, M.S.; Yasuor, H.; Ben-Gal, A.; Yermiyahu, U.; Saranga, Y.; Elbaum, R. Salinity induced fruit hypodermis thickening alters the texture of tomato (Solanum lycopersicum Mill) fruits. Sci. Hortic. 2015, 192, 244–249. [Google Scholar] [CrossRef]
- Petersen, K.K.; Willumsen, J.; Kaack, K. Composition and taste of tomatoes as affected by increased salinity and different salinity sources. J. Hortic. Sci. Biotechnol. 1998, 73, 205–215. [Google Scholar] [CrossRef]


| Phenotype Correlated with AA | R Values | |
|---|---|---|
| 2015 | 2016 | |
| Plant height (cm) | 0.663 ** | 0.694 ** |
| Stem diameter (mm) | 0.552 ** | 0.608 ** |
| Leaf number | 0.622 ** | 0.622 ** |
| Cluster number | 0.625 ** | 0.553 ** |
| Flower number | 0.565 ** | 0.672 ** |
| Fruit weight (g) | 0.603 ** | 0.543 ** |
| Fruit diameter (mm) | 0.455 ** | 0.429 ** |
| Yield (g plant−1) | 0.732 ** | 0.760 ** |
| Lycopene (μg g−1 fw) | 0.722 ** | 0.791 ** |
| ß- carotene (μg g−1 fw) | 0.647 ** | 0.608 ** |
| Lines | 2015 | 2016 | ||||
|---|---|---|---|---|---|---|
| 0 mM | 75 mM | 150 mM | 0 mM | 75 mM | 150 mM | |
| AO−15 | 25.94 ± 1.11 a | 25.10 ± 0.11 ab | 21.44 ± 1.0 c–e | 21.90 ± 0.75 ab | 21.10 ± 0.59 a–c | 20.51 ± 0.87 bc |
| AO−42 | 25.42 ± 0.45 a | 25.32 ± 0.3 a | 19.31 ± 0.81 ef | 21.12 ± 0.32 a–c | 17.25 ± 0.75 d | 17.14 ± 0.44 d |
| AO+14 | 25.18 ± 1.2 ab | 19.86 ± 0.95 de | 15.10 ± 0.56 g | 22.61 ± 0.84 a | 17.78 ± 0.53 d | 16.37 ± 0.15 de |
| AO+16 | 22.37 ± 1.14 b–d | 19.91 ± 1.81 de | 16.74 ± 0.21 fg | 20.44 ± 0.37 bc | 16.24 ± 0.23 de | 16.65 ± 0.61 de |
| WVa106 | 23.25 ± 1.05 a–c | 15.24 ± 1.02 g | 14.71 ± 0.42 g | 19.52 ± 0.37 c | 16.59 ± 0.73 de | 15.23 ± 0.55 e |
| Lines | 2015 | 2016 | ||||
|---|---|---|---|---|---|---|
| 0 mM | 75 mM | 150 mM | 0 mM | 75 mM | 150 mM | |
| AO−15 | 4.37 ± 0.31a | 3.58 ± 0.81 ab | 3.12 ± 0.42 ab | 3.90 ± 0.43 ab | 3.10 ± 0.18 b | 2.00 ± 0.15 c |
| AO−42 | 3.62 ± 0.35 a | 3.47 ± 0.65 ab | 3.00 ± 0.46ab | 4.20 ± 0.26 a | 3.30 ± 0.27 ab | 2.10 ± 0.27 c |
| AO+14 | 3.88 ± 0.56 a | 1.66 ± 0.48 cd | 1.62 ± 0.01 cd | 3.60 ± 0.28 ab | 2.00 ± 0.21 c | 1.50 ± 0.21 c |
| AO+16 | 3.00 ± 0.53 a–c | 1.95 ± 0.12 cd | 1.71 ± 0.15 cd | 3.40 ± 0.23 ab | 1.80 ± 0.15 c | 1.70 ± 0.12 c |
| WVa106 | 3.86 ± 0.82 a | 1.58 ± 0.49 cd | 1.08 ± 0.49 d | 3.90 ± 0.42 ab | 2.10 ± 0.20 c | 1.09 ± 0.50 c |
| Lines | 2015 | 2016 | ||||
|---|---|---|---|---|---|---|
| 0 mM | 75 mM | 150 mM | 0 mM | 75 mM | 150 mM | |
| AO−15 | 6.00 ± 0.57 ef | 7.04 ± 0.28 b–d | 7.76 ± 0.15 ab | 6.33 ± 0.24 ef | 6.70 ± 0.37 de | 7.31 ± 0.25 cd |
| AO−42 | 7.00 ± 0.21 b–d | 7.33 ± 0.17a–c | 7.99 ± 0.14 a | 6.72 ± 0.23 de | 7.85 ± 0.37 a–c | 8.46 ± 0.27 a |
| AO+14 | 6.26 ± 0.08 d–f | 6.96 ± 0.27 b–d | 7.43 ± 0.05 a–c | 6.57 ± 0.08 e | 6.97 ± 0.2 de | 7.33 ± 0.08 b–d |
| AO+16 | 5.93 ± 0.16 ef | 6.43 ± 0.06 de | 6.93 ± 0.08 b–d | 5.31 ± 0.16 g | 6.30 ± 0.05 ef | 8.07 ± 0. 2 ab |
| WVa106 | 5.6 ± 0.201 f | 6.56 ± 0.24 de | 7.01 ± 0.31 b–d | 5.70 ± 0.14 fg | 6.41 ± 0.24 e | 7.71 ± 0.12 a–c |
| Lines | 2015 | 2016 | ||||
|---|---|---|---|---|---|---|
| 0 mM | 75 mM | 150 mM | 0 mM | 75 mM | 150 mM | |
| AO−15 | 0.43 ± 0.01 a–c | 0.42 ± 0.01 a–c | 0.51 ± 0.01 a | 0.36 ± 0.01 f–h | 0.41 ± 0.01 c–e | 0.50 ± 0.02 ab |
| AO−42 | 0.31 ± 0.01 cd | 0.41 ± 0.01 a–d | 0.48 ± 0.01 ab | 0.35 ± 0.01 fg | 0.40 ± 0.02 c–f | 0.53 ± 0.01 a |
| AO+14 | 0.36 ± 0.01 b–d | 0.38 ± 0.09 a–d | 0.41 ± 0.1 a–d | 0.36 ± 0.05 gh | 0.36 ± 0.03 ef | 0.43 ± 0.01 cd |
| AO+16 | 0.28 ± 0.01 d | 0.31 ± 0.01 cd | 0.36 ± 0.01 b–d | 0.28 ± 0.04 h | 0.35 ± 0.01 fg | 0.45 ± 0.02 c |
| WVa106 | 0.35 ± 0.02 b–d | 0.41 ± 0.01 a–d | 0.45 ± 0.02 a–c | 0.28 ± 0.01 h | 0.38 ± 0.03 d–f | 0.38 ± 0.01 d–f |
© 2019 by the authors. Licensee MDPI, Basel, Switzerland. This article is an open access article distributed under the terms and conditions of the Creative Commons Attribution (CC BY) license (http://creativecommons.org/licenses/by/4.0/).
Share and Cite
F. Abdelgawad, K.; M. El-Mogy, M.; I. A. Mohamed, M.; Garchery, C.; G. Stevens, R. Increasing Ascorbic Acid Content and Salinity Tolerance of Cherry Tomato Plants by Suppressed Expression of the Ascorbate Oxidase Gene. Agronomy 2019, 9, 51. https://doi.org/10.3390/agronomy9020051
F. Abdelgawad K, M. El-Mogy M, I. A. Mohamed M, Garchery C, G. Stevens R. Increasing Ascorbic Acid Content and Salinity Tolerance of Cherry Tomato Plants by Suppressed Expression of the Ascorbate Oxidase Gene. Agronomy. 2019; 9(2):51. https://doi.org/10.3390/agronomy9020051
Chicago/Turabian StyleF. Abdelgawad, Karima, Mohamed M. El-Mogy, Mohamed I. A. Mohamed, Cecile Garchery, and Rebecca G. Stevens. 2019. "Increasing Ascorbic Acid Content and Salinity Tolerance of Cherry Tomato Plants by Suppressed Expression of the Ascorbate Oxidase Gene" Agronomy 9, no. 2: 51. https://doi.org/10.3390/agronomy9020051
APA StyleF. Abdelgawad, K., M. El-Mogy, M., I. A. Mohamed, M., Garchery, C., & G. Stevens, R. (2019). Increasing Ascorbic Acid Content and Salinity Tolerance of Cherry Tomato Plants by Suppressed Expression of the Ascorbate Oxidase Gene. Agronomy, 9(2), 51. https://doi.org/10.3390/agronomy9020051