Article

Synergistic Effect of Biochar and Plant Growth Promoting Rhizobacteria on Alleviation of Water Deficit in Rice Plants under Salt-Affected Soil

1
Department of Agronomy, Faculty of Agriculture, Kafrelsheikh University, Kafr El-Sheikh 33516, Egypt
2
Department of Plant Production and Protection, College of Agriculture and Veterinary Medicine, Qassim University, Burydah 51452, Saudi Arabia
3
National Water Research Center, Water Management Research Institute, Qalubia 13621/5, Egypt
4
Faculty of Agriculture, Tottori University, 4-101 Koyamach-minami, Tottori 6800000, Japan
5
Department of Microbiology, Soils, Water and Environment Research Institute, Agricultural Research Center, Giza 12112, Egypt
6
Agronomy Department, Faculty of Agriculture, Tanta University, Tanta 31527, Egypt
*
Author to whom correspondence should be addressed.
Agronomy 2019, 9(12), 847; https://doi.org/10.3390/agronomy9120847
Submission received: 23 September 2019 / Revised: 25 November 2019 / Accepted: 1 December 2019 / Published: 4 December 2019
(This article belongs to the Section Soil and Plant Nutrition)

Abstract

:
Environmental stressors negatively affect crop growth and yield. Limited information is available about the synergistic use of biochar and plant growth-promoting rhizobacteria (PGPR). A field study was conducted to evaluate the effect of biochar in combination with PGPR (Pseudomonas koreensis and Bacillus coagulans) for alleviating water deficit and saline soil in rice (Oryza sativa L.). Two growing seasons, 2017 and 2018, were examined using twelve combinations of three irrigation intervals every 6 days (I1), 8 days (I2), and 10 days (I3) and four soil treatments (control, PGPR, biochar, and combination of PGPR + biochar) in salt-affected soil. The findings exhibited that synergistic use of biochar and PGPR alleviated the negative effect of these stressors. The integrative use of biochar and PGPR caused an increment in soil moisture content and physicochemical properties. Significant increasing in chlorophyll content, relative water content, stomatal conductance, K+ and K+/Na+ contents occurred with decreasing proline content and Na+ content, which confirmed the efficacy of this approach. As a result, the highest yield and its related traits were attained when biochar and PGPR were added together under irrigation interval I1, which was on par with I2. We concluded that increased nutrients uptake (N, P, and K) were the cause of the superior rice productivity resulting from co-PGPR biochar. Synergistic use of biochar and PGPR could be an effective strategy for improving plant growth and productivity under stressors.

1. Introduction

There are some important abiotic stresses that adversely impact the global food security of a fast growing populace, which is anticipated to reach 9.6 billion by 2050 [1]. Salt-affected soil is one such abiotic stress that not only hinders the growth and productivity of plants but also degrades the soil productivity in arable croplands worldwide and particularly in arid and semi-arid regions [2]. Soils with high amounts of soluble salts (saline soils) or exchangeable sodium (sodic soils) or both (saline-sodic) adversely affect the growth of most crop plants and are collectively called salt-affected soils [3]. Salt-affected soils are described as having an electrical conductivity (EC) in the saturated soil extract of ≥4 dS m−1, and sodic soils as having an exchangeable-sodium percentage (ESP) ≥15% [4]. Around 450 Mha, 7% of the worldwide land area, is categorized as salt-affected soils with an estimated yearly increment of 1%–2% [1]. Loss of crop yield is predicted to accelerate if no action is taken to avoid land degradation due to salinity. Salt-affected soils undergo adverse changes in their osmotic and ionic properties, which can decrease water absorption and microbial activity, which, in turn, limits the uptake of essential plant nutrients (K, Ca, Mg, and P) and reduces crop yields [5]. In order to address the challenges of worldwide food security caused by salt-affected soils, it is imperative to minimize the effects of soil salinity on crops either by eliminating soluble salts and/or exchangeable Na+ or by curtailing the negative effects of salts on plants [6]. Several approaches have been used to minimize the effects of soil salinity on crops: breeding salt tolerant cultivars, applying plant growth regulators, and seed inoculation with halotolerant plant growth-promoting rhizobacteria [6]. Another crucial practice to eliminate the impact of soil salinity on plants is the addition of soil conditioners, which can both mitigate and improve the fertility of salt-affected soils [7].
The soil is also exposed to another problem due to climate changes, which cause low crop growth and productivity, such as a water deficit that might increase in the future [8]. Water constitutes between 80% to 90% of plants, it is the central molecule in all physiological processes of plants, and it is the principal means of transport for metabolites and nutrients [9]. Water deficit is one of the major sources of plant stress which has an adverse effect on plant growth and crop productivity by inhibiting leaf expansion and stomatal aperture and thus leading to lower photosynthetic rates [2]. Drought situations diminish the water potential and turgor of plants, which creates difficulties in implementing normal physiological functions [10].
Sustainable crop production relies on the interaction between salinity and soil moisture conditions. Therefore, combating water deficit and salt-affected soil simultaneously is a challenging task for attaining global food security.
Plant growth-promoting rhizobacteria (PGPR) have the potential to improve crop growth under abiotic stress by several direct and indirect mechanisms [11]. Inoculation of plants with stress-tolerant PGPR protects them from the negative impacts of stress and minimizes plant growth suppression caused by the particular stress. Exopolysaccharides (EPS) produced by bacteria improve nutrient uptake and indirectly affect N2 fixation and phosphate solubilization by binding free phosphorus in non-legumes [6]. PGPR can augment crop growth under water deficit and salt-affected soils by alleviating the negative effects of stress-induced ethylene through their 1-aminocyclopropane-1-carboxylic acid (ACC) deaminase activity, production of exopolysaccharides that bind Na+ and reduce its uptake in plants, and the up- or down-regulation of stress-responsive genes and accumulation of osmolytes [12]. If PGPR are used in association with organic amendments, they could not only increase crop production but also improve the physicochemical and biological characteristics of the soil [5].
Biochar is an activated-carbon (C) soil conditioner that is developed from the combustion of biomass in anaerobic conditions at temperatures below 1000 °C through the process of pyrolysis or dry carbonization [13]. Biochar has attracted considerable attention to ameliorating soil health, soil cation exchange capacity (CEC), soil moisture content, and augment crop productivity in rice [14]; it is typically high in ash, pH, and surface area [6]. Nowadays, waste biomass is used extensively for the production of biochar because of its cost-effectiveness and food security advantages [15]. The direct mechanism of biochar is the enhanced availability of essential nutrients in the soil, such as K+ and the lessening of Na+ absorption [16]. The indirect mechanism involves the enrichment of soil physicochemical properties, biological properties, and soil enzymatic activity, all of which increase the plant water status. [16,17] reported that biochar greatly increased the water holding capacity of soil, chlorophyll content, stomatal conductance, photosynthetic rate, and relative water content under water deficient conditions. Biochar application improved the leaf relative water content and osmotic potential under water deficient conditions in maize as compared to the control [18]. Likewise, biochar improved the water use efficiency of quinoa under water deficit [19]. This indicated that biochar response under water deficit could differ with soil and biochar type. Reports have indicated that biochar could mitigate water deficit in cereal crops when added with PGPR [20]. Inoculation of biochar with “Azosprillum sp.” further improved the growth, yield, nitrogen (N), and phosphorus (P) uptake under water deficient conditions compared to microbial inoculation only [21].
As a major staple crop, rice (Oryza sativa L.) is an important cereal, which supports more than three billion people worldwide by comprising 50% to 80% of their daily calorie intake [22]. Rice also requires a larger amount of water throughout its life cycle as compared to other crops. In Egypt, about 0.5 Mha are cultivated annually, giving a total production of 6.1 Mt [22]. Rice production is decreasing rapidly due to the negative impacts of various environmental stresses, such as water deficit and soil salinity [8]. In addition to rice yields, water deficit and salt-affected soils also influence the morphological, physiological, and biochemical characteristics of rice [23]. Therefore, it is very important to develop cost-effective technologies to ameliorate the deleterious effects of water and salt stresses on rice plants to assist with the upcoming problem of food security [24].
There is little information about the synergistic use of PGPR and biochar, particularly under water deficit and saline soil conditions in the field. Consequently, the current investigation was assumed with an intent to assess the synergistic use of biochar and PGPR for alleviating water deficit stress and saline soil by utilizing rice as a test plant. It is projected that the study results will be beneficial for formulating novel management strategies for improving growth and rice productivity under water deficit and salt-affected soil in field conditions.

2. Materials and Methods

2.1. Plant Growth Promoting Rhizobacteria Properties

A lab experiment was conducted to investigate the ability of bacterial strains to ameliorate the seed germination and growth of Rice (Oryza sativa L., cv. Sakha 105) under elevated salinity and drought stresses. For this purpose, the experiment was conducted in a completely randomized design.
PGPRs were obtained from the Department of Agricultural Microbiology, Soil, Water and Environment Research Institute (SWERI) and the Agricultural Research Centre (ARC) in Egypt. Inoculum of PGPRs (Pseudomonas koreensis MG209738, Azotobacter chroococcum SARS 10, Azospirillum lipoferum SP2, Bacillus coagulans NCAIM B 1086 and Enterobacter cloacae KX034162) were prepared by inoculating King’s B broth medium [25], for growth of P. koreensis, Jensen’s Medium [26], for growth of A. chroococcum, semi solid Malate medium [27], for growth of A. lipoferum and Nutrient Broth medium [28], for growth of B. coagulans and E. cloacae.

2.1.1. Evaluation of the Properties of Plant Growth Promoting Rhizobacteria

Under salinity stress conditions of 0, 2, 4, 6, and 8 dS m−1 of NaCl, as well as in drought stress conditions of 0%, 5%, 10%, 20% and 30% of Poly Ethylene Glycol (PEG 6000), (Dongguan Defond Dfoamer CO., Ltd. Dongguan City, Guangdong Province, China) two plant growth promotion traits were analyzed; indole acetic acid (IAA) production and inorganic phosphate solubilization. Each experiment was performed in triplicate and repeated at least three times.

2.1.2. Assay of IAA Production

The method described by [29] was used to assay indolic compounds. Briefly, 1 mL of the bacterial suspensions (1 × 10⁸ colony forming unit (CFU) mL−1) were inoculated into broth medium supplemented with 1 g L−1 filter-sterilized L-tryptophan as IAA precursors in the presence of salinity and drought stress conditions and incubated at 30 °C on a shaker at 200 rpm for 72 h. After the incubation period, bacterial cells were centrifuged at 8000 rpm for 10 min, and the supernatant was taken for IAA assay (0.5 mL of the supernatant was supplemented with 2 ml of the Salkowski Reagent), and then the pink auxin complex was read at 540 nm using UV/Visible Spectrophotometer (Bibby Scientific Ltd, Dunmow, Essex. UK, Model 6705). The concentration of IAA produced by the cultures was quantified using a calibration curve using a standard IAA and expressed as μg mL−1.

2.1.3. Assay of Phosphate Solubilizing Bacteria

Solubilization of tribasic calcium phosphate was quantitatively measured in Pikovskaya (PVK) liquid medium inoculated with 1 mL of bacterial suspensions (1 × 10⁸ CFU mL−1) in the presence of salinity and drought stress conditions and left on shaker incubator at 200 rpm and 30 °C for 5 days. The concentration of soluble phosphate was determined colorimetrically after centrifugation of liquid cultures at 5000 rpm for 15 min [30]. The absorbance of generated blue color was measured at 610 nm, and soluble phosphorus is detected from a standard curve of K2HPO4 and expressed as μg P2O5 mL−1.

2.1.4. Germination Indicators

Ten seeds of each treatment were first rinsed with 70% (v/v) ethanol and surface sterilized with diluted sodium hypochlorite (3% v/v) for 3 min and then washed five times with sterile distilled water. Seeds were soaked in bacterial suspensions (1 × 10⁸ CFU mL−1) overnight before being germinated in sterile 15-cm Petri plates. The Petri plates were lined with sterile double filter paper and saturated with 15 mL of sterile water. Plates were exposed to different levels of salinity and drought stress and then incubated at 20 °C in a dark place. For control, seeds were soaked in autoclaved inocula. All Petri plates were sealed well to prevent drying during the experimental period of 10 days. A daily count of germination was done, and at the end of the experiment, the dry mass was taken for each replicate. Germination indicators were calculated as follows.
Final germination percentage (FGP, %) was calculated according to [31], using the formula:
FGP ,   % = [ TNG TNP ] × 100
where FGP, % is the final germination percentage, TNG is the total number of germinated seeds, and TNP is the total number of planted seeds.
Mean germination time (MGT) was used to evaluate seedling emergence and computed by the formula cited by [32].
MGT =   ( ni × ti ni )
where MGT is the mean germination time, ni is the number of germinated seeds on germination days, and ti is the number of days during the germination period (between 0 and 10 days).
Vigor index (VI) was calculated using the formula of [33], as follows:
VI = [ SDM ( g ) × GP 100 ]
where VI is the vigor index, SDM is the seedling dry mass (g), and GP is the germination, %.

2.2. Field Experiment Details and Design

Field experiments were conducted at El-Karada Water Requirements Research Station, Kafr El-Sheikh (North Delta), Egypt (Latitude: 31°6ʹ N; Longitude: 30°56ʹ E) during two successive summer growing seasons, 2017 and 2018. The intent was to study the synergistic impacts of plant growth-promoting rhizobacteria (P. koreensis and B. coagulans) and biochar under three irrigation intervals (every 6 (I1), 8 (I2), and 10 (I3) days after transplanting) on soil moisture content, physicochemical properties, physiological attributes, yield, as well as nutrient uptake of a salt-sensitive rice (Oryza sativa L., cv. Sakha 105) in salt-affected soil. The experimental design was split-plot arranged into randomized complete blocks with four replicates. Irrigation intervals (every 6 (I1), 8 (I2), and 10 (I3) days after transplanting) were placed in main plots, while soil treatments (control, PGPR, biochar, and combined of PGPR + biochar) were placed in sub-plots. Seeds of rice were obtained from the Rice Research and Training Center, Sakha, Kafr El-Sheikh, Egypt. The seed viability was further examined before beginning the experiment and was estimated to be 98% on average. The field was deeply plowed after being fallowed, plowed superficially, machinery raked for leveling, and finally, underwent wet leveling after flooding. Experimental plots were 13.5 × 5.0 m and 0.75 m apart (each plot size: 67.5 m2), which were prepared after soil arrangement. There were 4 m gaps between the blocks and 1.5 m alleys between the main-plots to avoid lateral water movement and other interferences. Rice seeds were soaked in fresh water for 24 h and incubated for another 24 h, then broadcast at the rate of 120 kg ha−1 in the flooded nursery homogenously by hand. Thirty-day old seedlings were transplanted at the rate of 3–4 seedlings per hill with a spacing of 20 × 20 cm between hills and rows. Thereafter, seedlings were transplanted on May 1st in 2018 and April 30th in 2019. Fertilizers were applied for the nursery area as recommended. Calcium superphosphate (15.5% P2O5) was applied at the rate of 125 kg P2O5 ha−1 before transplanting. Total N fertilization was added at the rate of 160 kg N ha−1 as urea product (46.5%) and applied on three equal doses during rice growth to avoid the leaching of N. The seeding rate was 140 kg ha−1. Soil texture was clayey.
Soil samples were collected before sowing from 0–30 cm depth using an auger. Soil samples were air-dried and passed through a 2-mm sieve for physicochemical properties analysis (Table 1). Physicochemical analysis was done according to the hydrometer method by using hydrogen peroxide and sodium hexametaphosphate (dispersing agents) according to [34] and explained recently by [35]. Meteorological data at the El-Karada station during two growing seasons, 2017 and 2018, are presented in Table 2.

2.2.1. PGPR Preparation

Strains were incubated for 48 h at 30 °C. Mixture of used strains (1:1) were prepared as peat-based inoculums, 15 ml of 108 CFU mL−1 from each culture per 30 g of the sterilized carrier and spread over a plastic sheet away from direct sun for 20 min before application.

2.2.2. Biochar Characterization

Biochar application in this investigation was prepared through slow pyrolysis of rice husk and corn stalk (1:1) at 350 °C under an oxygen depleted condition with a mean residence time of 3 hours. One week prior to transplanting and during the tillage process, biochar was broadcasted to each plot and mixed homogeneously with local soils (0–20 cm depth) (2 kg biochar m−2) and ground in a stainless-steel mill to <2 mm to remove large particles after natural air drying and then machinery raked for leveling. Neither the control treatment nor individual PGPR treatment received biochar. The initial physical and chemical properties of the biochar are as follows: the content of N, P, and K were 25.21, 7.45, and 13.21 g kg−1, respectively. CaCO3, soil pH, and EC were 1.4%, 7.60, and 0.7 dS m−1, respectively. pH was measured by a digital pH meter. EC was measured using a conductivity meter in a 1:5 (soil:deionized water) soil saturated paste by the method of [36]. Moisture content, water holding capacity, bulk density, and specific surface area were 33 g kg−1, 954 g kg−1, 0.2 g cm−3, and 37 m2 g−1, respectively.

2.3. Measurements

2.3.1. Soil Physicochemical Properties

Soil samples were collected at harvest from a 0–30 cm depth using an auger. Soil samples were air-dried and passed through a 2-mm sieve for chemical properties analysis. Electrical conductivity (EC 1:5) was measured using a portable EC meter. Na+ and K+ were analyzed using a flame photometer [16]. Ca2+ was analyzed by a titration method using a versant solution. Ferrochrome black T was used as an indicator for Ca2+, while ammonium purported was used to determine Ca2+ [37]. Sodium adsorption ratio (SAR) was calculated as an indicator for potential soil sodification using the following Equation (4), as described in [38]:
SAR = [ Na + ] / ( [ Ca 2 + ] + [ Mg 2 + ] ) 2
where Na+, Ca2+, and Mg2+ were expressed in mEq L−1.

2.3.2. Soil Moisture Constants

The volume of water accumulated in the rhizosphere (the root zone of the soil) between field capacity (FC) and the permanent wilting point (PWP) is described as available soil water (ASW), which can be easily used by plants. ASW was calculated based on the following equation:
ASW = (WFC − WPWP) × Bd × V
where WFC and WPWP are the gravimetric soil–water content (%) at FC and PWP, respectively, Bd refers to the value of soil bulk density (g cm−3), and V indicates the soil layer volume (m3) at the depth of the root zone, which was determined to be different three times (i.e., June, July, and August) during both the 2017 and 2018 growing season which are shown in Table 3, as described by [39,40].

2.3.3. Physiological Characteristics

A SPAD meter (Model: SPAD-502, Minolta Sensing Ltd, Hangzhou, Japan) was used for measuring chlorophyll content from the topmost fully expanded leaves on the main stem at flowering stage [41]. SPAD values were recorded from ten plants within each plot, and then, the readings were averaged to have a single value for a plant.
Relative water content (RWC) was analyzed gravimetrically from the topmost fully expanded leaves at flowering stage [41] between 10:00 to 12:00 am. The leaves were weighted immediately after being detached from the plants to get the fresh weight (FW). The leaves were consequently rehydrated in distilled water for 24 h to get the turgid weight (TW) and dried at 60 °C in an oven for 48 h to get the dry weight (DW). Relative water content was measured according to the following formula:
RWC ( % ) = [ ( FW DW ) / ( TW DW ) ] × 100 .
Stomatal conductance (gs) was measured on fully expanded flag leaves from the abaxial surface as mmol H2O m−2 s−1 from three plants in each plot with a dynamic diffusion porometer (Delta-T AP4, Delta-T Devices Ltd, Cambridge, UK) on fine days. Two measurements from both adaxial and abaxial surfaces of the leaf were taken for each plant. Measurements were repeated on fine days (following weather) every 4 or 7 days from booting till harvest with a porometer [42]. Measurements were in the top leave and front (ra) and back side (rb) of the center of the leaf.
Total leaf conductance (rl) is 1/rl = 1/ra + 1/rb.
Free proline content in the leaves was determined following the method of [43]. Leaf samples (0.5 g) were homogenized in 5 ml of sulphosalycylic acid (3%) using mortar and pestle. About 2 mL of extract was taken and placed in a test tube, and then 2 mL of glacial acetic acid and 2 mL of ninhydrin reagent were added. The reaction mixture was boiled in a water bath at 100 °C for 60 min. After cooling the reaction mixture, 6 mL of toluene was added and then transferred to a separating funnel. After thorough mixing, the chromophore containing toluene was separated and absorbance read at 520 nm in a spectrophotometer against toluene blank. Proline concentration was determined using a calibration curve and expressed as μ mol proline g−1 FW.
At the heading stage, dried samples of leaves from each plot were taken and dried in an oven at 70 °C for 48 h. Leaves (0.5 g) were ground into a fine powder and were digested with concentrated H2SO4 (5 mL) and 80% perchloric acid (1 mL). Digested material was diluted with distilled deionized water and brought up to a 100 mL final volume. The concentrations of Na+ and K+ were determined using a PFP7 Flame photometer [44].
K+/Na+ = (% K+ in leaf)/(% Na+ in leaf)

2.3.4. Yield and Its Components

Ten plants were randomly collected at maturity from the middle of each plot to measure the number of spikelets per panicle and the number of spikes m−2. Plants were harvest at the ground level, dried at 72 °C for 2 days, and 1000-grain weight (g) was measured. One m2 from each plot was harvested and dried at 72 °C for 2 days for measuring grain and straw yields (kg DM ha−1). Harvest index (HI) was calculated as the ratio between grain and biological yields. It was expressed as a percentage.
Harvest   index = Grain   yield   ( kg   ha 1 ) Biological   yield   ( kg   ha 1 ) × 100

2.3.5. Nutrient Uptake

Uptake of N, P, and K were measured by multiplying a percentage of the specified element (nitrogen, phosphorus, and potassium) in grain and straw dry matter to calculate total nitrogen uptake (kg ha−1), total phosphorus uptake (kg ha−1), and total potassium uptake (kg ha−1). The nitrogen element was determined by the macro-Kjeldahl technique according to [45]. Phosphorus and potassium elements were determined according to [46,47], respectively.

2.4. Statistical Analysis

Data obtained were subjected to an analysis of variance using an F-test [48]. To compare the means, Duncan’s test was used at 5% of probability.

3. Results

Water deficit and salt-affected soils (Figure 1, Figure 2 and Figure 3) as environmental stressors greatly declined soil fertility and productivity, which results in food insecurity and poverty. The synergy between PGPR and biochar improved soil physicochemical properties, soil moisture contents, physiological characteristics, nutrient uptake, rice yield, and its components when compared to their sole use, as shown in Figure 1, Figure 2 and Figure 3.

3.1. Plant Growth Promoting Rhizobacteria Traits

Responses of these plant growth-promoting strains, P. koreensis, A. chroococcum, A. lipoferum, B. coagulans, and E. cloacae differed under different stress conditions (salinity and drought) (Table 4). Among the tested bacterial strains, it was noticed that strains of P. koreensis and B. coagulans were the most tolerant to higher salinity and drought concentrations as compared with the other strains. These strains had the ability to produce IAA 1.94 and 0.89 µg mL−1 and solubilize P2O5 1.59 and 0.90 µg mL−1 at 8 dS m−1 of salinity stress for P. koreensis and B. coagulans, respectively. Under 30% PEG 6000 stress, these strains produced 0.84 and 0.69 µg mL−1 of IAA and 1.17 and 0.70 µg mL−1 of solubilized P2O5 for P. koreensis and B. coagulans, respectively.

3.2. Germination Indicators

Under the most extreme salinity stress of 8 dS m−1, it was found that rice plants with P. koreensis applied had the greatest FGP of 35% (Table 5). At the same concentration of 8 dS m−1, B. coagulans had the next greatest FGP with 28%. The E. cloacae strain recorded the lowest values of FGP, which were down to 20% and 15% when rice seeds were exposed to 8 dS m−1 and 30% PEG 6000, respectively. Both the salinity control and water deficit controls (zero NaCl and zero PEG6000) maintained 100% FGP, respectively. The shortest MGT was found when rice seeds were treated with P. koreensis as opposed to other strains. Under 0, 2, 4, and 8 dS m−1, the MGT for P. koreensis was 1.90, 2.30, 2.50, 2.91, and 3.33 days, respectively. Under 0%, 5%, 10%, 20%, and 30% PEG concentrations, the MGT for P. koreensis was 2.0, 2.5, 2.5, 3.0, and 3.5 days, respectively.
The VI values dramatically decreased when exposed to increased abiotic stress. Particularly when the germination medium was supplemented with 8 dS m−1 and 30% PEG 6000. On the contrary, the application of 4 dS m−1 and 10% PEG maximized the VI by 0.011 and 0.014 for P. koreensis compared with other strains and control (no NaCl and PEG 6000), respectively. Consequently, P. koreensis and B. coagulans were the most tolerant to higher applied salinity and drought concentrations as compared to the other strains in the study.

3.3. Field Capacity (FC), Wilting Point (WP), and Available Soil Water (ASW)

The soil moisture constants were significantly influenced by irrigation intervals and soil treatments under saline soil. Our findings exhibited that the application of PGPR and biochar alone improved field capacity, and available soil water consequently lowered the wilting point compared to the control (where neither PGPR nor biochar was added). Though, these soil moisture constants were further improved when PGPR was applied in conjunction with biochar in both seasons. Also, among irrigation intervals (I1, I2, and I3), the maximum increases in FC, ASW, and the maximum decreases in WP were noticed in I1 (irrigation every six days), which was significantly in par with I2 (irrigation every eight days) as compared to I3 (irrigation every 10 days) in both seasons (Figure 1) when PGPR in combination with biochar was applied.

3.4. Sodium (Na+), Potassium (K+), Calcium (Ca++), Sodium Adsorption Ratio (SAR), and Electrical Conductivity (EC)

The soil physicochemical properties were significantly influenced by irrigation intervals and soil treatments under saline soil. The soil physicochemical properties, such as Na+, K+, Ca2+, and EC, were measured at the initiation of the trial (Table 2) and at the harvest (Figure 2 and Figure 3) in addition to SAR. Our findings exhibited that the application of PGPR and biochar alone increased K+ and Ca2+ whilst decreasing Na+, SAR, and EC compared to the control (where neither PGPR nor biochar was added). These soil chemical properties were further improved when PGPR was applied in conjunction with biochar. The greatest concentration of K+ and Ca2+ and lowest concentrations of Na+, SAR, and EC were observed in I1 (irrigation every six days), which was on par with I2 (irrigation every eight days) as compared to I3 (irrigation every 10 days) in both seasons (Figure 2 and Figure 3).

3.5. Chlorophyll Content, Relative Water Content, Stomatal Conductance, and Proline Content

There was a significant interaction between irrigation intervals and soil treatments for chlorophyll content, relative water content, stomatal conductance, and proline content. The findings showed that the highest chlorophyll content (Figure 4), relative water content, and stomatal conductance (Table 6) were obtained from plants treated with the combination of biochar and PGPR and irrigated every six days (I1) in both seasons. A similar result was observed with irrigation every eight days (I2) and the combination of biochar and PGPR in both seasons. The lowest chlorophyll content, relative water content, and stomatal conductance values were obtained from plants treated with irrigation every 10 days (I3) and without soil applications (control). The combination of biochar and PGPR application resulted in decreased proline content when plants were irrigated every six days (I1), which did not differ significantly (p > 0.05) from plants irrigated every eight days (I2) under saline soil in both seasons (Table 6).

3.6. K+, Na+, and K+/Na+ Contents in Leaves

There was a significant interaction of irrigation intervals with soil treatments and their effects on K+ and Na+ content in leaves of rice as well as for K+/Na+ contents (Table 7), in both seasons. The highest K+, K+/Na+ contents and the lowest Na+ content were obtained from plants that received irrigation every six days (I1), which did not differ significantly (p > 0.05) from plants irrigated every eight days (I2) when receiving the combination of biochar and PGPR. The individual application of biochar or PGPR to plants that were exposed to I1 or I2 was lower than the combined application of biochar and PGPR and higher than the control (neither biochar nor PGPR) in both seasons (Table 7) under saline soil conditions.

3.7. The 1000-Grain Weight, Number of Grains Panicle−1, and Number of Panicles m−2

The 1000-grain weight, number of grains panicle−1, and the number of panicles m−2 were significantly influenced by irrigation intervals and soil treatments (Table 8) in both seasons. In addition, there was a significant interaction of irrigation intervals with soil treatments for these traits in both seasons. It was observed that further increment in yield components of rice, i.e., 1000-grain weight, number of grains panicle−1, and number of panicles m−2, were detected when PGPR were applied alongside with biochar and irrigated every six days (I1), which was on par with the plants irrigated every eight days (I2) as compared to their sole applications in both seasons (Table 8). Also, sole applications of either biochar or PGPR produced higher yield components compared to the control treatment (neither biochar nor PGPR) in both seasons. Among irrigation intervals, plants irrigated every 10 days had decreased yield components compared to plants irrigated every six or eight days, in both seasons.

3.8. Grain Yield, Straw Yield, and Harvest Index

Grain yield, straw yield, and harvest index were significantly influenced by irrigation intervals and soil treatments (Table 9) in both seasons. In addition, there was a significant interaction of irrigation intervals with soil treatments for these traits in both seasons. It was observed that further increment in grain yield, straw yield, and harvest index were detected when PGPR were applied alongside with biochar and irrigation interval every six days (I1) which was in par with irrigation interval every eight days (I2) as compared to their sole applications in both seasons (Table 9). Also, sole applications of either biochar or PGPR produced higher grain yield, straw yield, and harvest index compared to control treatment (neither biochar nor PGPR) in both seasons. Among irrigation intervals, application of I3 decreased yield components compared to I1 and I2 in both seasons.

3.9. Effect of Soil Treatments on Nutrient Uptake Under Three Irrigation Intervals in Sat-Affected Soil

Total N, P, and K uptake were influenced by irrigation intervals and soil treatments (Figure 5) in both seasons. These traits were higher in irrigation interval every six days (I1) than other irrigation treatments (Figure 5) under control treatment in saline soil in both seasons. We found in both seasons that the highest total N, P, and K uptake were obtained from rice plants treated with the combination of biochar plus PGPR and irrigation interval every six days (I1) as well as irrigation interval every eight days (I2) as compared to the combination of biochar plus PGPR and irrigation interval every 10 days (I3) or sole applications and irrigation interval every six days (I1) (Figure 5) in saline soil.

4. Discussion

Cropping plants are continuously exposed to different environmental perturbations, and more data is needed to understand how to manage these different types of stress. Therefore, the present study was conducted with the intent to test two new strategies that could minimize the negative impacts of water deficit and saline soil on rice. The independent and synergistic uses of biochar and PGPR were tested and found to be potential strategies for ameliorating the adverse effects on drought stress and soil salinity for rice production. It was found that all investigated parameters decreased significantly under different irrigation intervals (every 6 (I1), 8 (I2), and 10 (I3) days) in salt-affected soil due to osmotic stress and nutritional disorders. The findings exhibited that the synergistic use of biochar and PGPR decreased the harmful effect of water deficit stress and salt-affected soil on rice growth [49], improved soil physicochemical properties [50], soil moisture constants, nutrient uptake, physiological characteristics, yield, and its components.
Among the tested strains, P. koreensis and B. coagulans produced a higher amount of IAA and solubilizing phosphate under stressed conditions (salinity and drought) [8]. In our study, high NaCl and PEG 6000 concentrations reduced the FGP and VI of rice seeds of the germinant. Among the tested strains, P. koreensis and B. coagulans improved FGP and led to a decrease of mean germination time at different stress concentrations. To overcome the elevated NaCl and PEG 6000 concentrations on the germination of rice, seeds were treated with the two different strains of PGPRs. Those strains demonstrated a great ability to induce the germination of rice seeds under increasing NaCl and PEG 6000 than the untreated seeds at the same treatment level. Therefore, the PGPRs P. koreensis and B. coagulans likely improve the uptake of water and mitigate the poisonous effects of increased soil salinity and drought on rice germination, which may encourage their use as bioinoculum in actual farming conditions [12].

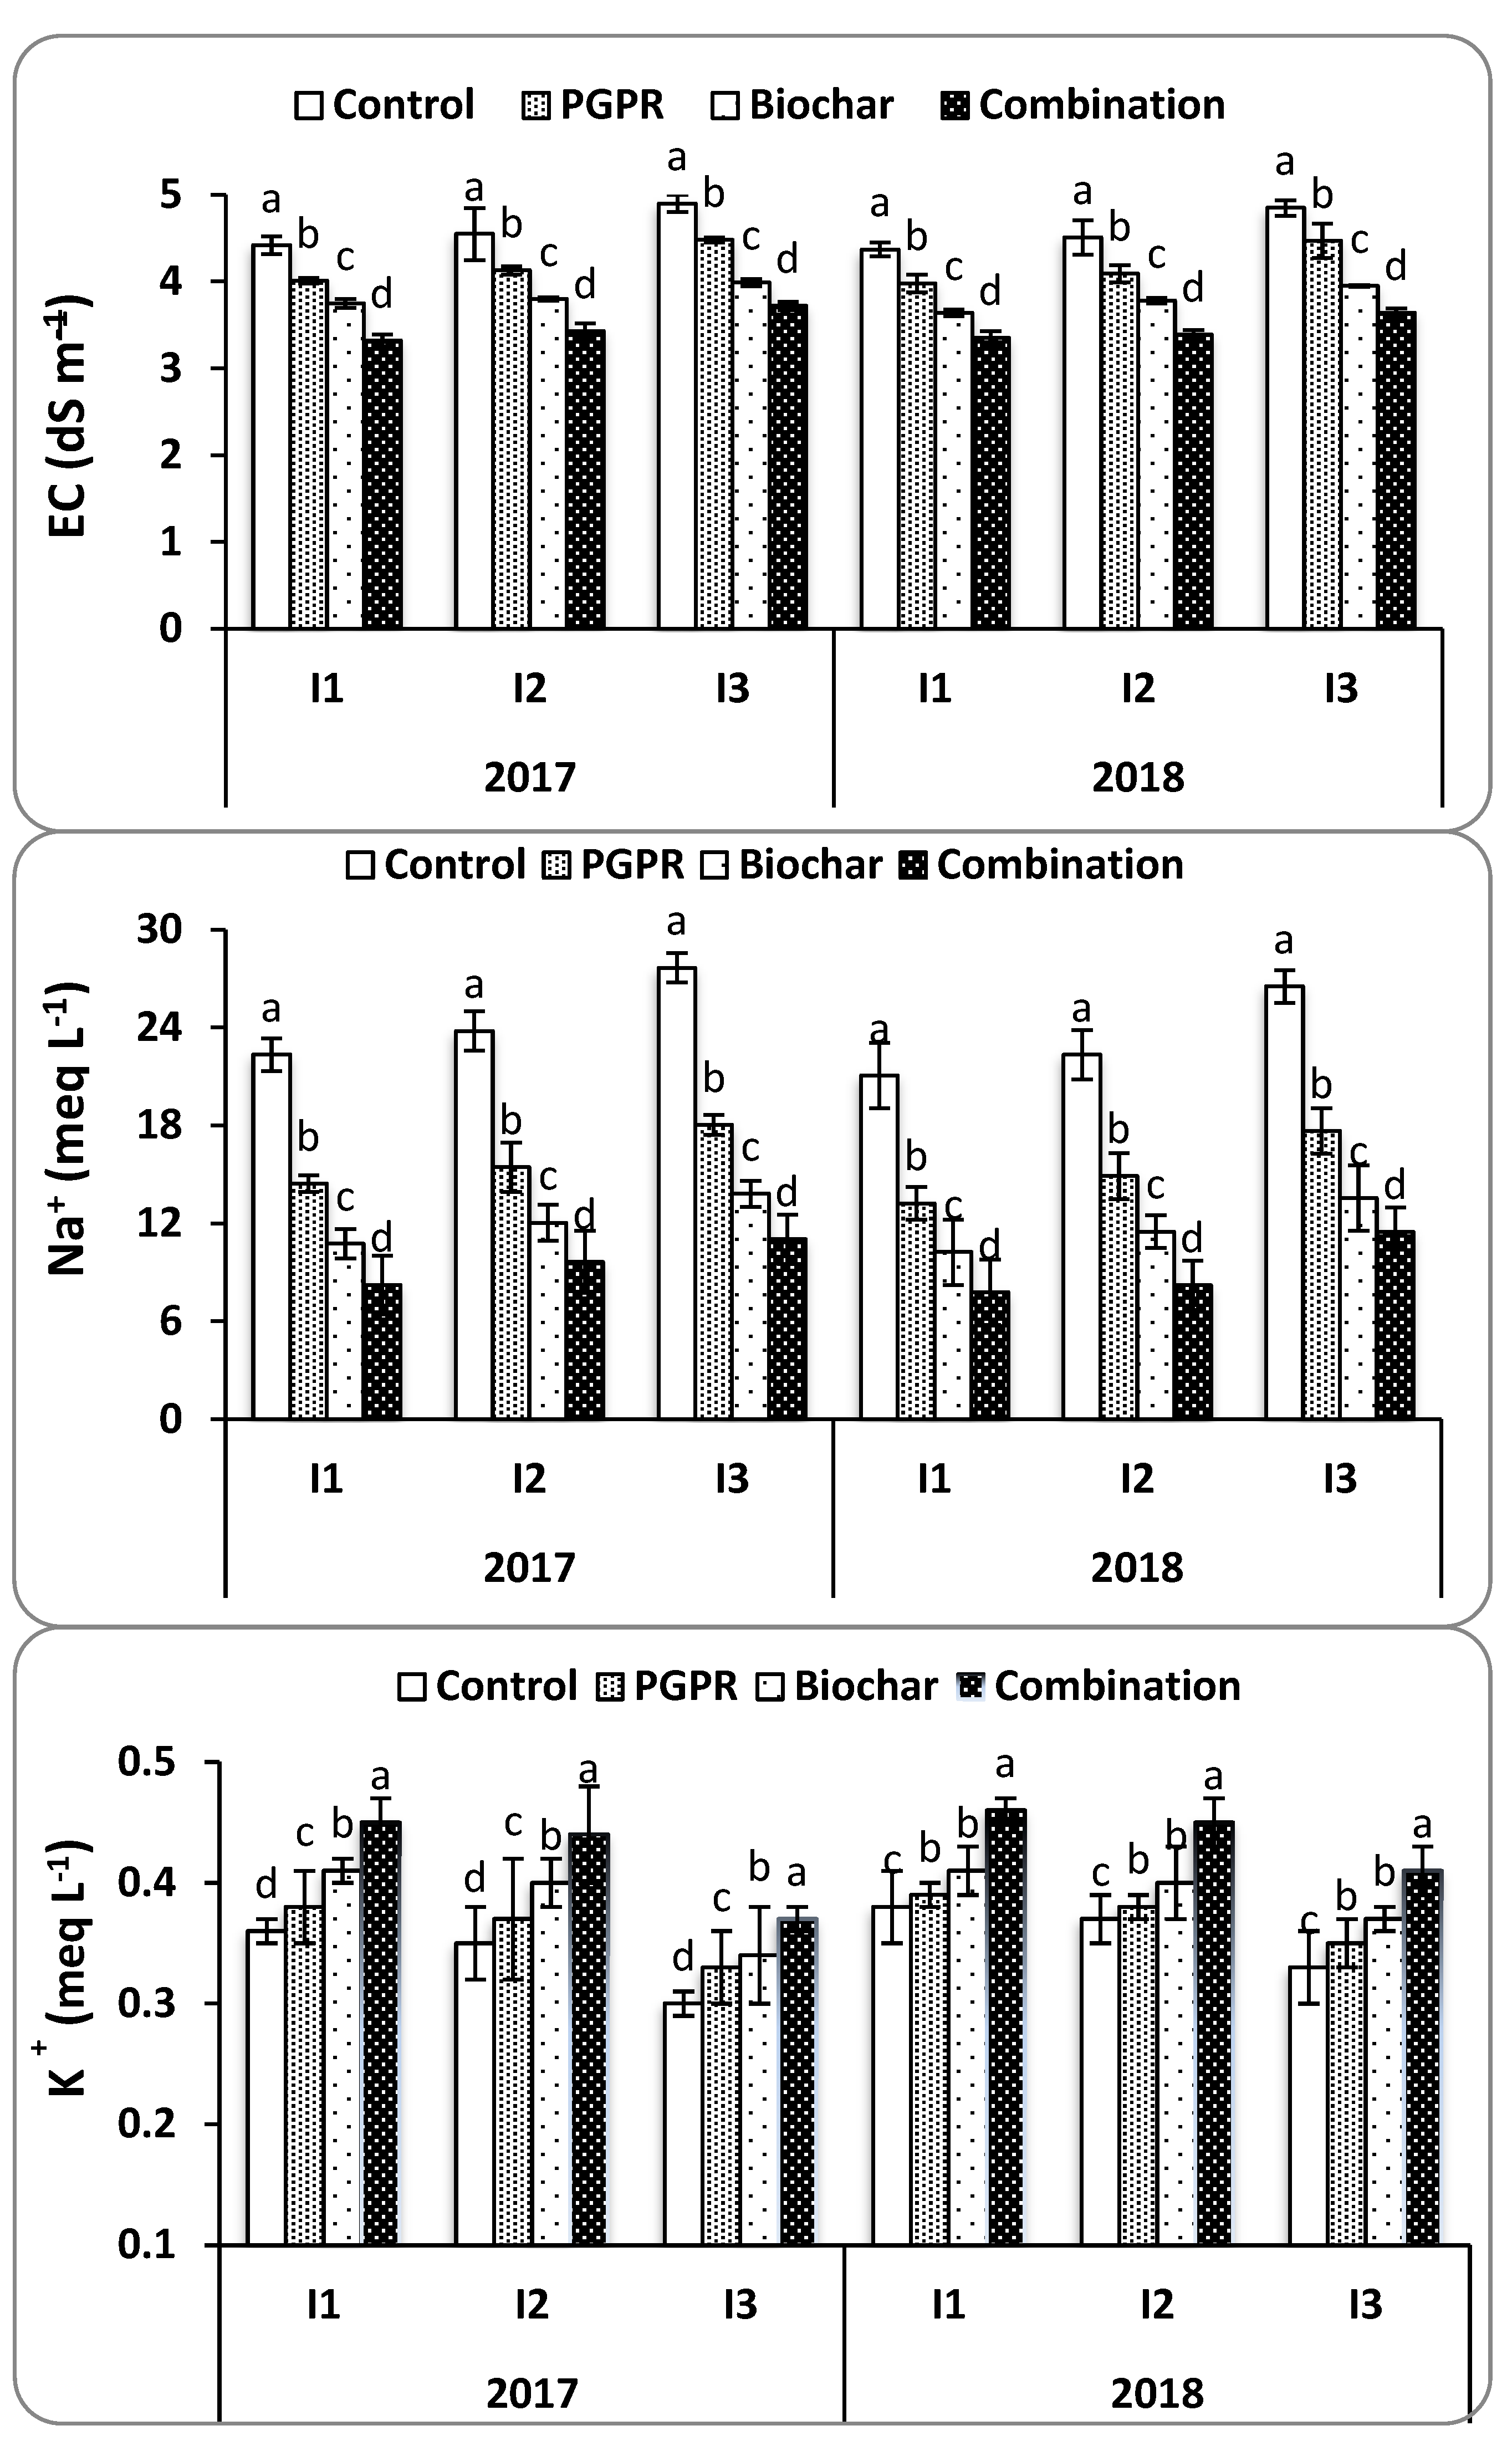
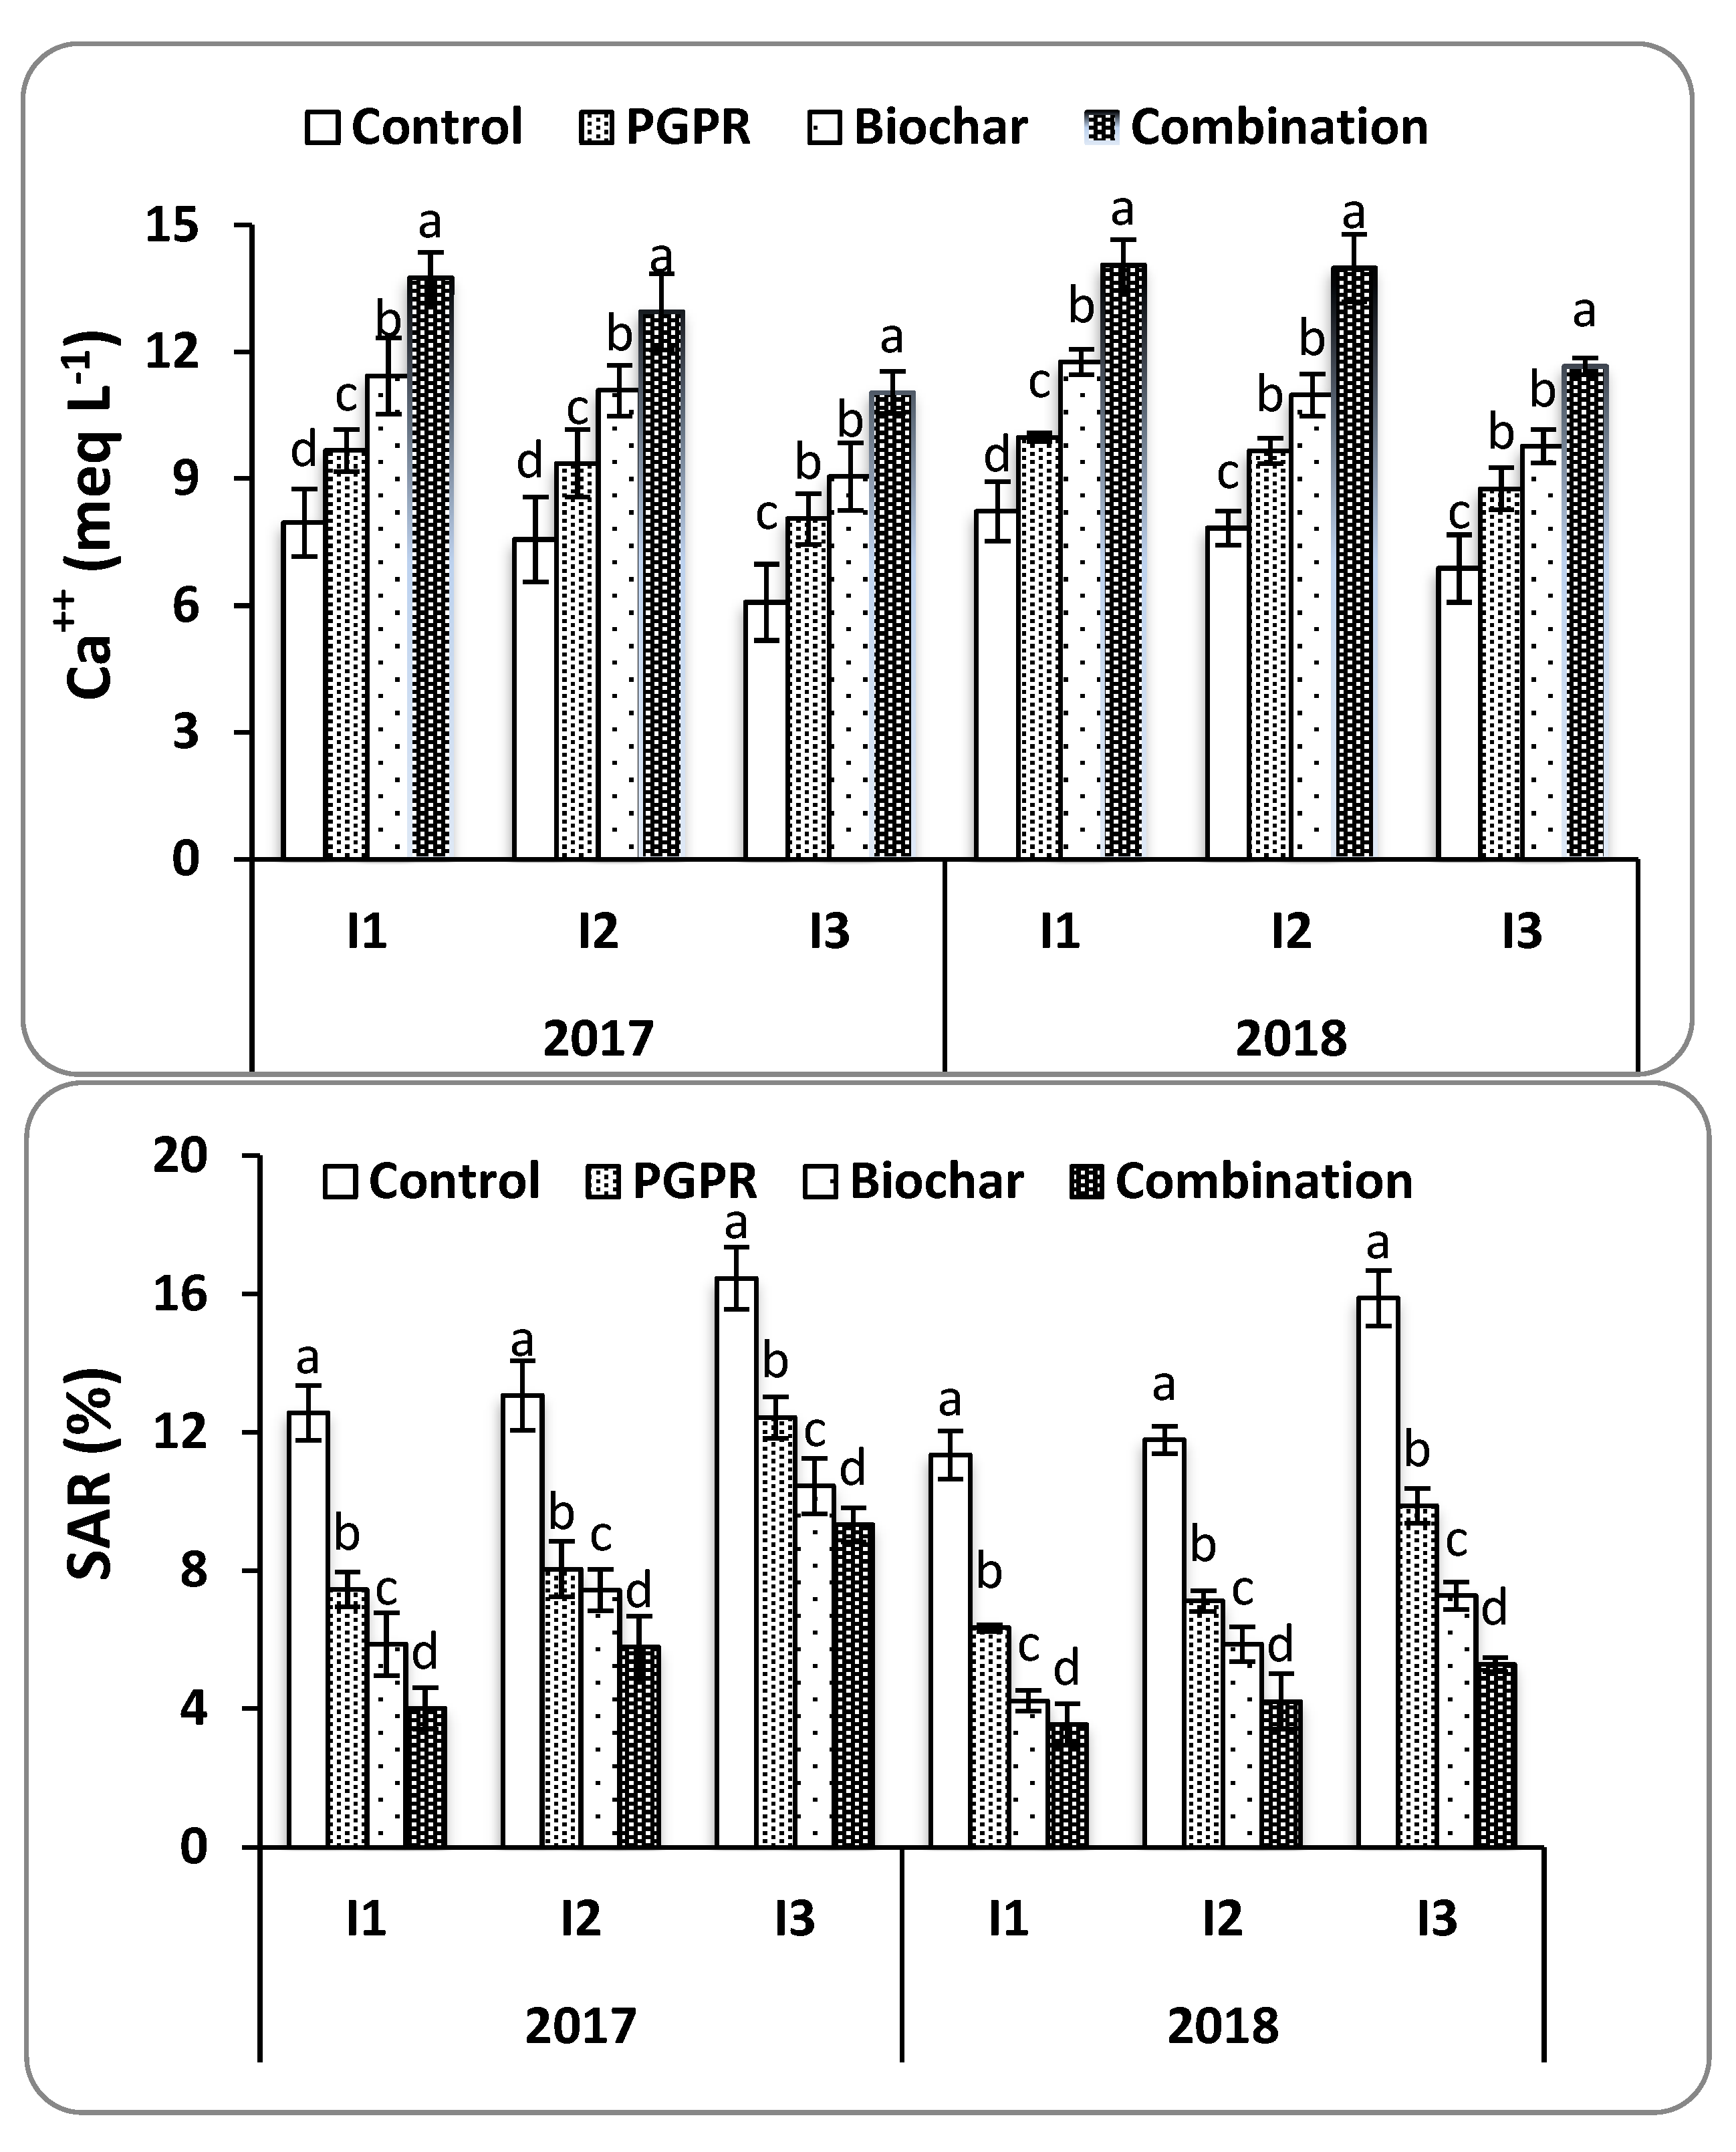
4.1. Soil Physicochemical Properties

SAR was measured to evaluate the potential for PGPRs and biochar to mitigate the adverse effects of Na+ on soil structure under water deficit conditions. It was found that the combination of biochar and PGPR reduced soil SAR and EC at harvest in both seasons. This resulted in increased Ca++ and K+ concentrations in soil solution by placing Na+ onto exchange sites and releasing other nutrients into the soil solution. Soil moisture content was improved by increasing field capacity, soil available water, and decreasing soil salt content, all of which resulted in improved soil structure and consequently allowed for the enhanced growth of rice roots. These findings are consistent with those noted by [51].
The improved growth, nutrient absorption, and physiology of rice in response to PGPR inoculation at each irrigation interval and in saline soil could be ascribed to the biosynthesis of phytohormones such as IAA. IAA may be related to the total biomass of the plant [52] and augmented availability of nutrients [53]. It may also influence the production of ACC deaminase, EPS, and osmolytes [54,55]. As declared in the findings, biochar-amended soil resulted in greater improvements of rice growth and physiology compared with PGPR. Inoculation by PGPR was influential for soil quality and plant growth. However, its lower impact might be attributed to improved soil physicochemical and root proliferation [56].

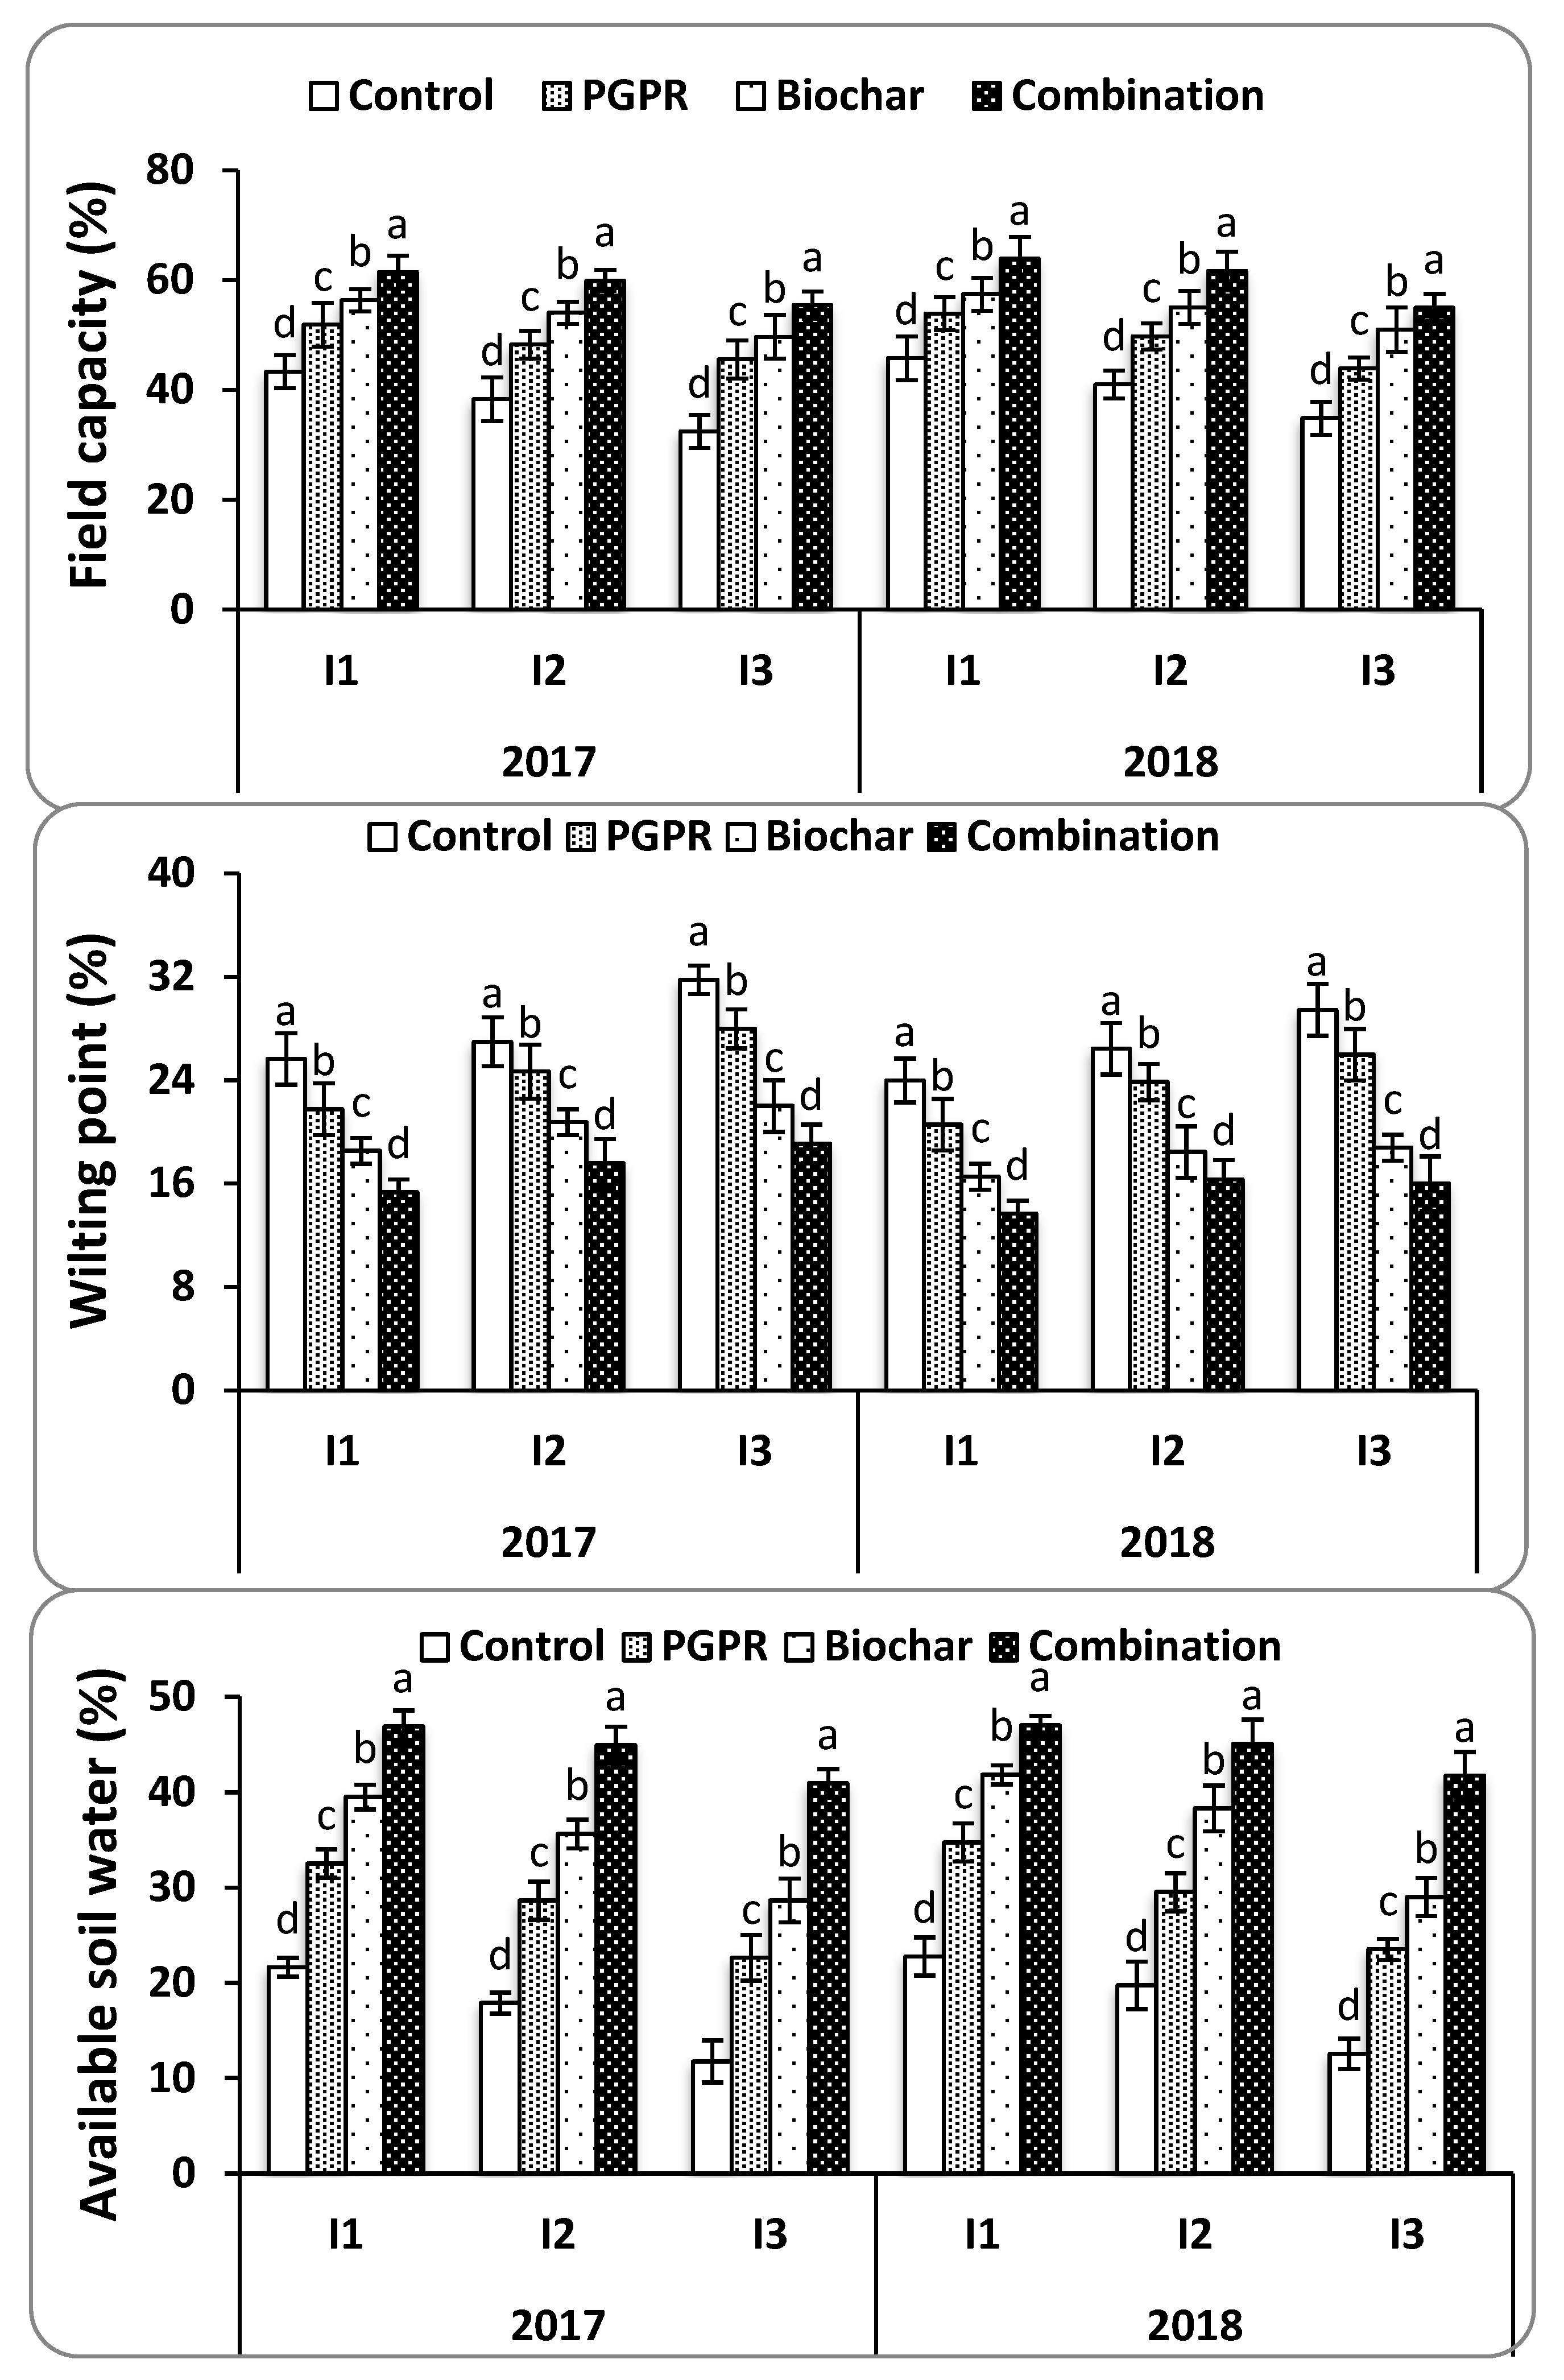
4.2. Soil Moisture Constants

Biochar increased the soil moisture constants for both field capacity and available soil water whilst decreasing the wilting point [16]. Maintaining high soil moisture content in the root environment enables plants to grow better without facing stress problems [15]. Furthermore, biochar improved soil nutrient cycling for N, P, and K. Improved plant uptake likely occurred due to biochar’s porous structure, large surface area, and negative surface charge [50]. Biochar increased the soil’s cation exchange capacity and allowed for the retention of nutrients, which enhanced plant N, P, and K tissue concentrations. As explained above, the addition of biochar in association with PGPR resulted in optimal moisture content for longer periods compared with the individual treatments and the control. This was mainly due to augmented water-holding capacity and reduced soil bulk density [49], which resulted in enhanced available mineral nutrients [57]. The synergistic effect of PGPR and biochar further improved the total bacterial abundance owing to its biostimulation impact [58] and augmented the microbial activities in the rhizosphere. This ultimately resulted in better growth of rice under the stress conditions.

4.3. Physiological Characteristics

It was found that increasing Na+ in soil solution reduces the absorption of K+, Ca2+, N, and other essential nutrients in saline soils [11]. In this study, the combination of biochar and PGPR resulted in reduced Na+ and improved absorption of K+, as described in Figure 2 and Figure 3. This was attributed to the higher Na+ adsorption capacity of biochar, which has been recently stated by [59]. Consequently, leaf Na+ content was reduced with integrated use of biochar along with PGPR as compared to the control treatment. Previous reports indicated that biochar helped maintain the nutrient balance in soil solution by releasing mineral nutrients, particularly K+, Ca2+, and Mg2+, and thereby reducing Na+ uptake [16]. The effect of biochar, therefore, ultimately increased the ratio of K+ to Na+. This can be clearly seen in the current study, where increased leaf K+ content and decreased leaf Na+ content resulted in an increased K+/Na+ ratio under each irrigation interval and saline soil. Additionally, PGPR could also reduce plant Na+ uptake by the excretion of IAA and bacterial exopolysaccharide, which could bind Na+ and prevent its uptake in plants [60].
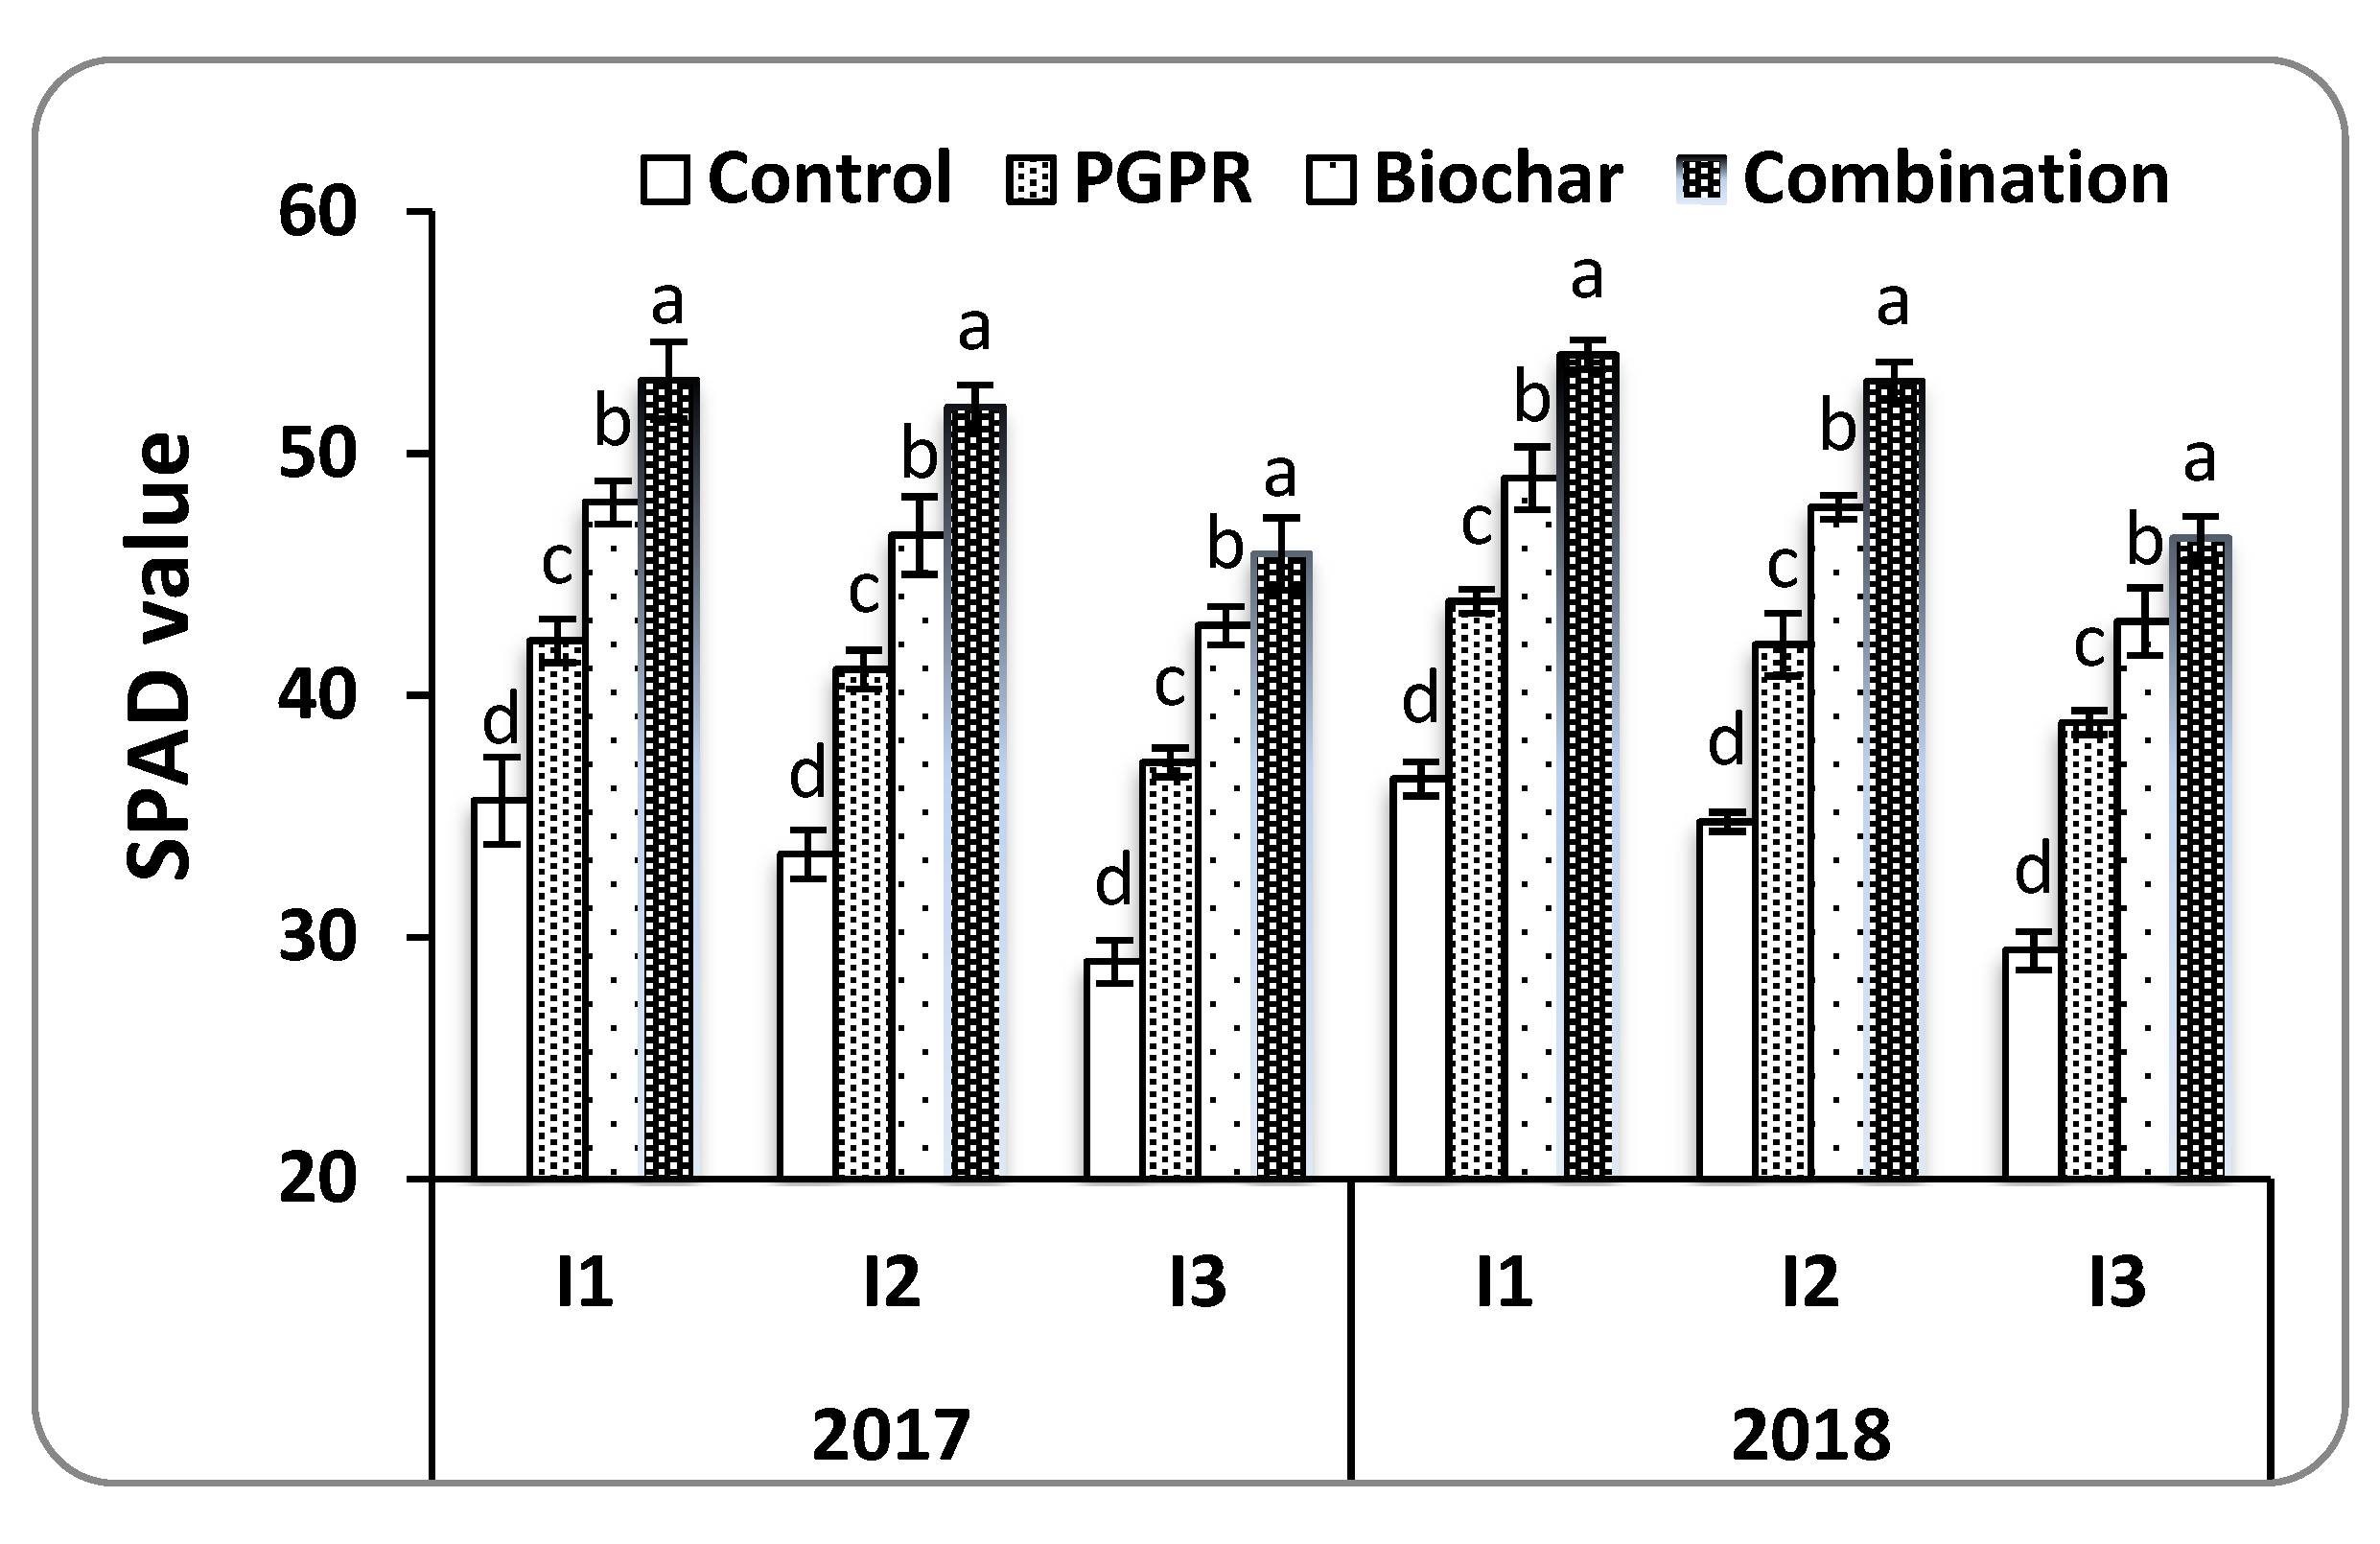
Chlorophyll content has been considered as a suitable parameter for the physiological evaluation under environmental stressors like drought and salinity [13]. The decline of SPAD meter under water and salinity stressors is primarily caused by chloroplast damages, which contribute to important physiological changes during plant growth resulting in decrease crop productivity [61]. The integrated use of biochar and PGPR recorded the highest SPAD values under water deficit and salt-affected soil. This is directly linked to the nitrogen content in the leaf, which is the macronutrient necessary for chlorophyll development [6]. These findings could elucidate the increased leaf N uptake by the combining of biochar and PGPR in this study, which is positively reflected on yield and its components (1000-grain weight, number of grains panicle−1, and number of panicles m−2).
Relative water content and stomatal conductance are crucial parameters that are directly linked to soil water status and productivity [62]. It was found that the lower relative water content and reduced stomatal conductance caused by drought stress and saline conditions led to increased proline content and reduced photosynthesis, nutritional imbalance, and grain yield [14]. Notably, the stimulatory impacts of PGPR can be further improved by the application of biochar [6]. This is perhaps owing to the additional water holding capacity of biochar [13]. As described in the results, the synergistic use of biochar with PGPR increased soil moisture. This may have caused a dilution effect in the soil solution [14]. Thereby reducing osmotic stress and preventing plants from losing turgor under water deficit and saline soil, leading to increase relative water content and improved stomatal conductance [13,63]. A strong positive relationship was observed between leaf proline content and leaf Na+ concentration likely as a plant response to the abiotic stress; these results are in conformity with [64]. Furthermore, it has been affirmed that proline content is negatively correlated with stomatal conductance and relative water content under water deficit and saline conditions [14].

4.4. Yield and Its Components

In this study, the highest harvest index and grain yields were obtained by plants with the shortest irrigation interval (every six days, I1). It has been stated that rice yields largely relate to traits such as 1000-grain weight, the number of grains per panicle, and the number of panicles m−2. Water availability contributes to plant growth and development, and water deficit reduces plant productivity and thus decreases yield-related traits [65]. Under the longer irrigation intervals (every 8 and 10 days), losses due to water deficit stress and saline soil could be attributed to the closure of stomata, decrease relative water content, and chlorophyll content, which ultimately lead to a reduction of photosynthesis and minimized grain yield [13]. The combination of biochar and PGPR had a highly positive impact on water relations, nutrient cycles, and the availability and uptake of nutrients when compared to the individual applications and the control treatment. The synergistic use of biochar and PGPR had the ability to increment yield when applied to the plants irrigated every eight days (I2), which was on par with those irrigated every six days (I1) and under saline soil conditions.

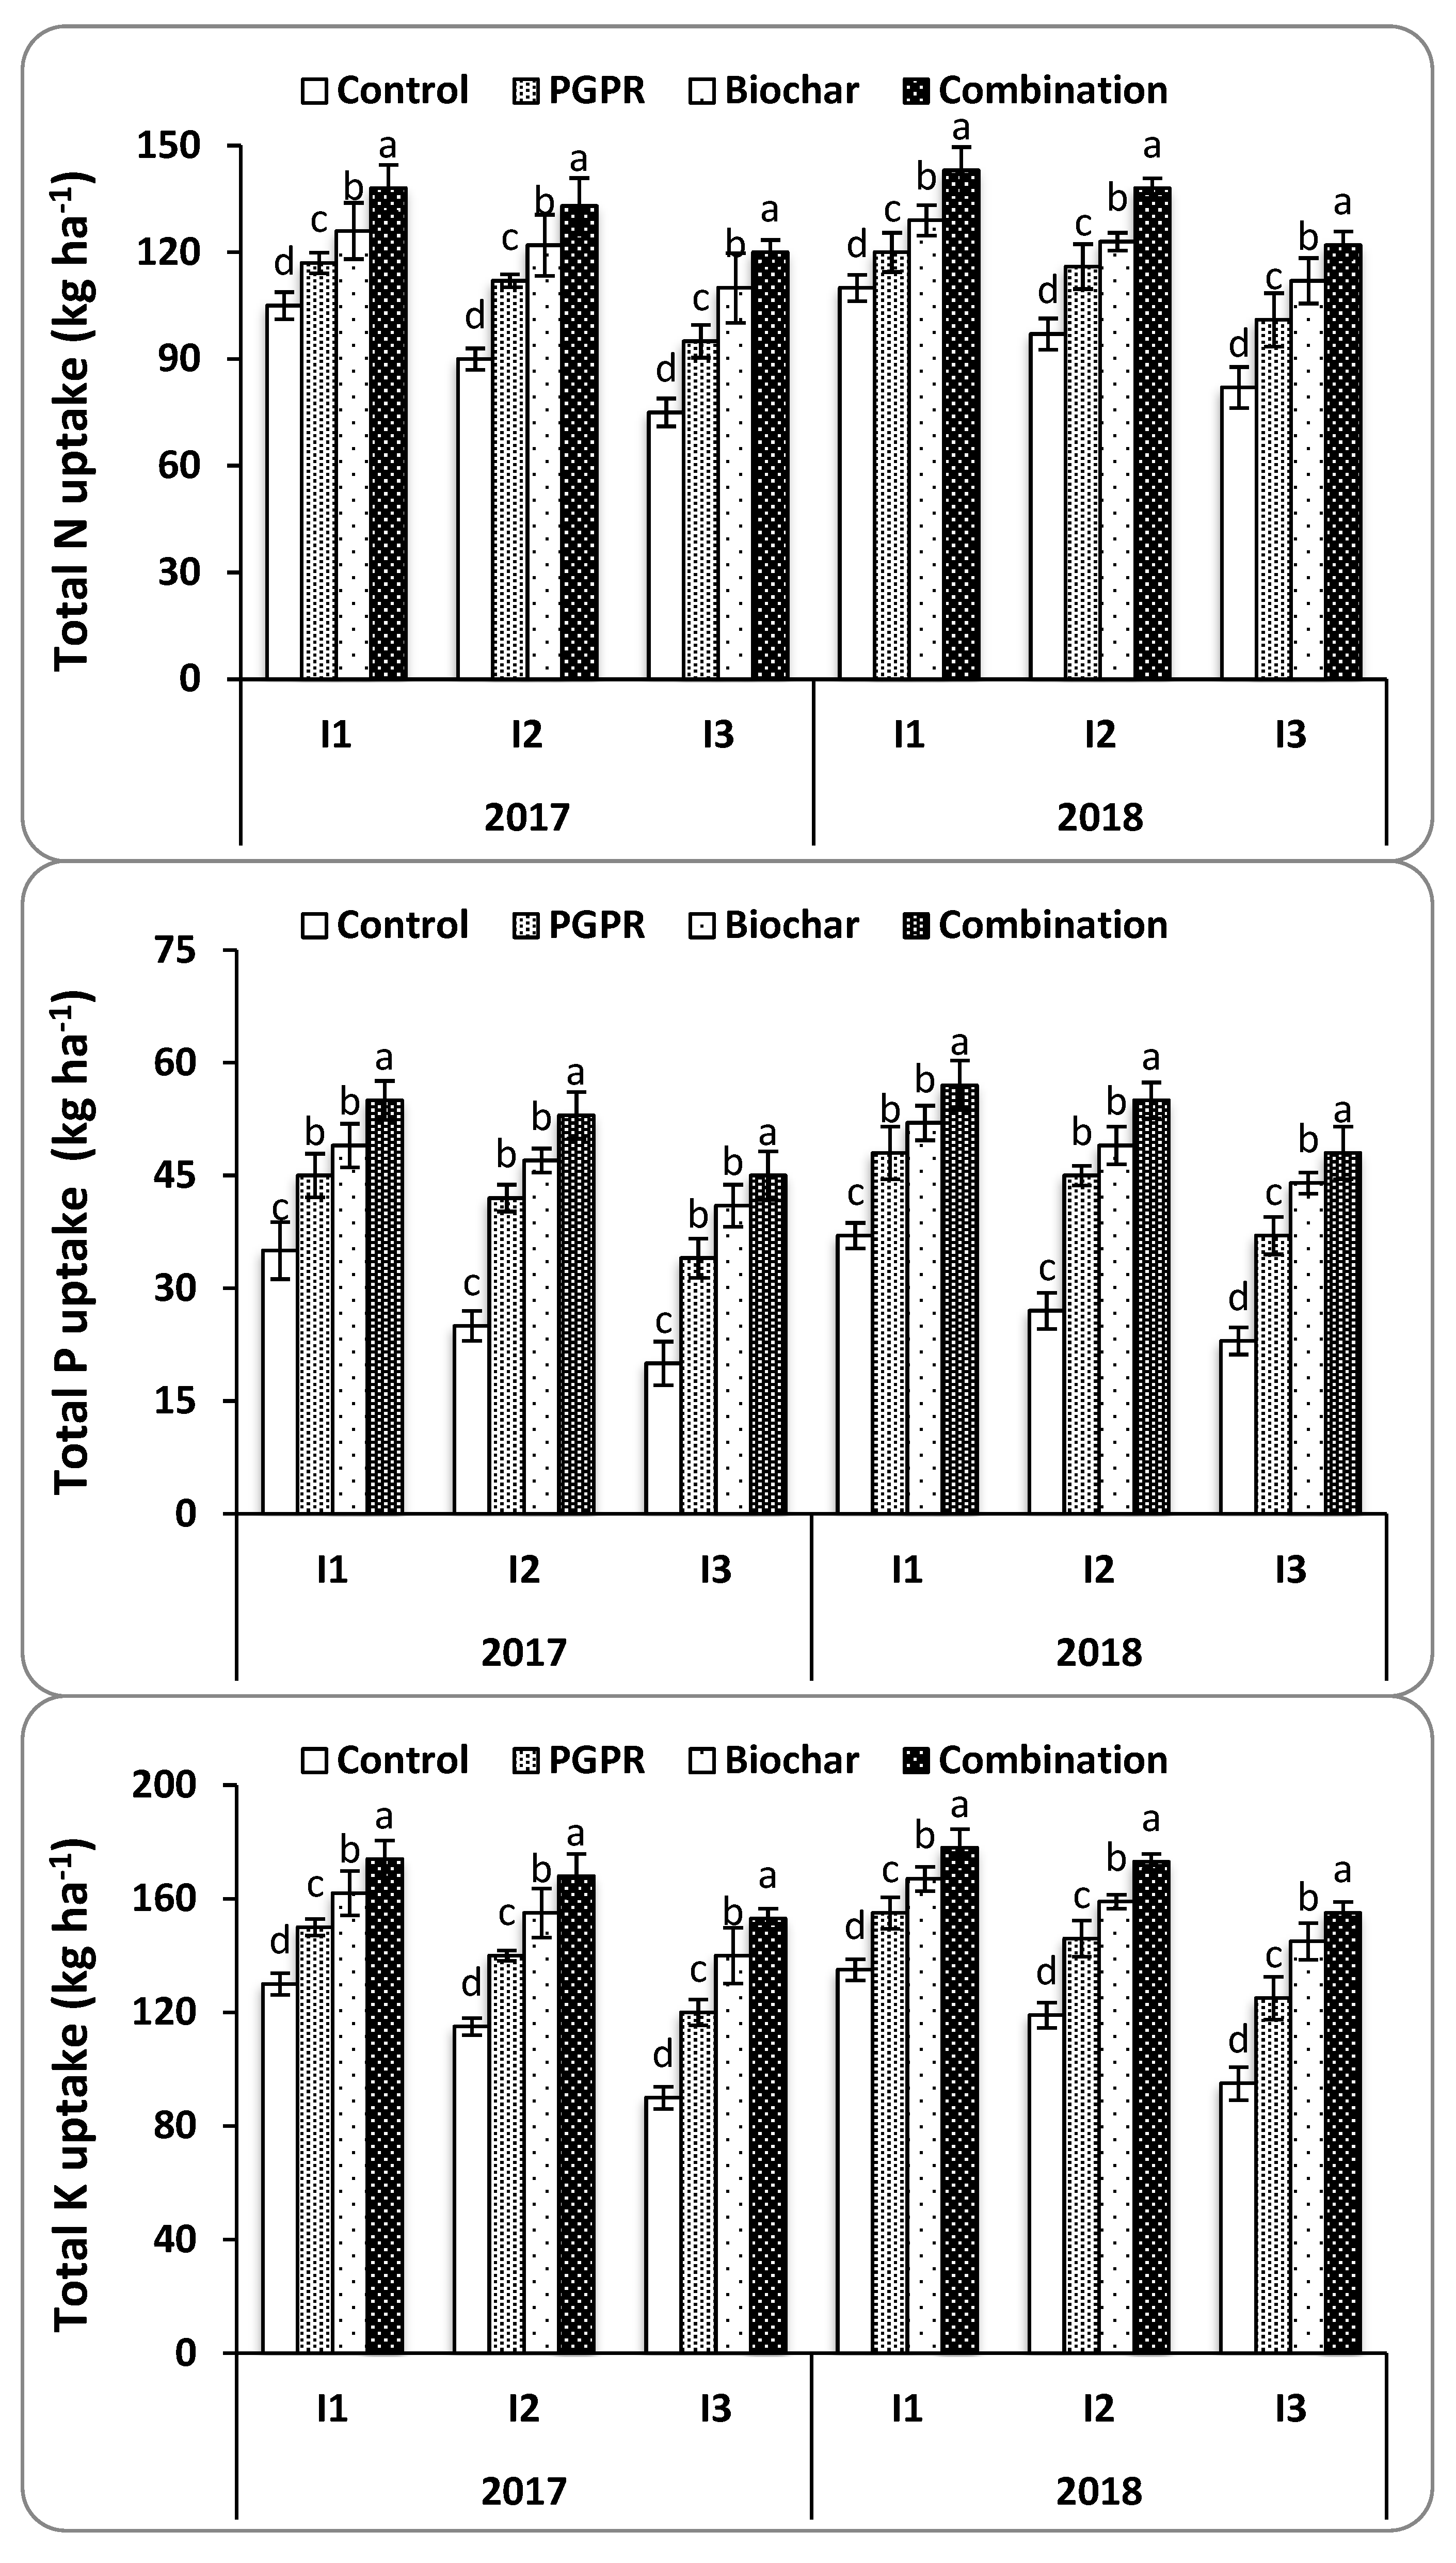
4.5. Nutrient Uptake

In this study, the highest N, P, and K uptakes were attained from rice plants treated with the combination of biochar and PGPR under each of the three irrigation intervals and in saline soil as opposed to the sole applications and the control treatment. Among irrigation intervals, plants irrigated every eight days (I2) were on par with those irrigated every six days (I1) under saline soil conditions. Both of these were higher than plants irrigated every 10 days (I3) when treated with the combination of biochar and PGPR in both seasons. The findings of the current study clearly demonstrate that the combination of biochar and PGPR further improved N, P, and K uptake significantly more than the application of either one alone. It appears that biochar and PGPR have a pivotal effect in the formation and stabilization of soil particulates under water deficit and saline conditions, and this can help with enhanced nutrient uptake.

5. Conclusions

Without biochar, PGPR application improved rice germination and growth under limited water in saline soil through the production of IAA and solubilizing phosphates. The synergistic use of biochar and PGPR led to further improved soil moisture content, physiochemical properties, physiological characteristics, and essential nutrient uptake. Biochar alongside with PGPR declined Na+ uptake while increasing K+ uptake under water deficit in salt-affected soil, which could be owing to the higher colonizing efficiency of PGPR in the presence of biochar. To the best of our knowledge, this is the first examination to report the synergistic use of PGPR and biochar on improving rice productivity under limited water and saline soil in field conditions. This approach could be a novel management strategy for sustainable agriculture to enhance soil fertility and rice productivity. Nonetheless, long-term field studies should be carried out to confirm the above mechanisms and recommendations of the synergistic use of biochar and PGPR under environmental stressors and further testing of its economic feasibility.

Author Contributions

Conceptualization, E.M.H., A.S.A., M.F. and A.E.-D.O.; methodology, E.M.H., M.F. and A.E.-D.O.; software, E.M.H., A.S.A., E.R. and M.M.K.; validation, E.M.H., A.S.A., M.F., E.R. and M.M.K.; formal analysis, E.M.H., A.S.A. and E.R.; investigation, E.M.H., M.F. and A.E.-D.O.; resources, E.M.H., M.F. and A.E.-D.O.; data curation, E.M.H. and M.M.K.; writing—original draft preparation, E.M.H. and A.E.-D.O.; writing—review and editing, E.M.H., A.E.-D.O.; visualization, E.M.H., A.S.A., M.F., A.E.-D.O., M.M.K. and E.R.; supervision, E.M.H. and A.E.-D.O. and M.F.; project administration, E.M.H., M.F. and A.E.-D.O.; funding acquisition, E.M.H, A.S.A., E.R. and M.M.K.

Funding

The authors extend their appreciation to Water Management Research Institute, National Water Research Centre, Egypt, and Agricultural Microbiology, Soils, Water and Environment Research Institute, Egypt for providing the experimental farm and all facilities related to cultivation or materials and analysis.

Acknowledgments

Authors thank the Department of Agricultural Microbiology, Soils, Water and Environment Research Institute, Agricultural Research for carrying out the analysis of the most traits. We are also grateful to Bill Payne, Professor of Crop Physiology and Dean of CABNR/NAES/UNCE and Steven Bristow at the University of Nevada, USA, for his kind help in editing the English language of the manuscript.

Conflicts of Interest

The authors declare that they have no conflict of interest.

References

  1. FAOSTAT. Food and Agriculture Organization of the United Nations Statistics Division. 2018. Available online: http://faostat.fao.org/site/567/DesktopDefault.aspx (accessed on 10 December 2018).
  2. Hafez, E.; Farig, M. Efficacy of salicylic acid as a cofactor for ameliorating effects of water stress and enhancing wheat yield and water use efficiency in saline soil. Int. J. Plant Prod. 2019, 13, 163–176. [Google Scholar] [CrossRef]
  3. Soil Science Society of America. Glossary of Soil Science Terms; Soil Science Society of America: Madison, WI, USA, 1997. [Google Scholar]
  4. U.S. Salinity Laboratory Staff. Diagnosis and Improvement of Saline and Alkali Soils. In US Department of Agriculture Handbook 60; U.S. Salinity Laboratory Staff: Washington, DC, USA, 1954. [Google Scholar]
  5. Aliya, F.; Asghari, B. Role of Plant Growth-Promoting Rhizobacteria (PGPR), Biochar, and Chemical Fertilizer under Salinity Stress. Commun. Soil Sci. Plant Anal. 2016, 47, 17. [Google Scholar]
  6. Akhtar, S.S.; Andersen, M.N.; Liu, F. Biochar mitigates salinity stress in potato. J. Agron. Crop Sci. 2015, 201, 368–378. [Google Scholar] [CrossRef]
  7. Melero, S.; Madej’on, E.; Ruiz, J.; Herencia, J. Chemical and biochemical properties of a clay soil under dryland agriculture system as affected by organic fertilization. Eur. J. Agron. 2007, 26, 327–334. [Google Scholar] [CrossRef] [Green Version]
  8. Chandra, D.; Srivastava, R.; Glick, B.R.; Sharma, A.A. Drought-Tolerant Pseudomonas spp. Improve the Growth Performance of Finger Millet (Eleusine coracana (L.) Gaertn.) Under Non-Stressed and Drought-Stressed Conditions. Pedosphere 2018, 28, 227–240. [Google Scholar] [CrossRef]
  9. Ngumbi, E.; Kloepper, J. Bacterial-mediated drought tolerance: Current and future prospects. Appl. Soil Ecol. 2016, 105, 109–125. [Google Scholar] [CrossRef]
  10. Lisar, S.Y.; Motafakkerazad, R.; Hossain, M.M.; Rahman, I.M. Water Stress in Plants: Causes, Effects and Responses. In Water Stress; InTech: Rijeka, Croatia, 2012; pp. 1–14. [Google Scholar]
  11. Ahmad, M.T.; Asghar, H.N.; Saleem, M.; Khan, M.Y.; Zahir, Z.A. Synergistic effect of rhizobia and biochar on growth and physiology of maize. Agron. J. 2015, 107, 2327–2334. [Google Scholar] [CrossRef]
  12. Baig, K.S.; Arshad, M.; Khalid, A.; Hussain, S.; Abbas, M.N.; Imran, M. Improving growth and yield of maize through bioinoculants carrying auxin production and phosphate solubilizing activity. Soil Environ. 2014, 33, 159–168. [Google Scholar]
  13. Naba, R.P.; Hans, P.S.; Jan, M.; Sarah, E.H.; Olivier, H.; Gerard, C. Nutrient effect of various composting methods with and without biochar on soil fertility and maize growth. Arch. Agron. Soil Sci. 2019. [Google Scholar] [CrossRef] [Green Version]
  14. Naeem, M.A.; Khalid, M.; Aon, M.; Abbas, G.; Tahir, M.; Amjad, M.; Murtaza, B.; Yang, A.; Akhtar, S.S. Effect of wheat and rice straw biochar produced at different temperatures on maize growth and nutrient dynamics of a calcareous soil. Arch. Agron. Soil Sci. 2017, 63, 2048–2061. [Google Scholar] [CrossRef]
  15. Ouyang, L.; Wang, F.; Tang, J.; Yu, L.; Zhang, R. Effects of biochar amendment on soil aggregates and hydraulic properties. J. Soil Sci. Plant Nutr. 2013, 13, 991–1002. [Google Scholar] [CrossRef] [Green Version]
  16. Chintala, R.; Mollinedo, J.; Schumacher, T.E.; Malo, D.D.; Julson, J.L. Effect of biochar on chemical properties of acidic soil. Arch. Agron. Soil Sci. 2014, 60, 393–404. [Google Scholar] [CrossRef]
  17. Akhtar, S.S.; Li, G.; Andersen, M.N.; Liu, F. Biochar enhances yield and Quality of tomato under reduced irrigation. Agri. Water Manag. 2014, 138, 37–44. [Google Scholar] [CrossRef]
  18. Haider, G.; Steffens, D.; Moser, G.; Müller, C.; Kammann, C.I. Biochar reduced nitrate leaching and improved soil moisture content without yield improvements in a four-year field study. Agric. Ecosyst. Environ. 2016, 237, 80–94. [Google Scholar] [CrossRef]
  19. Kammann, C.I.; Linsel, S.; Gößling, J.W.; Koyro, H.W. Influence of biochar on drought tolerance of Chenopodium quinoa Willd and on soil–plant relations. Plant Soil 2011, 345, 195–210. [Google Scholar] [CrossRef]
  20. Liu, C.; Liu, F.; Ravnskov, S.; Rubæk, G.H.; Sun, Z.; Andersen, M.N. Impact of wood biochar and its interactions with mycorrhizal fungi, phosphorus fertilization and irrigation strategies on potato growth. J. Agron. Crop Sci. 2017, 203, 131–145. [Google Scholar] [CrossRef]
  21. Egamberdieva, D.; Reckling, M.; Wirth, S. Biochar-based Bradyrhizobium inoculum improves growth of lupin (Lupinus angustifolius L.) under drought stress. Eur. J. Soil Biol. 2017, 78, 38–42. [Google Scholar] [CrossRef]
  22. FAOSTAT. Food and Agriculture Organization of the United Nations Statistics Division. 2019. Available online: http://faostat.fao.org/site/567/DesktopDefault.aspx (accessed on 20 August 2019).
  23. Hafez, E.H.; Abou El Hassan, W.H.; Freeg, M.R.; Seleiman, M.F. Effect of gypsum and irrigation interval on yield and water use efficiency of rice grown on saline soil. J. Agric. Sci. 2015, 12, 208–219. [Google Scholar]
  24. Reichenauer, T.G.; Panamulla, S.; Subasinghe, S.; Wimmer, B. Soil amendments and cultivar selection can improve rice yield in salt-influenced (tsunami-affected) paddy fields in Sri Lanka. Environ. Geochem. Health 2009, 31, 573–579. [Google Scholar] [CrossRef]
  25. King, E.; Ward, W.; Ramy, D. Two simple media for the demonstration of pyocyanin and fluorescence. J. Lab. Clin. Med. 1954, 44, 301–307. [Google Scholar]
  26. Jensen, H.L. Notes on the biology of Azotobacter. Proc. Soc. Appl. Bacteriol. 1951, 14, 103. [Google Scholar] [CrossRef]
  27. Döbereiner, J.; Day, J.M. Associative Symbiosis in Tropical Grasses: Characterization of Microorganisms and Dinitrogen Fixing Sites in Sysposium on Nitrogen Fixation; Washington State University Press: Washington, DC, USA, 1976. [Google Scholar]
  28. Atlas, R.M. Handbook of Microbiological Media, 2nd ed.; CRC Press: New York, NY, USA, 1997; p. 1026. [Google Scholar]
  29. Ivanova, E.G.; Doronina, N.V.; Trotsenko, Y.A. Aerobic methylobacteria are capable of synthesizing auxins. Microbiolgy 2001, 70, 452–458. [Google Scholar]
  30. Olsen, S.R.; Sommers, L.E. Phosphorus. In Methods of Soil Analysis: Part 2, 2nd ed.; Page, A.L., Ed.; ASA and ASSA: Madison, WI, USA, 1982; pp. 403–430. [Google Scholar]
  31. Ranal, M.A.; Santana, D.G. How and why to measure the germination process? Rev. Bras. Bot. 2006, 29, 1–11. [Google Scholar] [CrossRef] [Green Version]
  32. Mauromicale, G.; Licandro, P. Salinity and temperature effects on germination, emergence and seedling growth of globe artichoke. Agronomy 2002, 22, 443–450. [Google Scholar] [CrossRef]
  33. Kharb, R.P.S.; Lather, B.P.S.; Deswal, D.P. Prediction of field emergence through heritability and genetic advance of vigour parameters. Seed Sci. Technol. 1994, 22, 461–466. [Google Scholar]
  34. Bouyoucos, G.J. Hydrometer Method Improved for Making Particle Size Analysis of Soils. Agron. J. 1962, 54, 464–465. [Google Scholar] [CrossRef]
  35. Sarkar, D.; Halder, A. Physical and Chemical Methods in Soil Analysis Fundamental Concepts and Analytical Chemistry and Instrumental Techniques; New Age International (P) Ltd. Publishers: New Delhi, India, 2005. [Google Scholar]
  36. Richards, L.A. Diagnosis and Improvement of Saline and Alkali Soils; US Salinity Laboratory Staff, US Department of Agriculture: Washington, DC, USA, 1954.
  37. Jackson, M.L. Soil Chemical Analysis; Prentice-Hall: New Delhi, India, 1967; pp. 183–203. [Google Scholar]
  38. U.S.D.A. Diagnosis and Improvement of Saline and Alkali Soils. In Agriculture Handbook No. 60; USDA: Washington, DC, USA, 1954. [Google Scholar]
  39. Garcia, C. Soil Water Engineering Laboratory Manual. Department of Agricultural and Chemical Engineering. Ph.D. Thesis, Colorado State University, Fort Collins, CO, USA, 1978. [Google Scholar]
  40. Klute, A. Methods of Soil Analysis, Part 1. In Physical and Mineralogical Methods, 2nd ed.; ASA Inc., SSSA Inc. Publisher: Madison, WI, USA, 1986. [Google Scholar]
  41. Meier, U. Growth Stages of Mono and Dicotyledonous Plants; BBCH Monograph, Federal Biological Research Centre for Agriculture and Forestry: Bonn, Germany, 2001. [Google Scholar]
  42. Izanloo, A.; Anthony, G.; Thorsten, S. Different mechanisms of adaptation to cyclic water stress in two South Australian bread wheat cultivars. J. Exp. Bot. 2008, 59, 3327–3346. [Google Scholar] [CrossRef] [Green Version]
  43. Bates, L.S.; Waldren, R.P.; Teare, I.D. Rapid determination of free proline for water-stress studies. Plant Soil 1973, 39, 205–207. [Google Scholar] [CrossRef]
  44. Temminghoff, E.J.M.; Houba, V.J.G. Plant Analysis Procedures, 2nd ed.; Kluwer Academic Publishers: London, UK, 2004. [Google Scholar]
  45. A.O.A.C. Official Methods of Analysis. In Association of Official Agricultural Chemists, 2nd ed.; AOAC: Washington, DC, USA, 1975; p. 832. [Google Scholar]
  46. Trough, E.; Mager, A.H. Improvement in deiness colorimetric method for phosphorus and arsenic. Chem. Anal. Ed. 1939, 1, 136–139. [Google Scholar]
  47. Jackson, M.L. Soil Chemical Analysis; Prentice Hall Inc.: Bergen, NJ, USA, 1958; 498 S. DM 39. [Google Scholar]
  48. Gomez, K.A.; Gomez, A. Statistical Procedure for Agricultural Research—Hand Book; Wiley: New York, NY, USA, 1984. [Google Scholar]
  49. Yasmin, H.; Nosheen, A.; Naz, R.; Bano, A.; Keyani, R. L-tryptophan assisted PGPR-mediated induction of drought tolerance in maize (Zea mays L.). J. Plant Interact. 2018, 12, 567–578. [Google Scholar] [CrossRef] [Green Version]
  50. Raheem, A.; Shaposhnikov, A.; Belimov, A.A.; Dodd, I.C.; Ali, B. Auxin production by rhizobacteria was associated with improved yield of wheat (Triticum aestivum L.) under drought stress. Arch. Agron. Soil Sci. 2019, 64, 574–587. [Google Scholar] [CrossRef]
  51. Chakraborty, U.; Chakraborty, B.N.; Chakraborty, A.P.; Dey, P.L. Water stress amelioration and plant growth promotion in wheat plants by osmotic stress tolerant bacteria. World J. Microb. Biotech. 2013, 29, 789–803. [Google Scholar] [CrossRef] [PubMed]
  52. Banerjee, A.; Bareh, D.A.; Joshi, S.R. Native microorganisms as potent bioinoculants for plant growth promotion in shifting agriculture (Jhum) systems. J. Soil Sci. Plant Nutr. 2017, 17, 127–140. [Google Scholar] [CrossRef] [Green Version]
  53. Sandhya, V.; Ali, S.Z.; Grover, M.; Reddy, G.; Venkateswarlu, B. Alleviation of drought stress effects in sunflower seedlings by exopolysaccharides producing Pseudomonas putida strain P45. Biol. Fertil. Soil 2009, 46, 17–26. [Google Scholar] [CrossRef]
  54. Glick, B.R. Bacteria with ACC deaminase can promote plant growth and help to feed the world. Microb. Res. 2014, 169, 30–39. [Google Scholar] [CrossRef]
  55. Hafez, E.; Omara, A.E.D.; Ahmed, A. The Coupling Effects of Plant Growth Promoting Rhizobacteria and Salicylic Acid on Physiological Modifications, Yield Traits, and Productivity of Wheat under Water Deficient Conditions. Agronomy 2019, 9, 524. [Google Scholar] [CrossRef] [Green Version]
  56. Kumari, S.; Vaishnav, A.; Jain, S.; Varma, A.; Choudhary, D.K. Induced drought tolerance through wild and mutant bacterial strain Pseudomonas simiae in mung bean (Vigna radiata L.). World J. Microbiol Biotechnol. 2016, 32, 4. [Google Scholar] [CrossRef]
  57. Hayat, R.; Ali, S.; Amara, U.; Khalid, R.; Ahmed, I. Soil beneficial bacteria and their role in plant growth promotion: A review. Ann. Microbiol. 2010, 60, 579–598. [Google Scholar] [CrossRef]
  58. Siddikee, M.A.; Chauhan, P.S.; Anandham, R.; Gwang-Hyun, H.; Sa, T. Isolation, characterization, and use for plant growth promotion under salt stress, of ACC deaminase-producing halotolerant bacteria derived from coastal soil. J. Microbiol. Biotechnol. 2010, 20, 1577–1584. [Google Scholar] [CrossRef]
  59. Bashan, Y.; de-Bashan, L.E. How the plant growth-promoting bacterium Azospirillum promotes plant growth a critical assessment. Adv. Agron. 2010, 108, 77–136. [Google Scholar]
  60. Mena, E.; Leiva-Mora, M.; Jayawardana, E.K.D.; García, L.; Veitía, N.; Bermúdez-Caraballoso, I.; Collado, R.; Ortíz, R.C. Effect of salt stress on seed germination and seedlings growth of Phaseolus vulgaris L. Cultivos Trop. 2015, 36, 71–74. [Google Scholar]
  61. Omara, A.; Elbagory, M. Enhancement of plant growth and yield of wheat (Triticum aestivum L.) under drought conditions using plant-growth-promoting bacteria. Ann. Res. Rev. Biol. 2018, 28, 1–18. [Google Scholar] [CrossRef]
  62. Cokkizgin, A. Salinity stress in common bean (Phaseolus vulgaris L.) seed germination. Not. Bot. Horti Agrobo Cluj Napoca 2012, 40, 177–182. [Google Scholar] [CrossRef] [Green Version]
  63. Hafez, E.M.; Ragab, A.Y.; Kobata, T. Water-Use Efficiency and Ammonium-N Source Applied of Wheat under Irrigated and Desiccated Conditions. Int. J. Plant Soil Sci. 2014, 3, 1302–1316. [Google Scholar] [CrossRef]
  64. Kheir, A.S.; Abou elsoud, H.M.; Hafez, E.M.; Ali, O.A. Integrated effect of nano-Zn, nano-Si, and drainage using crop straw-filled ditches on saline sodic soil properties and rice productivity. Arab. J. Geosci. 2019, 12, 471. [Google Scholar] [CrossRef]
  65. Hafez, E.M.; Gharib, H.S. Effect of foliar application of ascorbic acid on physiological and biochemical characteristics of wheat under water stress. Int. J. Plant Prod. 2016, 10, 579–596. [Google Scholar]
Figure 1. Effect of soil application by plant growth-promoting rhizobacteria (PGPR), biochar, and their combination on soil moisture constants (FC= field capacity, WP= wilting point, and ASW= available soil water) of rice plants under different irrigation intervals (I1, I2 and I3) in salt-affected soil during two growing seasons; 2017 and 2018. The data are means ± SE of four replicates. Mean values designed by the same letter in each column are not significant according to Duncan’s Multiple Range Test.
Agronomy 09 00847 g001
Figure 2. Effect of soil applications by PGPR, biochar, and their combination on soil physicochemical properties of rice plants under different irrigation intervals (I1, I2, and I3) in salt-affected soil during two growing seasons; 2017 and 2018. The data are means ±SE of four replicates. Mean values designed by the same letter in each column are not significant according to Duncan’s Multiple Range Test.
Agronomy 09 00847 g002
Figure 3. Effect of soil applications by PGPR, biochar, and their combination on sodium adsorption ratio (SAR) (sodium adsorption ratio) and Ca++ of rice plants under different irrigation intervals (I1, I2, and I3) in salt-affected soil during two growing seasons; 2017 and 2018. The data are means ± SE of four replicates. Mean values designed by the same letter in each column are not significant according to Duncan’s Multiple Range Test.
Agronomy 09 00847 g003
Figure 4. Effect of soil applications by PGPR, biochar, and their combination on chlorophyll content (SPAD value) of rice leaves under different irrigation intervals conditions in salt-affected soil during two growing seasons; 2017 and 2018. The data are means ± SE of four replicates. Mean values designed by the same letter in each column are not significant according to Duncan’s Multiple Range Test.
Agronomy 09 00847 g004
Figure 5. Effect of soil applications by PGPR, biochar, and their combination on nitrogen, phosphorus, and potassium uptake (kg ha−1) of rice plants under different irrigation intervals (I1, I2, and I3) in salt-affected soil during two growing seasons 2017 and 2018. The data are means ±SE of four replicates. Mean values designed by the same letter in each column are not significant according to Duncan’s Multiple Range Test.
Agronomy 09 00847 g005
Table 1. Some physicochemical properties of soil used in the two summer growing seasons 2017 and 2018.
Cations (meq L−1)Anions (meq L−1)
SeasonO.M (%)EC (dS m−1)pHNa+K+Mg++Ca++ClHCO3SO4
20171.204.678.0726.750.336.769.5424.564.6115.13
20181.394.297.9822.630.395.237.2918.213.3411.15
O.M = organic matter, EC= electrical conductivity.
Table 2. Meteorological data for the two winter growing seasons 2017 and 2018.
Year Month20172018
Temperature (°C)Wind Speed (km day−1)RH (%)Temperature (°C)Wind Speed (km day−1)RH (%)
MaxMinMaxMin
May29.713.6135.059.827.915.491.062.7
June34.619.0115.165.534.515.4101.063.4
July34.921.997.164.533.021.0101.164.1
Aug.34.519.879.563.435.022.291.566.9
Sept.33.519.583.368.534.419.882.267.4
Average33.418.1101.967.332.917.493.366.1
Max = maximum, min = minimum, RH = relative humidity, there was no precipitation during the growing period.
Table 3. The mean values of soil moisture constants of the experimental site before cultivation.
Soil Depth(cm)Field Capacity (%)Wilting Point (%)Available Soil Water (%)
201720182017201820172018
0–2040.1543.0120.7617.4319.425.6
20–4037.2742.3320.2118.6517.123.7
40–6036.4539.8819.7619.2116.720.7
Mean37.2342.3220.3320.5616.921.8
Table 4. Effect of different salinity and drought stress conditions on the production of IAA and phosphate solubilization by different PGPRs strains.
StrainsSalinity Concentrations (dS m−1)
02468
IAA µg mL−1
P. koreensis20.41 ± 0.1017.27 ± 0.1514.14 ± 0.119.22 ± 0.121.94 ± 0.05
A. chroococcum19.88 ± 0.1215.70 ± 0.1010.19 ± 0.004.18 ± 0.030.69 ± 0.01
A. lipoferum19.94 ± 0.0015.86 ± 0.4010.69 ± 0.025.88 ± 0.040.73 ± 0.00
B. coagulans19.64 ± 0.1015.76 ± 0.1011.19 ± 0.096.18 ± 0.070.89 ± 0.02
E. cloacae20.14 ± 0.1015.66 ± 0.0211.09 ± 0.036.03 ± 0.030.79 ± 0.01
P2O5 µg mL−1
P. koreensis8.70 ± 0.077.30 ± 0.085.88 ± 0.084.06 ± 0.051.59 ± 0.07
A. chroococcum7.44 ± 0.115.76 ± 0.063.61 ± 0.052.37 ± 0.020.50 ± 0.04
A. lipoferum7.94 ± 0.106.46 ± 0.044.11 ± 0.022.87 ± 0.010.61 ± 0.02
B. coagulans8.14 ± 0.116.86 ± 0.064.91 ± 0.053.07 ± 0.020.90 ± 0.04
E. cloacae8.84 ± 0.106.96 ± 0.004.94 ± 0.022.97 ± 0.030.84 ± 0.01
StrainsDrought Concentrations (%)
05102030
IAA µg mL−1
P. koreensis16.11 ± 0.1515.17 ± 0.1112.04 ± 0.107.12 ± 0.110.84 ± 0.02
A. chroococcum15.14 ± 0.0012.03 ± 0.109.01 ± 0.025.47 ± 0.010.49 ± 0.01
A. lipoferum16.40 ± 0.0015.62 ± 0.019.08 ± 0.025.97 ± 0.030.59 ± 0.02
B. coagulans15.44 ± 0.0112.66 ± 0.1110.09 ± 0.086.87 ± 0.090.69 ± 0.03
E. cloacae15.04 ± 0.0412.68 ± 0.109.11 ± 0.045.77 ± 0.020.65 ± 0.01
P2O5 µg mL−1
P. koreensis6.77 ± 0.096.20 ± 0.075.78 ± 0.064.46 ± 0.061.17 ± 0.09
A. chroococcum5.48 ± 0.015.16 ± 0.003.21 ± 0.002.87 ± 0.010.55 ± 0.03
A. lipoferum6.34 ± 0.105.86 ± 0.025.09 ± 0.043.21 ± 0.020.59 ± 0.01
B. coagulans6.44 ± 0.186.06 ± 0.065.01 ± 0.064.17 ± 0.030.70 ± 0.06
E. cloacae6.84 ± 0.106.16 ± 0.035.21 ± 0.033.10 ± 0.020.67 ± 0.02
Salinity concentrations (NaCl), drought concentrations (PEG 6000), IAA: indole acetic acid; data are presented as the mean ± SD with n = 3.
Table 5. Effect of different salinity and drought stresses conditions on germination indicators of rice seeds (Oryza sativa cv. Sakha 105) by different PGPRs strains.
StrainsSalinity Concentrations (dS m−1)
02468
FGP (%)
P. koreensis100 ± 0.12100 ± 0.16100 ± 0.1265 ± 0.1335 ± 0.04
A. chroococcum100 ± 0.10100 ± 0.11100 ± 0.0450 ± 0.0725 ± 0.01
A. lipoferum100 ± 0.10100 ± 0.01100 ± 0.0355 ± 0.0325 ± 0.02
B. coagulans100 ± 0.11100 ± 0.10100 ± 0.0858 ± 0.0828 ± 0.02
E. cloacae100 ± 0.08100 ± 0.07100 ± 0.0250 ± 0.0120 ± 0.03
MGT(day)
P. koreensis1.90 ± 0.052.30 ± 0.052.50 ± 0.082.91 ± 0.083.33 ± 0.09
A. chroococcum2.29 ± 0.102.57 ± 0.012.85 ± 0.023.44 ± 0.053.86 ± 0.07
A. lipoferum2.27 ± 0.112.67 ± 0.032.85 ± 0.043.49 ± 0.033.89 ± 0.03
B. coagulans2.23 ± 0.162.47 ± 0.012.65 ± 0.063.14 ± 0.043.56 ± 0.04
E. cloacae2.31 ± 0.122.67 ± 0.022.95 ± 0.073.55 ± 0.013.96 ± 0.01
VI
P. koreensis0.008 ± 0.070.009 ± 0.090.011 ± 0.040.007 ± 0.040.001 ± 0.06
A. chroococcum0.002 ± 0.010.002 ± 0.040.003 ± 0.010.003 ± 0.020.001 ± 0.02
A. lipoferum0.004 ± 0.120.005 ± 0.050.005 ± 0.020.003 ± 0.030.001 ± 0.04
B. coagulans0.005 ± 0.110.007 ± 0.030.009 ± 0.010.004 ± 0.010.001 ± 0.03
E. cloacae0.003 ± 0.100.005 ± 0.020.007 ± 0.040.003 ± 0.020.001 ± 0.02
StrainsDrought Concentrations (%)
05102030
FGP (%)
P. koreensis100 ± 0.11100 ± 0.1085 ± 0.1055 ± 0.1225 ± 0.01
A. chroococcum100 ± 0.02100 ± 0.1075 ± 0.0330 ± 0.0415 ± 0.01
A. lipoferum100 ± 0.02100 ± 0.1075 ± 0.0440 ± 0.0615 ± 0.02
B. coagulans100 ± 0.01100 ± 0.1480 ± 0.0745 ± 0.0920 ± 0.04
E. cloacae100 ± 0.03100 ± 0.1570 ± 0.0640 ± 0.0515 ± 0.03
MGT(day)
P. koreensis2.00 ± 0.052.50 ± 0.052.50 ± 0.083.00 ± 0.083.50 ± 0.09
A. chroococcum2.93 ± 0.172.98 ± 0.063.25 ± 0.013.64 ± 0.043.96 ± 0.02
A. lipoferum2.94 ± 0.133.07 ± 0.033.35 ± 0.023.74 ± 0.023.99 ± 0.01
B. coagulans2.43 ± 0.162.87 ± 0.012.95 ± 0.063.54 ± 0.043.86 ± 0.04
E. cloacae2.73 ± 0.182.97 ± 0.023.45 ± 0.053.74 ± 0.033.96 ± 0.02
VI
P. koreensis0.009 ± 0.040.011 ± 0.030.014 ± 0.040.004 ± 0.060.001 ± 0.03
A. chroococcum0.010 ± 0.130.011 ± 0.030.011 ± 0.010.004 ± 0.050.001 ± 0.05
A. lipoferum0.011 ± 0.120.011 ± 0.040.012 ± 0.020.005 ± 0.040.001 ± 0.07
B. coagulans0.011 ± 0.150.012 ± 0.050.013 ± 0.010.007 ± 0.010.001 ± 0.06
E. cloacae0.012 ± 0.110.013 ± 0.060.013 ± 0.020.006 ± 0.030.001 ± 0.04
FGP: final germination percentage (%); MGT: mean germination time; VI: vigor index. Data are presented as the mean ±SD with n = 3.
Table 6. Relative water content, stomatal conductance, and proline content of rice leaves as affected by PGPR, biochar, and their combination under different irrigation intervals (I1, I2, and I3) in salt-affected soil in 2017 and 2018 seasons.
TreatmentsRelative Water Content (%)Stomatal Conductance (mmol H2O m−2 s−1)Proline Content (μ g−1 FW)
201720182017201820172018
Irrigation intervals (I)
I190.70a91.87a52.85a53.37a8.28b7.53b
I288.80a89.79a50.76a52.84a8.39b7.89b
I380.52b82.82b44.97b45.78b10.48a10.04a
F-Test************
Soil treatments (S)
Control80.50d82.56d 43.76d44.65d12.65a11.66a
PGPR85.12c87.23c 47.89c49.69c9.83b9.04b
Biochar88.32b90.78b 51.88b52.32b7.74c7.25c
Combination92.80a93.56a 54.54a56.02a6.01d5.88d
F-Test************
Interaction (I × S)************
Mean values designed by the same letter in each column are not significant according to Duncan’s Multiple Range Test, I1 (irrigation every 6 days), I2 (irrigation every 8 days), I3 (irrigation every 10 days), Control = neither inoculation nor amendment was applied, PGPR = Plant growth-promoting rhizobacteria, Combination= PGPR+biochar, ** = p ≤ 0.01.
Table 7. K+, Na+, and K+/Na+ of rice leaves as affected by PGPR, biochar, and their combination under different irrigation intervals (I1, I2, and I3) in salt-affected soil in 2017 and 2018 seasons.
TreatmentsLeaf K+ (mg/g LDW)Leaf Na+ (mg/g LDW)Leaf K+/Na+ (mg/g LDW)
201720182017201820172018
Irrigation intervals (I)
I17.08a7.14a7.69b7.51b0.91a0.96a
I26.78a6.93a7.84b7.60b0.88a0.90a
I36.19b6.26b8.22a8.05a0.75b0.78b
F-Test************
Soil treatments (S)
Control6.02d6.17d8.67a8.45a0.69d0.73d
PGPR6.65c6.76c8.23b7.98b0.83c0.85c
Biochar6.87b6.95b7.75c7.34c0.91b0.95b
Combination7.25a7.23a7.34d7.12d0.98a1.01a
F-Test************
Interaction (I × S)************
Mean values designated by the same letter in each column are not significantly different according to Duncan’s Multiple Range Test, I1 (irrigation every 6 days), I2 (irrigation every 8 days), I3 (irrigation every 10 days), Control = neither inoculation nor amendment was applied, PGPR= Plant growth-promoting rhizobacteria, Combination = PGPR+biochar, ** = p ≤ 0.01, LDW = leaf dry weight.
Table 8. Yield-related traits of rice as affected by PGPR, biochar, and their combination under different irrigation intervals (I1, I2, and I3) in salt-affected soil in 2017 and 2018 seasons.
Treatments1000-Grain Weight (g)Number of Grains Panicle−1Number of Panicles m−2
201720182017201820172018
Irrigation intervals (I)
I128.54a29.73a132.78a134.33a440.65a445.95a
I226.65a27.67a129.97a131.65a436.43a442.84a
I320.34b22.55b119.62b121.99b428.87b432.54b
F-Test************
Soil treatments (S)
Control19.43d21.06d119.44d122.14d420.34d424.76d
PGPR23.24c25.56c125.25c127.38c435.22c438.65c
Biochar28.07b28.44b130.15b130.85b439.55b442.37b
Combination29.94a31.34a134.85a137.19a446.45a455.94a
F-Test**** ********
Interaction (I × S)************
Mean values designed by the same letter in each column are not significant according to Duncan’s Multiple Range Test, I1 (irrigation every 6 days), I2 (irrigation every 8 days), I3 (irrigation every 10 days), Control = neither inoculation nor amendment was applied, PGPR = Plant growth-promoting rhizobacteria, Combination = PGPR+biochar, ** = p ≤ 0.01.
Table 9. Yield of rice as affected by PGPR, biochar, and their combination under different irrigation intervals (I1, I2, and I3) in salt-affected soil in 2017 and 2018 seasons.
TreatmentsGrain Yield (t ha−1)Straw Yield (t ha−1)Harvest Index (%)
201720182017201820172018
Irrigation intervals (I)
I18.75a 8.54a14.08a14.38a38.32a37.27a
I28.46a8.25a13.89a14.04a37.81a36.97a
I37.53b7.15b13.26b13.26b36.21b35.03b
F-Test************
Soil treatments (S)
Control 7.55d 7.15d 13.04d 13.25d36.66d 35.04d
PGPR 8.05c 7.83c13.55c13.77c37.29c36.30c
Biochar8.45b8.25b13.97b14.08b37.74b36.91b
Combination8.94a8.72a14.52a14.48a38.38a37.63a
F-Test************
Interaction (I × S)************
Mean values designed by the same letter in each column are not significant according to Duncan’s Multiple Range Test, I1 (irrigation every 6 days), I2 (irrigation every 8 days), I3 (irrigation every 10 days), Control = neither inoculation nor amendment was applied, PGPR = Plant growth-promoting rhizobacteria, Combination = PGPR+biochar, ** = p ≤ 0.01.

