Article

Expression Levels of the γ-Glutamyl Hydrolase I Gene Predict Vitamin B9 Content in Potato Tubers

by
Bruce R. Robinson
1,2,
Carolina Garcia Salinas
3,
Perla Ramos Parra
3,
John Bamberg
4,
Rocio I. Diaz de la Garza
3 and
Aymeric Goyer
1,2,*
1
Department of Botany and Plant Pathology, Oregon State University, Corvallis, OR 97331, USA
2
Hermiston Agricultural Research and Extension Center, Oregon State University, Hermiston, OR 97838, USA
3
Tecnologico de Monterrey, Escuela de Ingeniería y Ciencias, Monterrey, Nuevo León, Mexico
4
USDA/Agricultural Research Service, Sturgeon Bay, WI 54235, USA
*
Author to whom correspondence should be addressed.
Agronomy 2019, 9(11), 734; https://doi.org/10.3390/agronomy9110734
Submission received: 30 September 2019 / Revised: 30 October 2019 / Accepted: 6 November 2019 / Published: 9 November 2019
(This article belongs to the Special Issue Biofortification of Crops)

Abstract

:
Biofortification of folates in staple crops is an important strategy to help eradicate human folate deficiencies. Folate biofortification using genetic engineering has shown great success in rice grain, tomato fruit, lettuce, and potato tuber. However, consumers’ skepticism, juridical hurdles, and lack of economic model have prevented the widespread adoption of nutritionally-enhanced genetically-engineered (GE) food crops. Meanwhile, little effort has been made to biofortify food crops with folate by breeding. Previously we reported >10-fold variation in folate content in potato genotypes. To facilitate breeding for enhanced folate content, we attempted to identify genes that control folate content in potato tuber. For this, we analyzed the expression of folate biosynthesis and salvage genes in low- and high-folate potato genotypes. First, RNA-Seq analysis showed that, amongst all folate biosynthesis and salvage genes analyzed, only one gene, which encodes γ-glutamyl hydrolase 1 (GGH1), was consistently expressed at higher levels in high- compared to low-folate segregants of a Solanum boliviense Dunal accession. Second, quantitative PCR showed that GGH1 transcript levels were higher in high- compared to low-folate segregants for seven out of eight pairs of folate segregants analyzed. These results suggest that GGH1 gene expression is an indicator of folate content in potato tubers.

1. Introduction

Folates are essential micronutrients in the human diet as they fulfill important cellular functions. The main sources of folate in the human diet are plants, with leafy green vegetables and certain fruits being very good sources. However, staple crops such as potato, rice, or corn currently contain relatively low levels of folates [1,2]. Folate malnutrition is considered to be a global problem, with impoverished and developing regions being some of the most affected areas [3]. In areas of the world that have mandatory folic acid fortification programs such as the United States and Canada, folate intake is still sub optimal [4]. The improvement of staple crops’ folate content is an attractive strategy for helping to alleviate health problems related to folate deficiency [2].
Folates are a small family of cofactors involved in one-carbon unit reactions. In mitochondria, they are required for the synthesis of formylated methionyl-tRNAs, the interconversions of serine and glycine, and the catabolism of histidine and purines [5,6,7]. In the cytosol, folates are important cofactors in the synthesis of thymidylate and the remethylation of homocysteine to methionine, the precursor of S-adenosylmethionine (SAM) [7]. SAM is the universal methyl donor in reactions such as DNA methylation [8], and in plants, the synthesis of lignins, alkaloids, and betaines [9,10]. Folate metabolism is linked to DNA methylation, which plays an important role in epigenetics, transposon silencing, and genome stability [11,12]. Folates are important in the production of reducing power in the NADPH form [13,14]. In plants, folates play a critical role in nitrogen metabolism [15], photorespiration [10], and the biosynthesis of chlorophyll [16,17].
The biosynthesis pathway of folates has now been well described in plants [18] and some folate salvage reactions have been characterized [19,20]. Folates are made up of a pteridine ring attached to a p-aminobenzoate (p-ABA) moiety and a glutamate residue [18]. A short poly-γ-glutamyl tail of up to approximately eight residues is usually attached to the γ-carboxyl group of the first glutamate residue. The pteridine branch of the pathway is located in the cytosol and involves three enzymatic reactions catalyzed by GTP cyclohydrolase I (GCHI) [21], dihydroneopterin triphosphate (DHNTP) diphosphatase (DHNTP-PPase), and DHN aldolase (DHNA) [22]. DHNA also catalyzes epimerization of DHN to dihydromonapterin (DHM), which is also cleaved to hydroxylmethyldihydropterin (HMDHP). The p-ABA branch is located in plastids, where the sequential actions of aminodeoxychorismate (ADC) synthase (ADCS) and ADC lyase (ADCL) convert chorismate to p-ABA [23,24]. The rest of the pathway takes place in mitochondria, where HMDHP is first pyrophosphorylated by HMDHP pyrophosphokinase (HPPK) and then condensed with p-ABA by dihydropteroate synthase (DHPS) [25]. DHF synthase (DHFS) then catalyzes Glu addition [26], and the resulting DHF is reduced to tetrahydrofolate (THF) by DHF reductase (DHFR) [27]. The polyglutamyl tail is then added by folylpolyglutamate synthases (FPGS), which are present in mitochondria, chloroplasts, and the cytosol [26]. The tail can be removed by γ-glutamyl hydrolase (GGH) [19,28]. A salvage pathway for folate degradation products that involves GGHs, p-ABA-glucose hydrolase, and pterin aldehyde reductase has also been proposed [18]. Finally, p-ABA is glycosylated to its glucose ester p-ABA-glucose by UDP-p-ABA-acylglucosyltransferase. p-ABA-glucose is the predominant form of p-ABA in plant cells [29].
Folate concentrations vary according to plant species [30], genotypes within species [31,32], organs [33], developmental stages [33,34], as well as environmental conditions [31]. Exploring folate diversity in various potato species to identify genotypes that are good sources of high folate traits is the first step toward nutritional improvement, or biofortification, of potato using breeding. Folate content in potato tubers can vary greatly, from below 500 ng g−1 dry weight to greater than 2500 ng g−1 dry weight [31,32,35]. However, very little is known about the regulatory mechanisms that control folate levels. In tomato fruit, the expression of GCHI, ADCS, and ADCL1 genes decline during fruit maturation and correlates with a decrease in folate concentrations [36]. In engineered tomato fruits overexpressing GCHI and ADCS, the folate biosynthesis genes DHNA, ADCL1, and FPGS are induced, apparently in response to the accumulation of folate pathway intermediates [36]. Studies in Arabidopsis and tomato have shown that folate polyglutamylation, which depends on the activities of both FPGSs and GGHs, play an essential role in folate homeostasis. Indeed, ablation of the mitochondrial FPGS gene or overexpression of GGH in vacuoles caused 40–45% reduction in total folate in Arabidopsis, while lowered total GGH activity increased total folate content by 34% [37,38]. The combined actions of the FPGSs and GGHs control the polyglutamate tail length of folates, which is critical in determining their affinity to enzymes, sub-cellular compartmentalization and storage, as well as their overall stability [37,38]. However, data suggest that folate content regulation may differ according to species and/or organs. Indeed, the classical two-genes engineering strategy (i.e., overexpression of the two biosynthetic genes GCHI and ADCS) has been very successful at boosting folate content in rice grain and tomato fruit (up to 100- and 25-fold increase, respectively) [39,40]. Meanwhile, this same strategy produced modest (barely 2-fold) increase in potato tubers [41], indicating that a different regulatory mechanism of folate homeostasis exists in potato. A new strategy that involves the overexpression of two additional genes, HPPK/DHPS and FPGS, later showed further increase in folate content in potato tubers (up to 12-fold) [42]. Therefore, more research is needed to better understand folate content regulation in potato tuber.
The focus of this study was to investigate the expression of folate metabolism genes as potential folate level determinants in tubers of low- and high-folate potato genotypes. RNA-Seq analysis showed that one gene, GGH1, was expressed at higher levels in high folate compared to low folate genotypes. These results were confirmed on additional high- and low-folate materials by quantitative real-time PCR.

2. Materials and Methods

2.1. Potato Tuber Material

In a previous study [32], we found high folate concentrations in tubers pooled from four individuals from the wild species Solanum boliviense accession PI 597736. As a follow up fine screening, individual seeds from this accession were planted on 5 December 2011, and plant cuttings were made on 27 February 2012 to produce clonal replicates. Plants were grown under glasshouse in Sturgeon Bay, WI. Tubers from each of four clones named fol 1.6, fol 1.3, fol 1.5 and fol 1.11 were harvested in June 2012. Because of low tuber production, tubers from clonal replicates were pooled as one biological replicate. These four clones were re-propagated from stolon shoots in early May 2012, and then tubers from two plants per clone were harvested in November 2012 and kept separated (= two biological replicates), and re-evaluated for folate. In 2016 and 2017, clonal plants were propagated in vitro in February, and then transferred to soil in a greenhouse. In 2016, tubers were harvested in summer from several plants, pooled and split into two biological replicates. In 2017, tubers were harvested in July from three individual plants and kept separated (= three biological replicates).
True seeds of wild and primitive cultivated species S. boliviense PI 597736, S. tuberosum subsp. andigenum PI 225710 and PI 546023, and S. vernei PI 558149 and PI 500063 were obtained from the U.S. potato genebank (USDA Agricultural Research Service Germplasm Resource Information Network (GRIN), www.ars-grin.gov). Seeds were soaked in 1 g/L GA3 overnight before planting to Metro-mix in May 2014. When plantlets reached approximately 8-cm tall, they were transplanted into 8-cm square individual pots containing Sunshine Mix LA4P in a greenhouse. All-purpose fertilizer 20-20-20 was applied at 200 mg/L once a week until senescence. Plants were watered twice a week until senescence. Vines were killed on 31 October 2014, and tubers were harvested on 10 November. Greenhouse temperature was set at 21 °C day time and 15 °C night time. Supplemental light was provided for 14 h per day from a mixture of 400 Watt high pressure sodium and 1000 Watt metal halide lamps. Tubers were then harvested and processed as described previously [32].
An F1 population named BRR1 was produced by crossing two high folate lines, fol 1.6 with fol 1.7, the idea being to “purify” high folate. An F2 population named BRR3 was produced by crossing the high folate fol 1.6 with a low/medium folate clone USW4self#3.

2.2. Folate Analysis by Microbiological Assay

Folates were extracted by using a tri-enzyme extraction method as previously published [31,35]. Freeze-dried potato samples (100 mg) were used for all folate extractions. Extracts were flushed with nitrogen and stored at −80 °C until analysis by microbiological assay. Controls containing all reagents but potato samples were used to determine the amount of any residual folates in the reagents. There were no detectable folates in any of the reagents used. Folate concentrations were measured by microbiological assay using Lactobacillus rhamnosus as previously described [32].

2.3. Folate Analysis by HPLC

Folate determination and quantification were performed as previously described [43,44] with minor modifications. 100 mg of freeze-dried potatoes were ground in liquid nitrogen and extracted in 10 mL of folate extraction buffer (50 mM HEPES, 50 mM CHES, 10 mM β-mercaptoethanol, 2% ascorbic acid, 4 mM CaCl2, pH 7.85) and boiled for 10 min for folate release. The tri-enzyme treatment was also applied to the samples using amylase, protease, and a recombinant conjugase from Arabidopsis (AtGGH2) to fully release and deglutamylate folates. The extracts were purified using folate-binding columns. Folates were separated by liquid chromatography using a Prodigy ODS(2) column (150 mm × 3.2 mm; 5 μm particle size) (Phenomenex, Torrance, CA, USA) and folate species were detected by a four-channel electrochemical cell (CoulArray model 5600A; ESA Inc., Chelmsford, MA, USA) with potentials set at 100, 200, 300, and 400 mV. Calibration curves were made using THF, 5-methyl-THF (5-CH3-THF), 5-formyl-THF (5-CHO-THF), and 5,10-methenyl-THF (5,10-CH = THF) commercial standards (Shircks Laboratories, Buechstrasse, Jona, Switzerland). Polyglutamylated forms of 5-CH3-THF were quantified as equivalents to the monoglutamyl class.

2.4. RNA Isolation

RNA was extracted using a modified hot phenol method as described previously [45]. One hundred milligrams of freeze dried tuber powder (for qPCR analysis) or 1–2 g fresh tuber tissue (for RNA-Seq analysis) were added to a mixture of 4 mL pre-warmed phenol (pH 4.3) and 4 mL extraction buffer consisting of 100 mM LiCl, 100 mM Tris pH 8.5, 10 mM ethylenediaminetetraacetic acid, 1% sodium dodecyl sulfate, and 15 mM dithiothreitol. Samples were vortexed and incubated at 60 °C for 20 to 30 min. Four mL of chloroform:isoamyl alcohol (24:1) were added to the solution, and the sample was vortexed and centrifuged at 6800× g for 10 min at 4 °C. The aqueous phase was transferred into a new tube containing 4 mL phenol:chloroform:isoamyl alcohol (25:24:1), vortexed, and centrifuged at 6800× g for 10 min at 4 °C. The previous step was repeated twice with phenol:chloroform:isoamyl alcohol (25:24:1) and twice with chloroform:isoamyl alcohol (24:1). RNAs were precipitated with one volume of 4 M LiCl, washed with 70% ethanol, and re-suspended in 50 µL diethylpyrocarbonate-treated water. Genomic DNA was removed by DNase treatment using the DNA-Free kit™ (Ambion, Austin, TX, USA). RNAs were quantified and normalized to 200 ng/µL using a Nanodrop (Thermo Scientific, Wilmington, DE, USA). For qPCR analysis, two RNA isolations were performed on freeze dried material from each individual plant. Tubers from each individual plant (i.e., one plant is from one seed) were bulked, freeze dried, and ground together.

2.5. RNA Sequencing

Two biological repetitions of each clone fol 1.3, fol 1.5, fol 1.6, and fol 1.11 that were harvested in Nov. 2012 were used for RNA extraction. RNA samples (duplicate of each of the clones fol 1.3, fol 1.5, fol 1.6 and fol 1.11) were bar coded, pooled, processed together, and sequenced in one Illumina HiSeq2000 lanes (51-cycle v3 Single End). Illumina library preparation was done at the Center for Genome Research and Biocomputing at Oregon State University using TruSeq RNA. Illumina libraries were quantified by qPCR for optimal cluster density. Mapping of the RNA-Seq reads to the DM potato reference genome [46], transcript assembly, and determination of differences in expression levels were performed using JEANS, a modified version of GENE-counter [47], in combination with NBPSeq [48].

2.6. Real Time Quantitative Reverse Transcription PCR

One to 2 µg of RNA were converted to cDNA using New England BioLab’s M-MuLV reverse transcriptase (New England BioLabs, Ipswich, MA, USA) and oligo-dT18 primer (Thermo Scientific, Wilmington, DE, USA). RNA template (5–10 µL) was mixed with 1 µL oligo-dT18 and nuclease-free water to a final volume of 12 µL. This solution was placed in a 70 °C water bath for 5 min and then cooled on ice. Eight microliters of reverse transcriptase (RT) master mix (composed of 2 µL 10 × M-MuLV buffer, 2 uL 10 mM dNTPs, 0.25 uL M-MuLV reverse transcriptase, and 3.75 uL nuclease-free water) were then added to each sample. RT reactions were carried out on a Bio-Rad C1000 thermocycler (Bio-Rad Laboratories, Hercules, CA, USA). The RT cycle was 25 °C for 5 min, 42 °C for 1 h, 65 °C for 20 min. Samples were then stored in a −20 °C freezer until analysis. cDNA templates were diluted four times prior to use in qPCR reactions.
All qPCR reactions were run on an Agilent Stratagene Mx3005P (Agilent Technologies, Santa Clara, CA, USA) using Taqman environmental Mastermix II (Thermo Scientific, Wilmington, DE, USA). The PCR cycle was: 95 °C for 10 min followed by 40 cycles with the following steps: 95 °C for 30 s, 60 °C for 30 s and 72 °C for 30 s. All threshold values were set within the Mx3005P analysis software. GGH1, GGH2 and GGH3 transcripts sequences from the DM genotype were aligned in order to design primers specific of GGH1 (Figure S1). EF1-α sequences from four potato genotypes were aligned to design primers within highly conserved regions (Figure S1). Primers sequences were as follows: GGH1 Fwd: 5′-GAAGGCAGGGAAGGGTTATG-3′; GGH1 Rev: 5′-GCATCAATAAGATTGTGCAGTTG-3′; EF1α Fwd: 5′-CTGGTATGGTTGTGACCTTTG-3′; EF1α Rev: 5′-TTGAACCCAACATTGTCACC-3′.
PCR reactions were run in technical quadruplet in 25 uL total volume (4 uL of diluted cDNA samples, 2.5 uL of 0.1 µM primers, and 12.5 uL Taqman Mastermix II). Comparison of expression was made between individuals from the same segregating population, species, or harvest since the samples selected for this study were not biological replicates. This method was described previously in “example 4” [49]. For instance, there is no justification for comparing GGH1 expression between S. vernei and S. tuberosum subsp. andigenum (i.e., Tbr PI 225710 vs. Vrn PI 500063) because they are different species, so comparisons were only made between a high folate and low folate individual from S. vernei or S. tuberosum subsp. andigenum (i.e., high folate Tbr PI 225710 vs. low folate Tbr PI 546023). Mean and standard deviation for each sample were calculated from technical quadruplates using the 2−ΔCt [2-CtGGH1-CtEF1-α] method [49]. The difference between samples within each population was then calculated to determine the fold change in expression of GGH1 between high folate individuals and low folate individuals.

3. Results

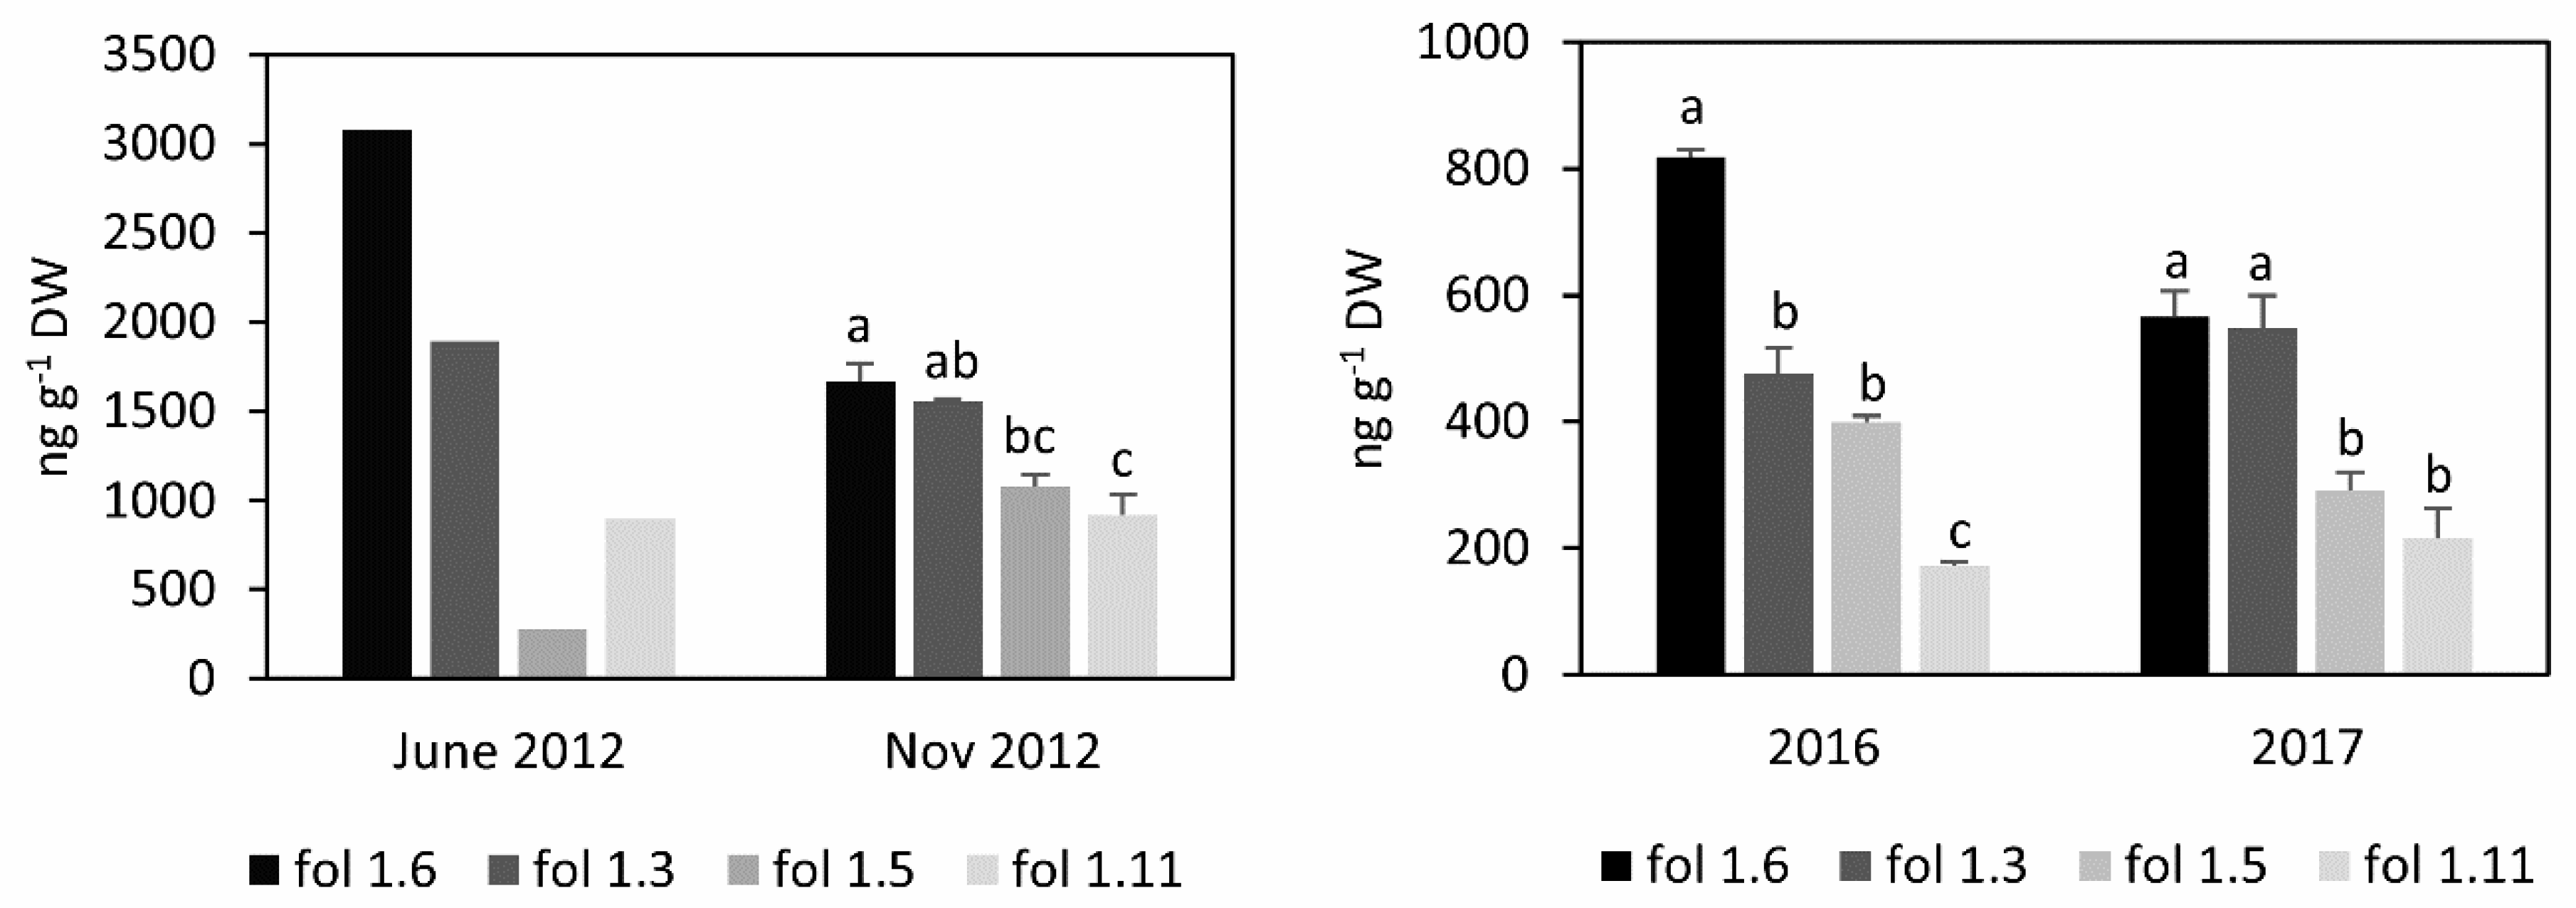
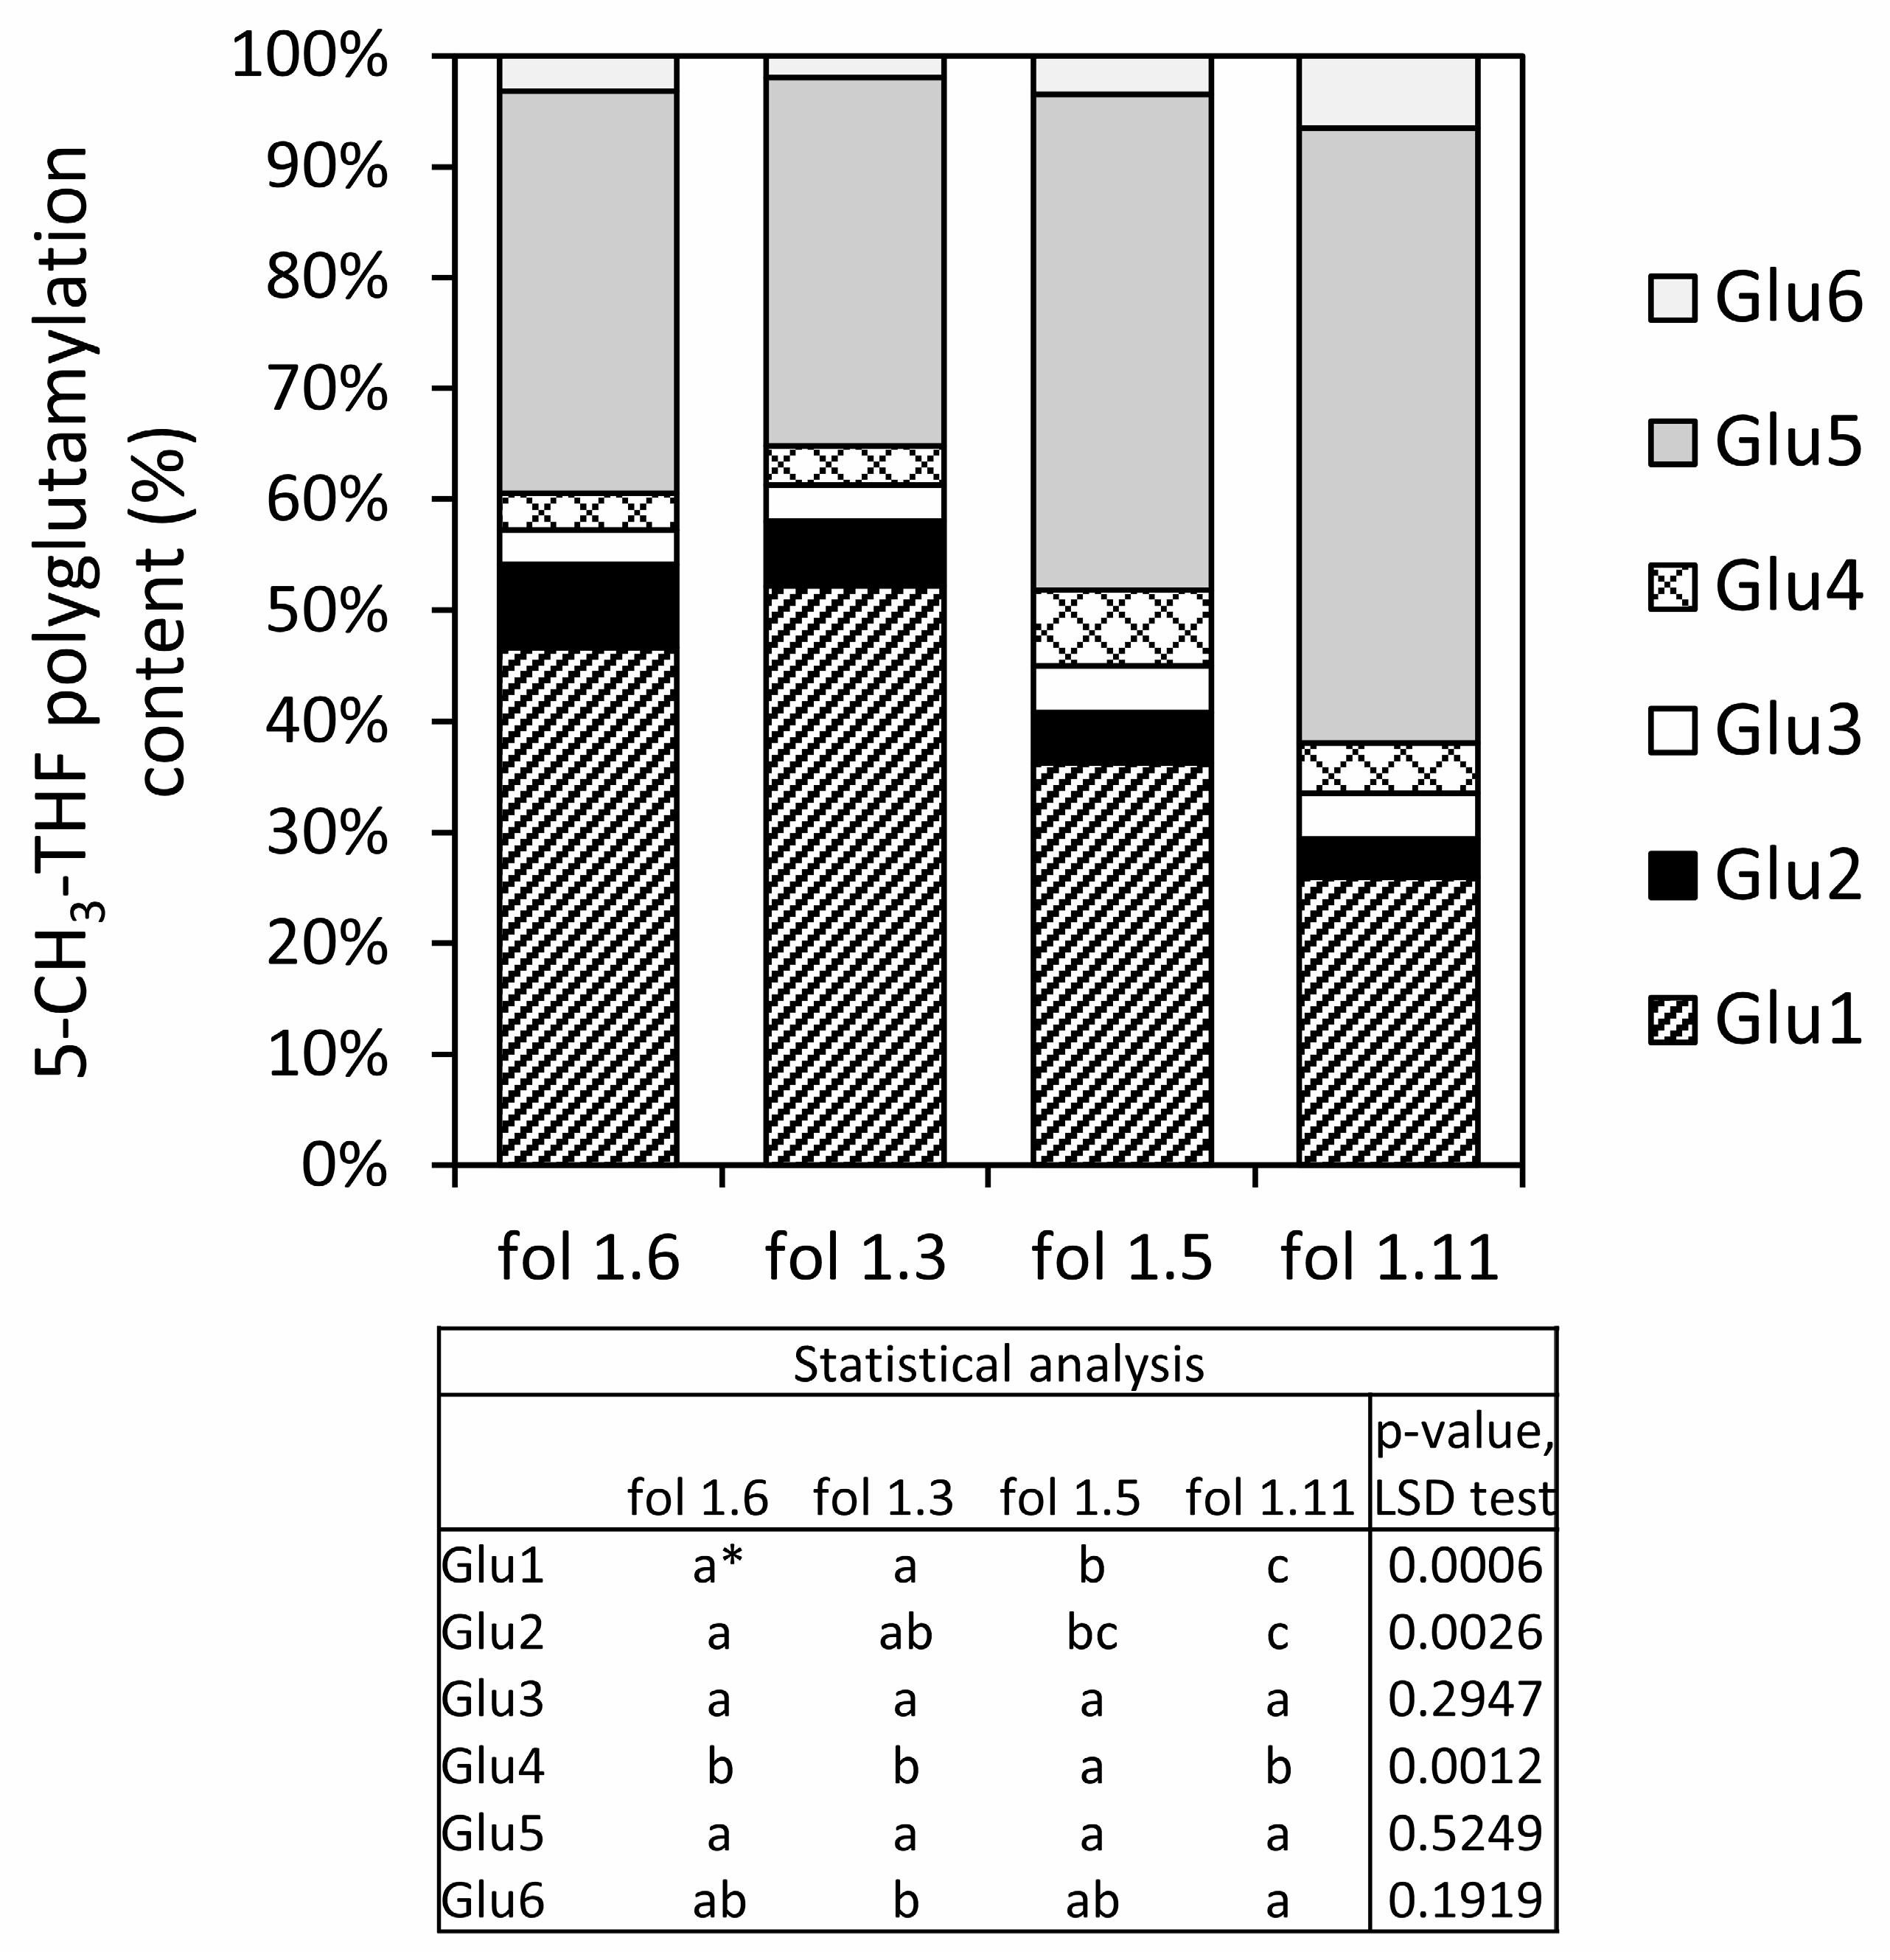
3.1. Folate Content and Profile in S. boliviense PI 597736 Individuals

In a previous study [32], we found high folate concentrations in tubers pooled from four individuals from the wild species S. boliviense accession PI 597736. Subsequently, individual seeds from this accession were planted, and four individual plants, named fol 1.6, fol 1.3, fol 1.5 and fol 1.11, were selected for clonal propagation. Clonal replicates were grown in a greenhouse during four independent seasons (n = 4) and tubers were harvested and evaluated for folate content. There were substantial differences in folate concentrations between clones in all four harvests (Figure 1), indicating that individual clones from the accession PI 597736 are segregating for folate content. Folate concentrations were the highest in clone fol 1.6, followed by, in order, clones fol 1.3, fol 1.5 and fol 1.11 in all four harvests, except in June 2012 where folate concentrations in fol 1.5 were lower than those in fol 1.11. Based on relative folate content, to the exception of 2016, we could clearly group fol 1.6 and fol 1.3 as high folate clones, and fol 1.5 and fol 1.11 as low folate clones. Differences in absolute folate content between harvests could be due to environmental differences (e.g., greenhouse temperature, day length, postharvest storage temperature) and tuber maturity.
We then used an HPLC method to detect individual folate derivatives in high and low folate clones. We used samples harvested in November 2012 because of the availability of biological repetitions (as opposed to June 2012) and because tubers from 2016 and 2017 had not yet been grown at the time of the analysis. In all samples, 5-CH3-THF constituted the main folate form accumulated in potato tubers with >74% of the total folate pool, 5-CHO-THF comprised around 12% of the total pool followed by 5,10-CH = THF (10%) with very small amounts of THF (Figure 2).
Then, we determined the glutamylation profile of 5-CH3-THF in high versus low folate clones. Two main glutamylation forms of 5-CH3-THF were present in the clones analyzed: monoglutamate (Glu1) and pentaglutamate (Glu5) (Figure 3). Other forms were Glu2, Glu3, Glu4, and Glu6. In the high folate clones fol 1.3 and fol 1.6, 5-CH3-THF was predominantly found in the Glu1 form, comprising 52 and 47% of the total 5-CH3-THF, respectively, while low-folate clones fol 1.5 and fol 1.11 only had 36 and 26% of this folate in its monoglutamyl form. In low-folate clones fol 1.5 and fol 1.11, the Glu5 form was predominant (Figure 3) and represented between 44 and 55% of total 5-CH3-THF. In high-folate clones, Glu5 was not predominant and represented between 33 and 36% of total 5-CH3-THF. The amount of Glu3-Glu6 was very similar among all clones. Since 5-CH3-THF is the main folate in potato tubers (Figure 2), the observed increase in the monoglutamyl form in the high-folate clones can be considered as one of the principal contributing factors to the total folate increase. Based on differences in folate profiles and total folate contents between clones, we analyzed gene expression between clones to identify potential key regulatory control genes.

3.2. Expression of Folate Related Genes in Fol Lines as Determined by RNA-Seq Analysis

We investigated differential gene expression in high versus low folate clones harvested in November 2012. RNA-Seq reads were aligned to the reference DM potato genome. At least 76% of the reads aligned to the potato genome for clones fol 1.3, fol 1.5, and fol 1.6. However, less than 30% of the reads aligned to the reference potato genome in the case of fol 1.11. Further analysis showed that a large proportion of unmapped reads matched with potato virus X sequences, showing that fol 1.11 plants were infected with the virus. Therefore, fol 1.11 samples were removed from further expression analysis. Comparisons of gene expression were made between fol 1.3 (high folate) and fol 1.5 (low folate), and fol 1.6 (high folate) and fol 1.5 (low folate). Using a q cutoff value of 0.05 and a |log2 fold change| cutoff value of 1.5, 464 and 383 genes were differentially expressed between fol 1.6 and fol 1.5, and fol 1.3 and fol 1.5, respectively. Only 21.2% (148) of differentially expressed genes were common between the two comparisons (Figure S2). Functional enrichment analysis showed that ten and one gene ontology terms of molecular functions were enriched in the comparisons fol 1.6 versus fol 1.5, and fol 1.3 versus fol 1.5, respectively (Figure S3). The gene ontology term “sulfotransferase activity” was the only common term between the two comparisons.
Next, we examined 14 genes that are known to be involved in folate metabolism (Table S1). Interestingly, only one of these genes, GGH1, showed a log2 fold-change greater than 1.5 between the high and low folate genotypes in both comparisons (GGH3 also had significant fold-change but it was not considered reliable because of the very low count number) (Table 1 and Table 2). In the fol 1.6 over fol 1.5 comparison, ADCL also showed a large log2 fold change (i.e., 3.4), but the log2 fold change was only 0.3 in the fol 1.3 over fol 1.5 comparison. Based on these results, we investigated whether GGH1 expression was consistently higher in high folate clones compared to low folate clones.

3.3. GGH1 Expression in Various Low and High Folate Germplasm as Determined by Real-Time Quantitative RT-PCR Analysis

To investigate whether the differential GGH1 gene expression observed in low and high folate fol lines by RNA-Seq was a consistent pattern between low and high folate genotypes, GGH1 gene expression was determined in eight additional high and low folate individuals. These individuals were from two segregating populations, BRR1 and BRR3 (see Materials and Methods), and from the species S. tuberosum subsp. angidenum and S. vernei. Individuals from BRR1 and BRR3 populations segregated for folate content (Figure S5). Overall, folate levels ranged from below 500 ng/g dry weight to more than 2000 ng/g dry weight. High- (above 2000 ng/g dry weight) and low- (below 500 ng/g dry weight) folate individuals were selected from the BRR1 and BRR3 populations for further analysis (Table 3). In addition, high- and low-folate individuals from the wild and primitive cultivated species S. tuberosum subsp. andigenum and S. vernei were selected based on a previous study [35] (Table 3). The fol lines harvested in November 2012 were also used for further gene expression analysis by qPCR (Figure 1).
Pairwise comparison between high and low folate samples within the fol populations showed significant differences in mean GGH1 expression, with fol 1.6/fol 1.11 and fol 1.6/fol 1.5 showing a 15-fold and 88-fold difference, respectively, and fol 1.3/fol 1.11 and fol 1.3/fol 1.5 showing a 24-fold and 140-fold difference. In 7 out of 8 comparisons GGH1 expression was higher in high folate versus low folate genotypes, with fold change ranging from 2 to 481 (Table 4). Only one pair of genotypes, BRR3 90 and BRR3 56, showed the inverse trend, with a 10-fold higher GGH1 expression in the low folate genotype (BRR3 56) compared to the high folate genotype (BRR3 90). High folate versus low folate genotypes from the species S. vernei showed the greatest difference in GGH1 expression (481-fold difference).

4. Discussion

Variation in folate content exists in potato tubers [31,32,35], suggesting that breeding potato for increased folate content is possible. However, the genetic control of this variation is unknown. In this study, we showed that the expression of GGH1 was consistently higher in tubers with high- compared to low-folate content, a scenario not found for other known folate biosynthesis and salvage genes. We observed a similar higher GGH1 expression in very small, developmentally-young tubers that had higher folate content compared to larger, more mature tubers [34], which indicates that the correlation between high-folate content and high GGH1 expression is recurrent in potato tubers.
GGHs are vacuolar enzymes that cleave glutamate residues from polyglutamylated folate molecules that are stored in the vacuole [28]. Consistent with a GGH enzymatic activity, high folate genotypes that had higher GGH1 expression had a higher proportion of monoglutamylated than polyglutamylated 5-CH3-THF, the predominant folate species in potato tubers. In Arabidopsis, GGH1 cleaves glutamate residues from polyglutamylated folate molecules mainly to di- and triglutamates while GGH2 yields mainly monoglutamates [28]. Therefore, one would expect a higher proportion of di- and triglutamylated rather than monoglutamylated folates in potato tubers that have higher GGH1 expression. However, the amino acid sequence similarity between potato GGHs and either of Arabidopsis GGH1 or GGH2 ranges between 62 and 68% (Figure S6), making it difficult to identify the closest ortholog. Therefore, enzymatic activities of potato GGHs will need to be tested to determine which glutamylated species these enzymes yield. Based on the glutamate profiles, PGSC0003DMG400007066-encoded GGH, herein named potato GGH1, seems to yield monoglutamates.
We propose two hypotheses to explain the positive correlation between GGH1 expression and folate content in potato tubers. The first one implies that higher GGH1 expression is the cause of higher folate content and is based on the capability of GGHs to cleave the glutamate of p-ABA-glutamate, a product of folate degradation, to free p-ABA that can re-enter the biosynthesis pathway. Under this scenario, higher GGH1 activity increases salvage of p-ABA-glutamate. To effect folate biosynthesis, dihydropterin-6-aldehyde, the corresponding pterin degradation product [18], must be salvaged by NADPH-dependent pterin aldehyde reductase. However, this hypothesis seems unlikely since a three-fold overexpression of GGH in vacuoles caused 40–45% reduction in total folate in Arabidopsis leaves [37]. The second hypothesis implies that higher GGH1 expression is the consequence of higher folate production in potato tubers of high folate segregants. In such scenario, high-folate segregants produce more folate than low-folate segregants because of, for instance, higher folate biosynthesis enzymatic activities (e.g., higher GCHI and/or ADCS activities; note that fol 1.6 had higher ADCL gene expression which could correlate to higher ADCL activity and higher p-ABA production) and/or transport of biosynthesis intermediates (e.g., transport of HMDHP from the cytosol to the mitochondria). In high-folate segregants, folate content reaches a threshold (that is never attained in low-folate segregants) that triggers induction of GGH expression. Elevated GGH expression increases hydrolysis of tetrahydrofolate polyglutamate to tetrahydrofolate monoglutamate, a known inhibitor of the DHPS domain of HPPK/DHPS and potential key regulator of folate biosynthesis [1,50], thereby preventing further accumulation of folate and maintaining folate homeostasis in potato tubers. This inhibition would require transport and accumulation of monoglutamylated folates in the mitochondria where HPPK/DHPS is located.
This second hypothesis suggests that knocking down or out GGH expression (e.g., by silencing or gene editing) in high folate lines could unleash the control of folate homeostasis and lead to further accumulation of folate in potato tubers. This hypothesis is in agreement with a report showing that knocking down GGH activity increased total folate content by 34% in Arabidopsis leaves. Two important consequences should be considered: monoglutamylated folates are more bioavailable but also more prone to chemical and enzymatic degradation. Recent folate engineering work showed that combining the two-genes strategy (i.e., overexpression of GCHI and ADCS) with the overexpression of FPGS, the enzyme that adds glutamates to monoglutamylated folates to yield polyglutamylated folates, increased total folates content and stability during long-term storage in potato tubers [42]. Therefore, a fine balance between monoglutamylated and polyglutamylated folates, and therefore fine-tuning of FPGS and GGH expression, may be a requirement to achieve the most impactful folate biofortification.

Supplementary Materials

The following are available online at https://www.mdpi.com/2073-4395/9/11/734/s1. Figure S1. Partial alignments of GGH (A) and EF1-α (B) sequences and primers used in qPCR reactions. GGH1, GGH2 and GGH3 transcripts sequences from the DM genotype were aligned in order to design primers specific of GGH1. EF1-α sequences from four potato genotypes were aligned to design primers within highly conserved regions. Figure S2. Venn diagram showing numbers of differentially expressed genes that are common or exclusive in comparisons fol 1.6 versus fol 1.5 and fol 1.3 versus fol 1.5. Figure S3. Functional enrichment analysis in comparisons between fol 1.6 and fol 1.5, and fol 1.3 and fol 1.5. Analyses were done using g:GOSt in g:Profiler. A g:SCS threshold of 0.05 was used. The top panel is a Manhattan plot of enriched terms in the comparison between fol 1.6 and fol 1.5. The middle panel is a Manhattan plot of enriched terms in the comparison between fol 1.3 and fol 1.5. The bottom table provides detailed information such as data source, id and name of the term with corresponding p-value. The light circles in Manhattan plots represent insignificant terms.Figure S4. Phylogenetic tree of UDP-glucose glucosyltransferases from potato and Arabidopsis. Homologs of the At1g05560-encoded protein were searched in the potato genome by using tBLASTn search in Spud DB (http://potato.plantbiology.msu.edu/). The seven top matches were used for phylogenetic analysis in MEGA7. Figure S5. Histogram of number of individuals within folate concentration brackets. A, BRR1 population; B, BRR3 population. Figure S6. Alignment of potato and Arabidopsis GGH proteins. Asterisks indicate conserved residues that are catalytically essential in human GGH or other conserved active site residues that may participate in substrate binding [29]. Alignment was done by CLUSTALW (https://www.genome.jp/tools-bin/clustalw). Shading was done by BOXSHADE (https://embnet.vital-it.ch/software/BOX_form.html). AtGGH1, At1g78660; AtGGH2, At1g78680; AtGGH3, At1g78670; StGGH1, PGSC0003DMG400007066; StGGH2, PGSC0003DMG400021256; StGGH3, PGSC0003DMG400035974. Table S1. Folate metabolism-related genes in Arabidopsis, tomato, and potato. Orthologs of Arabidopsis genes in tomato and potato were retrieved from EnsemblPlants.

Author Contributions

Conceptualization, B.R.R. and A.G.; validation, A.G.; formal analysis, B.R.R. and A.G.; investigation, B.R.R., C.G.S. and P.R.P.; resources, J.B.; Writing—Original Draft preparation, B.R.R. and A.G.; Writing—Review and Editing, A.G. and R.I.D.d.l.G.; visualization, A.G. and R.I.D.d.l.G.; supervision, R.I.D.d.l.G. and A.G.; project administration, A.G.; funding acquisition, B.R.R., R.I.D.d.l.G. and A.G.

Funding

Bruce Robinson was supported by a National Needs Graduate Student Fellowship from the USDA National Institute of Food and Agriculture (Grant number 2012-04150), and a Fellowship from the USDA Western Sustainable Agriculture Research and Education (Grant number GW15-034), R.I.D.d.l.G. was supported by CONACyT (Grant number 243058).

Acknowledgments

We thank Matthew Warman and Solomon Yilma for technical help.

Conflicts of Interest

The authors declare no conflict of interest.

References

  1. Blancquaert, D.; De Steur, H.; Gellynck, X.; Van Der Straeten, D. Present and future of folate biofortification of crop plants. J. Exp. Bot. 2014, 65, 895–906. [Google Scholar] [CrossRef] [PubMed] [Green Version]
  2. Storozhenko, S.; Ravanel, S.; Zhang, G.F.; Rébeillé, F.; Lambert, W.E.; Van Der Straeten, D. Folate enhancement in staple crops by metabolic engineering. Trends Food Sci. Technol. 2005, 16, 271–281. [Google Scholar] [CrossRef]
  3. Bailey, R.L.; West, K.P., Jr.; Black, R.E. The epidemiology of global micronutrient deficiencies. Ann. Nutr. Metab. 2015, 66, 22–33. [Google Scholar] [CrossRef] [PubMed]
  4. Bentley, T.G.K.; Willett, W.C.; Weinstein, M.C.; Kuntz, K.M. Population-level changes in folate intake by age, gender, and race/ethnicity after folic acid fortification. Am. J. Public Health 2006, 96, 2040–2047. [Google Scholar] [CrossRef] [PubMed]
  5. Appling, D.R. Compartmentation of folate-mediated one-carbon metabolism in eukaryotes. FASEB J. 1991, 5, 2645–2651. [Google Scholar] [CrossRef] [PubMed]
  6. Shane, B.; Stokstad, E.L.R. Vitamin B12-folate interrelationships. Annu. Rev. Nutr. 1985, 5, 115–141. [Google Scholar] [CrossRef] [PubMed]
  7. Fox, J.T.; Stover, P.J. Folate-mediated one-carbon metabolism. Vitam. Horm. 2008, 79, 1–44. [Google Scholar]
  8. Krista, S.C.; Yang, T.P.; Berry, R.J.; Bailey, L.B. Folate and DNA methylation: A review of molecular mechanisms and the evidence for folate’s role. Adv. Nutr. 2012, 3, 21–38. [Google Scholar]
  9. Roje, S. S-Adenosyl-L-methionine: Beyond the universal methyl group donor. Phytochemistry 2006, 67, 1686–1698. [Google Scholar] [CrossRef]
  10. Hanson, A.D.; Roje, S. One-carbon metabolism in higher plants. Annu. Rev. Plant Physiol. Plant Mol. Biol. 2001, 52, 119–137. [Google Scholar] [CrossRef]
  11. Zhou, H.R.; Zhang, F.F.; Ma, Z.Y.; Huang, H.W.; Jiang, L.; Cai, T.; Zhu, J.K.; Zhang, C.; He, X.J. Folate polyglutamylation is involved in chromatin silencing by maintaining global DNA methylation and histone H3K9 dimethylation in Arabidopsis. Plant Cell 2013, 25, 2545–2559. [Google Scholar] [CrossRef] [PubMed]
  12. Zhang, H.; Deng, X.; Miki, D.; Cutler, S.; La, H.; Hou, Y.J.; Oh, J.E.; Zhu, J.K. Sulfamethazine suppresses epigenetic silencing in arabidopsis by impairing folate synthesis. Plant Cell 2012, 24, 1230–1241. [Google Scholar] [CrossRef] [PubMed]
  13. Fan, J.; Ye, J.; Kamphorst, J.J.; Shlomi, T.; Thompson, C.B.; Rabinowitz, J.D. Quantitative flux analysis reveals folate-dependent NADPH production. Nature 2014, 510, 298–302. [Google Scholar] [CrossRef] [PubMed] [Green Version]
  14. Gorelova, V.; De Lepeleire, J.; Van Daele, J.; Pluim, D.; Mei, C.; Cuypers, A.; Leroux, O.; Rebeille, F.; Schellens, J.H.M.; Blancquaert, D.; et al. Dihydrofolate reductase/thymidylate synthase fine-tunes the folate status and controls redox homeostasis in plants. Plant Cell 2017, 29, 2831–2853. [Google Scholar] [CrossRef]
  15. Meng, H.; Jiang, L.; Xu, B.; Guo, W.; Li, J.; Zhu, X.; Qi, X.; Duan, L.; Meng, X.; Fan, Y.; et al. Arabidopsis plastidial folylpolyglutamate synthetase is required for seed reserve accumulation and seedling establishment in darkness. PLoS ONE 2014, 9, e101905. [Google Scholar] [CrossRef]
  16. Van Wilder, V.; De Brouwer, V.; Loizeau, K.; Gambonnet, B.; Albrieux, C.; Van Der Straeten, D.; Lambert, W.E.; Douce, R.; Block, M.A.; Rebeille, F.; et al. C1 metabolism and chlorophyll synthesis: The Mg-protoporphyrin IX methyltransferase activity is dependent on the folate status. New Phytol. 2009, 182, 137–145. [Google Scholar] [CrossRef]
  17. Webb, M.E.; Smith, A.G. Chlorophyll and folate: Intimate link revealed by drug treatment. New Phytol. 2009, 182, 3–5. [Google Scholar] [CrossRef]
  18. Hanson, A.D.; Gregory, J.F. Folate biosynthesis, turnover, and transport in plants. In Annual Review of Plant Biology; Merchant, S.S., Briggs, W.R., Ort, D., Eds.; Annual Reviews: Palo Alto, CA, USA, 2011; Volume 62, pp. 105–125. [Google Scholar]
  19. Orsomando, G.; Bozzo, G.G.; de la Garza, R.D.; Basset, G.J.; Quinlivan, E.P.; Naponelli, V.; Rebeille, F.; Ravanel, S.; Gregory, J.F., 3rd; Hanson, A.D. Evidence for folate-salvage reactions in plants. Plant J. 2006, 46, 426–435. [Google Scholar] [CrossRef]
  20. Noiriel, A.; Naponelli, V.; Bozzo, G.G.; Gregory, J.F., 3rd; Hanson, A.D. Folate salvage in plants: Pterin aldehyde reduction is mediated by multiple non-specific aldehyde reductases. Plant J. 2007, 51, 378–389. [Google Scholar] [CrossRef]
  21. Basset, G.; Quinlivan, E.P.; Ziemak, M.J.; Diaz De La Garza, R.; Fischer, M.; Schiffmann, S.; Bacher, A.; Gregory, J.F., 3rd; Hanson, A.D. Folate synthesis in plants: The first step of the pterin branch is mediated by a unique bimodular GTP cyclohydrolase I. Proc. Natl. Acad. Sci. USA 2002, 99, 12489–12494. [Google Scholar] [CrossRef] [Green Version]
  22. Goyer, A.; Illarionova, V.; Roje, S.; Fischer, M.; Bacher, A.; Hanson, A.D. Folate biosynthesis in higher plants. cDNA cloning, heterologous expression, and characterization of dihydroneopterin aldolases. Plant Physiol. 2004, 135, 103–111. [Google Scholar] [CrossRef] [PubMed]
  23. Basset, G.J.; Quinlivan, E.P.; Ravanel, S.; Rebeille, F.; Nichols, B.P.; Shinozaki, K.; Seki, M.; Adams-Phillips, L.C.; Giovannoni, J.J.; Gregory, J.F., 3rd; et al. Folate synthesis in plants: The p-aminobenzoate branch is initiated by a bifunctional PabA-PabB protein that is targeted to plastids. Proc. Natl. Acad. Sci. USA 2004, 101, 1496–1501. [Google Scholar] [CrossRef] [PubMed]
  24. Basset, G.J.; Ravanel, S.; Quinlivan, E.P.; White, R.; Giovannoni, J.J.; Rebeille, F.; Nichols, B.P.; Shinozaki, K.; Seki, M.; Gregory, J.F., 3rd; et al. Folate synthesis in plants: The last step of the p-aminobenzoate branch is catalyzed by a plastidial aminodeoxychorismate lyase. Plant J. 2004, 40, 453–461. [Google Scholar] [CrossRef] [PubMed]
  25. Rebeille, F.; Macherel, D.; Mouillon, J.M.; Garin, J.; Douce, R. Folate biosynthesis in higher plants: Purification and molecular cloning of a bifunctional 6-hydroxymethyl-7,8-dihydropterin pyrophosphokinase/7,8-dihydropteroate synthase localized in mitochondria. EMBO J. 1997, 16, 947–957. [Google Scholar] [CrossRef]
  26. Ravanel, S.; Cherest, H.; Jabrin, S.; Grunwald, D.; Surdin-Kerjan, Y.; Douce, R.; Rebeille, F. Tetrahydrofolate biosynthesis in plants: Molecular and functional characterization of dihydrofolate synthetase and three isoforms of folylpolyglutamate synthetase in Arabidopsis thaliana. Proc. Natl. Acad. Sci. USA 2001, 98, 15360–15365. [Google Scholar] [CrossRef]
  27. Neuburger, M.; Rebeille, F.; Jourdain, A.; Nakamura, S.; Douce, R. Mitochondria are a major site for folate and thymidylate synthesis in plants. J. Biol. Chem. 1996, 271, 9466–9472. [Google Scholar] [CrossRef]
  28. Orsomando, G.; de la Garza, R.D.; Green, B.J.; Peng, M.; Rea, P.A.; Ryan, T.J.; Gregory, J.F., 3rd; Hanson, A.D. Plant gamma-glutamyl hydrolases and folate polyglutamates: Characterization, compartmentation, and co-occurrence in vacuoles. J. Biol. Chem. 2005, 280, 28877–28884. [Google Scholar] [CrossRef]
  29. Eudes, A.; Bozzo, G.G.; Waller, J.C.; Naponelli, V.; Lim, E.K.; Bowles, D.J.; Gregory, J.F., 3rd; Hanson, A.D. Metabolism of the folate precursor p-aminobenzoate in plants: Glucose ester formation and vacuolar storage. J. Biol. Chem. 2008, 283, 15451–15459. [Google Scholar] [CrossRef]
  30. Konings, E.J.M.; Roomans, H.H.S.; Dorant, E.; Goldbohm, R.A.; Saris, W.H.M.; van den Brandt, P.A. Folate intake of the dutch population according to newly established liquid chromatography data for foods. Am. J. Clin. Nutr. 2001, 765–776. [Google Scholar] [CrossRef]
  31. Goyer, A.; Navarre, D.A. Determination of folate concentrations in diverse potato germplasm using a trienzyme extraction and a microbiological assay. J. Agric. Food Chem. 2007, 55, 3523–3528. [Google Scholar] [CrossRef]
  32. Goyer, A.; Sweek, K. Genetic diversity of thiamin and folate in primitive cultivated and wild potato (Solanum) species. J. Agric. Food Chem. 2011, 59, 13072–13080. [Google Scholar] [CrossRef] [PubMed]
  33. Jabrin, S.; Ravanel, S.; Gambonnet, B.; Douce, R.; Rebeille, F. One-carbon metabolism in plants. Regulation of tetrahydrofolate synthesis during germination and seedling development. Plant Physiol. 2003, 131, 1431–1439. [Google Scholar] [CrossRef] [PubMed]
  34. Goyer, A.; Navarre, D.A. Folate is higher in developmentally younger potato tubers. J. Sci. Food Agric. 2009, 89, 579–583. [Google Scholar] [CrossRef]
  35. Robinson, B.R.; Sathuvalli, V.R.; Bamberg, J.B.; Goyer, A. Exploring folate diversity in wild and primitive potatoes for modern crop improvement. Genes 2015, 6, 1300–1314. [Google Scholar] [CrossRef] [PubMed]
  36. Waller, J.C.; Akhtara, T.A.; Lara-Nunez, A.; Gregory, J.F., 3rd; McQuinn, R.P.; Giovannoni, J.J.; Hanson, A.D. Developmental and feedforward control of the expression of folate biosynthesis genes in tomato fruit. Mol. Plant 2010, 3, 66–77. [Google Scholar] [CrossRef] [PubMed]
  37. Akhtar, T.A.; Orsomando, G.; Mehrshahi, P.; Lara-Nunez, A.; Bennett, M.J.; Gregory, J.F., III; Hanson, A.D. A central role for gamma-glutamyl hydrolases in plant folate homeostasis. Plant J. 2010, 64, 256–266. [Google Scholar] [CrossRef]
  38. Mehrshahi, P.; Gonzalez-Jorge, S.; Akhtar, T.A.; Ward, J.L.; Santoyo-Castelazo, A.; Marcus, S.E.; Lara-Núñez, A.; Ravanel, S.; Hawkins, N.D.; Beale, M.H.; et al. Functional analysis of folate polyglutamylation and its essential role in plant metabolism and development. Plant J. 2010, 64, 267–279. [Google Scholar] [CrossRef] [Green Version]
  39. Storozhenko, S.; De Brouwer, V.; Volckaert, M.; Navarrete, O.; Blancquaert, D.; Zhang, G.F.; Lambert, W.; Van Der Straeten, D. Folate fortification of rice by metabolic engineering. Nat. Biotechnol. 2007, 25, 1277–1279. [Google Scholar] [CrossRef]
  40. Diaz de la Garza, R.I.; Gregory, J.F., 3rd; Hanson, A.D. Folate biofortification of tomato fruit. Proc. Natl. Acad. Sci. USA 2007, 104, 4218–4222. [Google Scholar] [CrossRef] [Green Version]
  41. Blancquaert, D.; Storozhenko, S.; Van Daele, J.; Stove, C.; Visser, R.G.F.; Lambert, W.; Van Der Straeten, D. Enhancing pterin and para-aminobenzoate content is not sufficient to successfully biofortify potato tubers and Arabidopsis thaliana plants with folate. J. Exp. Bot. 2013, 64, 3899–3909. [Google Scholar] [CrossRef]
  42. De Lepeleire, J.; Strobbe, S.; Verstraete, J.; Blancquaert, D.; Ambach, L.; Visser, R.G.F.; Stove, C.; Van der Straeten, D. Folate biofortification of potato by tuber-specific expression of four folate biosynthesis genes. Mol. Plant 2018, 11, 175–188. [Google Scholar] [CrossRef] [PubMed]
  43. Ramos-Parra, P.A.; Garcia-Salinas, C.; Hernandez-Brenes, C.; de la Garza, R.I.D. Folate levels and polyglutamylation profiles of papaya (Carica papaya cv. Maradol) during fruit development and ripening. J. Agric. Food Chem. 2013, 61, 3949–3956. [Google Scholar] [CrossRef] [PubMed]
  44. Rivera, N.G.R.; Garcia-Salinas, C.; Aragao, F.J.L.; de la Garza, R.I.D. Metabolic engineering of folate and its precursors in mexican common bean (Phaseolus vulgaris L.). Plant Biotechnol. J. 2016, 14, 2021–2032. [Google Scholar] [CrossRef] [PubMed]
  45. Davidson, R.M.; Hansey, C.N.; Gowda, M.; Childs, K.L.; Lin, H.; Vaillancourt, B.; Sekhon, R.S.; de Leon, N.; Kaeppler, S.M.; Jiang, N.; et al. Utility of RNA sequencing for analysis of maize reproductive transcriptomes. Plant Genome 2011, 4, 191–203. [Google Scholar] [CrossRef]
  46. Xu, X.; Pan, S.K.; Cheng, S.F.; Zhang, B.; Mu, D.S.; Ni, P.X.; Zhang, G.Y.; Yang, S.; Li, R.Q.; Wang, J.; et al. Genome sequence and analysis of the tuber crop potato. Nature 2011, 475, 189–195. [Google Scholar]
  47. Cumbie, J.S.; Kimbrel, J.A.; Di, Y.M.; Schafer, D.W.; Wilhelm, L.J.; Fox, S.E.; Sullivan, C.M.; Curzon, A.D.; Carrington, J.C.; Mockler, T.C.; et al. Gene-counter: A computational pipeline for the analysis of RNA-seq data for gene expression differences. PLoS ONE 2011, 6, e25279. [Google Scholar] [CrossRef]
  48. Di, Y.M.; Schafer, D.W.; Cumbie, J.S.; Chang, J.H. The NBP negative binomial model for assessing differential gene expression from RNA-seq. Stat. Appl. Genet. Mol. Biol. 2011, 10, 1–28. [Google Scholar] [CrossRef]
  49. Schmittgen, T.D.; Livak, K.J. Analyzing real-time PCR data by the comparitive Ct method. Nat. Protoc. 2008, 3, 1101–1108. [Google Scholar] [CrossRef]
  50. Mouillon, J.M.; Ravanel, S.; Douce, R.; Rebeille, F. Folate synthesis in higher-plant mitochondria: Coupling between the dihydropterin pyrophosphokinase and the dihydropteroate synthase activities. Biochem. J. 2002, 363, 313–319. [Google Scholar] [CrossRef]
Figure 1. Folate concentrations of fol lines from four independent harvests. Data for June 2012 are means of two technical determinations on a pool of tubers from several clonal plants (n = 1). Data for November 2012 are means ± SE of two technical determinations on each of two biological replications (n = 2), one biological replication being made of tubers harvested from one plant. Data for 2016 are means ± SE of three technical determinations on each of two biological replicates (n = 2), one biological replication being made of tubers pooled from several plants and then split into two biological replicates. Data for 2017 are means ± SE of three technical determinations on each of three biological replicates (n = 3), one biological replication being made of tubers harvested from one individual plant. Samples that share identical letters were not significantly different as determined by ANOVA and Tukey HSD at a p-value = 0.05.
Agronomy 09 00734 g001
Figure 2. Distribution of folate species in potato lines harvested in November 2012. Due to the acidic pH of the mobile phase tetrahydrofolate (THF) plus 5,10-CH2THF, and 5,10-CH = THF plus 10-CHO-THF cannot be distinguished during the chromatography.
Agronomy 09 00734 g002
Figure 3. Glutamylation profile of 5-CH3-THF in high and low folate clones. * Different letters in the same row are significantly different (Least Significant Difference test, p < 0.05) and are based on three independent determinations.
Agronomy 09 00734 g003
Table 1. Comparison of high and low fol lines (fol 1.3 vs. fol 1.5) based on RNA-Seq analysis. Genes involved in folate biosynthesis are listed with their corresponding PGSC IDs and pseudo counts for those genes as shown in two replicates for each individual. Fold change (log2), p-values, and q-values are calculated for each comparison. In red are Log2 (fold change) >1.5 or <−1.5 AND p and q values <0.05. GCHI, GTP cyclohydrolase I; DHN, dihydroneopterin; DHNA, DHN aldolase; ADCS, aminodeoxychorismate synthase; ADCL, aminodeoxychorismate lyase; HMDHP-PPK/DHPS, 6-Hydroxymethyldihydropterin pyrophosphokinase (HMDHP-PPK)/dihydropteroate synthase (DHPS); DHFS, dihydrofolate synthase; DHFR, dihydrofolate reductase; FPGS, folylpolyglutamate synthase; GGH, γ-glutamyl hydrolase; 5-FCL, 5-formyltetrahydrofolate cycloligase. The closest ortholog of the Arabidopsis UDP-glucose-pABA glucosyltransferase in potato was identified by phylogenetic analyses (Figure S4).
Gene NamePGSC Genecodefol1.3_Rep1fol1.3_Rep2fol1.5_Rep1fol1.5_Rep2Log2 (Fold Change)p-Valueq-Value
GCHIPGSC0003DMG4000201052232341802480.0940.7811
DHN triphosphate diphosphatasePGSC0003DMG400030259513826490.2460.5900.930
DHNAPGSC0003DMG400029847158157172184−0.1760.6100.942
ADCSPGSC0003DMG400009777194220217211−0.0470.8921
ADCLPGSC0003DMG400018587131613100.3340.6340.954
HMDHP-PPK/DHPSPGSC0003DMG40002836264687081−0.1940.6300.952
DHFSPGSC0003DMG400002352209235275274−0.3060.3530.810
DHFRPGSC0003DMG400000736614629642733−0.1450.6430.957
FPGSPGSC0003DMG4000271936014873823780.5170.1020.469
UDP-glucose–pABA glucosyltransferasePGSC0003DMG400004573914876111−0.4270.2620.733
PGSC0003DMG400004574-------
GGH1PGSC0003DMG40000706639939067572.6697.526 × 10−141.874 × 10⁻¹¹
GGH2PGSC0003DMG4000212567467446706520.1720.5810.924
GGH3PGSC0003DMG4000359743300Inf0.0570.336
5-FCLPGSC0003DMG4000245702392702132270.2100.5270.902
Table 2. Comparison of high and low fol lines (fol 1.6 vs. fol 1.5) based on RNA-Seq analysis. Genes involved in folate biosynthesis are listed with their corresponding PGSC IDs and pseudo counts for those genes as shown in two replicates for each individual. Fold change (log2), p-values, and q-values are calculated for each comparison. In red are Log2 (fold change) >1.5 or <−1.5 AND p and q values <0.05. GCHI, GTP cyclohydrolase I; DHN, dihydroneopterin; DHNA, DHN aldolase; ADCS, aminodeoxychorismate synthase; ADCL, aminodeoxychorismate lyase; HMDHP-PPK/DHPS, 6-Hydroxymethyldihydropterin pyrophosphokinase (HMDHP-PPK)/dihydropteroate synthase (DHPS); DHFS, dihydrofolate synthase; DHFR, dihydrofolate reductase; FPGS, folylpolyglutamate synthase; GGH, γ-glutamyl hydrolase; 5-FCL, 5-formyltetrahydrofolate cycloligase. The closest ortholog of the Arabidopsis UDP-glucose-pABA glucosyltransferase in potato was identified by phylogenetic analyses (Figure S4).
Gene NamePGSC Genecodefol1.6_Rep1fol1.6_Rep2fol1.5_Rep1fol1.5_Rep2Log2 (Fold Change)p-Valueq-Value
GCHIPGSC0003DMG400020105174202180247−0.1830.5880.959
DHN triphosphate diphosphatasePGSC0003DMG400030259325926530.2040.6580.980
DHNAPGSC0003DMG400029847112144172178−0.4510.1930.660
ADCSPGSC0003DMG400009777207215217213−0.0270.9421
ADCLPGSC0003DMG40001858712813713123.4053.74 × 10−146.83 × 10⁻¹²
HMDHP-PPK/DHPSPGSC0003DMG40002836252597085−0.4810.2240.714
DHFSPGSC0003DMG400002352192143275275−0.7150.0310.236
DHFRPGSC0003DMG400000736282430642739−0.9550.0020.037
FPGSPGSC0003DMG4000271935406023823820.5790.0670.374
UDP-glucose–pABA glucosyltransferasePGSC0003DMG40000457331188761090.8460.0520.403
PGSC0003DMG400004574-------
GGH1PGSC0003DMG40000706620120567591.6883.19 × 10−61.352 × 10⁻⁴
GGH2PGSC0003DMG400021256445499670637−0.4690.1350.562
GGH3PGSC0003DMG4000359743800Inf0.0040.058
5-FCLPGSC0003DMG400024570228215213234−0.0120.9761
Table 3. Folate concentrations of samples used in real time quantitative RT-PCR reactions.
SampleFolate Concentration (ng/g DW)
BRR1 122373 1
BRR1 27471 1
BRR3 902952 1
BRR3 56326 1
Tbr 225710.32336 1,2
Tbr 546023.4626 1,2
Vrn 558149.31688 1,2
Vrn 500063.1469 1,2
1 Data are means from 3 or 4 technical determinations. 2 Folate values were previously published in Robinson et al. 2015 [35].
Table 4. Ct values, 2−ΔCt values, and fold change in GGH1 expression in high and low folate genotypes as determined by real time quantitative RT-PCR reactions.
High Folate GenotypeCt Value 1Low Folate GenotypeCt Value 1High/Low 2−ΔCtFold Change
BRR1 1234.18BRR1 2731.740.189/0.01810
BRR3 9040.44BRR3 5636.713.33 × 105/4.53 × 1040.1
Tbr PI 22571029.66Tbr PI 54602338.843.00 × 102/1.55 × 1022
Vrn PI 55814935.33Vrn PI 50006340.786.25 × 102/1.29 × 104481
fol 1-632.01fol 1-1135.417.10 × 103/4.76 × 10415
fol 1-632.01fol 1-539.827.10 × 103/8.07 × 10588
fol 1-330.90fol 1-1135.411.13 × 102/4.76 × 10424
fol 1-330.90fol 1-539.821.13 × 102/8.07 × 105140
1 Data are means of 4 technical determinations on one biological repetition, except for fol lines for which data are means of 4 technical determinations on each of two biological repetitions.

