Article

Optimizing and Comparing Ultrasound- and Microwave-Assisted Extraction Methods Applied to the Extraction of Antioxidant Capsinoids in Peppers

by
Mercedes Vázquez-Espinosa
,
Ana V. González de Peredo
,
Marta Ferreiro-González
,
Carmelo G. Barroso
,
Miguel Palma
,
Gerardo F. Barbero
* and
Estrella Espada-Bellido
Department of Analytical Chemistry, Faculty of Sciences, University of Cadiz, Agrifood Campus of International Excellence (ceiA3), IVAGRO, 11510 Puerto Real, Cadiz, Spain
*
Author to whom correspondence should be addressed.
Agronomy 2019, 9(10), 633; https://doi.org/10.3390/agronomy9100633
Submission received: 8 September 2019 / Revised: 3 October 2019 / Accepted: 11 October 2019 / Published: 12 October 2019
(This article belongs to the Section Horticultural and Floricultural Crops)

Abstract

:
Capsinoids are very similar antioxidant compounds to capsaicinoids, but less irritating, non-pungent and more palatable, and can thus be used in greater concentrations for food applications. To date, three capsinoids (capsiate, dihydrocapsiate, and nordihydrocapsiate) have been isolated from the pepper fruits. Due to its substantial commercial importance, it would be convenient to determine which pepper varieties have a richer content. Ultrasound- (UAE) and microwave- (MAE) assisted extraction have been implemented and analyzed using multivariate statistical methods. Firstly, different solvents were tested individually. The three best solvents were used in a set mixture design, where 42% methanol and 58% ethyl acetate were determined as the optimum combination for UAE, and 100% methanol for MAE. Subsequently, a Box–Behnken experimental design with four variables for both UAE and MAE (time, temperature, pH and sample mass:solvent volume “ratio”) was performed. The sample mass:solvent volume was the most influential variable in UAE; while for MAE no variable was any more influential than the others. Finally, both optimized extraction methods were successfully applied to different varieties of peppers. Besides, to demonstrate the efficiency of both extraction methods, a recovery study was performed. The results prove the potential of both techniques as highly adequate methods for the extraction of capsinoids from peppers.

Graphical Abstract

1. Introduction

Peppers (Capsicum spp.) are plants from the Solanaceae family, originating in Central and South American tropical and rainy areas [1]. Nowadays, the pepper is a well-known fruit due to its high content in bioactive compounds and its strong antioxidant capacity. It is among the most popular fresh vegetables worldwide due to its combination of aroma, color, flavor, and nutritional value [2]. Peppers are not only valued for their sensory attributes, but also have a significant role in medical and pharmaceutical applications [3]. This fruit is a great source of nutraceutical compounds such as capsaicinoids and capsinoids, bioactive components that support a healthy diet [4].
One of the main features of red peppers is their pungency, which is caused by a specific type of chemical compounds known as capsaicinoids [5]. They have three clearly differentiated sections, the vanillyl group, the carboxamide group and the aliphatic chain [6]. These compounds have exhibited a large number of biological properties of pharmacological relevance such as antioxidant, anti-inflammatory, analgesic, antimicrobial and anticarcinogenic [7,8]. Furthermore, they are related to an increase in the energy of the body and decrease in both body fat and cholesterol, which leads to a reduction in cardiovascular diseases, diabetes or cerebrovascular accidents [9]. One of its negative aspects is that long term or high dose exposures have a detrimental effect on the users’ gastric mucosa and ultimately on the health [10]. On the contrary, capsinoids, although very similar to capsaicinoids, are less irritating, non-pungent and more palatable, so a larger amount of them can be consumed on a daily basis without any negative consequences. In addition, they have the same above-mentioned beneficial properties as capsaicinoids on human health; particularly their antioxidant properties, but without any burning feeling or negative effects on consumers’ organisms [11,12,13]. They have a very similar chemical structure except for their central bond, which is an ester group instead of an amide group. This structural difference could be responsible for the lower stability of capsinoids [14]. The difference in pungency is associated to vanilloid type-1 receptor (TRPV1), which is the component responsible for the burning sensation. Capsaicinoids activate TRPV1 on the tongue, while capsinoids have the ability to activate it after it has reached the intestine, which results in the absence of burning sensations, although with similar effect [15]. The chemical structures are shown in Figure 1.
Extraction is a very important step for the isolation and separation of the compounds of interest from the solid matrix and there is no single and standard extraction method. The extraction process depends on the conditions to which the sample is treated. Capsinoids extraction is of great importance due to their excellent beneficial properties for health, their high antioxidant capacity, and their great commercial importance agri-food applicability thanks to the lower pungency compared to that of capsaicinoids. There has been a recent growing demand for extraction techniques that shorten extraction times, and reduce the consumption of organic solvents [16]. Among other extraction methods, ultrasound-assisted extraction (UAE) and microwave-assisted extraction (MAE) are considered excellent green alternatives that have been widely used for the extraction of bioactive compounds. When compared to conventional methods they present some advantages such as their simplicity, greater efficiency and performance. They are also more environmentally friendly, faster, and reduce solvent and energy consumption with an improved control of temperature [17].
UAE is based on the use of energy derived from ultrasounds (sound waves with frequencies higher than 20 kHz) to facilitate the extraction of compounds from the sample matrix by an organic solvent according to the nature of the solutes to be extracted [18]. The improvement in biological compounds extraction efficiency achieved by means of ultrasounds is attributed to the cavitation that occurs within the solvent. When ultrasounds are applied, cavitation bubbles are produced and compressed. The increase in the pressure and temperature leads to the collapse of the bubble, which results in a ’shock wave’ that breaks the solid matrix’s cell walls, which, in turn, favors the penetration of the solvent, the mass transfer and the release of the analytes, thus increasing the extraction performance [19,20]. It is a widely employed technique, recently used to extract different varieties of compounds of biological interest from potatoes [21], grapes [22] and blueberries [23].
MAE consists of an electric and magnetic field that oscillate perpendicularly (high frequency non-ionizing electromagnetic waves between 0.3–300 GHz) [24]. The molecules in the sample try to align themselves in phase with the electromagnetic field of the appropriate frequency, but due to the intermolecular forces, they suffer inertia and are unable to align with the waves. This leads to a random movement of them, which generates heat. This selective form of heating is much more efficient and homogeneous and the energy consumption is much lower. In addition, the migration of dissolved ions increases the penetration of the solvent into the matrix and favors the release of analytes [25,26]. Microwaves have also been used to extract antioxidant substances from a large number of matrices, such as tomato [27], oil [28] or blackberries [29].
There is no standard protocol for UAE and MAE, and several parameters, such as the solvent concentration, ratio, extraction time and temperature, may significantly affect the extraction efficiency. Therefore, the determination and the optimization of key parameters are important for maximizing the yield [30].
Although a large number of studies have been carried out on the extraction of capsaicinoids [31,32,33], using a considerable variety of solvents, scarce studies on the extraction of capsinoids have been reported in literature. Moreover, most of them analyze the implementation of an extraction method specifically developed for capsaicinoids, to the extraction of capsinoids. However, capsinoids have a lower polarity, and it is, therefore, necessary to develop new and specific extraction methods for them [34].
Multivariate statistical techniques have been previously used to optimize different processes such as extraction and chromatographic separation of antioxidant compounds. The main benefit obtained from the optimization of these processes is the shortening of time and the reduction in the number of experiments required with the subsequent economic and energy consumption savings [35]. In this work, the optimization process includes a mixture design—a special class of response surface experiments where the investigated factor (in this case the extraction solvent) is made up of several components. The solvent components interact with each other and these solvent–solvent interactions are taken into account to determine the optimal mixture by improving several responses at the same time [36]. Subsequently, a Box–Behnken experimental design (BBD) was used; a response surface factorial design that avoids performing experiments under extreme conditions. Moreover, BBD allows for the development of mathematical models that facilitate the assessment of the statistical significance of each factor analyzed, as well as their interactions. When interaction effects are detected, the optimal conditions between univariate and multivariate optimization will be different [37,38].
Capsinoids are compounds with superior health benefits, as well as major antioxidant properties, but they degrade easily and in a short time [39]. For this reason, it is necessary to develop extraction and analysis techniques that indicate those pepper varieties that are rich in the compounds of interest to obtain higher quality extracts. Since an exhaustive analytical method for the extraction of capsinoids has not yet been developed, the aim of the work described here is to apply multivariate statistical techniques to optimize the extraction of capsinoids from peppers by both UAE and MAE methods.

2. Materials and Methods

2.1. Reagents

Methanol, ethanol, acetone, ethyl acetate and acetronitrile were obtained from Panreac Química (S.A.U., Castellar del Vallés, Barcelona, Spain), hexane from Carlo Erba Reagents (Dasit Group, Sabadell, Barcelona, Spain), and acetic acid from Merck (Darmstadt, Germany), all of these substances were of HPLC grade. Milli-Q water was obtained by means of a Millipore water purification system (Bedford, MA, USA). Solutions of hydrochloric acid and sodium hydroxide (Panreac Química, S.A.U, Castellar del Vallés, Barcelona, Spain) were used to adjust the pH values with a Crison GLP 21 pH-meter (Crison, Barcelona, Spain). Capsiate (4-hydroxy-3-methoxybenzyl (E)-8-methyl-6-nonenoate) and dihydrocapsiate (4-hydroxy-3-methoxybenzyl-8-methylnonanoate) standards were synthesized following the method described by Barbero et al. [40].

2.2. Pepper Sample

Biquinho (Capsicum chinense) was the pepper variety employed to study the extraction process. The samples were supplied by Germplasm Bank of Zaragoza from the Agrifood Research and Technology Center (CITA) in Aragón (Zaragoza, Spain). The Biquinho variety was chosen because a high content in capsiate had been detected in the preliminary tests. The sample was lyophilized by means of a laboratory freezer dryer LYOALFA manufactured by Azbil Telstar Technologies (Terrasa, Barcelona, Spain); it was then ground in a conventional electric mill to increase the contact surface between the solvent and the fruit, and stored at −20 °C prior to analysis.
The methods developed were applied to other ten varieties of peppers to determine the amount of capsiate (care was taken to select the fruit of the same generation and with similar size). All of them were sown and harvested at the Agronomic Institute of Campinas (IAC) (Campinas, SP-Brazil), and stored at −20 °C.

2.3. Extraction Equipment and Procedure

2.3.1. Ultrasound-Assisted Extraction (UAE)

The extraction was performed using a UP200S ultrasonic system (Hielscher Ultrasonics, Teltow, Germany) which allows the control and modification of both the amplitude and the cycle. The sample was immersed in a thermostatic bath coupled to a temperature controller (7 Liter Refrigerated Circulator, PolyScience, Illinois, United States) to maintain the desired extraction temperature. Lyophilized sample (approximately 0.2 g) was weighed in a 50 mL “Falcon” and the necessary volume of the appropriate solvent was added based on the experimental design. Then, it was introduced into the double-walled vessel to control the temperature and the ultrasonic probe was also inserted while avoiding any contact with the vessel’s walls and bottom. The extraction was started under controlled UAE conditions. After the extraction, the sample was allowed to cool down at room temperature. The extract was centrifuged twice for 5 min at 7500 rpm (orbital radius 9.5 cm), transferring the supernatant after each centrifugation cycle to a 25 mL volumetric flask and making up to the mark with the appropriate solvent. Finally, the extract was transferred to a vial and stored in a freezer at –20 °C prior to analysis.

2.3.2. Microwave-Assisted Extraction (MAE)

A MARS 6 240/50 (One Touch Technology, CEM Corporation, Matthews, NC, USA) was used for MAE. Similarly to the UAE described above, the necessary amount of sample (0.2 g) was weighed and put into an extraction chamber (high pressure Teflon containers). Then, the corresponding amount of the optimized solvent was added, it was closed by means of a Teflon cap to prevent gas leaks that may be generated because of the high temperatures and it was then placed in the rotary carousel. Once all the cameras had been prepared, the carousel was placed into the extraction equipment and closed to start the corresponding extraction program as configured. The rest of the procedures after the extraction were the same as for the previously explained UAE.

2.4. UHPLC Analysis

An UHPLC Acquity Ultra Performance LC Class (Waters Corporation, Milford, MA, USA) system was used for the separation and quantification of capsinoids. It was equipped with an ACQUITY UPLC® H-Class autosampler set at 15 °C, an ACQUITY UPLC quaternary solvent manager, an ACQUITY UPLC Photodiode Array Detector set at 280 nm, and an ACQUITY UPLC BEH C-18 reverse phase column (100 mm × 2.1 mm; 1.7 μm particle size) set at 50 °C. The mobile phase consisted of Milli-Q water as solvent A and acetonitrile as solvent B, both acidified by adding 0.1% acetic acid. Theses solvents were filtered through a 0.22 μm nylon filter (Nylon Membrane Filter, FILTERLAB, Barcelona, Spain) and degassed using an ultrasonic bath (Elma S300 Elmasonic, Singen, Germany). The gradient employed was as follows: 0 min, 0% B; 0.50 min, 45% B; 1.60 min, 45% B; 1.95 min, 50% B; 2.45 min, 55% B; 2.80 min, 63% B; 3.00 min, 63% B; 4.00 min, 100% B; 6.00 min, 100% B. An injection volume of 3 μL and a flow of 0.8 mL min−1 were applied. The UHPLC chromatogram is shown in Figure S1.
A calibration curve was used to quantify the compounds of interest. Capsiate and dihidrocapsiate at known concentrations between 0.01 and 200 mg L−1 were used as reference patterns. The calibration curves and the limits of detection and quantification were as follows: y = 2715.2076x–526.9713, LOD = 0.079 mg L−1, LOQ = 0.265 mg L−1/y = 2498.4568x–382.2437, LOD = 0.096 mg L−1, LOQ = 0.320 mg L−1, for capsiate and dihidrocapsiate respectively, both with a linear regression coefficient (R2) of 0.9997. The results were expressed as micrograms of capsinoids per gram of dry pepper.

2.5. Experimental Design and Data Treatment

Two statistical designs were proposed for the optimization of the capsinoid extraction methods from peppers. The first method consists of selecting the best extraction solvent based on a combination of water, acetonitrile, methanol, ethanol, acetone, hexane or ethyl acetate. Then, a statistical mixture design with three components (the three best solvents for each method) was used to determine the optimal mixture of the solvents.
After the optimal extraction solvent was selected, a Box–Behnken experimental design was carried out to determine the best equipment conditions in relation to time, temperature, pH, and ratio. During the optimization procedures, two types of variables were considered: the responses or dependent variables, and the factors or independent variables. The latter could take three possible values, which were coded as −1, 0, and 1 representing their minimum, medium, or maximum value, respectively. An experimental design matrix with 27 trials was performed in duplicate with six repetitions of the center point. Both responses obtained from the different extractions were entered into a second-order polynomial equation to correlate them with the independent variables including the linear, quadratic and interactive components [41,42]:
y   =   β o + i   =   1 k β i X i + i   =   1 k β ii X i 2 + i   =   1 k j   =   1 k β ij X i X j + ε
where y is the response, β0, βi, βii and βij are the regression coefficients for the terms of intersection, linear, quadratic and interaction, respectively; and i and j are the independent coded variables that affect the response.
These coefficients as well as the statistical significance of the model were determined by the analysis of variance (ANOVA). For the experimental design, data analysis and model building, the Statgraphic Centurion Version XVII (The Plains, Fauquier, Virginia, United States) was employed.

3. Results and Discussion

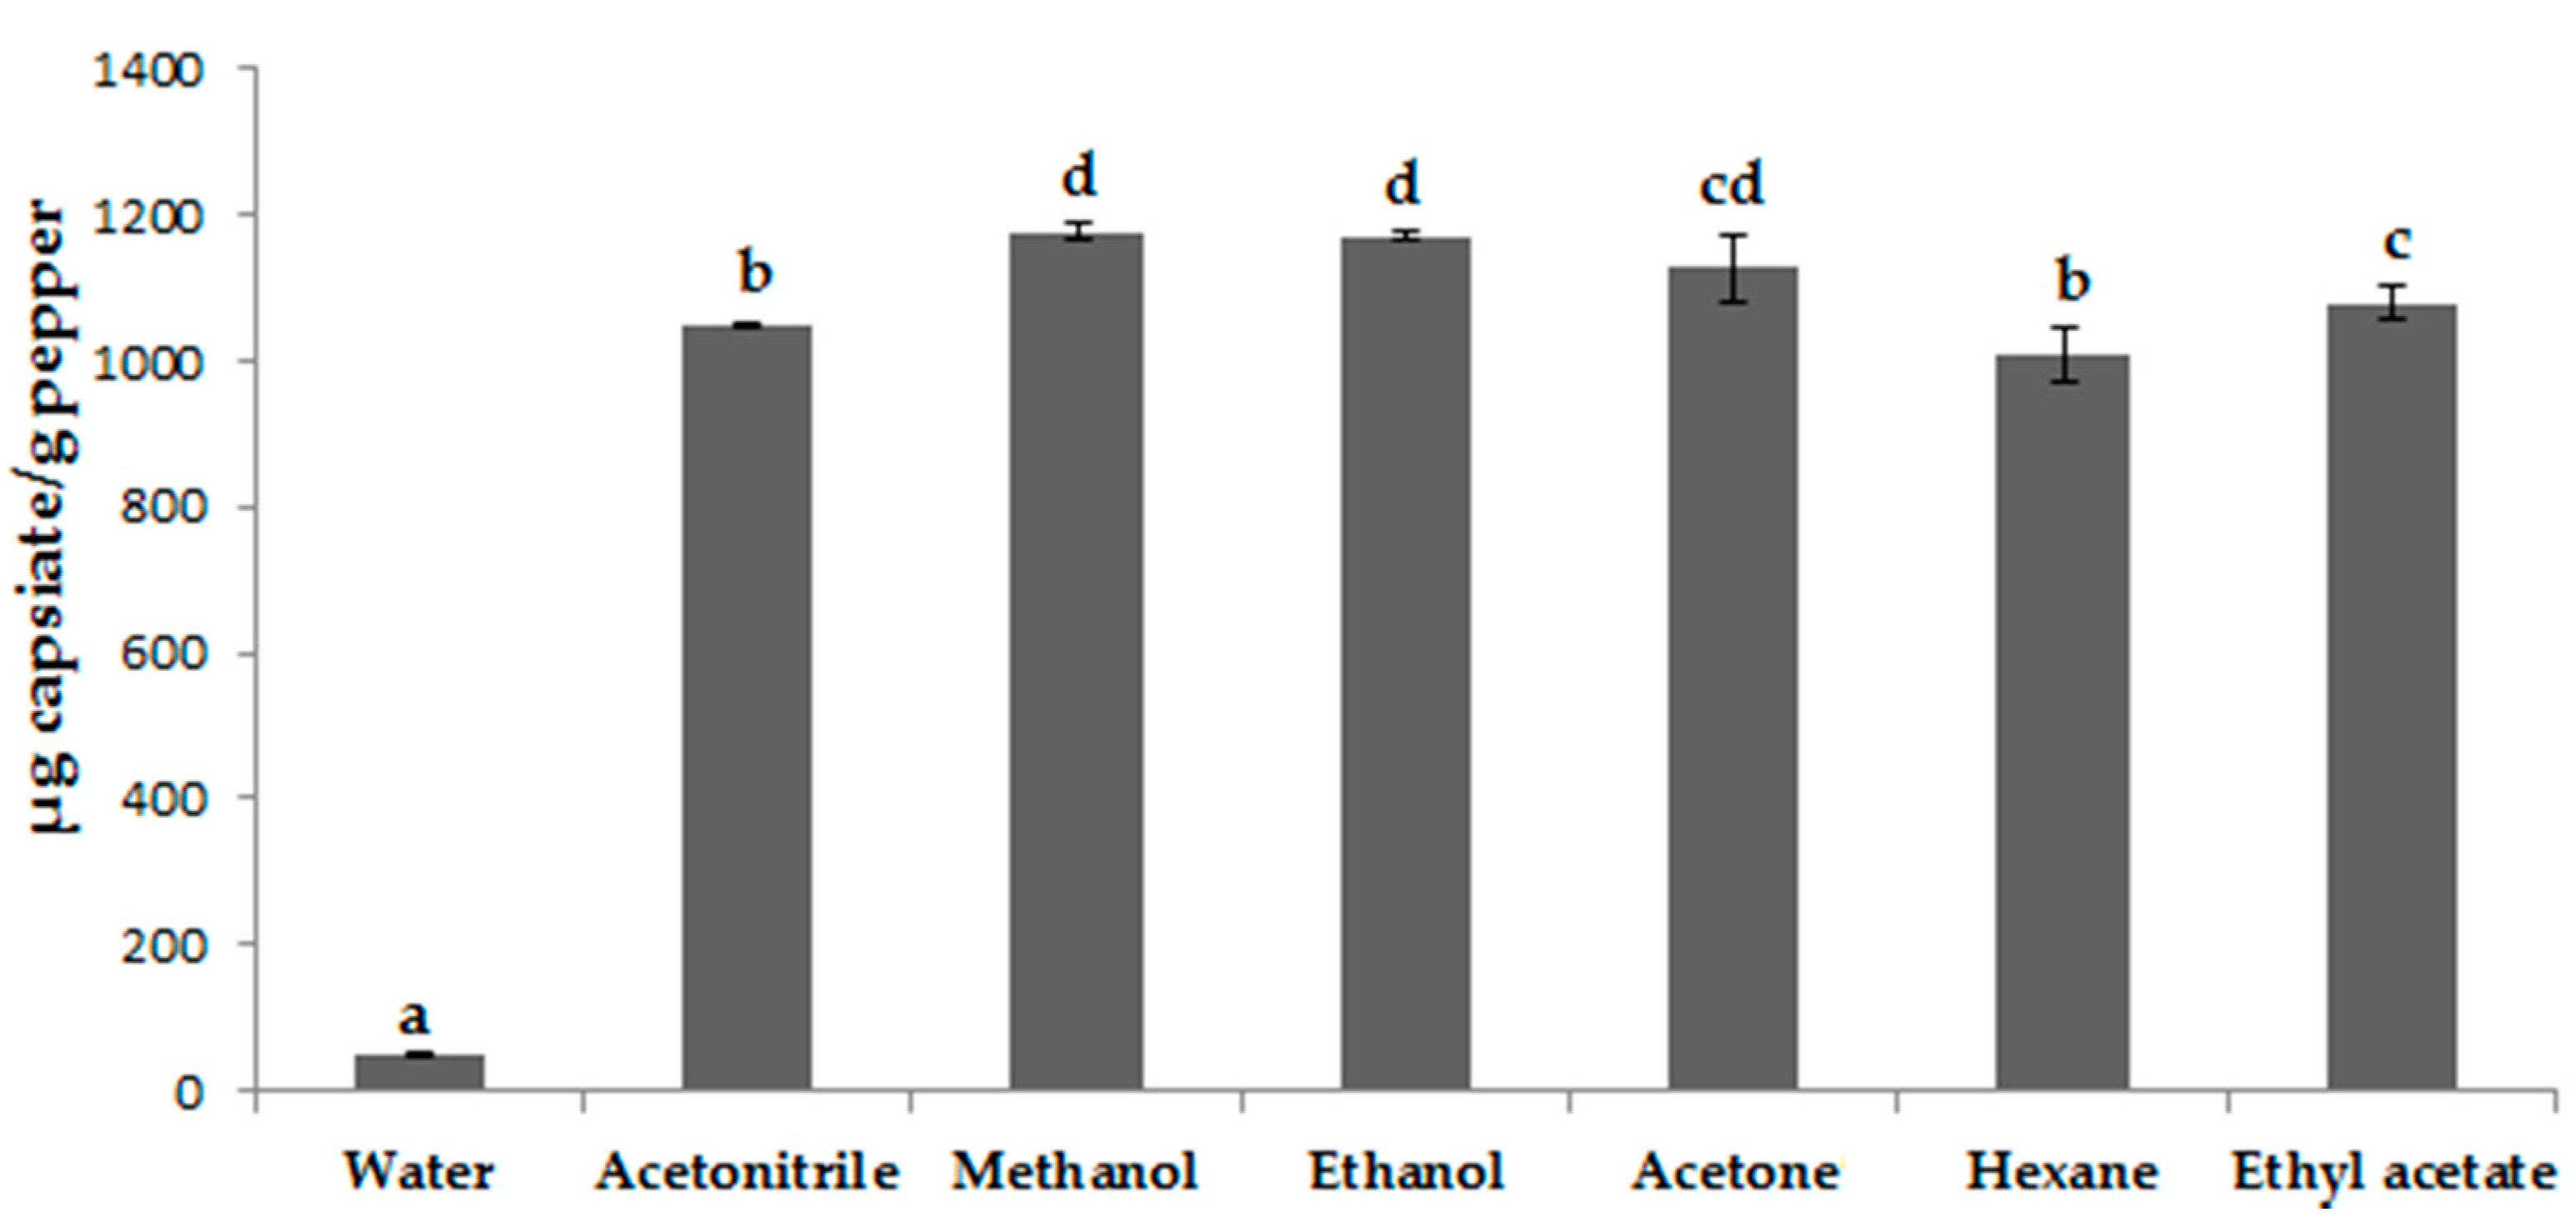
3.1. Selecting the Extraction Solvent

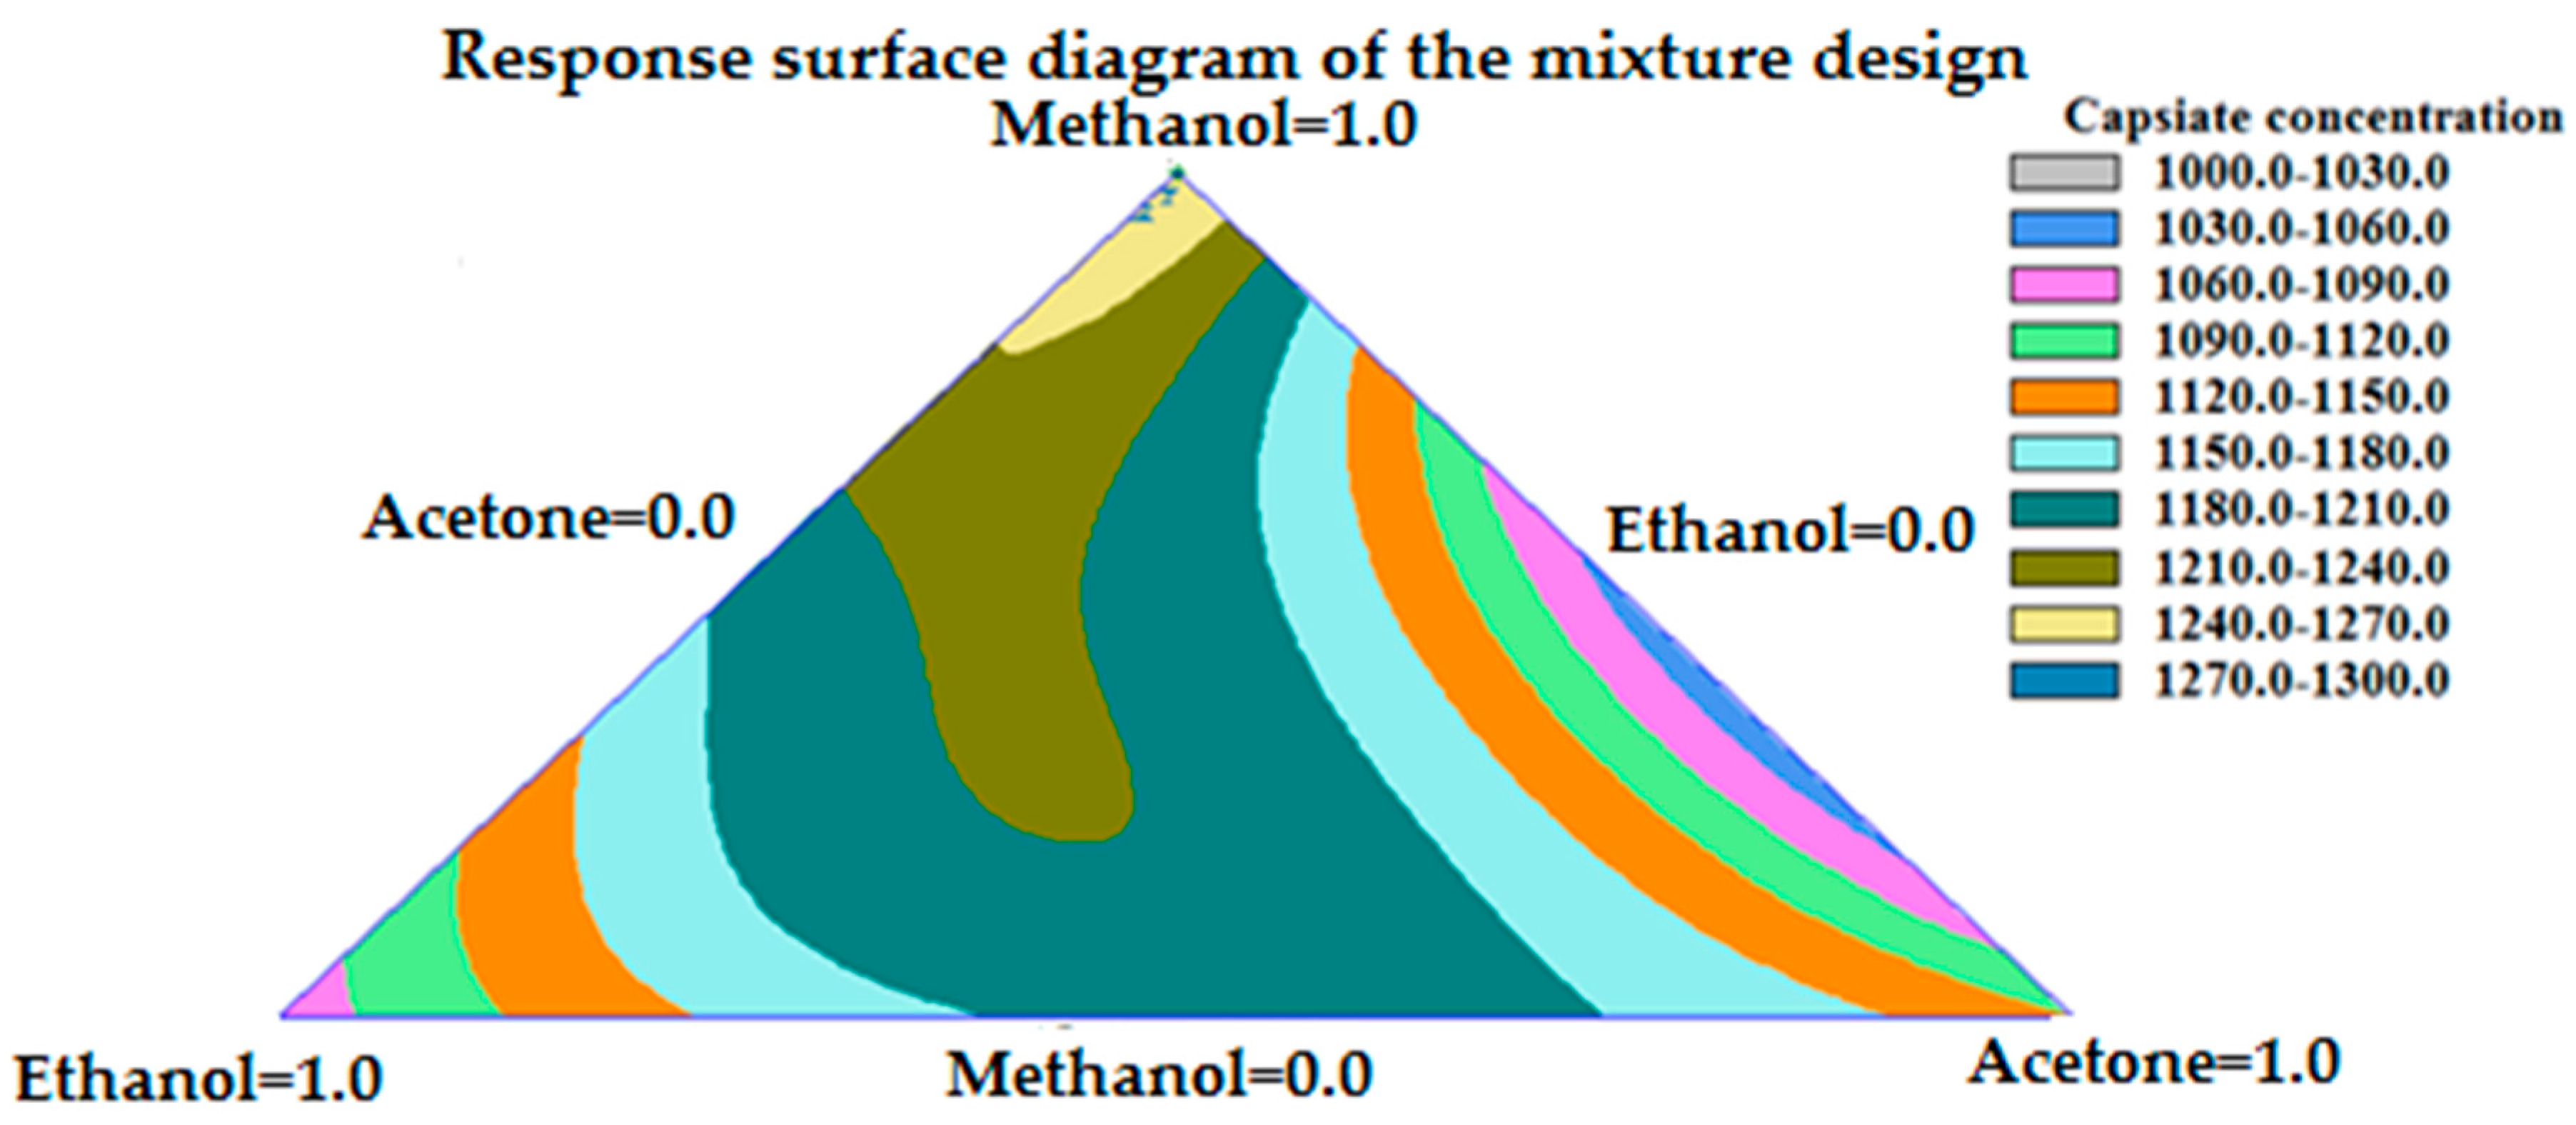
3.1.1. Solvent Selection Procedure for UAE

A mixture design was performed in order to determine the optimal extraction solvent. The rest of the variables were set as follows: 10 min extraction time, 40 °C temperature, 80% of the total power (200 W) and 10 mL volume. These initial conditions had been previously analyzed to verify that they were valid and that the extraction of capsinoids was feasible. These results are shown in Figure S2. After setting up these conditions, the extraction efficiency of different single component solvents was tested (Milli-Q water, acetonitrile, methanol, ethanol, acetone, hexane, and ethyl acetate). All the extractions were carried out in duplicate and the results are represented in Figure 2.
It can be seen that no capsiate was extracted when water was used as the only solvent. Due to its high polarity, it is not a good solvent for the extraction of this type of compounds, which have an aromatic ring and a hydrocarbon chain in their structure. Hexane is a very volatile solvent, so a large amount of it was lost by evaporation during the extraction procedure, which resulted as detrimental for its extraction efficiency. Furthermore, it has a lower polarity than capsiate, which makes extraction difficult. For these two reasons, i.e., polarity and affinity, acetone, ethyl acetate and methanol proved to be the most suitable solvents to extract capsiate by producing the highest extraction yields.
These three solvents were, therefore, selected for the mixture design (Table S1). Statgraphic Centurion was the statistical program used and Simplex Centroid Extended model with 10 experiments was employed. Linear, quadratic and cubic mathematical models were tested to explain the results. Each mathematical model was validated by means of an analysis of variance (ANOVA), as shown in Table 1. In turn, the optimal mixture of solvents was observed in the region that can be seen in Figure 3.
As far as UAE is concerned, both the quadratic and the cubic models were significant, since they showed a p-value less than 0.05 as well as high F and R2 values. The same optimum mixture of solvents was obtained for both models: 42% methanol + 58% ethyl acetate.
Similar studies for the extraction of capsaicinoids, where different solvents (methanol, ethanol, acetonitrile, acetone, ethyl acetate and water) had been tested, have been found in literature. A 100% methanol was determined as the optimal extraction solvent [33,43]. Due to the lower polarity of capsinoids in comparison with capsaicinoids [44], it was to be expected that the optimum solvent or solvent mixtures should have a lower polarity than that of methanol to facilitate the extraction process. In this sense, Lang Y. et al. used 100% ethyl acetate for the extraction of capsinoids from peppers [45], but, unfortunately, they did not fully develop the method. After all the tests were completed, the optimal solvent for the UAE method was found to be a combination of methanol and ethyl acetate.

3.1.2. Solvent Selection Procedure for MAE

MAE was tested with the same individual solvents used for UAE. In this case, the rest of the variables were adjusted as follows: 5 min extraction time, 800 W power, 10 mL volume and 50 °C temperature—which was the minimum temperature allowed by the equipment. All the extractions were carried out in duplicate and the results are represented in Figure 4.
As expected, when water was used as the only solvent the amount of compounds extracted was practically negligible due to its high polarity in comparison with that of capsiate. The solvents that obtained the best extraction yields with MAE were methanol and ethanol, followed by acetone. A slightly different result was obtained compared to UAE, since both extraction methods have different properties, conditions and operation procedures. In the UAE method, sound waves travel through the material and cause the cavitation phenomena that heat the entire sample evenly over the extraction process [18]. On the contrary, in the MAE method, the heat is generated by the interaction between the radiation and the molecules, as the molecules try to align with the waves of the electromagnetic field. The radiation excites mainly the OH bond in methanol and ethanol. By absorbing energy, it quickly passes from the ground state to an excited one, which raises the energy of the molecules and their temperature, what in turn enables the extraction of the compounds of interest from the plant matrix [25]. Methanol, ethanol and acetone have exhibited the most appropriate characteristics in terms of polarity and affinity for the extraction of capsinoids from peppers by MAE.
These three solvents were, therefore, selected for the mixture design (Table S2). An identical statistical treatment as the used for UAE was applied to MAE, i.e., Simplex Centroid Extended model with 10 experiments. Then, each mathematical model was validated by an analysis of variance (ANOVA), as shown in Table 2. Figure 5 shows the optimal mixture of solvents.
None of the models tested with MAE was particularly relevant, since none of them had a p-value lower than 0.05. Therefore, 100% methanol was used as the optimal solvent, since it was the optimum result of the model with the highest R2 coefficient value. In addition, this solvent is the easiest one to use as it is compatible with the rp-C18 HPLC column and neither evaporation of the solvent from the extract nor redissolution of the compounds of interest are required.

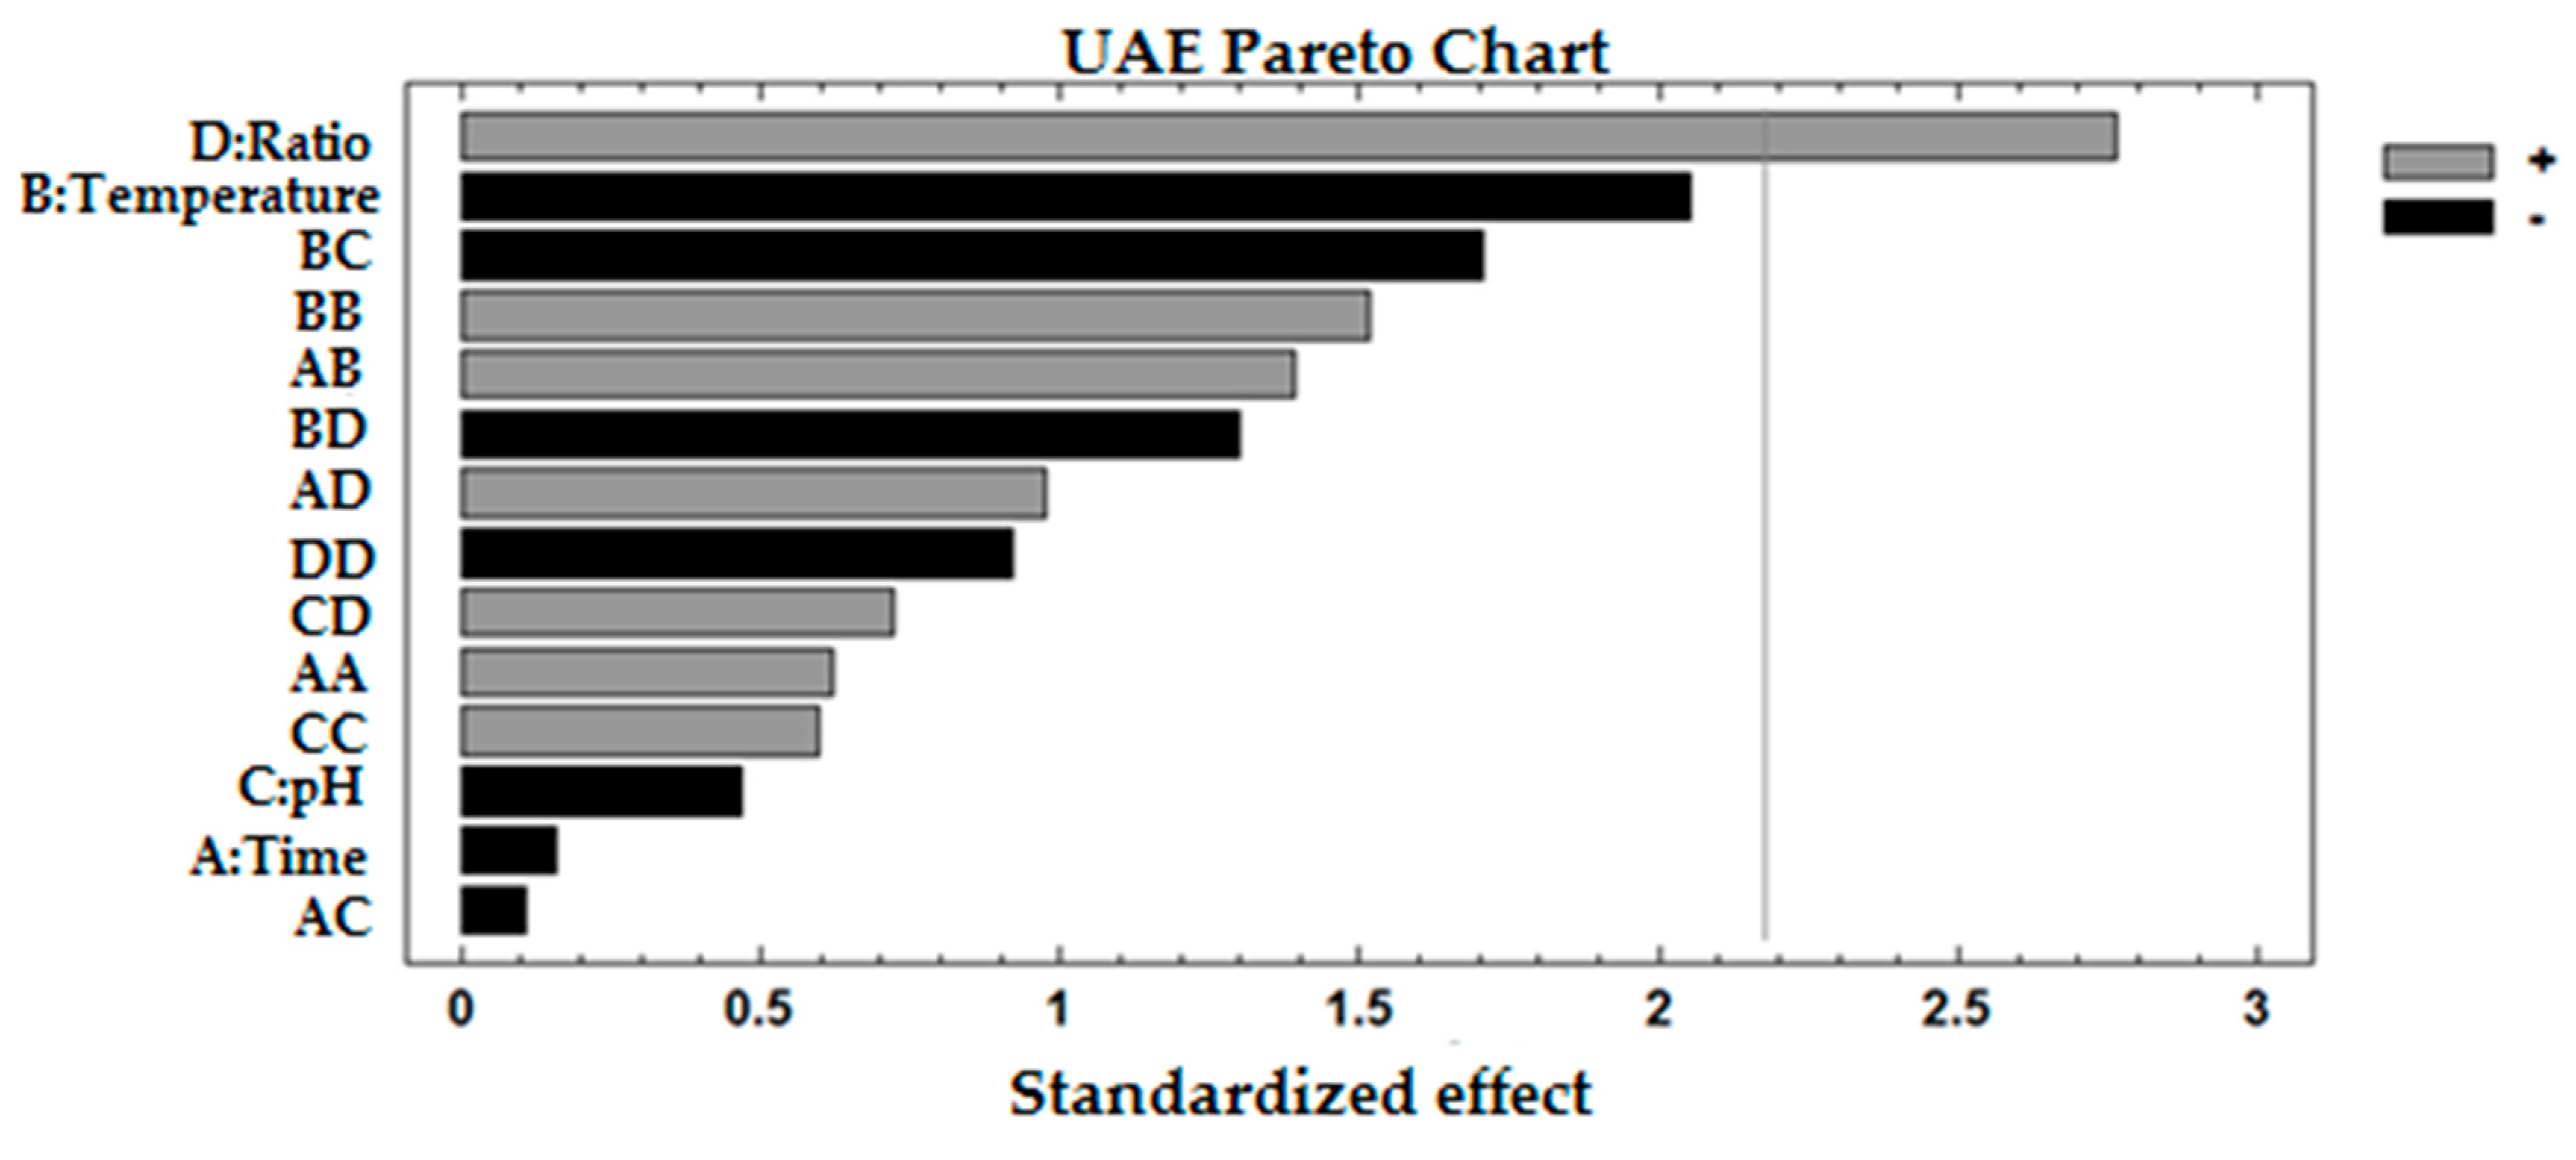
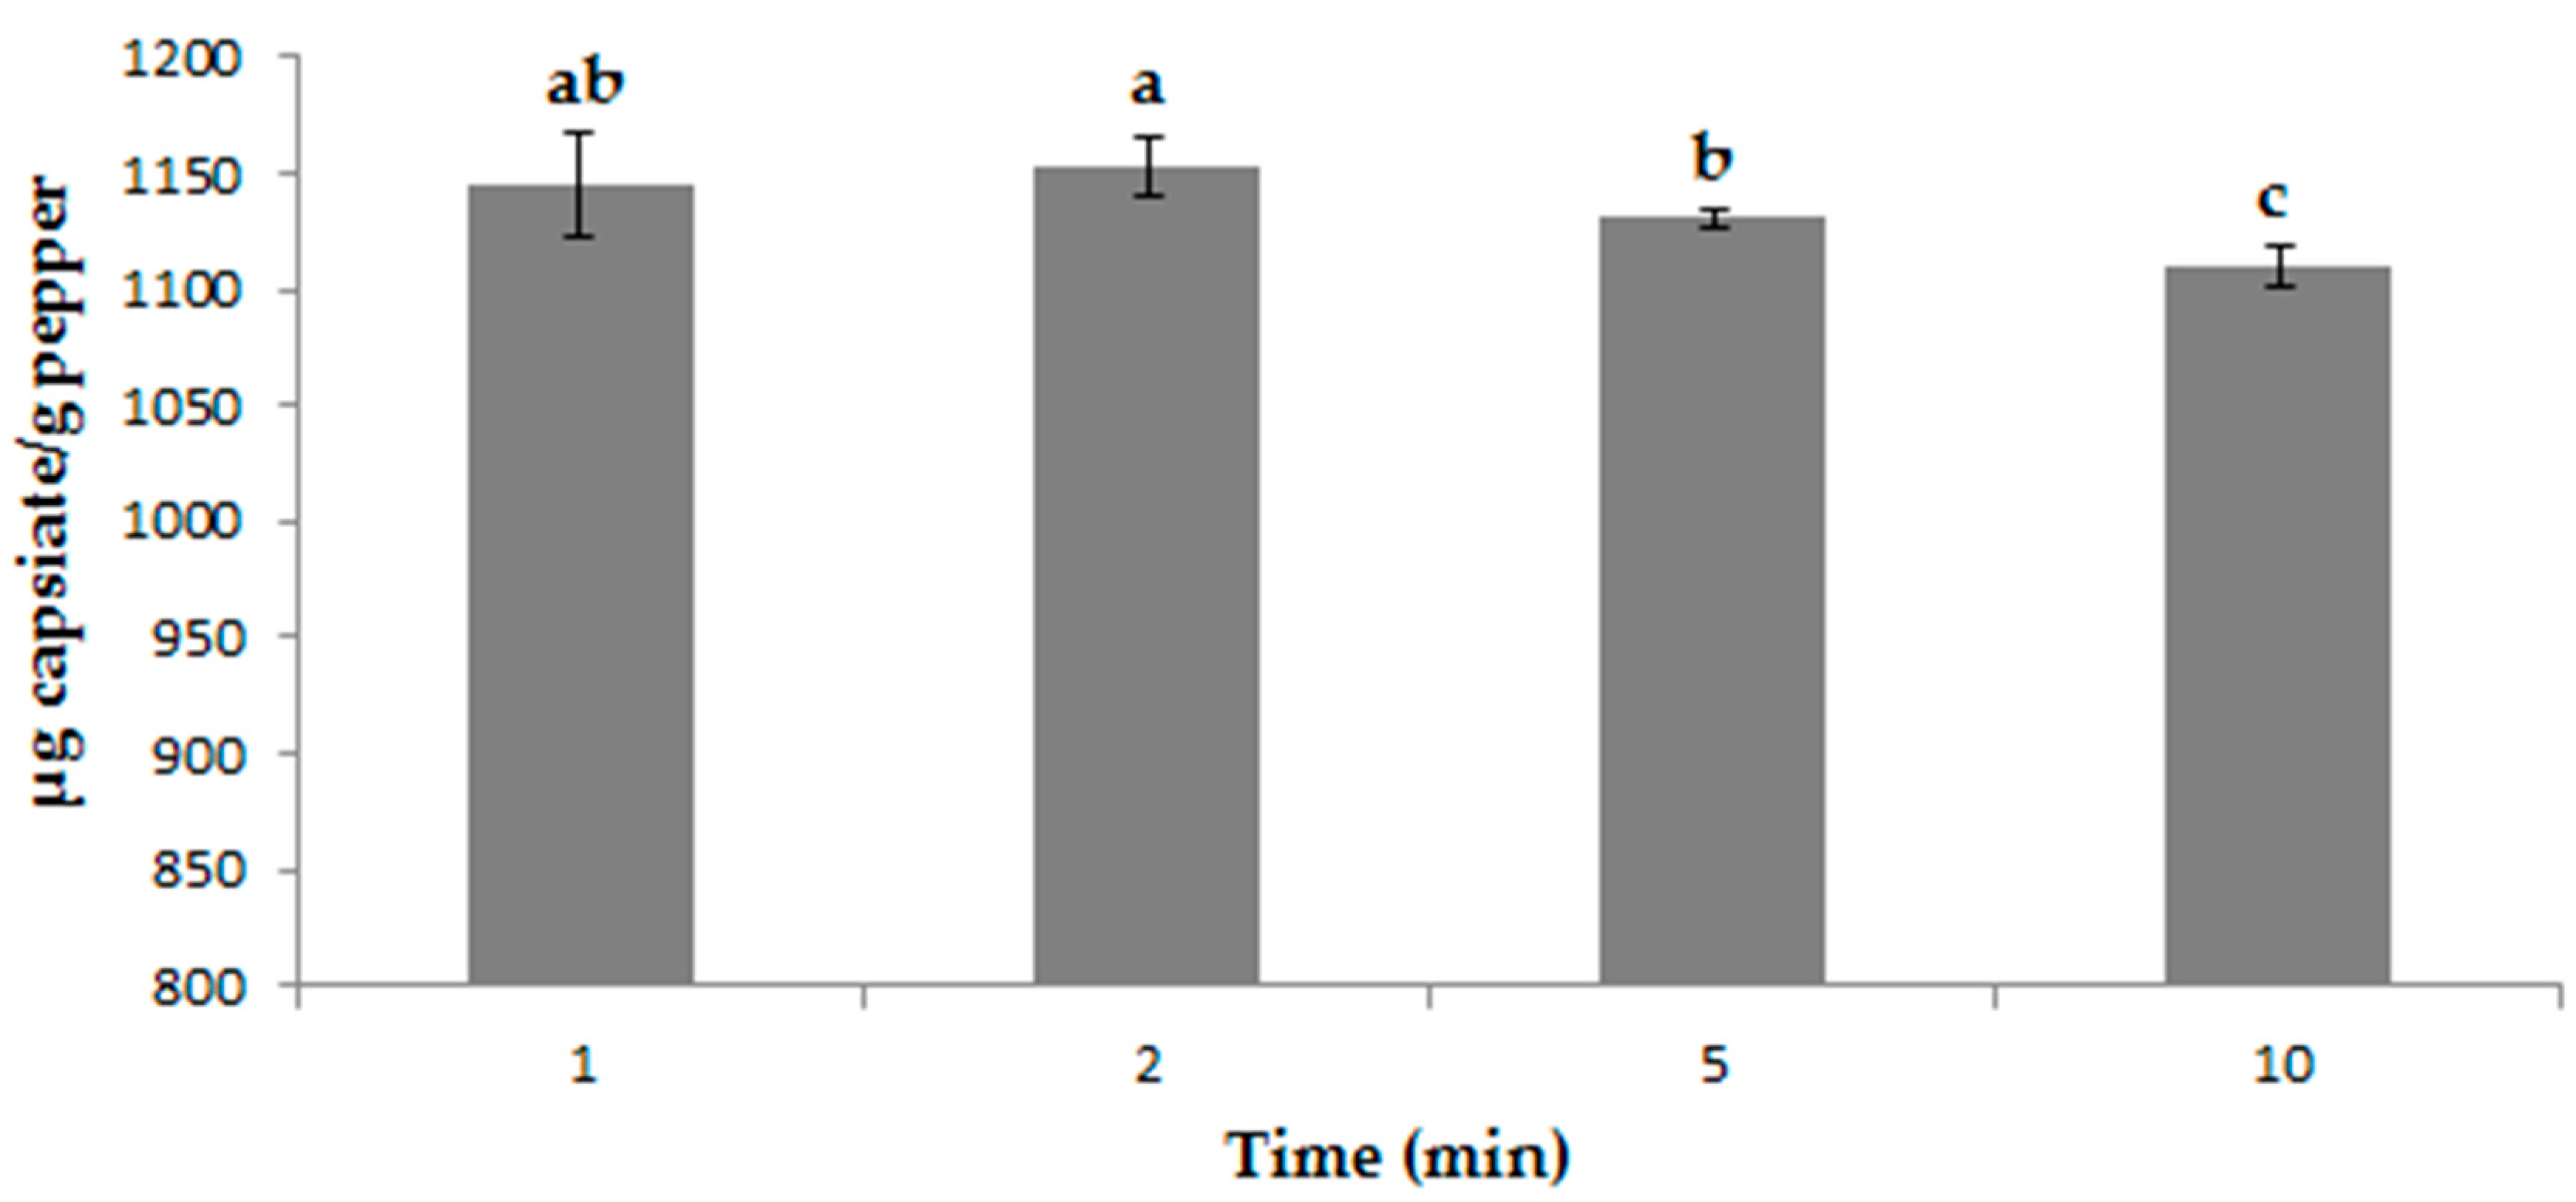
3.2. Determining Optimal Ultrasound Conditions

After the optimal solvent mixture had been determined, a Box–Behnken design with four independent variables (time: 5, 10, 15 min, temperature: 5, 30, 55 °C, pH: 2, 5, 8, and relation sample mass:solvent volume ratio: 0.2:5, 0.2:10, 0.2:15 g:mL) and concentration of capsiate (μg g−1) as the response was employed. For the optimization of such experimental variables, 27 experiments had to be completed, the results of which are shown in Table S3.
The analysis of variance in Table 3 generated some mathematical models that intended to evaluate the individual effect of each variable, as well as any possible interactions between them. Those variables or interactions that had a p-value lower than 0.05 were considered to have a statistically relevant influence on the response at 95% confidence level. Ratio was the only variable that had an influence on the amount of capsiate extracted.
These results were graphically represented by a Pareto chart (Figure 6) for a better understanding.
The significance of each variable and their interactions are easily observed in decreasing order. In turn, positive and negative signs refer to a direct or inverse relationship, between the effect and the response. Again, ratio was the only variable with a significant influence. In addition, the greater the amount of solvent, the greater the amount of capsiate that would be extracted. This is concordant with mass transfer principles, since a higher ratio implies higher concentration gradient between the solid and the bulk of the liquid, resulting in a greater driving force for diffusion of compounds to the solvent [46], but up to a certain amount of solvent, where the extract would be exceedingly diluted for any quantification [47]. The effect of temperature was rather similar to that of ratio, although inversely; i.e., the lower the temperature, the greater the amount of capsiate that would be extracted.
This is due to the easier degradation of this compound at moderately high temperatures [48]. It can be said that a quite robust method has been validated, and the optimized solvent mixture, using this extraction technique, allows for extracting practically the total amount of capsiate present in the pepper samples by means of UAE. The variations in the other factors had hardly any influence on the extraction yields.
After the statistical treatment of the data, the following optimal conditions were determined: 5 min extraction time, 5.5 °C temperature, pH 8 and 14.5 mL volume by weight.
Although the extraction time was not a significant variable with regard to its influence on the response, the shortest time was selected as the optimal one. For this reason, a univariate study of the extraction kinetics was carried out to find out if the same or an even greater amount of capsiate could be extracted in a shorter time. The extractions were carried out in triplicate for 1, 2, 5 and 10 min under the optimal previous conditions. The results are shown in Figure 7.
It was observed that there were no significant differences between 1 and 2 min, although a greater amount of capsiate extracted at 2 min was visually noticeable. Therefore, it is a fairly rapid method related to the degradability of capsiate.
Finally, intermediate precision and repeatability tests were carried out under the previously determined optimal conditions. For repeatability, 10 extractions were performed on the same day and for intermediate precision, 10 extractions per day were carried out during three consecutive days. The coefficients of variation obtained, 1.60% and 2.08%, respectively supported the precision of this extraction method (Table S4). Both coefficients were below 5%, which is usually considered as the limit to affirm that a method is accurate in this type of studies.

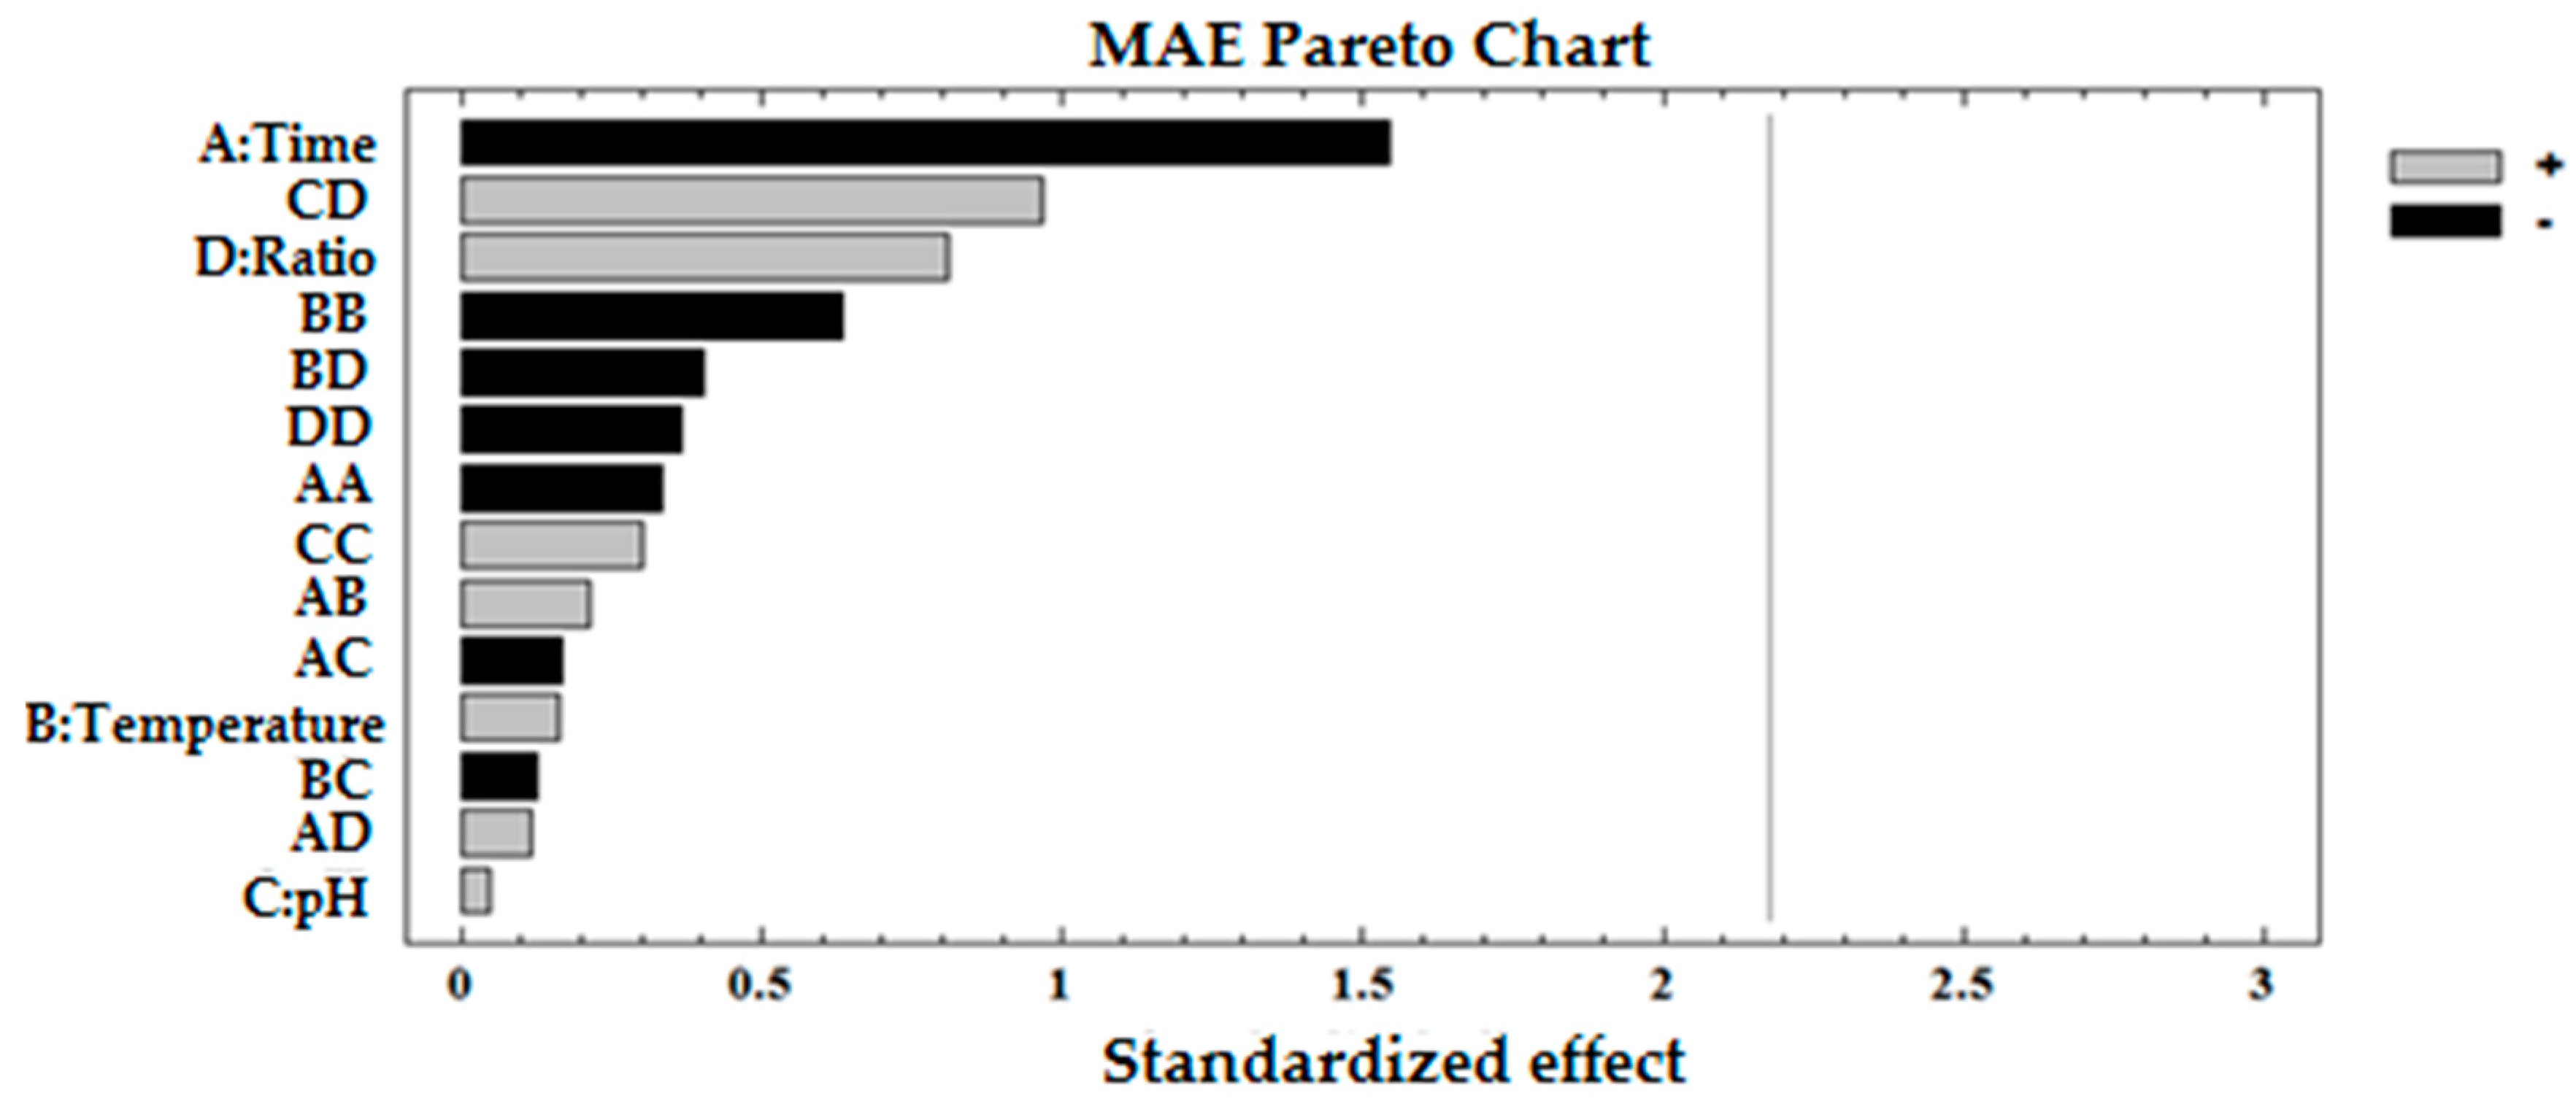
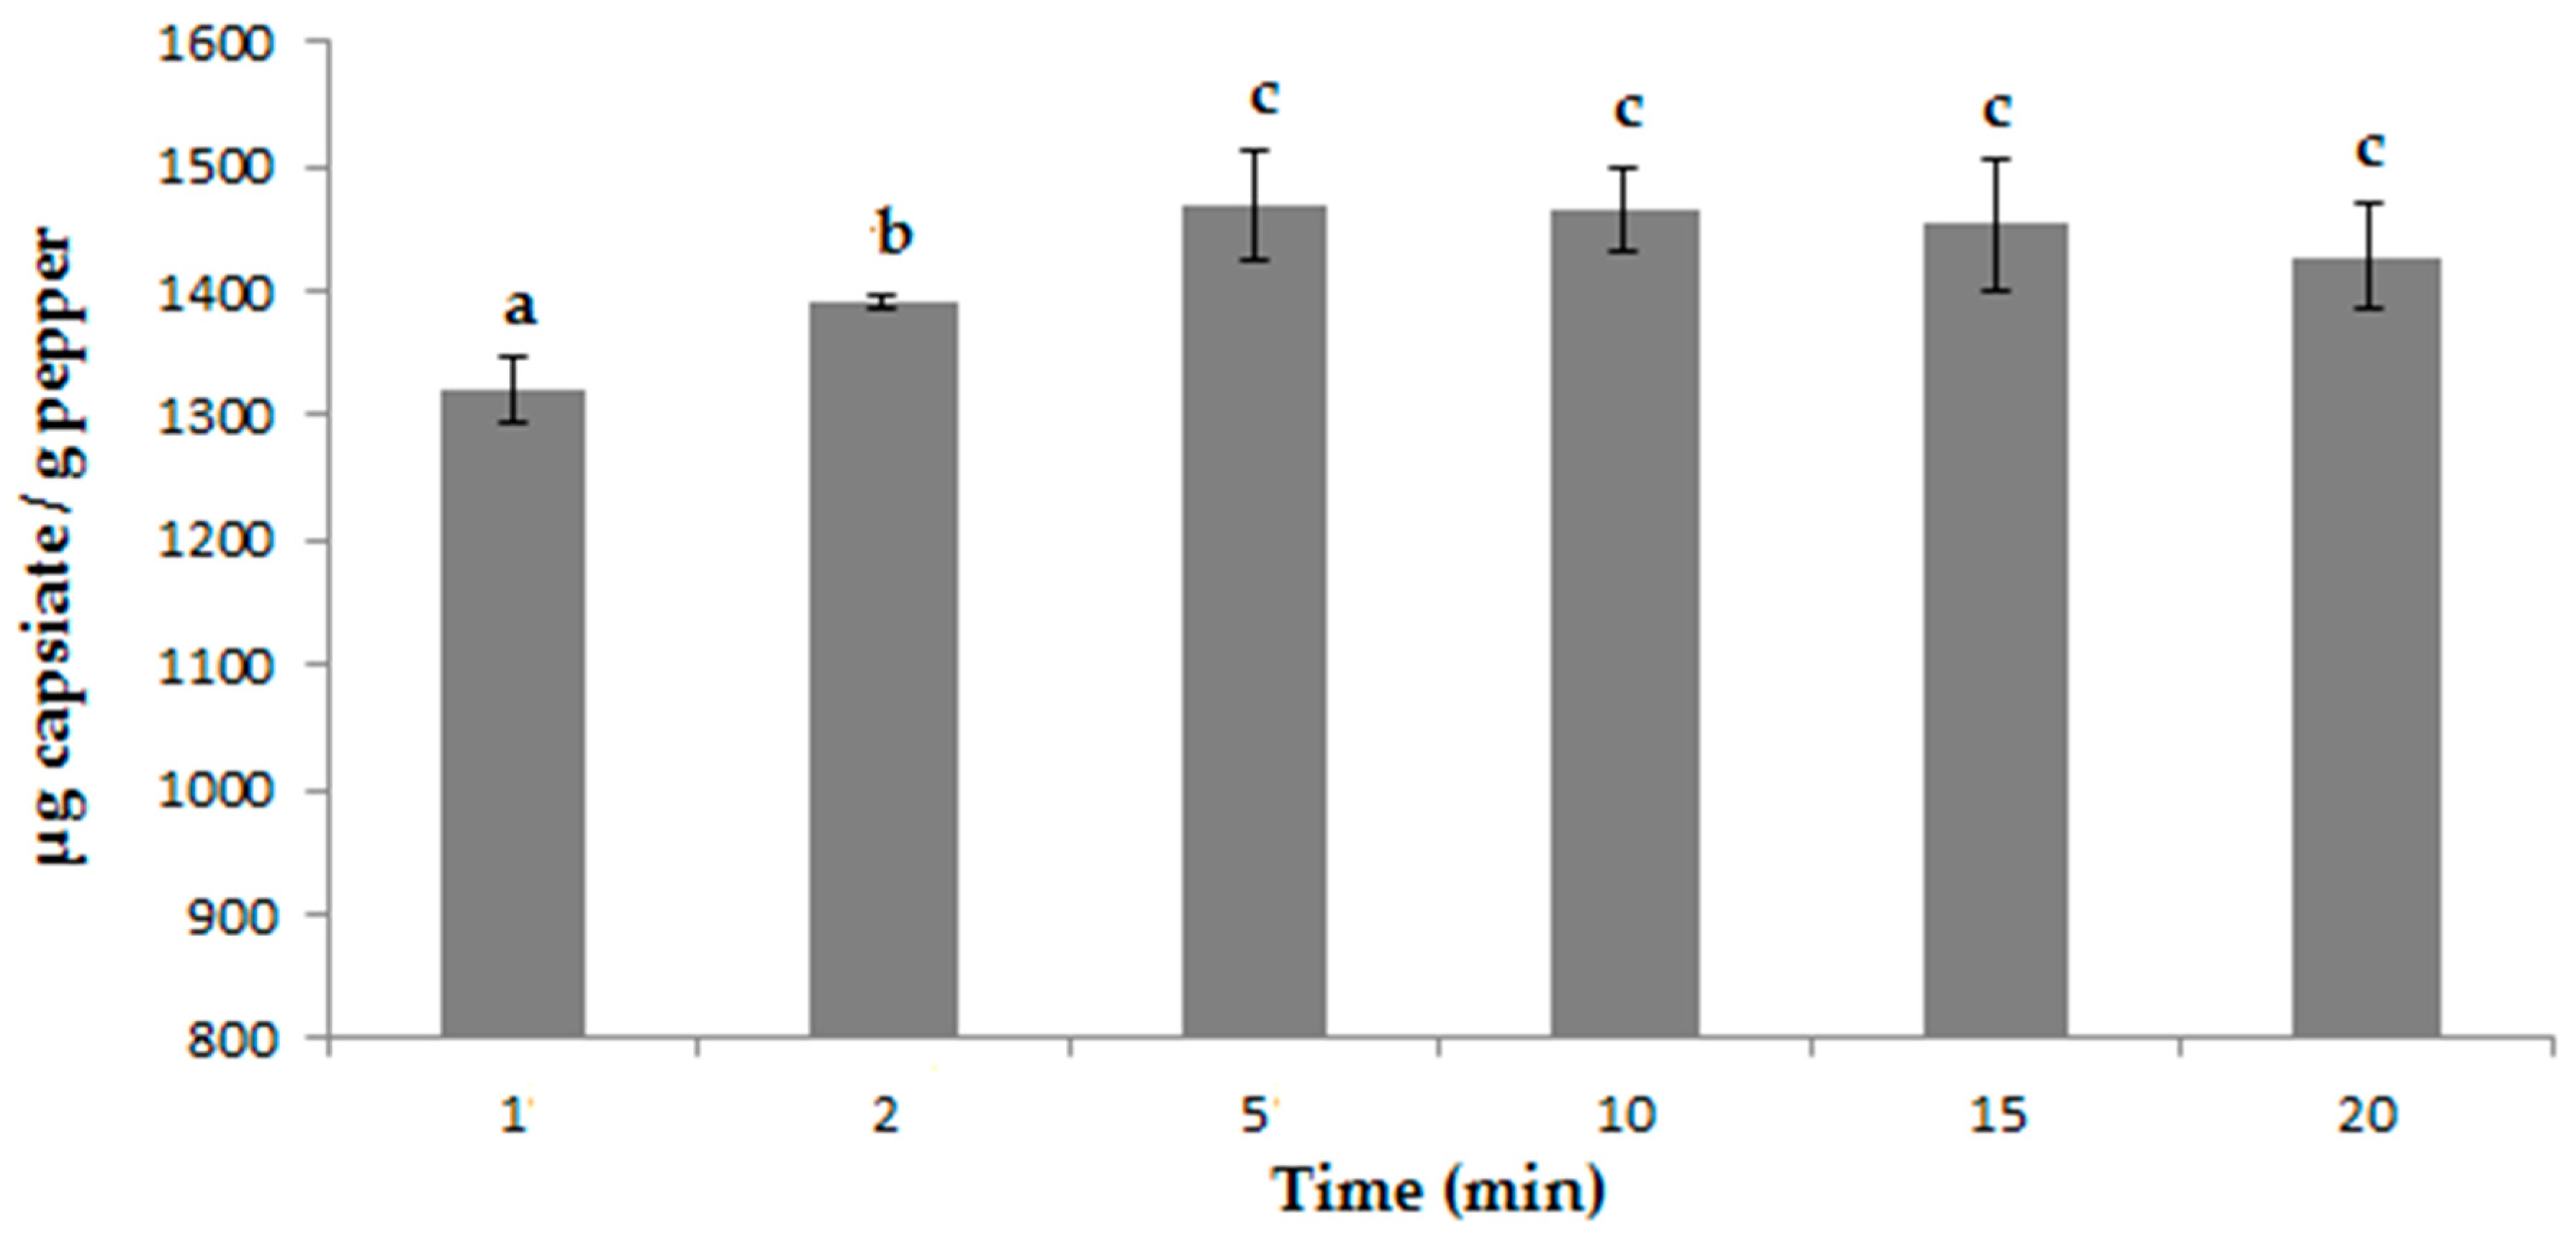
3.3. Determining Optimal Microwave Conditions

A similar statistical treatment as for UAE was applied to determine the optimal conditions for MAE. In this case, the ranges used for each independent variable were as follows: 5, 10, 15 min, 50, 75, 100 °C temperature, 2, 5, 8 pH, and 0.2:5, 0.2:10, 0.2:15 g:mL sample mass:volume of solvent; i.e., ratio. The extracted capsiate (μg g−1) was quantified as the response. The results are shown in Table S3.
The analysis of the variance (ANOVA) in Table 4 shows that no variable or interaction between them had a p-value lower than 0.05, so they did not have a statistically significant influence on the response, at 95% confidence level. In view of these results, they were analyzed with a confidence level of 98%, but again no variables were found to be significant.
The Pareto chart in Figure 8 confirmed that no variable or interaction exceeds the value of 2.17 and, therefore, their influence on the response was not significant. Several authors did not obtain large significance values for the variables analyzed with other similar matrices [49,50].
Even though no variable was actually significant, the most influential one was the extraction time, with an inverse relation, that is, the shorter the time the greater the amount of capsiate that would be extracted; followed by the ratio, which on the contrary, had a direct influence, i.e., the greater the amount of solvent, the greater the amount of the compound of interest that can be extracted. Finally, the other two variables analyzed, temperature and pH, had almost no influence on the response. These results indicate that MAE is a dependable method for the extraction of this type of compounds of interest present in peppers, since it allows for extracting the highest possible amount of capsiate from the samples regardless of any variations of the factors that have been analyzed.
After the statistical treatment of the data, the following optimal conditions were established: 5 min extraction time, 60 °C temperature, pH 8 and 0.2:15 g:mL ratio. It can be seen that, for some of the variables extreme values within their intervals were found to be their optimal value. In relation to ratio, a limit value was considered above which the compound of interest would be exceedingly diluted for an accurate quantification. In relation to pH, it had almost no influence on the response. The extraction time, even though it did not reach the minimum level to be considered as significant, was the variable that had the greatest influence on the response. In a similar way as for UAE, a univariate study of the extraction kinetics was carried out (Figure 9).
In this case, the time interval was extended in order to register the trend at higher values. Although no significant differences between 5, 10 and 15 min were registered, 5 min was established as the optimal extraction time for saving reasons.
Finally, a repeatability and intermediate precision study was carried out under the previously selected optimal extraction conditions and in the same way as explained above for UAE. Very accurate results were obtained, since the coefficient of variation were 2.48% for repeatability and 3.96% for intermediate precision (Table S4).

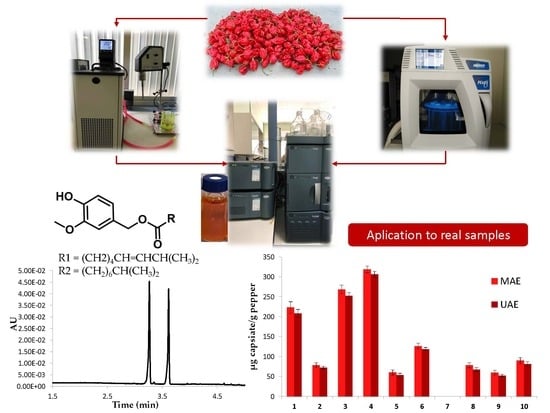
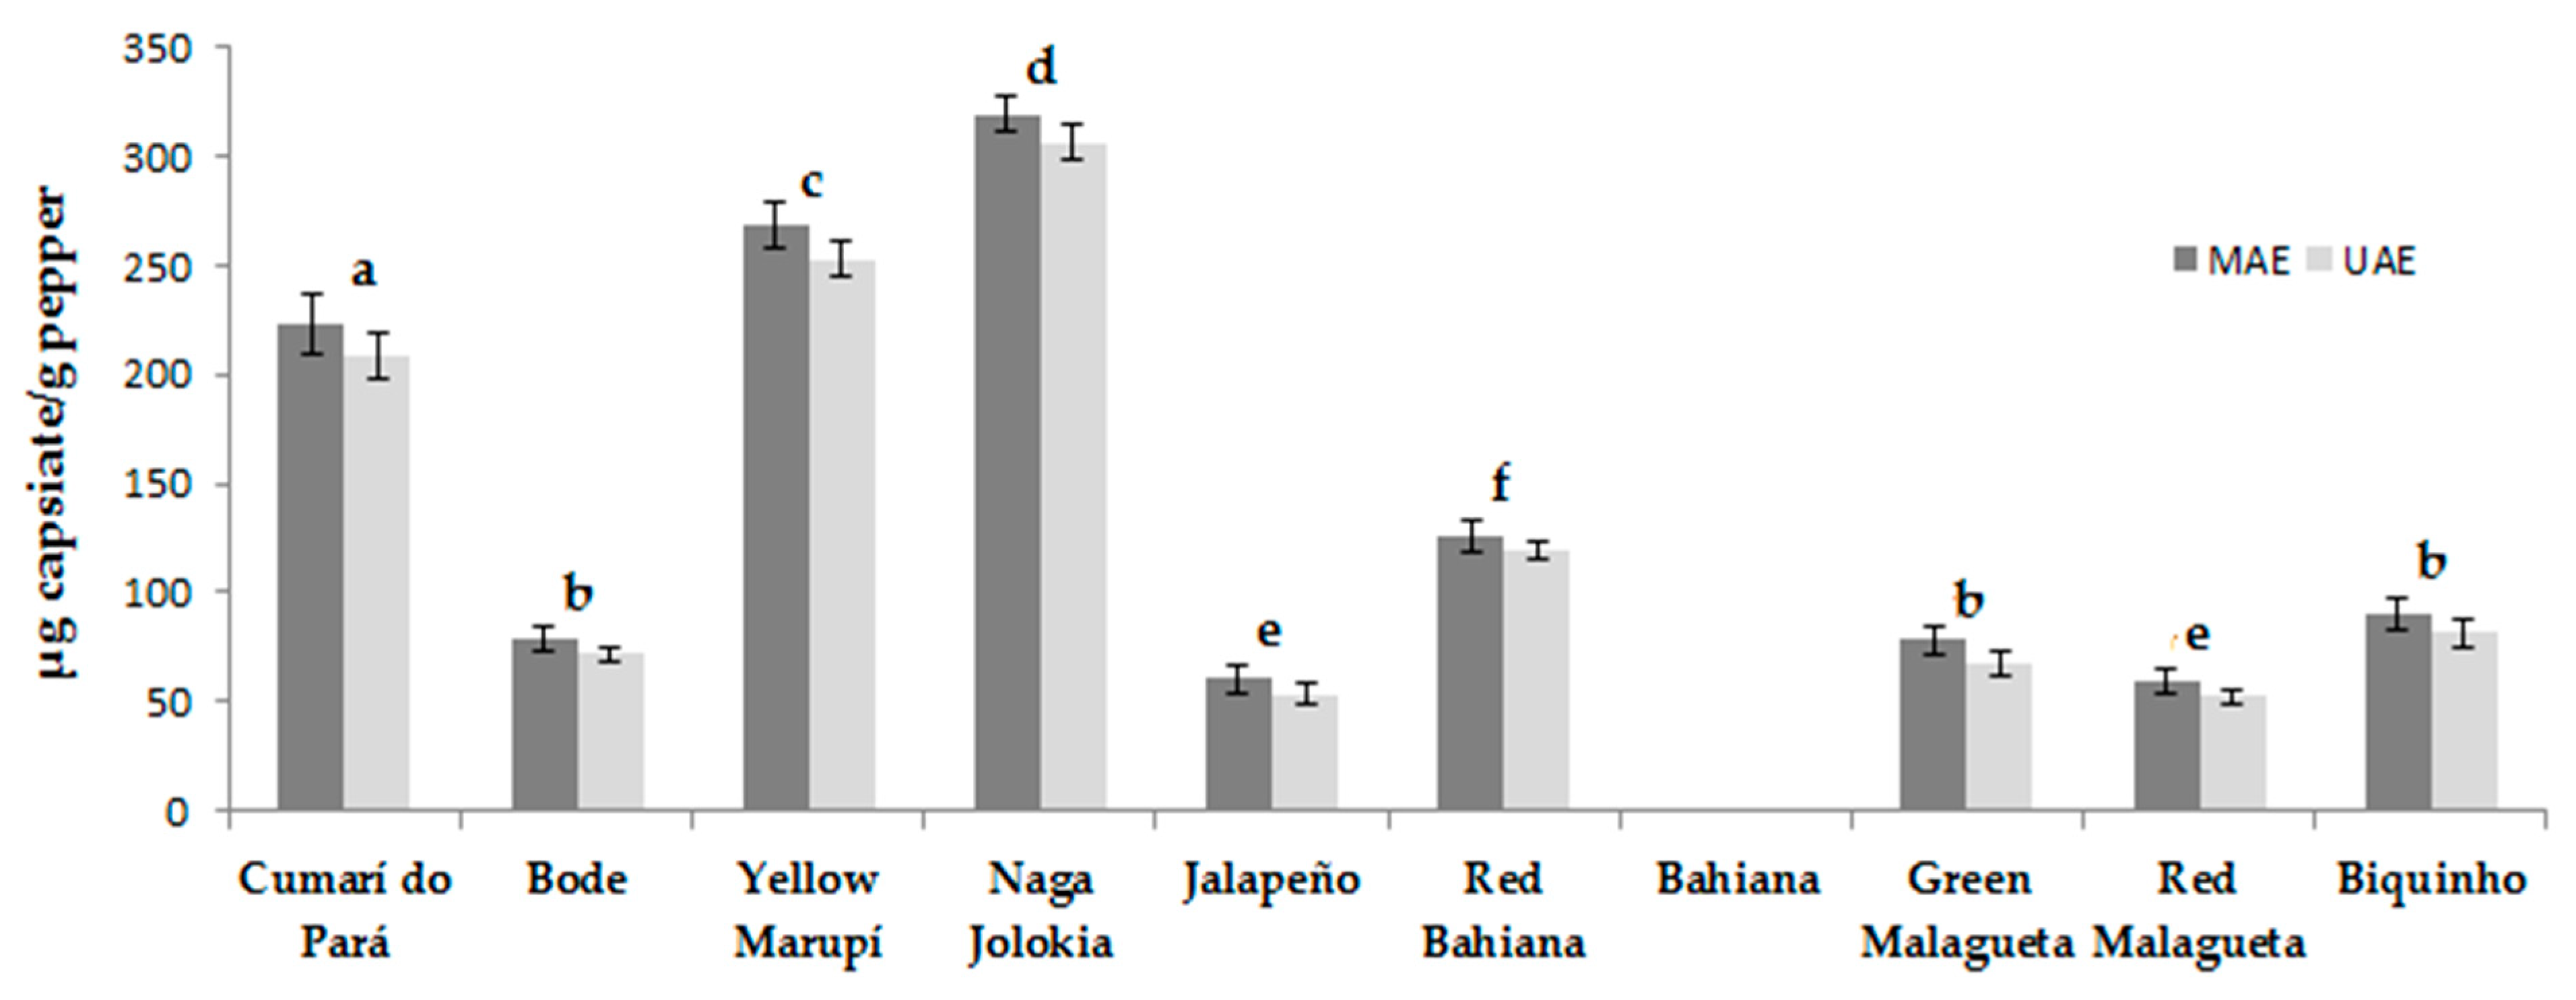
3.4. Real Samples Analysis

Once the optimal conditions for the extraction of capsinoids from peppers had been proposed, the developed method was tested on different pepper samples to verify the presence of these compounds and to quantify them. Lyophilized peppers were extracted in triplicate, then they were analyzed by UHPLC-DAD and the results can be seen in Figure 10.
The extraction method proved to be efficient for the extraction of capsinoids from different varieties of pepper. In addition, it was observed that the compounds of interest were present in both sweet (Biquinho), and spicy (Naga Jolokia or Malagueta) peppers varieties. Capsiate was found in most of the varieties studied, except for Bahiana, which was subjected to both extraction methods (UAE and MAE) without any success; i.e., no dihydrocapsiate was found by either method. Naga Jolokia was the variety of pepper with the greatest capsiate content, with extraction yields of 318.90 μg g−1 and 306.60 μg g−1 by MAE and UAE, respectively. Finally, it can be said that there were no significant differences between the capsiate extraction yields obtained by either extraction methods. However, visually it can be seen that a slightly larger amount of the compound of interest was extracted by the MAE method with respect to that of UAE.

3.5. Comparison between the Two Extraction Methods
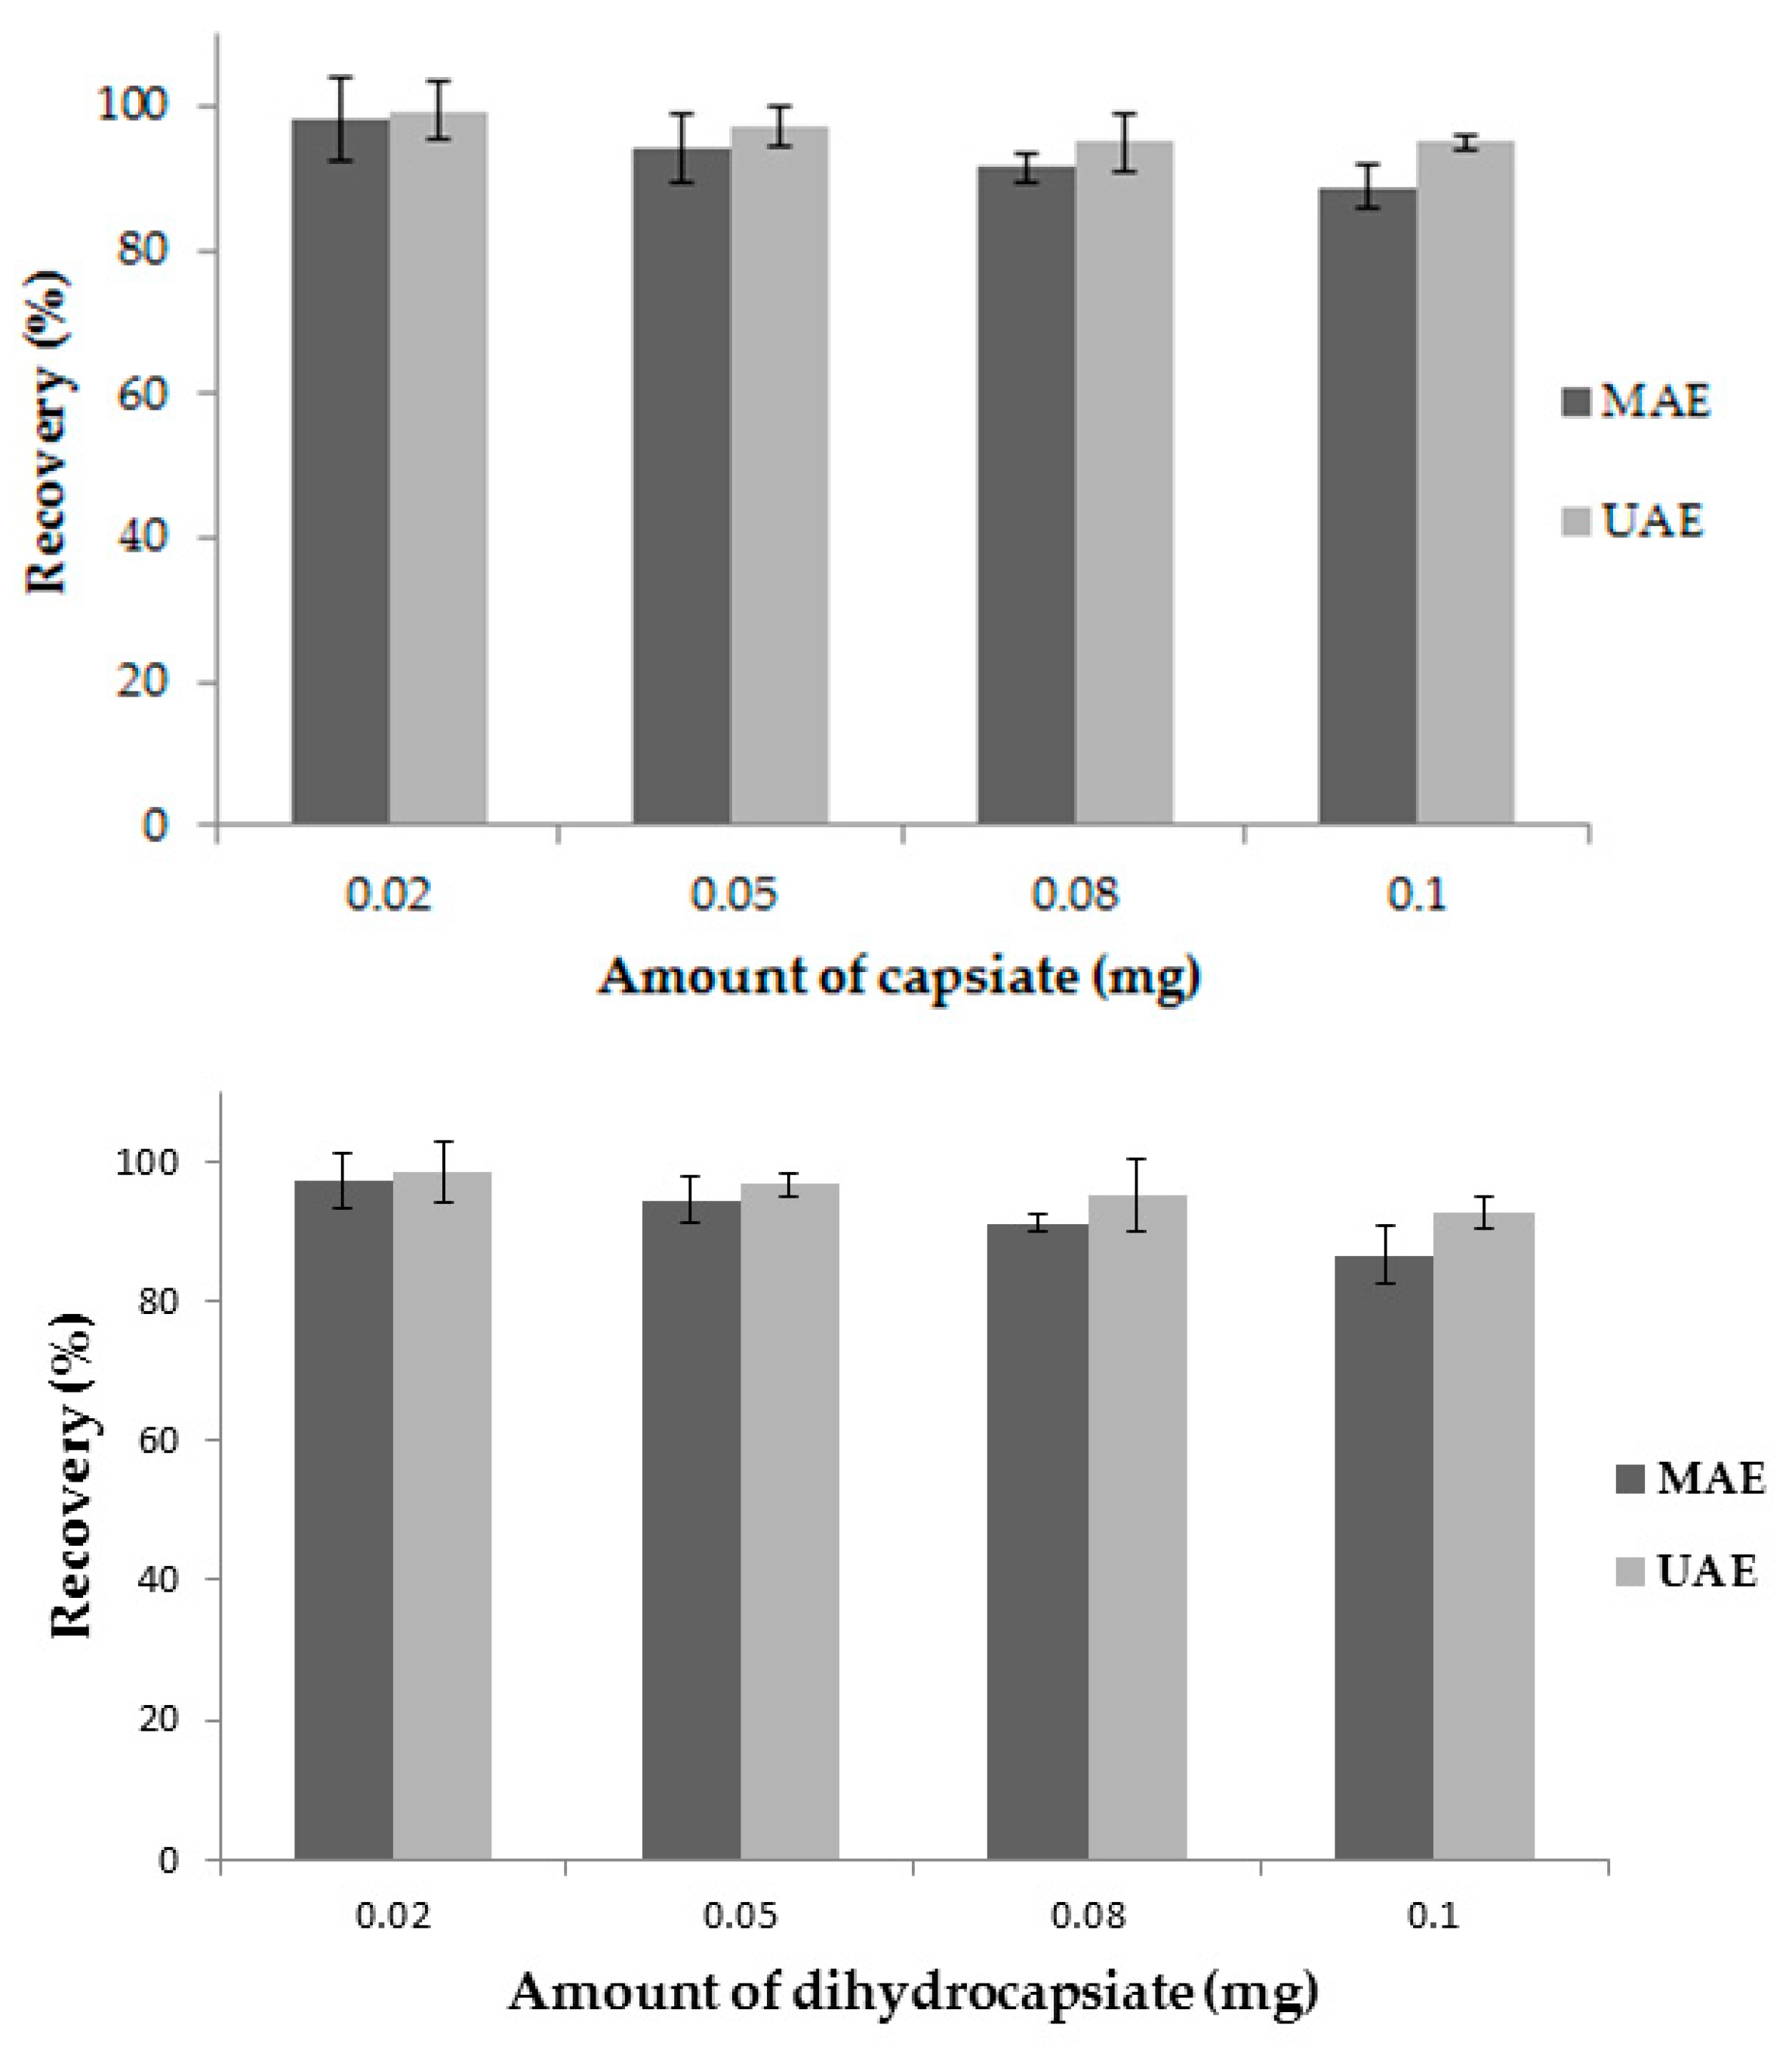
Once all the experiments had been completed and their results collected, a comparison of both methods was performed (Table 5).
In relation to the optimum solvent, it should be mentioned that for the UAE method, although the extraction time was lower, the already centrifuged extract had to be submitted to a process of solvent evaporation and to the subsequent redissolution of the compound of interest, since ethyl acetate cannot be introduced into the chromatographic equipment used. On the contrary, the MAE method did not require this additional procedure, which meant a considerable reduction in the overall time. However, in this technique, not only the extraction time must be taken into account, but also the time necessary to reach the desired temperature and cooling to room temperature. Nevertheless, it should be noted that a number from 8 to 40 samples can be introduced in the carousel and all of them can be extracted simultaneously, while in UAE, they have to be extracted individually.
None of the variables had a significant influence on the response in either method. Nevertheless, similar trends to extreme values were registered on determining their optimal values for both methods; i.e., minimum temperature and time, and maximum solvent volume and pH.
Finally, it was observed that, on average, a greater amount of capsiate was extracted by means of the MAE method, specifically 5.72% more, although its error margin and variability was also greater. On the other hand, the UAE method is easier to implement, requires a smaller initial investment on facilities and equipment and is more commonly available in most laboratories [51].
In conclusion, two effective methods for the extraction of capsinoids in peppers have been developed, since there were no specific methods for the study and extraction of this type of compounds. However, the extraction of other antioxidant compounds presents in peppers, such as capsaicinoids, phenolic compounds or carotenoids by both extraction techniques have been recently carried out [52,53,54].
A comparative study of capsinoids extraction between the methods reported in the literature and the proposed one has also been carried out (Table 6).
It can be observed that the values obtained by the proposed methods are in the same range as the ones found in literature. It is noteworthy to highlight that in this work a variety of peppers with a high content of capsiate has been used, as it can be seen in the results obtained (in the upper limit of the intervals).

3.6. Recovery Study

To demonstrate the efficiency of both extraction methods, a recovery study was performed. Firstly, extractions in the optimum conditions, both for UAE and MAE, were carried out in triplicate to obtain the capsiate and dihydrocapsiate concentration in the sample. Subsequently, after the addition of different amounts levels of both kind of compounds respectively (0.02–0.10 mg), new extractions were performed. Finally, the amount of the capsiate and dihydrocapsiate recovered in each of these additions was analyzed. The results obtained are shown in Figure 11.
It can be seen that there are no significant differences between ultrasound-assisted extraction and microwave-assisted extraction, being very close to 100%.

4. Conclusions

Based on the results obtained from the experiments that have been carried out, the mixture design of solvents and the surface response methodology have proven to be very important tools. It could be demonstrated that the two proposed extraction methods, UAE and MAE, are adequate, quick and effective for the extraction of capsinoids from peppers.
The optimal conditions for UAE were as follows: 5 min extraction time, 5.5 °C temperature, pH 8, and 0.2:14.5 g:mL of “ratio”, while in the case of MAE, the following best conditions were established: 5 min extraction time, 60 °C temperature, pH 8, and 0.2:15 g:mL “ratio”. Even though the studied variables (time, temperature, pH and ratio) do not have a statistically significant influence on the response, the same optimal conditions have been determined for both methods: minimum temperature and time, and maximum ratio and pH.
Both methods have exhibited a high precision level with coefficients of variation under 5%. Although no significant differences in the extraction yields of capsinoids from peppers were registered, slightly higher amount of the compounds of interest could be visually noticed when MAE was used. Finally, the developed methods were successfully applied to different varieties of peppers, both sweet and spicy, and a quantitative extraction of capsinoids was achieved.
Peppers are currently considered in the food processing industries due to their antimicrobial or antioxidant activities, contributed in part by capsinoids. In the future, these developed methods could be used to analyze which varieties of peppers have a greater amount of these chemical compounds and focus on their cultivation to achieve genetic improvements. In addition, these bioactive compounds come from natural ingredients which could enhance the health properties of the cosmetic and pharmaceutical products.

Supplementary Materials

The following are available online at https://www.mdpi.com/2073-4395/9/10/633/s1, Figure S1. UV–Vis chromatogram (λ = 280 nm) of the 2 major capsinoids present in peppers. Peak assignment: (1) Capsiate (CTO); (2) Dihydrocapsiate (DHCTO); Figure S2. Previous study to obtain the extraction conditions in the selection of the optimal extraction solvents; Table S1. Statistical Mixture Design of Simple Centroid Extended Model for ultrasound-assisted extraction; Table S2. Statistical Mixture Design of Simple Centroid Extended Model for microwave-assisted extraction; Table S3. Box–Behnken experimental design matrix with coded variables; Table S4. Study of the precision of the methods developed in terms of repeatability (1–10) and intermediate precision (1–30) for ultrasound-assisted extraction (UAE) and microwave-assisted extraction (MAE).

Author Contributions

Conceptualization, E.E.-B. and G.F.B.; methodology, M.V.-E.; software, M.F.-G.; formal analysis, M.V.-E. and A.V.G.d.P.; investigation, M.V.-E. and A.V.G.d.P.; resources, M.P. and C.G.B.; data curation, E.E.-B., M.F.-G. and G.F.B.; writing—original draft preparation, M.V.-E.; supervision, G.F.B. and E.E.-B.; project administration, G.F.B.

Funding

This research is part of the RTA2015-00042-C02-01 project funded by the National Institute for Agriculture and Food Research and Technology (INIA) and co-financed by the European Fund for Regional Development (FEDER) and it was also supported by V. La Andaluza and University of Cadiz (OT2016/046).

Acknowledgments

Authors are grateful to V. La Andaluza and University of Cadiz for the support provided through the project OT2016/046.

Conflicts of Interest

The authors declare no conflict of interest.

References

  1. Tripodi, P.; Cardi, T.; Bianchi, G.; Migliori, C.A.; Schiavi, M.; Rotino, G.L.; Lo Scalzo, R. Genetic and environmental factors underlying variation in yield performance and bioactive compound content of hot pepper varieties (Capsicum annuum) cultivated in two contrasting Italian locations. Eur. Food Res. Technol. 2018, 244, 1–13. [Google Scholar] [CrossRef]
  2. Olguin-Rojas, J.A.; Fayos, O.; Vázquez-León, L.A.; Ferreiro-González, M.; Rodríguez-Jimenes, G.C.; Palma, M.; Garcés-Claver, A.; Barbero, G.F. Progression of the total and individual capsaicinoids content in the fruits of three different cultivars of Capsicum chinense Jacq. Agronomy 2019, 9, 141. [Google Scholar] [CrossRef]
  3. Ananthan, R.; Subhash, K.; Longvah, T. Capsaicinoids, amino acid and fatty acid profiles in different fruit components of the world hottest Naga king chilli (Capsicum chinense Jacq). Food Chem. 2018, 238, 51–57. [Google Scholar] [CrossRef] [PubMed]
  4. Matsufuji, H.; Ishikawa, K.; Nunomura, O.; Chino, M.; Takeda, M. Anti-oxidant content of different coloured sweet peppers, white, green, yellow, orange and red (Capsicum annuum L.). Int. J. Food Sci. Technol. 2007, 42, 1482–1488. [Google Scholar] [CrossRef]
  5. Santos, P.; Aguiar, A.C.; Barbero, G.F.; Rezende, C.A.; Martínez, J. Supercritical carbon dioxide extraction of capsaicinoids from malagueta pepper (Capsicum frutescens L.) assisted by ultrasound. Ultrason. Sonochem. 2016, 22, 78–88. [Google Scholar] [CrossRef] [PubMed]
  6. Chapa-Oliver, A.M.; Mejía-Teniente, L. Capsaicin: From plants to a cancer-suppressing agent. Molecules 2016, 21, 931. [Google Scholar] [CrossRef]
  7. Giuffrida, D.; Dugo, P.; Torre, G.; Bignardi, C.; Cavazza, A.; Corradini, C.; Dugo, G. Characterization of 12 Capsicum varieties by evaluation of their carotenoid profile and pungency determination. Food Chem. 2013, 140, 794–802. [Google Scholar] [CrossRef] [PubMed]
  8. Bogusz, S., Jr.; Libardi, S.H.; Dias, F.F.G.; Coutinho, J.P.; Bochi, V.C.; Rodrigues, D.; Melo, A.M.Y.; Godoy, H.T. Brazilian Capsicum peppers: Capsaicinoid content and antioxidant activity. J. Sci. Food Agric. 2018, 98, 217–224. [Google Scholar] [CrossRef]
  9. Ludy, M.J.; Moore, G.E.; Mattes, R.D. The effects of capsaicin and capsiate on energy balance: Critical review and meta-analyses of studies in humans. Chem. Senses 2012, 37, 103–121. [Google Scholar] [CrossRef]
  10. Trbojević Ivić, J.; Milosavic, N.; Dimitrijevic, A.; Gavrovic Jankulovic, M.; Bezbradica, D.; Kolaski, D.; Velickovic, D. Synthesis of medium-chain length capsinoids from coconut oil catalyzed by Candida rugosa lipases. Food Chem. 2017, 218, 505–508. [Google Scholar] [CrossRef] [Green Version]
  11. Fayos, O.; Savirón, M.; Orduna, J.; Barbero, G.F.; Mallor, C.; Garcés-Claver, A. Quantitation of capsiate and dihydrocapsiate and tentative identification of minor capsinoids in pepper fruits (Capsicum spp.) by HPLC-ESI-MS/MS(QTOF). Food Chem. 2019, 270, 264–272. [Google Scholar] [CrossRef] [PubMed]
  12. De Aguiar, A.C.; da Fonseca Machado, A.P.; Figueiredo Angolini, C.F.; Rodrigues de Morais, D.; Baseggio, A.M.; Eberlin, M.N.; Maróstica Junior, M.R.; Martínez, J. Sequential high-pressure extraction to obtain capsinoids and phenolic compounds from biquinho pepper (Capsicum chinense). J. Supercrit. Fluids 2019, 150, 112–121. [Google Scholar] [CrossRef]
  13. Rosa, A.; Deiana, M.; Casu, V.; Paccagnini, S.; Appendino, G.; Ballero, M.; Dessi, A. Antioxidant activity of capsinoids. J. Agric. Food Chem. 2002, 50, 7396–7401. [Google Scholar] [CrossRef] [PubMed]
  14. Sutoh, K.; Kobata, K.; Yazawa, S.; Watanabe, T. Capsinoid is biosynthesized from phenylalanine and valine in a non-pungent pepper, Capsicum annuum L. cv. CH-19 Sweet. Biosci. Biotechnol. Biochem. 2006, 70, 1513–1516. [Google Scholar] [CrossRef] [PubMed]
  15. Swint, J.M.; Beining, K.M.; Bryant, J.A.; Tucker, R.M.; Ludy, M.J. Comparison of capsaicin and capsiate’s effects at a meal. Chemosens. Percept. 2015, 8, 174–182. [Google Scholar] [CrossRef]
  16. Chemat, F.; Rombaut, N.; Meullemiestre, A.; Turk, M.; Perino, S.; Fabiano-Tixier, A.S.; Abert-Vian, M. Review of Green Food Processing techniques. Preservation, transformation, and extraction. Innov. Food Sci. Emerg. Technol. 2017, 41, 357–377. [Google Scholar] [CrossRef]
  17. Castejón, N.; Luna, P.; Señoráns, F.J. Alternative oil extraction methods from Echium plantagineum L. seeds using advanced techniques and green solvents. Food Chem. 2018, 244, 75–82. [Google Scholar] [CrossRef]
  18. Wen, C.; Zhang, J.; Zhang, H.; Dzah, C.S.; Zandile, M.; Duan, Y.; Ma, H.; Luo, X. Advances in ultrasound assisted extraction of bioactive compounds from cash crops–A review. Ultrason. Sonochem. 2018, 48, 538–549. [Google Scholar] [CrossRef]
  19. Esclapez, M.D.; García-Pérez, J.V.; Mulet, A.; Cárcel, J.A. Ultrasound-assisted extraction of natural products. Food Eng. Rev. 2011, 3, 108–120. [Google Scholar] [CrossRef]
  20. Espada-Bellido, E.; Ferreiro-González, M.; Carrera, C.; Palma, M.; Barroso, C.G.; Barbero, G.F. Optimization of the ultrasound-assisted extraction of anthocyanins and total phenolic compounds in mulberry (Morus nigra) pulp. Food Chem. 2017, 219, 23–32. [Google Scholar] [CrossRef]
  21. Riciputi, Y.; Diaz-de-Cerio, E.; Akyol, H.; Capanoglu, E.; Cerretani, L.; Caboni, M.F.; Verardo, V. Establishment of ultrasound-assisted extraction of phenolic compounds from industrial potato by-products using response surface methodology. Food Chem. 2018, 269, 258–263. [Google Scholar] [CrossRef] [PubMed]
  22. Böger, B.R.; Salviato, A.; Valezi, D.F.; Di Mauro, E.; Georgetti, S.R.; Kurozawa, L.E. Optimization of ultrasound-assisted extraction of grape-seed oil to enhance process yield and minimize free radical formation. J. Sci. Food Agric. 2018, 98, 5019–5026. [Google Scholar] [CrossRef] [PubMed]
  23. Wang, T.; Guo, N.; Wang, S.X.; Kou, P.; Zhao, C.J.; Fu, Y.J. Ultrasound-negative pressure cavitation extraction of phenolic compounds from blueberry leaves and evaluation of its DPPH radical scavenging activity. Food Bioprod. Process. 2018, 108, 69–80. [Google Scholar] [CrossRef]
  24. Routray, W.; Orsat, V. Microwave-assisted extraction of flavonoids: A review. Food Bioprocess Technol. 2012, 5, 409–424. [Google Scholar] [CrossRef]
  25. Chan, C.H.; Yusoff, R.; Ngoh, G.C.; Kung, F.W.L. Microwave-assisted extractions of active ingredients from plants. J. Chromatogr. A 2011, 1218, 6213–6225. [Google Scholar] [CrossRef]
  26. Kazemi, M.; Khodaiyan, F.; Labbafi, M.; Saeid Hosseini, S.; Hojjati, M. Pistachio green hull pectin: Optimization of microwave-assisted extraction and evaluation of its physicochemical, structural and functional properties. Food Chem. 2019, 271, 663–672. [Google Scholar] [CrossRef] [PubMed]
  27. Pinela, J.; Prieto, M.A.; Carvalho, A.M.; Barreiro, M.F.; Oliveira, M.B.P.P.; Barros, L.; Ferreira, I.C.F.R. Microwave-assisted extraction of phenolic acids and flavonoids and production of antioxidant ingredients from tomato: A nutraceutical-oriented optimization study. Sep. Purif. Technol. 2016, 164, 114–124. [Google Scholar] [CrossRef] [Green Version]
  28. Akhbari, M.; Masoum, S.; Aghababaei, F.; Hamedi, S. Optimization of microwave assisted extraction of essential oils from Iranian Rosmarinus officinalis L. using RSM. J. Food Sci. Technol. 2018, 55, 2197–2207. [Google Scholar] [CrossRef]
  29. Koyu, H.; Kazan, A.; Demir, S.; Haznedaroglu, M.Z.; Yesil-Celiktas, O. Optimization of microwave assisted extraction of Morus nigra L. fruits maximizing tyrosinase inhibitory activity with isolation of bioactive constituents. Food Chem. 2018, 248, 183–191. [Google Scholar] [CrossRef]
  30. Covarrubias-Cárdenas, A.G.; Martínez-Castillo, J.I.; Medina-Torres, N.; Ayora-Talavera, T.; Espinosa-Andrews, H.; García-Cruz, N.U.; Pacheco, N. Antioxidant capacity and UPLC-PDA ESI-MS phenolic profile of Stevia rebaudiana dry powder extracts obtained by ultrasound assisted extraction. Agronomy 2018, 8, 170. [Google Scholar] [CrossRef]
  31. Barbero, G.F.; Palma, M.; Barroso, C.G. Determination of capsaicinoids in peppers by microwave-assisted extraction-high-performance liquid chromatography with fluorescence detection. Anal. Chim. Acta 2006, 578, 227–233. [Google Scholar] [CrossRef] [PubMed]
  32. Barbero, G.F.; Liazid, A.; Palma, M.; Barroso, C.G. Ultrasound-assisted extraction of capsaicinoids from peppers. Talanta 2008, 75, 1332–1337. [Google Scholar] [CrossRef] [PubMed]
  33. Boonkird, S.; Phisalaphong, C.; Phisalaphong, M. Ultrasound-assisted extraction of capsaicinoids from Capsicum frutescens on a lab and pilot-plant scale. Ultrason. Sonochem. 2008, 15, 1075–1079. [Google Scholar] [CrossRef] [PubMed]
  34. Singh, S.; Jarret, R.; Russo, V.; Majetich, G.; Shimkus, J.; Bushway, R.; Perkins, B. Determination of capsinoids by HPLC-DAD in Capsicum species. J. Agric. Food Chem. 2009, 57, 3452–3457. [Google Scholar] [CrossRef] [PubMed]
  35. Ferreira, S.L.C.; Junior, M.M.S.; Felix, C.S.A.; da Silva, D.L.F.; Santos, A.S.; Santos Neto, J.H.; de Souza, C.T.; Cruz Junior, R.A.; Souza, A.S. Multivariate optimization techniques in food analysis–A review. Food Chem. 2019, 273, 3–8. [Google Scholar] [CrossRef] [PubMed]
  36. Garcia, L.M.Z.; de Oliveira, T.F.; Soares, P.K.; Bruns, R.E.; Scarminio, I.S. Statistical mixture design-Principal component determination of synergic solvent interactions for natural product extractions. Chemom. Intell. Lab. Syst. 2010, 103, 1–7. [Google Scholar] [CrossRef]
  37. Aliaño-González, M.J.; Ferreiro-González, M.; Espada-Bellido, E.; Palma, M.; Barbero, G.F. A screening method based on headspace-ion mobility spectrometry to identify adulterated honey. Sensors 2019, 19, 1621. [Google Scholar] [CrossRef] [PubMed]
  38. Ghoneim, S.S.M.; Dessouky, S.S.; Elfaraskoury, A.A.; Abou Sharaf, A.B. Modelling and experimental verification of barrier effect on breakdown voltage of transformer oil using Box-Behnken Design. Measurement 2019, 147, 106829. [Google Scholar] [CrossRef]
  39. Iida, T.; Moriyama, T.; Kobata, K.; Morita, A.; Murayama, N.; Hashizune, S.; Fushiki, T.; Yazawa, S.; Watanabe, T.; Tominaga, M. TRPV1 activation and induction of nociceptive response by a non-pungent capsaicin-like compound, capsiate. Neuropharmacology 2003, 44, 958–967. [Google Scholar] [CrossRef]
  40. Barbero, G.F.; Molinillo, J.M.G.; Varela, R.M.; Palma, M.; MacÍas, F.A.; Barroso, C.G. Application of Hansch’s Model to capsaicinoids and capsinoids: A study using the quantitative structure-activity relationship. A novel method for the synthesis of capsinoids. J. Agric. Food Chem. 2010, 58, 3342–3349. [Google Scholar] [CrossRef]
  41. Vázquez-Espinosa, M.; Espada-Bellido, E.; González-de-Peredo, A.V.; Ferreiro-González, M.; Carrera, C.; Palma, M.; Barroso, C.G.; Barbero, G.F. Optimization of microwave-assisted extraction for the recovery of bioactive compounds from the Chilean superfruit (Aristotelia chilensis (Mol.) Stuntz). Agronomy 2018, 8, 240. [Google Scholar] [CrossRef]
  42. Samuel, S.M.; Abigail, M.E.A.; Chidambaram, R. Isotherm modelling, kinetic study and optimization of batch parameters using response surface methodology for effective removal of Cr (VI) using fungal biomass. PLoS ONE 2015, 10, e0116884. [Google Scholar] [CrossRef] [PubMed]
  43. Chan, K.K.; Bin Hamid, M.S.; Webster, R.D. Quantification of capsaicinoids in chillies by solid-phase extraction coupled with voltammetry. Food Chem. 2018, 265, 152–158. [Google Scholar] [CrossRef] [PubMed]
  44. De Aguiar, A.C.; dos Santos, P.; Coutinho, J.P.; Barbero, G.F.; Godoy, H.T.; Martínez, J. Supercritical fluid extraction and low pressure extraction of Biquinho pepper (Capsicum chinense). J. Food Sci. Technol. 2014, 59, 1239–1246. [Google Scholar] [CrossRef]
  45. Lang, Y.; Kisaka, H.; Sugiyama, R.; Nomura, K.; Morita, A.; Watanabe, T.; Tanaka, Y.; Yazawa, S.; Miwa, T. Functional loss of pAMT results in biosynthesis of capsinoids, capsaicinoid analogs, in Capsicum annuum cv. CH-19 Sweet. Plant J. 2009, 59, 953–961. [Google Scholar] [CrossRef] [PubMed]
  46. Medina-Torres, N.; Ayora-Talavera, T.; Espinosa-Andrews, H.; Sánchez-Contreras, A.; Pacheco, N. Ultrasound assisted extraction for the recovery of phenolic compounds from vegetable sources. Agronomy 2017, 7, 47. [Google Scholar] [CrossRef]
  47. Vázquez-Espinosa, M.; González-de-Peredo, A.V.; Ferreiro-González, M.; Carrera, C.; Palma, M.; Barbero, G.F.; Espada-Bellido, E. Assessment of ultrasound assisted extraction as an alternative method for the extraction of anthocyanins and total phenolic compounds from Maqui berries (Aristotelia chilensis (Mol.) Stuntz). Agronomy 2019, 9, 148. [Google Scholar] [CrossRef]
  48. Ohyama, K.; Nogusa, Y.; Shinoda, K.; Suzuki, K.; Bannai, M.; Kajimura, S. A synergistic antiobesity effect by a combination of capsinoids and cold temperature through promoting beige adipocyte biogenesis. Diabetes 2016, 65, 1410–1423. [Google Scholar] [CrossRef]
  49. Kumar, M.; Dahuja, A.; Sachdev, A.; Kaur, C. Valorisation of black carrot pomace: Microwave assisted extraction of bioactive phytoceuticals and antioxidant activity using Box–Behnken design. J. Food Sci. Technol. 2019, 56, 995–1007. [Google Scholar] [CrossRef]
  50. González-de-Peredo, A.V.; Vázquez-Espinosa, M.; Espada-Bellido, E.; Ferreiro-González, M.; Amores-Arrocha, A.; Palma, M.; Barbero, G.F.; Jiménez-Cantizano, A. Alternative ultrasound-assisted method for the extraction of the bioactive compounds present in myrtle (Myrtus communis L.). Molecules 2019, 24, 882. [Google Scholar] [CrossRef]
  51. Zhang, H.; Birch, J.; Xie, C.; Yang, H.; Bekhit, A.E. Optimization of ultrasound assisted extraction method for phytochemical compounds and in-vitro antioxidant activity of New Zealand and China Asparagus cultivars (officinalis L.) roots extracts. Food Chem. 2019, 294, 276–284. [Google Scholar] [CrossRef] [PubMed]
  52. Civan, M.; Kumcuoglu, S. Green ultrasound-assisted extraction of carotenoid and capsaicinoid from the pulp of hot pepper paste based on the bio-refinery concept. J. Food Sci. Technol. 2019, 113, 108320. [Google Scholar] [CrossRef]
  53. Baiao Dias, A.L.; Arroio Sergio, C.S.; Santos, P.; Barbero, G.F.; Rezende, C.A.; Martínez, J. Effect of ultrasound on the supercritical CO2 extraction of bioactive compounds from dedo moça pepper (Capsicum baccatum L. var. pendulum). Ultrason. Sonochem. 2016, 31, 284–294. [Google Scholar] [CrossRef] [PubMed]
  54. Gorgani, L.; Mohammadi, M.; Najafpou, G.; Nikzad, M. Sequential microwave-ultrasound-assisted extraction for isolation of Piperine from Black Pepper (Piper nigrum L.). Food Bioprocess Technol. 2017, 10, 2199–2207. [Google Scholar] [CrossRef]
  55. Zunun-Pérez, A.Y.; Guevara-Figueroa, T.; Jimenez-Garcia, S.N.; Feregrino-Pérez, A.A.; Gautier, F.; Guevara-González, R.G. Effect of foliar application of salicylic acid, hydrogen peroxide and a xyloglucan oligosaccharide on capsiate content and gene expression associated with capsinoids synthesis in Capsicum annuum L. J. Biosci. 2017, 42, 245–250. [Google Scholar] [CrossRef]
Figure 1. Chemical structures of capsaicinoids (A) and capsinoids (B).
Agronomy 09 00633 g001
Figure 2. Capsiate concentration (μg capsiate/g pepper) obtained with different individual solvents by ultrasound-assisted extraction (UAE). The use of different letters indicates that there is a significant difference according to Tukey’s test (p < 0.05).
Agronomy 09 00633 g002
Figure 3. Mixture design diagram obtained by ultrasound-assisted extraction.
Agronomy 09 00633 g003
Figure 4. Capsiate concentration (μg capsiate/g pepper) with different individual solvents by microwave-assisted extraction (MAE). The use of different letters indicates that there is a significant difference according to Tukey’s test (p < 0.05).
Agronomy 09 00633 g004
Figure 5. Mixture design diagram obtained by microwave-assisted extraction.
Agronomy 09 00633 g005
Figure 6. Pareto standardized diagram obtained by ultrasound-assisted extraction.
Agronomy 09 00633 g006
Figure 7. Capsiate concentration (μg capsiate/g peppers) in relation to the extraction time obtained by ultrasound-assisted extraction. The use of different letters indicates that there is a significant difference according to Tukey’s test (p < 0.05).
Agronomy 09 00633 g007
Figure 8. Pareto standardized diagram obtained by microwave-assisted extraction.
Agronomy 09 00633 g008
Figure 9. Capsiate concentration (μg capsiate/g peppers) in relation to the extraction time obtained by microwave-assisted extraction. The use of different letters indicates that there is a significant difference according to Tukey’s test (p < 0.05).
Agronomy 09 00633 g009
Figure 10. Capsiate extraction from real pepper samples (n = 3). The use of different letters indicates that there is a significant difference according to Tukey’s test (p < 0.05).
Agronomy 09 00633 g010
Figure 11. Recovery study for ultrasound-assisted extraction (UAE) and microwave-assisted extraction (MAE) (n = 3). (A) Capsiate extraction; (B) Dihydrocapsiate extraction.
Agronomy 09 00633 g011
Table 1. Analysis of variance (ANOVA) of the mathematical models of the statistical mixture design obtained by ultrasound-assisted extraction.
Mathematical Modelp-ValueR2 Coefficient (%)F-Value
UAELinear0.75797.61590.29
Quadratic0.005196.539222.32
Cubic0.025096.714614.72
Table 2. Analysis of variance (ANOVA) of the mathematical models of the statistical mixture design obtained by microwave-assisted extraction.
Mathematical Modelp-ValueR2 Coefficient (%)F-Value
MAELinear0.385123.86501.10
Quadratic0.253871.89572.05
Cubic0.329978.62851.84
Table 3. Analysis of variance (ANOVA) for the Box–Behnken experimental design (BBD) experiment design obtained by ultrasound-assisted extraction.
SourceDegrees of FreedomSum of SquaresMean SquareF-Valuep-ValueCoefficient
A: Time19.909.900.020.8777−0.9086
B: Temperature11689.521689.524.220.0625−11.8656
C: pH187.9987.990.220.6478−2.7079
D: Ratio13059.833059.837.630.017215.9683
AA1155.11155.110.390.54555.3928
AB1775.61775.611.940.189413.9249
AC14.714.710.010.9155−1.0849
AD1380.88380.880.950.34899.7581
BB1922.46922.462.300.155113.1515
BC11166.591166.592.910.1137−17.0777
BD1677.18677.181.690.2181−13.0114
CC1142.12142.120.350.56265.1621
CD1207.96207.960.520.48517.2104
DD1341.03341.030.850.3745−7.9964
Residual124809.17400.76
Total2614881.40
Table 4. Analysis of variance (ANOVA) for the BBD experiment design obtained by microwave-assisted extraction.
SourceDegrees of FreedomSum of SquaresMean SquareF-Valuep-ValueCoefficient
A: Time16647.486647.482.380.1489−23.5363
B: Temperature174.4274.420.030.87312.4904
C: pH15.665.660.000.96480.6871
D: Ratio11838.721838.720.660.433012.3785
AA1308.46308.460.110.7454−7.6050
AB1129.49129.490.050.83315.6896
AC176.5776.570.030.8713−4.3752
AD138.2938.290.010.90873.0938
BB11122.191122.190.400.5381−14.5056
BC143.9343.930.020.9023−3.3138
BD1454.39454.390.160.6938−10.6582
CC1251.40251.400.090.76936.8656
CD12621.092621.090.940.351825.5983
DD1377.87377.870.140.7194−8.4173
Residual1233,520.902793.41
Total2647,794.30
Table 5. Comparison of optimal extraction conditions of both developed methods.
Optimal solventMost Influential FactorOptimal TimeAverage Amount of Capsiate Extracted (n = 3)
UAE42% methanol + 58% ethyl acetateRatio2 min1323.68 ± 32.30 μg g−1
MAE100% methanol-5 min1403.98 ± 39.94 μg g−1
Table 6. Comparative summary between the methods reported in the literature and the proposed one.
Extraction MethodCapsiate Concentration (μg/g)Solvent UsedReferences
Maceration11–369Acetonitrile[34]
Sonication540–1310Acetonitrile[55]
Shaking1.21–544.59Ethyl acetate[11]
UAE150–250Ethanol, acetone, hexane, methanol[44]
UAE1323.68Methanol + ethyl acetateThis work
MAE1403.98Methanol

