Relationships between Plant Architecture Traits and Cotton Yield within the Plant Height Range of 80–120 cm Desired for Mechanical Harvesting in the Yellow River Valley of China

Abstract
:1. Introduction
2. Materials and Methods
Statistical Analysis
3. Results
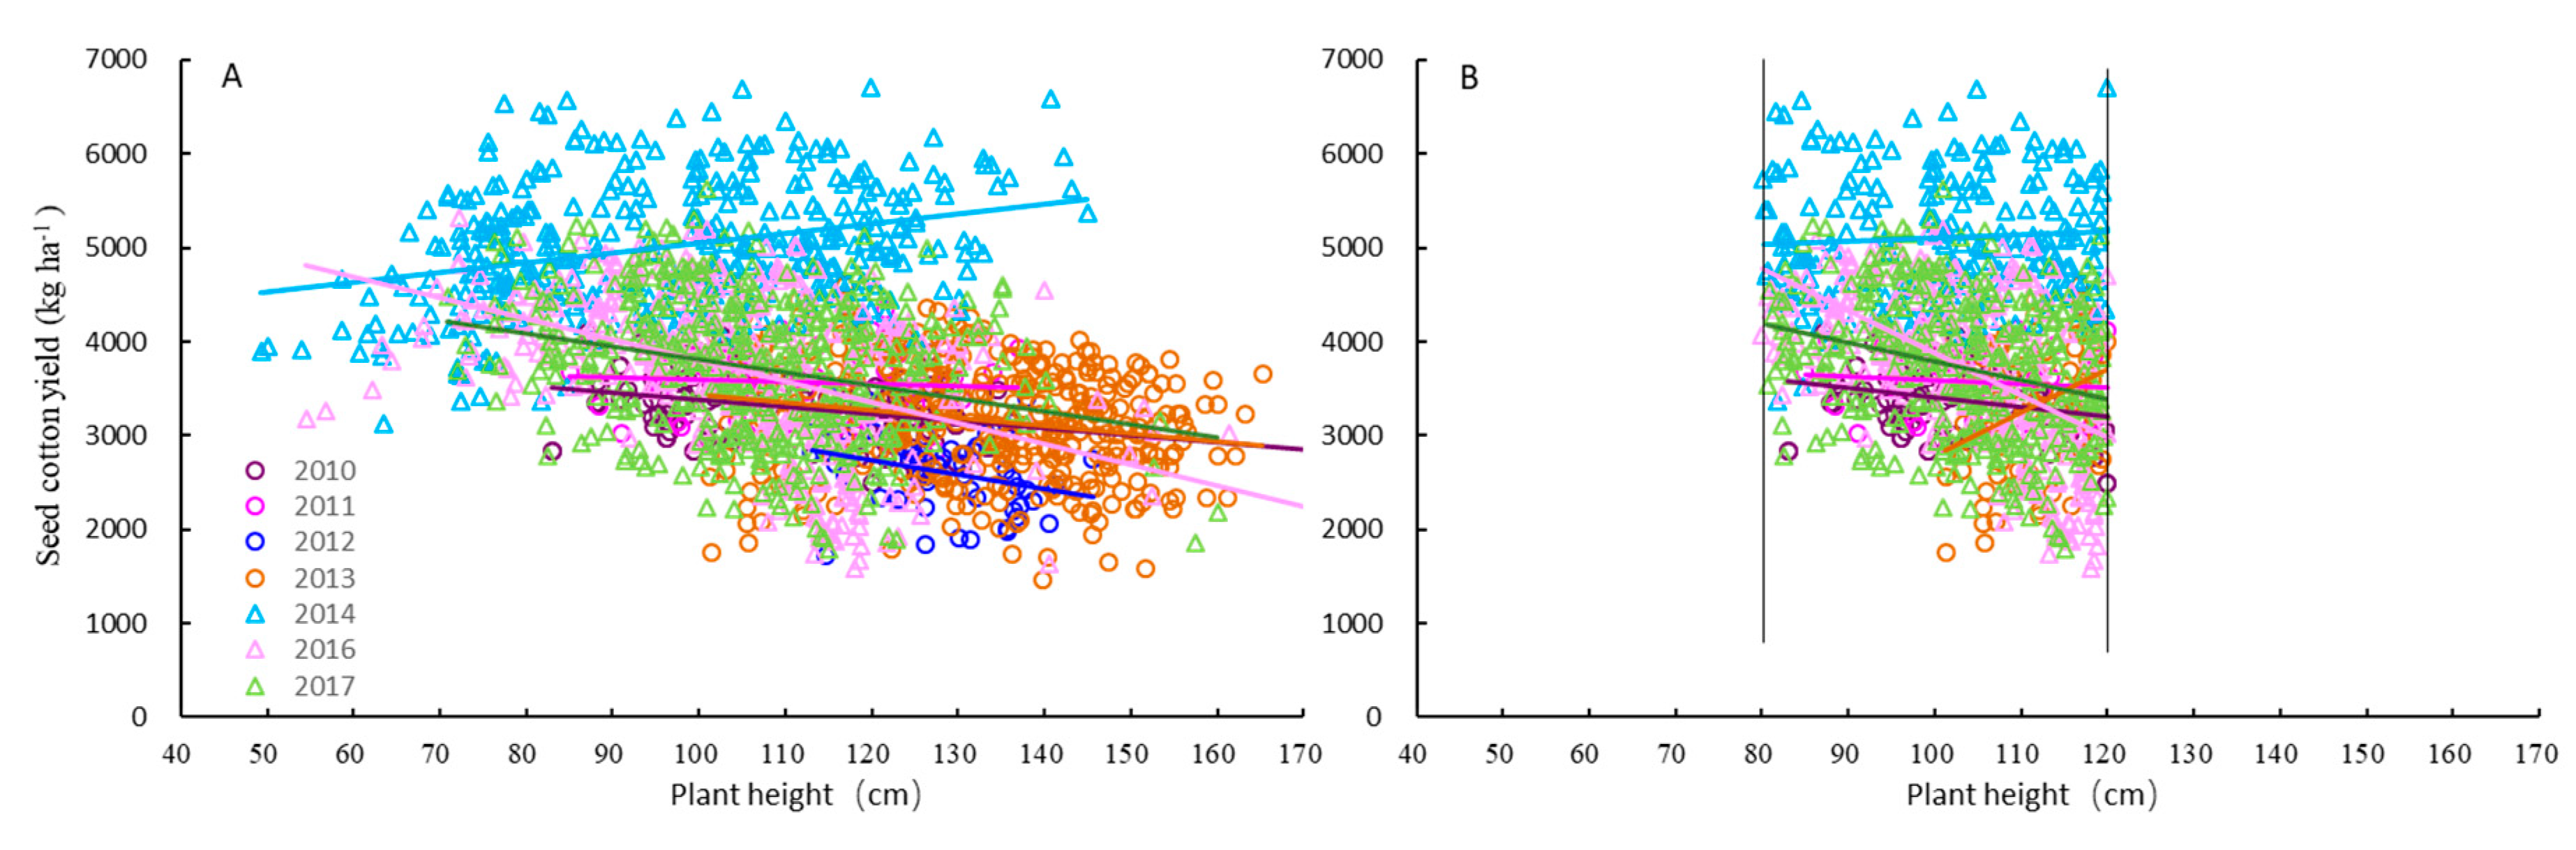
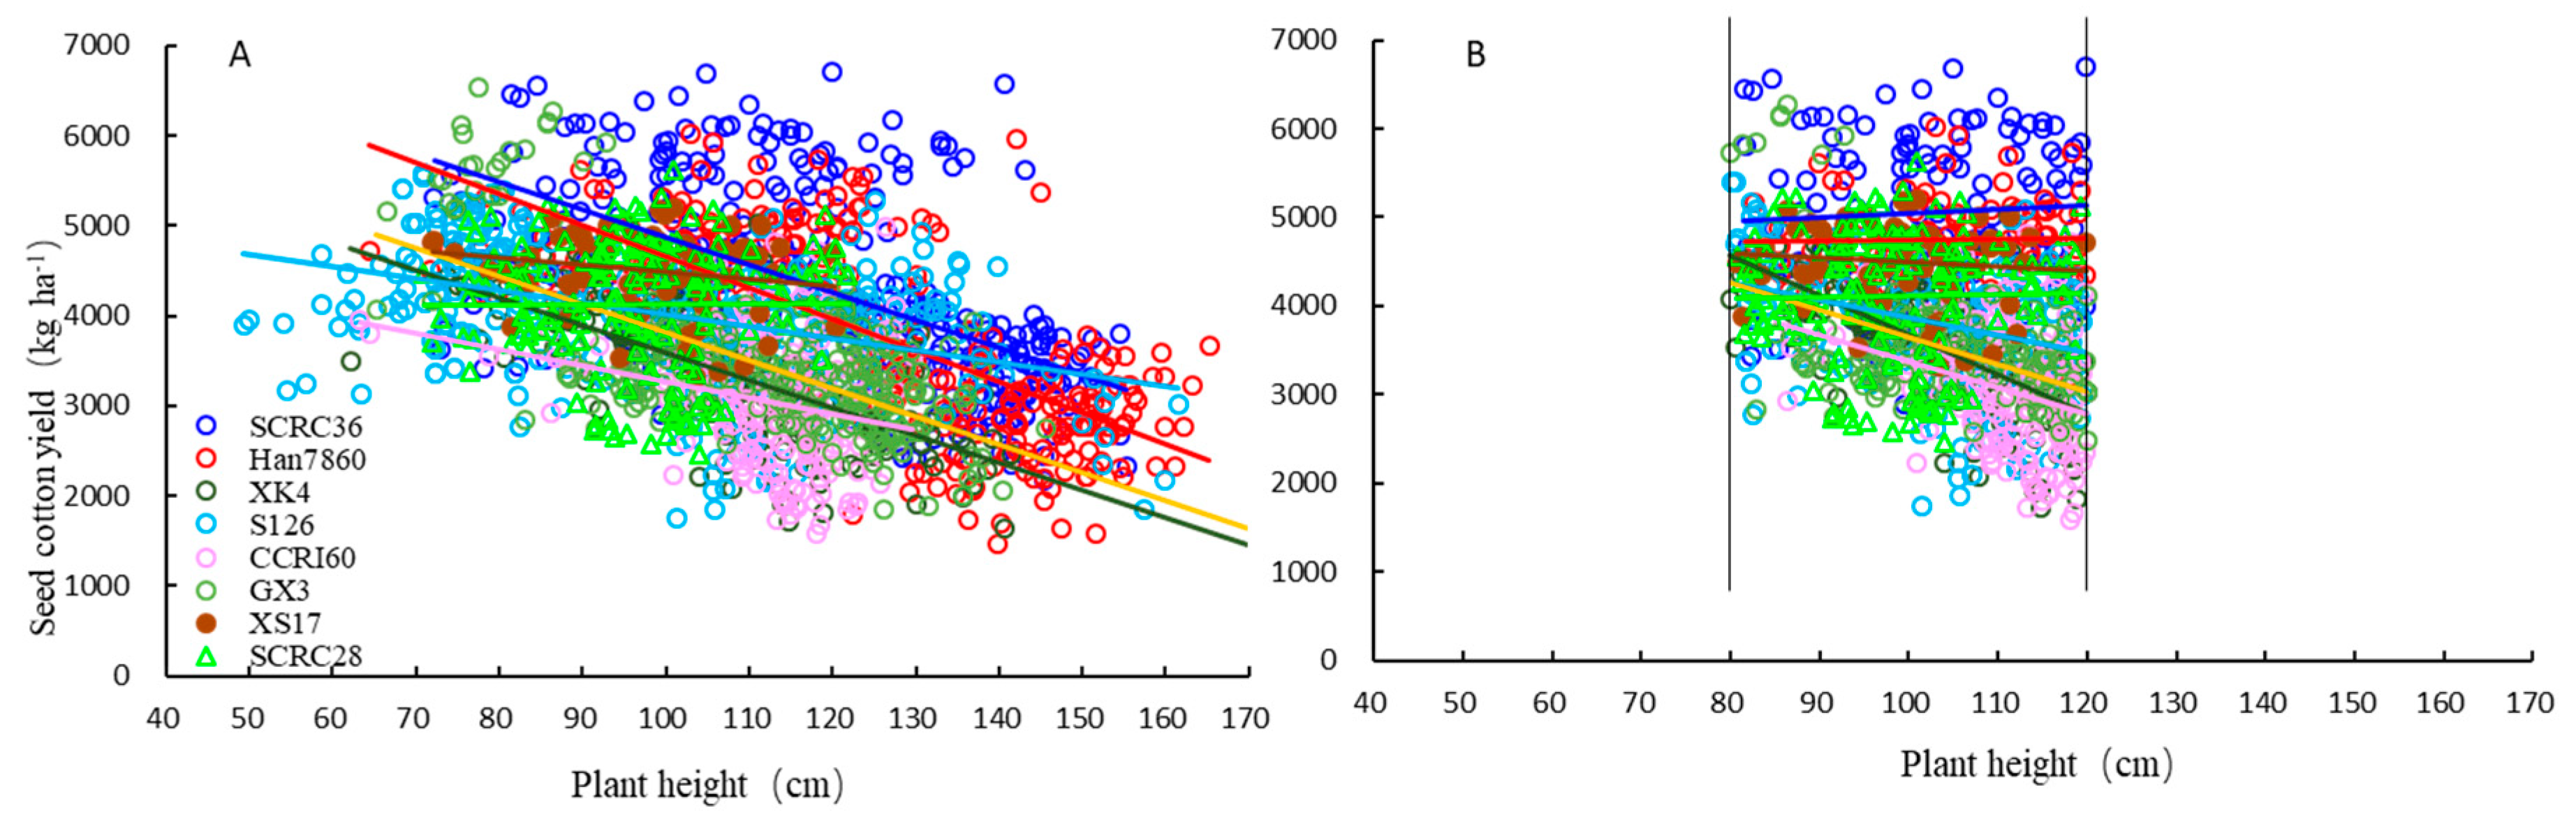
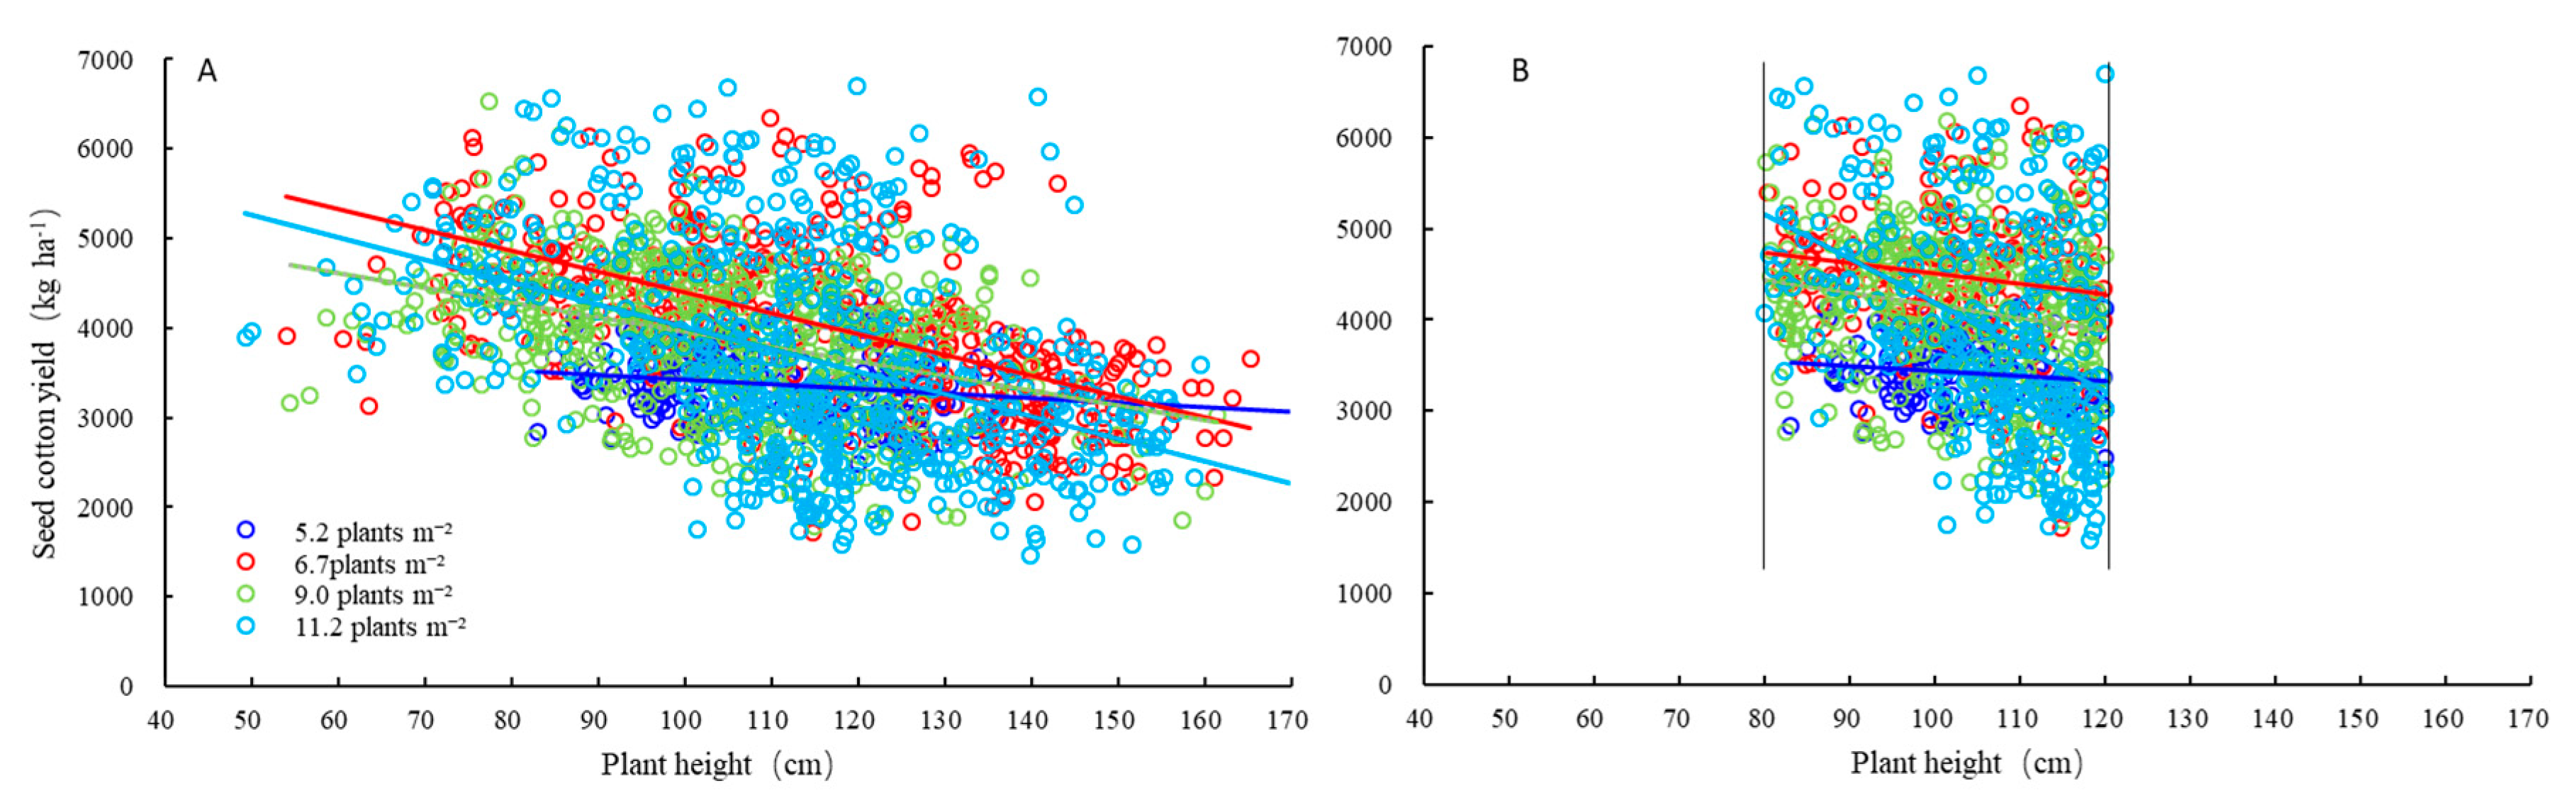
3.1. Correlation between Plant Height and Seed Cotton Yield
3.2. Stepwise Regression between Plant Architecture Traits and Seed Cotton Yield
4. Discussion
4.1. Correlation between Plant Height and Seed Cotton Yield Varied among Years, Cultivars, Plant Densities and MC Application
4.2. Plant Architecture Attributes (Except Plant Height) Impacting Seed Cotton Yield
5. Conclusions
Author Contributions
Funding
Acknowledgments
Conflicts of Interest
References
- Reinhard, D.; Kuhlemeier, C. Plant architecture. EMBO Rep. 2002, 3, 846–851. [Google Scholar] [CrossRef] [PubMed]
- Maddonni, G.A.; Otegui, M.E.; Cirilo, A.G. Plant population density, row spacing and hybrid effects on maize canopy architecture and light attenuation. Field Crops Res. 2001, 71, 183–193. [Google Scholar] [CrossRef]
- Stewart, S. Suggested Guidelines for Plant Growth Regulator Use on Louisiana Cotton; Publication Number 2919; Louisiana Cooperative Extension Service: Baton Rouge, LA, USA, 2005. [Google Scholar]
- Ma, J.J.; Pei, W.F.; Ma, Q.F.; Geng, Y.H.; Liu, G.Y.; Liu, J.; Cui, Y.P.; Zhang, X.; Wu, M.; Li, X.G.; et al. QTL analysis and candidate gene identification for plant height in cotton based on an interspecific backcross inbred line population of Gossypium hirsutum × Gossypium barbadense. Theor. Appl. Genet. 2019, 132, 2663–2676. [Google Scholar] [CrossRef] [PubMed]
- Williford, J.R.; Brashears, A.D.; Barker, G.L. Harvesting. In Cotton Ginners Handbook; Anthony, W.S., Mayfield, W.D., Eds.; DIANE Publishing: Collingdale, PA, USA, 1994; pp. 11–16. [Google Scholar]
- Van Der Sluijs, R. Harvesting & delivering uncontaminated cotton. In Australian Cotton Production Manual; The Australian Cotton Industry Development & Delivery Team: Geelong, Australia, 2013; pp. 118–124. [Google Scholar]
- Alkuddsi, Y.; Patil, S.S.; Manjula, S.M.; Patil, B.C.; Nadaf, H.L.; Nandihali, B.S. Association analysis of seed cotton yield components and physiological parameters in derived F1 inter specific crosses of cotton. Biosci. Methods 2013, 4, 23–33. [Google Scholar] [CrossRef]
- Reddy, K.B.; Reddy, V.C.; Ahmed, M.L.; Naidu, T.C.M.; Srinivasarao, V. Correlation and path coefficient analysis in upland cotton (Gossypium hirsutum L.). Int. J. Pure Appl. Biosci. 2015, 3, 70–80. [Google Scholar]
- Farias, F.J.C.; Carvalho, L.P.; Silva Filho, J.L.; Teodoro, P.E. Correlations and path analysis among agronomic and technological traits of upland cotton. Genet. Mol. Res. 2016, 15, gmr.15038239. [Google Scholar] [CrossRef] [PubMed]
- Raj, T.; Thind, S.K.; Grewal, I.S. Correlation and path coefficient analysis of yield with yield attributing characters in cotton (Gossypium hirsutum L.). Environ. Ecol. 2017, 35, 1228–1232. [Google Scholar]
- Bartimote, T.; Quigley, R.; Bennett, J.M.; Hall, J.; Brodrick, R.; Tan, D.K.Y. A comparative study of conventional and controlled traffic in irrigated cotton: II. Economic and physiological analysis. Soil Tillage Res. 2017, 168, 133–142. [Google Scholar] [CrossRef]
- Reddy, K.R.; Hodges, H.F.; McKinion, J.M.; Wall, G.W. Temperature effects on Pima cotton growth and development. Agron. J. 1992, 84, 237–243. [Google Scholar] [CrossRef]
- Oosterhuis, D.M. Day or night high temperatures: A major cause of yield variability. Cotton Grow. 2002, 46, 8–9. [Google Scholar]
- Monteiro, J.E.B.A.; Sentelhas, P.C.; Chiavegato, E.J. Microclimate and ramulosis occurrence in a cotton crop under three plant population densities in Southern Brazil. Agriscientia 2006, 23, 45–53. [Google Scholar]
- Malik, R.S.; Dhankar, J.S.; Turner, N.C. Influence of soil water deficits on root growth and cotton seedlings. Plant Soil 1979, 53, 109–115. [Google Scholar] [CrossRef]
- Pace, P.F.; Cralle, H.T.; El-Halawany, S.H.M.; Cothren, J.T.; Sensem, S.A. Drought-induced changes in shoot and root growth of young cotton plants. J. Cotton Sci. 1999, 3, 183–187. [Google Scholar]
- Pettigrew, W.T. Moisture deficit effects on cotton lint yield, yield components, and boll distribution. Agron. J. 2004, 96, 377–383. [Google Scholar] [CrossRef]
- Su, J.J.; Li, L.B.; Zhang, C.; Wang, C.X.; Gu, L.J.; Wang, H.T.; Wei, H.L.; Liu, Q.B.; Huang, L.; Yu, S.X. Genome-wide association study identified genetic variations and candidate genes for plant architecture component traits in Chinese upland cotton. Theor. Appl. Genet. 2018, 131, 1299–1314. [Google Scholar] [CrossRef] [PubMed]
- Heitholt, J.J.; Sassenrath-Cole, G.F. Inter-plant competition: Growth responses to plant density and row spacing. In Physiology of Cotton; Steward, J.M., Oosterhuis, D., Heitholt, J.J., Mauney, J.R., Eds.; Springer Science & Business Media: New York, NY, USA, 2010; pp. 179–186. [Google Scholar]
- Kaggwa-Asiimwe, R.; Andrade-Sanchez, P.; Wang, G.Y. Plant architecture influences growth and yield response of upland cotton to population density. Field Crops Res. 2013, 145, 52–59. [Google Scholar] [CrossRef]
- Wang, X.R.; Hou, Y.R.; Du, M.W.; Xu, D.Y.; Lu, H.Y.; Tian, X.L.; Li, Z.H. Effect of planting date and plant density on cotton traits as relating to mechanical harvesting in the Yellow River valley region of China. Field Crops Res. 2016, 198, 112–121. [Google Scholar] [CrossRef]
- He, Z.P.; Xi, H.D.; Yang, B.F.; Li, P.M.; Han, B.W. The key to get good yield of cotton by inducing the response to DPC towards a planned direction and in planned strength. Acta Agric. Univ. Pekin. 1984, 10, 19–28, (In Chinese, with English abstract). [Google Scholar]
- Kerby, T.A. Cotton response to mepiquat chloride. Agron. J. 1985, 77, 515–518. [Google Scholar] [CrossRef]
- Reddy, A.R.; Reddy, K.; Hodges, H. Mepiquat chloride (PIX)-induced changes in photosynthesis and growth of cotton. Plant Growth Regul. 1996, 20, 179–183. [Google Scholar] [CrossRef]
- Zhao, D.; Oosterhuis, D.M. Pix Plus and mepiquat chloride effects on physiology, growth, and yield of field-grown cotton. J. Plant Growth Regul. 2000, 19, 415–422. [Google Scholar] [CrossRef]
- Siebert, J.D.; Stewart, A.M. Influence of plant density on cotton response to mepiquat chloride application. Agron. J. 2006, 98, 1634–1639. [Google Scholar] [CrossRef]
- Dai, J.L.; Kong, X.Q.; Zhang, D.M.; Li, W.J.; Dong, H.Z. Technologies and theoretical basis of light and simplified cotton cultivation in China. Field Crops Res. 2017, 214, 142–148. [Google Scholar] [CrossRef]
- Stetkiewicz, S.; Burnetta, F.I.; Ennosc, R.A.; Toppa, C.F.E. The impact of fungicide treatment and Integrated Pest Management on barley yields: Analysis of a long term field trials database. Eur. J. Agron. 2019, 105, 111–118. [Google Scholar] [CrossRef]
- Pujer, S.K.; Siwach, S.S.; Sangwan, R.S.; Sangwan, O.; Deshmukh, J. Correlation and path coefficient analysis for yield and fiber quality traits in upland cotton (Gossypium hirsutum L.). J. Cotton Res. 2014, 28, 214–216. [Google Scholar]
- Bhailume, M.S.; Borole, D.N.; Magar, N.M. Correlation and path analysis between seed cotton yield and its attributing characters studies in deshi cotton. J. Cotton Res. 2016, 30, 29–31. [Google Scholar]
- Patil, H.V.; Deosarkar, D.B.; Arbad, S.K. Correlation and path analysis in upland cotton (Gossypium hirsutum L.). J. Cotton Res. 2017, 31, 19–23. [Google Scholar]
- Christidis, B.G.; Harrison, G.J. Cotton Growing Problems; McGraw Hill Book Co, Inc.: New York, NY, USA, 1955. [Google Scholar]
- Singh, R.B.; Gupta, M.P.; Mar, B.R.; Jain, D.K. Variability and correlation studies in yield and quality characters in hirsutum Cotton. Indian J. Genet. 1968, 28, 216–222. [Google Scholar]
- Khan, M.D.; Chaudry, N.A.; Saleem, M. Association of various characters in parents and hybrids of G. hirsutum. L. Pak. Cottons 1979, 24, 253–261. [Google Scholar]
- Tariq, M.; Khan, M.A.; Idress, G. Correlation and path coefficient analysis in upland cotton. Sarhad J. Agric. 1992, 8, 341–351. [Google Scholar]
- Rauf, S.; Khan, T.M.; Sadaqat, H.A.; Khan, A.I. Correlation and path coefficient analysis of yield components in cotton (Gossypium hirsutum L.). Int. J. Agric. Biol. 2004, 6, 686–688. [Google Scholar]
- Larik, A.S.; Kakar, A.A.; Naz, M.A.; Sheikh, M.A. Character correlation and path analysis in Gossypium hirsutum L. Sarhad J. Agric. 1999, 15, 269–274. [Google Scholar]
- Soomor, Z.A.; Larik, A.S.; Kumbhar, M.B.; Khan, N.U. Correlation and path analysis in hybrid cotton. Sabrao J. Breed. Genet. 2008, 40, 49–56. [Google Scholar]
- Clutton-Brock, T.; Sheldon, B.C. Individuals and populations: the role of longterm, individual-based studies of animals in ecology and evolutionary biology. Trends Ecol. Evol. Amst. 2010, 25, 562–573. [Google Scholar] [CrossRef] [PubMed]
- Lindenmayer, D.B. Value of long-term ecological studies. Austral Ecol. 2012, 37, 745–757. [Google Scholar] [CrossRef]
- Gaju, O.; Allard, V.; Martre, P.; Le Gouis, J.; Moreau, D.; Bogard, M.; Hubbart, S.; Foulkes, M.J. Nitrogen partitioning and remobilization in relation to leaf senescence, grain yield and grain nitrogen concentration in wheat cultivars. Field Crops Res. 2014, 155, 213–223. [Google Scholar] [CrossRef]
- Alishah, O.; Bagherieh-Najjar, M.B.; Fahmideh, L. Correlation, path coefficient and factor analysis of some quantitative and agronomic traits in cotton (Gossypium hirsutum L.). Asian J. Biol. Sci. 2008, 1, 61–68. [Google Scholar]
- Kerby, T.A.; Bourland, F.M.; Hake, K.D. Physiological rationales in plant monitoring and mapping. In Physiology of Cotton; Stewart, J.M., Oosterhuis, D., MHeitholt, J.J., Mauney, J.R., Eds.; Springer Science & Business Media: New York, NY, USA, 2010; pp. 304–317. [Google Scholar]
- Wu, J.R.; Hu, X.M.; Zhu, Q.G. A study on the effect of pix with different seed treatment on the growth of cotton. China Cotton 1986, 2, 28–29. (In Chinese) [Google Scholar]
- Fernández, C.J.; Cothren, J.T.; McInnes, K.J. Partitioning of biomass in well-watered and water-stressed cotton plants treated with mepiquat chloride. Crop Sci. 1991, 31, 1224–1228. [Google Scholar] [CrossRef]
- Mao, S.C. The modernization of cotton planting techniques in China. China Cotton 2010, 9, 203–204. (In Chinese) [Google Scholar]
- Heitholt, J.J. Canopy characteristics associated with deficient and excessive cotton plant population densities. Crop Sci. 1994, 34, 1291–1297. [Google Scholar] [CrossRef]
- Constable, G.A. Growth and light receipt by main-stem cotton leaves in relation to plant density in the field. Agric. For. Meteorol. 1986, 37, 279–292. [Google Scholar] [CrossRef]
- Constable, G.A.; Gleeson, A.C. Growth and distribution of dry matter in cotton (Gossypium hirsutum L.). Aust. J. Agric. Res. 1977, 28, 249–256. [Google Scholar] [CrossRef]
- Chen, D.H. Population quality and regulation in cotton. In Crop Population Quality; Ling, Q.H., Ed.; Shanghai Scientific and Technical Publishers: Shanghai, China, 2005; pp. 293–386. (In Chinese) [Google Scholar]
- Marois, J.J.; Wright, D.L.; Wiatrak, P.J.; Vargas, M.A. Effect of row width and nitrogen on cotton morphology and canopy micro-climate. Crop Sci. 2004, 44, 870–877. [Google Scholar] [CrossRef]


| Year | Precipitation (mm) | Average Air Temperature (°C) | Sunshine Duration (h) | ||||||||||||
|---|---|---|---|---|---|---|---|---|---|---|---|---|---|---|---|
| May | June | July | August | September | May | June | July | August | September | May | June | July | August | September | |
| 2010 | 52.1 | 7.4 | 86.3 | 195.8 | 52.3 | 21.7 | 25.7 | 28.4 | 24.9 | 20.0 | 282.5 | 296.4 | 244.7 | 198.8 | 184.0 |
| 2011 | 67.2 | 47.2 | 151.2 | 150.8 | 33.6 | 20.6 | 26.8 | 27.6 | 25.6 | 18.9 | 303.2 | 298.4 | 283.5 | 264.7 | 213.0 |
| 2012 | 5.6 | 79.5 | 242.5 | 119.2 | 131.3 | 22.6 | 25.1 | 26.8 | 24.1 | 18.8 | 237.4 | 193.3 | 163.7 | 181.1 | 210.4 |
| 2013 | 26.5 | 80.1 | 279.1 | 96.7 | 39.2 | 20.9 | 24.6 | 26.2 | 26.5 | 20.2 | 258.2 | 187.3 | 187.0 | 238.8 | 184.3 |
| 2014 | 38.0 | 30.0 | 42.4 | 93.0 | 19.6 | 22.9 | 25.6 | 28.2 | 26.0 | 20.8 | 316.8 | 297.9 | 297.6 | 302 | 226.2 |
| 2016 | 27.1 | 40.9 | 274.0 | 51.4 | 16.4 | 19.9 | 25.6 | 26.6 | 25.7 | 21.1 | 283.8 | 274.9 | 216.9 | 213.3 | 248.2 |
| 2017 | 24.4 | 58.3 | 166.8 | 212.6 | 9.8 | 23.0 | 25.3 | 27.4 | 25.6 | 21.4 | 342.8 | 324.0 | 277.5 | 275.8 | 286.3 |
| Year | Cultivar | Density (plants m−2) | MC (g ha−1) | Irrigation (mm) | Nitrogen (kg ha−1) | P2O5 (kg ha−1) | K2O (g ha−1) | Mean Plant Height (cm) | Mean Seed Cotton Yield (kg ha−1) | N1 | N2 | N3 | N4 |
|---|---|---|---|---|---|---|---|---|---|---|---|---|---|
| 2010 | GX3 | 5.2 | 0, 588 | 0 | 186 | 138 | 0, 45–180 | 104.9 | 3295.9 | 24 | 0 | 0 | 0 |
| 2010 | GX3 | 5.2 | 0, 588 | 0 | 186 | 138 | 0, 45–180 | 113.5 | 3231.2 | 48 | 0 | 0 | 0 |
| 2010 | GX3 | 5.2 | 0, 588 | 0 | 186 | 138 | 0, 45–180 | 111.4 | 3130.8 | 25 | 0 | 0 | 0 |
| 2010 | GX3, GX8 | 5.2 | 0, 588 | 0 | 186 | 138 | 0, 45–180 | 111.4 | 3448.2 | 36 | 0 | 0 | 0 |
| 2011 | GX3 | 5.2 | 0, 600 | 0 | 186 | 138 | 0, 45–180 | 110.4 | 3361.1 | 12 | 0 | 0 | 0 |
| 2011 | GX3 | 5.2 | 0, 600 | 0 | 186 | 138 | 0, 45–180 | 112.8 | 3612.9 | 49 | 0 | 0 | 0 |
| 2012 | GX3, XK4 | 6.0, 9.0, 11.7 | 357 | 0 | 186 | 138 | 0, 45–180 | 128.1 | 2609.7 | 54 | 54 | 0 | 0 |
| 2013 | GX3 | 9.0, 11.7 | 312 | 0 | 123 | 128 | 90 | 120.5 | 3192.4 | 36 | 36 | 36 | 36 |
| 2013 | SK126 | 6.0, 9.0, 11.7 | 312 | 0 | 0, 210 | 128 | 90 | 110.4 | 3223.3 | 54 | 54 | 0 | 0 |
| 2013 | SCRC36, Han7860 | 6.0, 11.7 | 0, 3.75–180 | 0 | 123 | 128 | 90 | 138.8 | 3144.8 | 300 | 300 | 300 | 300 |
| 2014 | SCRC36, Han7860 | 6.0, 11.7 | 0, 3.75–180 | 50 | 123 | 128 | 90 | 106.6 | 5145.1 | 300 | 300 | 300 | 300 |
| 2014 | SK126 | 6.0, 9.0, 11.7 | 153 | 50 | 0, 210 | 128 | 90 | 75.9 | 4622.2 | 54 | 54 | 0 | 0 |
| 2014 | GX3, SK126 | 6.0, 9.0, 11.7 | 153 | 50 | 123 | 128 | 90 | 78.2 | 5095.6 | 54 | 54 | 0 | 0 |
| 2014 | SK126 | 6.0, 9.0, 11.7 | 0, 140–394 | 50 | 123 | 128 | 90 | 82.6 | 4431.7 | 36 | 0 | 0 | 0 |
| 2016 | SK126 | 9.0 | 425 | 0 | 0, 105, 210 | 138 | 90 | 111.6 | 4158.5 | 36 | 36 | 36 | 36 |
| 2016 | SK126 | 9.0 | 0, 140–394 | 0 | 120 | 138 | 90 | 103.3 | 3851.1 | 48 | 48 | 48 | 48 |
| 2016 | XS17 | 6.0, 9.0, 11.7 | 425 | 0 | 0, 105, 210 | 138 | 90 | 97.9 | 4502.0 | 72 | 72 | 72 | 72 |
| 2016 | SCRC36, XK4 | 6.0, 11.7 | 0, 140–491 | 0 | 120 | 138 | 90 | 99.4 | 3928.3 | 80 | 80 | 0 | 0 |
| 2016 | CCRI60, XK4 | 11.7 | 425 | 0 | 120 | 138 | 90 | 110.7 | 2870.1 | 120 | 120 | 0 | 0 |
| 2017 | SK126 | 9.0 | 527 | 0 | 120 | 138 | 90 | 118.8 | 4158.5 | 36 | 36 | 36 | 36 |
| 2017 | SK126 | 9.0 | 0, 140–394 | 0 | 120 | 138 | 90 | 115.5 | 3426.1 | 48 | 48 | 48 | 48 |
| 2017 | SCRC28 | 9.0 | 527 | 0 | 120 | 138 | 90 | 98.6 | 3461.4 | 112 | 0 | 112 | 0 |
| 2017 | SCRC28 | 9.0 | 527 | 0 | 120 | 138 | 90 | 98.1 | 4522.7 | 108 | 108 | 0 | 0 |
| 2017 | CCRI60 | 9.0, 11.7 | 527 | 0 | 120 | 138 | 90 | 113 | 3234.4 | 120 | 0 | 0 | 0 |
| Year | Plant Height: 58.6–163.2 cm | Plant Height: 80–120 cm | ||||||||
|---|---|---|---|---|---|---|---|---|---|---|
| r | Mean (cm) | Coefficient of Variation (%) | n | Seed Cotton Yield (kg ha−1) | r | Mean (cm) | Coefficient of Variation (%) | n | Seed Cotton Yield (kg ha−1) | |
| 2010 | −0.324 * | 111.0 | 13.4 | 156 | 3291.2 | −0.244 * | 101.8 | 8.4 | 96 | 3383.2 |
| 2011 | −0.077 ns | 112.3 | 11.7 | 60 | 3562.6 | −0.096 ns | 104.4 | 8.7 | 38 | 3565.6 |
| 2012 | −0.312 * | 128.1 | 6.4 | 54 | 2609.7 | — | — | — | 10 | — |
| 2013 | −0.195 * | 133.2 | 10.8 | 374 | 3160.1 | 0.346 * | 111.5 | 4.7 | 78 | 3321.8 |
| 2014 | 0.304 * | 97.0 | 20.4 | 384 | 5016.3 | 0.061 ns | 100.9 | 11.7 | 220 | 5110.8 |
| 2016 | −0.459 * | 104.7 | 16.7 | 335 | 3702.8 | −0.554 * | 103.7 | 10.2 | 277 | 3716.8 |
| 2017 | −0.200 * | 104.7 | 13.3 | 454 | 3722.7 | −0.156 * | 103.5 | 9.9 | 400 | 3727.3 |
| Cultivar | Plant Height: 58.6–163.2 cm | Plant Height: 80–120 cm | ||||||||
|---|---|---|---|---|---|---|---|---|---|---|
| r | Mean (cm) | Coefficient of Variation (%) | n | Seed Cotton Yield (kg ha−1) | r | Mean (cm) | Coefficient of Variation (%) | n | Seed Cotton Yield (kg ha−1) | |
| SCRC36 | −0.551 * | 98.8 | 17.0 | 310 | 4283.2 | 0.058 ns | 102.6 | 10.3 | 133 | 5057.6 |
| Han7860 | −0.700 * | 126.5 | 17.3 | 270 | 3737.8 | 0.025 ns | 104.4 | 10.3 | 91 | 4750.0 |
| XK4 | −0.672 * | 109.0 | 14.7 | 182 | 3318.6 | −0.617 * | 105 | 9.0 | 142 | 3452.6 |
| SK126 | −0.414 * | 98.8 | 23.7 | 357 | 4039.0 | −0.331 * | 102.1 | 12.2 | 177 | 3835.8 |
| CCRI60 | −0.243 * | 112.1 | 8.7 | 180 | 3047.4 | −0.292 * | 110.9 | 6.2 | 150 | 3045.2 |
| GX3 | −0.646 * | 111.0 | 15.7 | 263 | 3480.0 | −0.454 * | 103.4 | 10.1 | 143 | 3542.5 |
| XS17 | −0.186 ns | 97.9 | 10.9 | 72 | 4502.0 | −0.101 ns | 99 | 5.0 | 67 | 4498.6 |
| SCRC28 | 0.004 ns | 96.4 | 11.7 | 164 | 4136.5 | 0.015 ns | 97.9 | 9.1 | 147 | 4113.2 |
| Density (plants m−2) | Plant Height: 58.6–163.2 cm | Plant Height: 80–120 cm | ||||||||
|---|---|---|---|---|---|---|---|---|---|---|
| r | Mean (cm) | Coefficient of Variation (%) | n | Seed Cotton Yield (kg ha−1) | r | Mean (cm) | Coefficient of Variation (%) | n | Seed Cotton Yield (kg ha−1) | |
| 5.2 | −0.198 * | 111.3 | 12.8 | 192 | 3373.3 | −0.139 ns | 102.6 | 8.8 | 122 | 3423.1 |
| 6.7 | −0.584 * | 115.6 | 20.6 | 408 | 4041.9 | −0.162 * | 101.7 | 10.5 | 186 | 4492.5 |
| 9.0 | −0.316 * | 105.1 | 16.6 | 608 | 3873.7 | −0.178 * | 102.4 | 10.6 | 455 | 3908.4 |
| 11.2 | −0.449 * | 114.0 | 18.7 | 609 | 3672.7 | −0.392 * | 106.5 | 9.4 | 344 | 3861.3 |
| Treatment | Plant Height: 58.6–163.2 cm | Plant Height: 80–120 cm | ||||||||
|---|---|---|---|---|---|---|---|---|---|---|
| r | Mean (cm) | Coefficient of Variation (%) | n | Seed Cotton Yield (kg ha−1) | r | Mean (cm) | Coefficient of Variation (%) | n | Seed Cotton Yield (kg ha−1) | |
| CK | −0.539 * | 131.7 | 12.2 | 403 | 3646.6 | −0.352 * | 111.4 | 6.5 | 265 | 4469.3 |
| MC | −0.408 * | 93.9 | 16.8 | 1414 | 3817.4 | −0.360 * | 103.0 | 10.1 | 906 | 3837.1 |
| Plant Architecture Attributes | Plant Height: 58.6–163.2 cm | Plant Height: 80–120 cm | ||||
|---|---|---|---|---|---|---|
| Mean (cm) | Coefficient of Variation (%) | n | Mean (cm) | Coefficient of Variation (%) | n | |
| 1st | 3.6 | 21.9 | 867 | 3.5 | 19.6 | 478 |
| 2nd | 6.9 | 22.7 | 755 | 6.5 | 22.4 | 372 |
| 3rd | 6.7 | 26.2 | 755 | 5.7 | 23.1 | 372 |
| 4th | 5.9 | 26.1 | 755 | 5.5 | 31.5 | 372 |
| LFB | 24.6 | 31.0 | 1289 | 23.9 | 31.2 | 720 |
| MFB | 25.9 | 34.9 | 1289 | 23.4 | 32.3 | 720 |
| UFB | 20.2 | 48.6 | 1289 | 17.8 | 43.2 | 720 |
© 2019 by the authors. Licensee MDPI, Basel, Switzerland. This article is an open access article distributed under the terms and conditions of the Creative Commons Attribution (CC BY) license (http://creativecommons.org/licenses/by/4.0/).
Share and Cite
Yan, W.; Du, M.; Zhao, W.; Li, F.; Wang, X.; Eneji, A.E.; Yang, F.; Huang, J.; Meng, L.; Qi, H.; et al. Relationships between Plant Architecture Traits and Cotton Yield within the Plant Height Range of 80–120 cm Desired for Mechanical Harvesting in the Yellow River Valley of China. Agronomy 2019, 9, 587. https://doi.org/10.3390/agronomy9100587
Yan W, Du M, Zhao W, Li F, Wang X, Eneji AE, Yang F, Huang J, Meng L, Qi H, et al. Relationships between Plant Architecture Traits and Cotton Yield within the Plant Height Range of 80–120 cm Desired for Mechanical Harvesting in the Yellow River Valley of China. Agronomy. 2019; 9(10):587. https://doi.org/10.3390/agronomy9100587
Chicago/Turabian StyleYan, Wei, Mingwei Du, Wenchao Zhao, Fang Li, Xiangru Wang, A. Egrinya Eneji, Fuqiang Yang, Jian Huang, Lu Meng, Haikun Qi, and et al. 2019. "Relationships between Plant Architecture Traits and Cotton Yield within the Plant Height Range of 80–120 cm Desired for Mechanical Harvesting in the Yellow River Valley of China" Agronomy 9, no. 10: 587. https://doi.org/10.3390/agronomy9100587
APA StyleYan, W., Du, M., Zhao, W., Li, F., Wang, X., Eneji, A. E., Yang, F., Huang, J., Meng, L., Qi, H., Xue, G., Xu, D., Tian, X., & Li, Z. (2019). Relationships between Plant Architecture Traits and Cotton Yield within the Plant Height Range of 80–120 cm Desired for Mechanical Harvesting in the Yellow River Valley of China. Agronomy, 9(10), 587. https://doi.org/10.3390/agronomy9100587