Article

Understanding Activation Effects on Low-Temperature Biochar for Optimization of Herbicide Sorption

1
Instituto de Recursos Naturales y Agrobiología de Sevilla, Consejo Superior de Investigaciones Científicas (IRNAS-CSIC), Reina Mercedes, Av. 10, 41012 Seville, Spain
2
Department of Soil, Water, and Climate, University of Minnesota, 1991 Upper Buford Cir., St. Paul, MN 55101, USA
3
United States Department of Agriculture—Agricultural Research Service, St. Paul, MN 55101, USA
*
Author to whom correspondence should be addressed.
Agronomy 2019, 9(10), 588; https://doi.org/10.3390/agronomy9100588
Submission received: 4 August 2019 / Revised: 20 September 2019 / Accepted: 22 September 2019 / Published: 27 September 2019

Abstract

:
Activation treatments are often used as a means of increasing a biochar’s sorption capacity for agrochemical compounds but can also provide valuable insight into sorption mechanisms. This work investigates the effects of H2O2 activation on a low-temperature (350 °C) grape wood biochar, evaluates subsequent changes to the removal efficiency (RE) of cyhalofop and clomazone, and elucidates potential sorption mechanisms. Activation by H2O2 decreased the biochar pH, ash content, and C content. Additionally, the biochar O content and surface area increased following activation, and Fourier transform infrared spectroscopy (FTIR) data suggested a slight increase in surface O groups and a decrease in aliphatic C. Cyhalofop RE significantly increased following activation, while clomazone RE was unchanged. The increased sorption of cyhalofop was attributed to pH effects and charge-based interactions with biochar O moieties. Results from this study suggest that H2O2 activation treatments on low-temperature biochars may improve the removal of organic acid herbicides but are of little value in optimizing the removal of polar, non-ionizable herbicides.

1. Introduction

There is a growing interest in biochar as sustainable soil amendment due to the agronomical benefits derived from its use. Lately, biochar has attracted attention for showing sorbent properties towards a wide variety of agrochemical compounds. By binding chemicals such as pesticides, biochar can help prevent and remediate contamination in soil and water [1,2] acting, among others, as a soil ameliorant tool. To further enhance the sorption capacity of biochars, activation processes akin to those used in the production of activated charcoal are increasingly being adopted [3,4]. These activation treatments may be particularly useful for improving herbicide sorption capacities of low-temperature biochar (< 400 °C), which are favored for soil fertility applications, but have relatively low sorption capacities. However, for biochar activation to be effective, it is necessary to understand which biochar physicochemical properties are affected, and whether or not these changes influence the binding of the target compound.
Activation treatments can be physical, chemical, or thermal in nature. For example, biochars can be activated through grinding or ball milling (physical activation), treating with acids, bases, and oxidizers [e.g., hydrogen peroxide (H2O2)] (chemical activation), or re-pyrolyzing at a higher temperature than the production temperature (thermal activation). Typically, the goal of these post-production treatments is to increase biochar’s specific surface area (SSA) and introduce reactive functional groups which can increase the material’s adsorption capacity [5].
Generally, changes in biochar SSA and O functionality are credited for the increases in adsorption following activation [6]. However, to predict whether such changes will increase sorption, it is key to understand which adsorption mechanisms dominate. A variety of adsorption mechanisms have been proposed to describe interactions between biochar and organic compounds including hydrophobic interactions, electrostatic surface complexation, ion exchange, hydrogen bonding, π–π interactions, co-precipitation, inner-sphere complexation, and the formation of charge-transfer metal complexes [7,8]. The degree of adsorption, as well as the mechanisms involved, depends on the interactions between the properties of the biochar, the chemical involved, as well as the solution chemistry. Biochar properties cited to influence the binding of organic chemicals, include porosity, SSA, pH, and the presence of specialized functional groups [2]. With regard to the sorbate, molecular size, solubility, and its potential to ionize are a few of the well-known influential characteristics [9].
Adsorption mechanisms are often inferred from correlations between biochar physicochemical properties (e.g., SSA; aromaticity; O:C; ash content) and sorption capacity. Many studies rely on the variability in the biochar physicochemical properties that arises from differences in feedstock materials or changes in pyrolysis temperatures [10]. However, it is difficult to discern the importance of individual parameters by this method, since each pyrolysis system possesses its own thermal transfer properties and thereby confers differential chemical and sorptive properties to the biochar [11]. Additionally, it is challenging to ascertain the influence of biochar surface moieties when the bulk chemical composition and physical structure differ (e.g., such as differential dissolution of carbonate/ash material from biochar). However, some activation treatments can function as an improved strategy to deduce adsorption mechanisms by altering limited properties of a single biochar and creating a more direct comparison [12]. Furthermore, few studies have used modified low-temperature biochars as a tool to elucidate biochar-herbicide binding mechanisms [13], and useful insight may be gained through the application of a chemical activation-based approach. Although many works have reported the sorption mechanisms of biochar prepared at low temperature, compared to high-temperature biochars, the effects of activation on low-temperature materials are less clearly defined. Changes to the biochar properties depend largely on what activation treatment is used, as well as the original biochar material. To our knowledge, little has been reported dealing with the activation of biochars produced at low temperature, i.e., 350 °C, with H2O2, since other authors studied different activation (chemical or physical) methods and other pyrolysis temperatures. For instance, Liu et al. [14] observed an increase in the SSA of a rice husk biochar (500 °C) following potassium hydroxide, KOH, activation at 65 °C, with π–π interactions responsible of the adsorption mechanism of tetracycline on biochar. More recently, Xiao and Pignatello [12] reported an increase in SSA with thermal air oxidation of a maple wood biochar (400 °C), together with an increase in carboxyl and phenolic groups, reporting that the main adsorption mechanisms for some ionizable compounds on activated chars were H-bonding and pore filling.
Finally, the activation has also been used to simulate and predict the long-term behavior of biochars when they are added to soil, since their surfaces undergo changes that can modify their sorption properties and H2O2 has been proposed to this aim [15]. Mia et al. [16] proposed the activation of a biochar prepared at 550 °C with H2O2 to predict the long-term behavior of biochars to sorb nutrients, phosphate, and ammonium. Coadsorption and pore filling were the mechanisms proposed after the chemical activation. Regarding pesticides, this knowledge is still inconsistent; in a previous work, we found that three highly persistent ionizable pesticides had a completely different sorption behavior over time on the same aged biochar and differences were attributed to the water-soluble fraction [17].
In this work, the activation of a grape biochar produced at 350 °C was performed by its treatment with H2O2. H2O2 is a desirable means of activation because it is relatively inexpensive, decomposes to H2O and O2, is effective at ambient temperatures, and does not introduce foreign elements into the biochar structure. We hypothesized that the activation of the biochar prepared at 350 °C with H2O2 could modify its surface affecting differently to its adsorption capacity towards ionizable and polar herbicides. Data reported here would be useful to prepare customized biochars to optimize the behavior of pesticides in agricultural soils, which is the critical step for the wide-spread use of biochar as soil amendment. Hence, the objectives of this study were to (1) assess the effects of H2O2 activation on a low-temperature grape wood biochar, (2) evaluate the impact of activation on the sorption of two herbicides, one anionic, cyhalofop, and other neutral and polar, clomazone, and (3) elucidate potential sorption mechanisms.

2. Materials and Methods

2.1. Chemicals and Biochars

Two herbicides with distinct chemistries were selected for comparison in this study (Figure 1). Cyhalofop-butyl (butyl(2R)-2-[4-(4-cyano-2-fluorophenoxy) phenoxy]propionate) is a post-emergence aryloxyphenoxy propionic acid herbicide used in dry-seeded, water-seeded, and transplanted rice [18]. In soil, cyhalofop-butyl is rapidly transformed into its acid form, which exhibits lower sorption and higher water solubility [19]. Therefore, cyhalofop acid ((2R)-2-[4-(4-cyano-2 fluorophenoxy) phenoxy] propanoic acid) (pKa = 3.9 at 25 °C) was used in this study, and is henceforth referred to simply as cyhalofop. Clomazone [2-(2-chlorophenyl) methyl-4,4-dimethyl-3-isoxazolidinone] is a nonionizable pre- or post-emergence isoxazolidinone herbicide used in rice production, as well as in soybean, peas, and cotton cropping systems.
Analytical standards of cyhalofop and clomazone were purchased from Sigma-Aldrich (St. Louis, MO) for use in the sorption experiments. Solutions were prepared at a concentration of 1 mg L−1 in deionized (DI) water for each herbicide. Two additional cyhalofop solutions were prepared at equivalent concentrations (1 mg L−1) with 0.01 M CaCl2, and 0.01 M KCl to evaluate the influence of different salts on the sorption of this ionic compound.
Biochars used in this study were produced from grape wood pruning waste. Pyrolysis was carried out at temperatures of 350 °C (G-350), 500 °C (G-500), and 900 °C (G-900) using a Lindberg bench furnace equipped with a gas-tight retort (Lindberg/MPH, Riverside, MI) under a constant nitrogen inert gas flow. All biochars were held at their maximum temperature for two hours. Biochar was then cooled in the system (still under nitrogen purge) before being exposed to the atmosphere. The biochars were stored in sealed plastic bags until used. Biochar properties appear in Table 1.
Activation of the G-350 biochar was carried out by treatment with H2O2. Approximately 10 g of G-350 biochar was immersed in 50 mL of a 3% H2O2 solution and allowed to react for a period of 24 h at room temperature (22 °C). This biochar was selected for being prepared at low temperature, which was expected to maintain the agronomic benefits described for these types of biochars as compared to those prepared at higher pyrolysis temperature [20]. The 3% H2O2 solution was used to minimize the amount of oxidizing agent while the properties of the biochar are modified, according to previously published data [21]. The biochar was then rinsed with DI water and oven dried (110 °C) prior to use. Activation was carried out shortly after the biochar was received (<2 weeks after production). Henceforth, the activated material will be referred to as the G-350 H2O2.

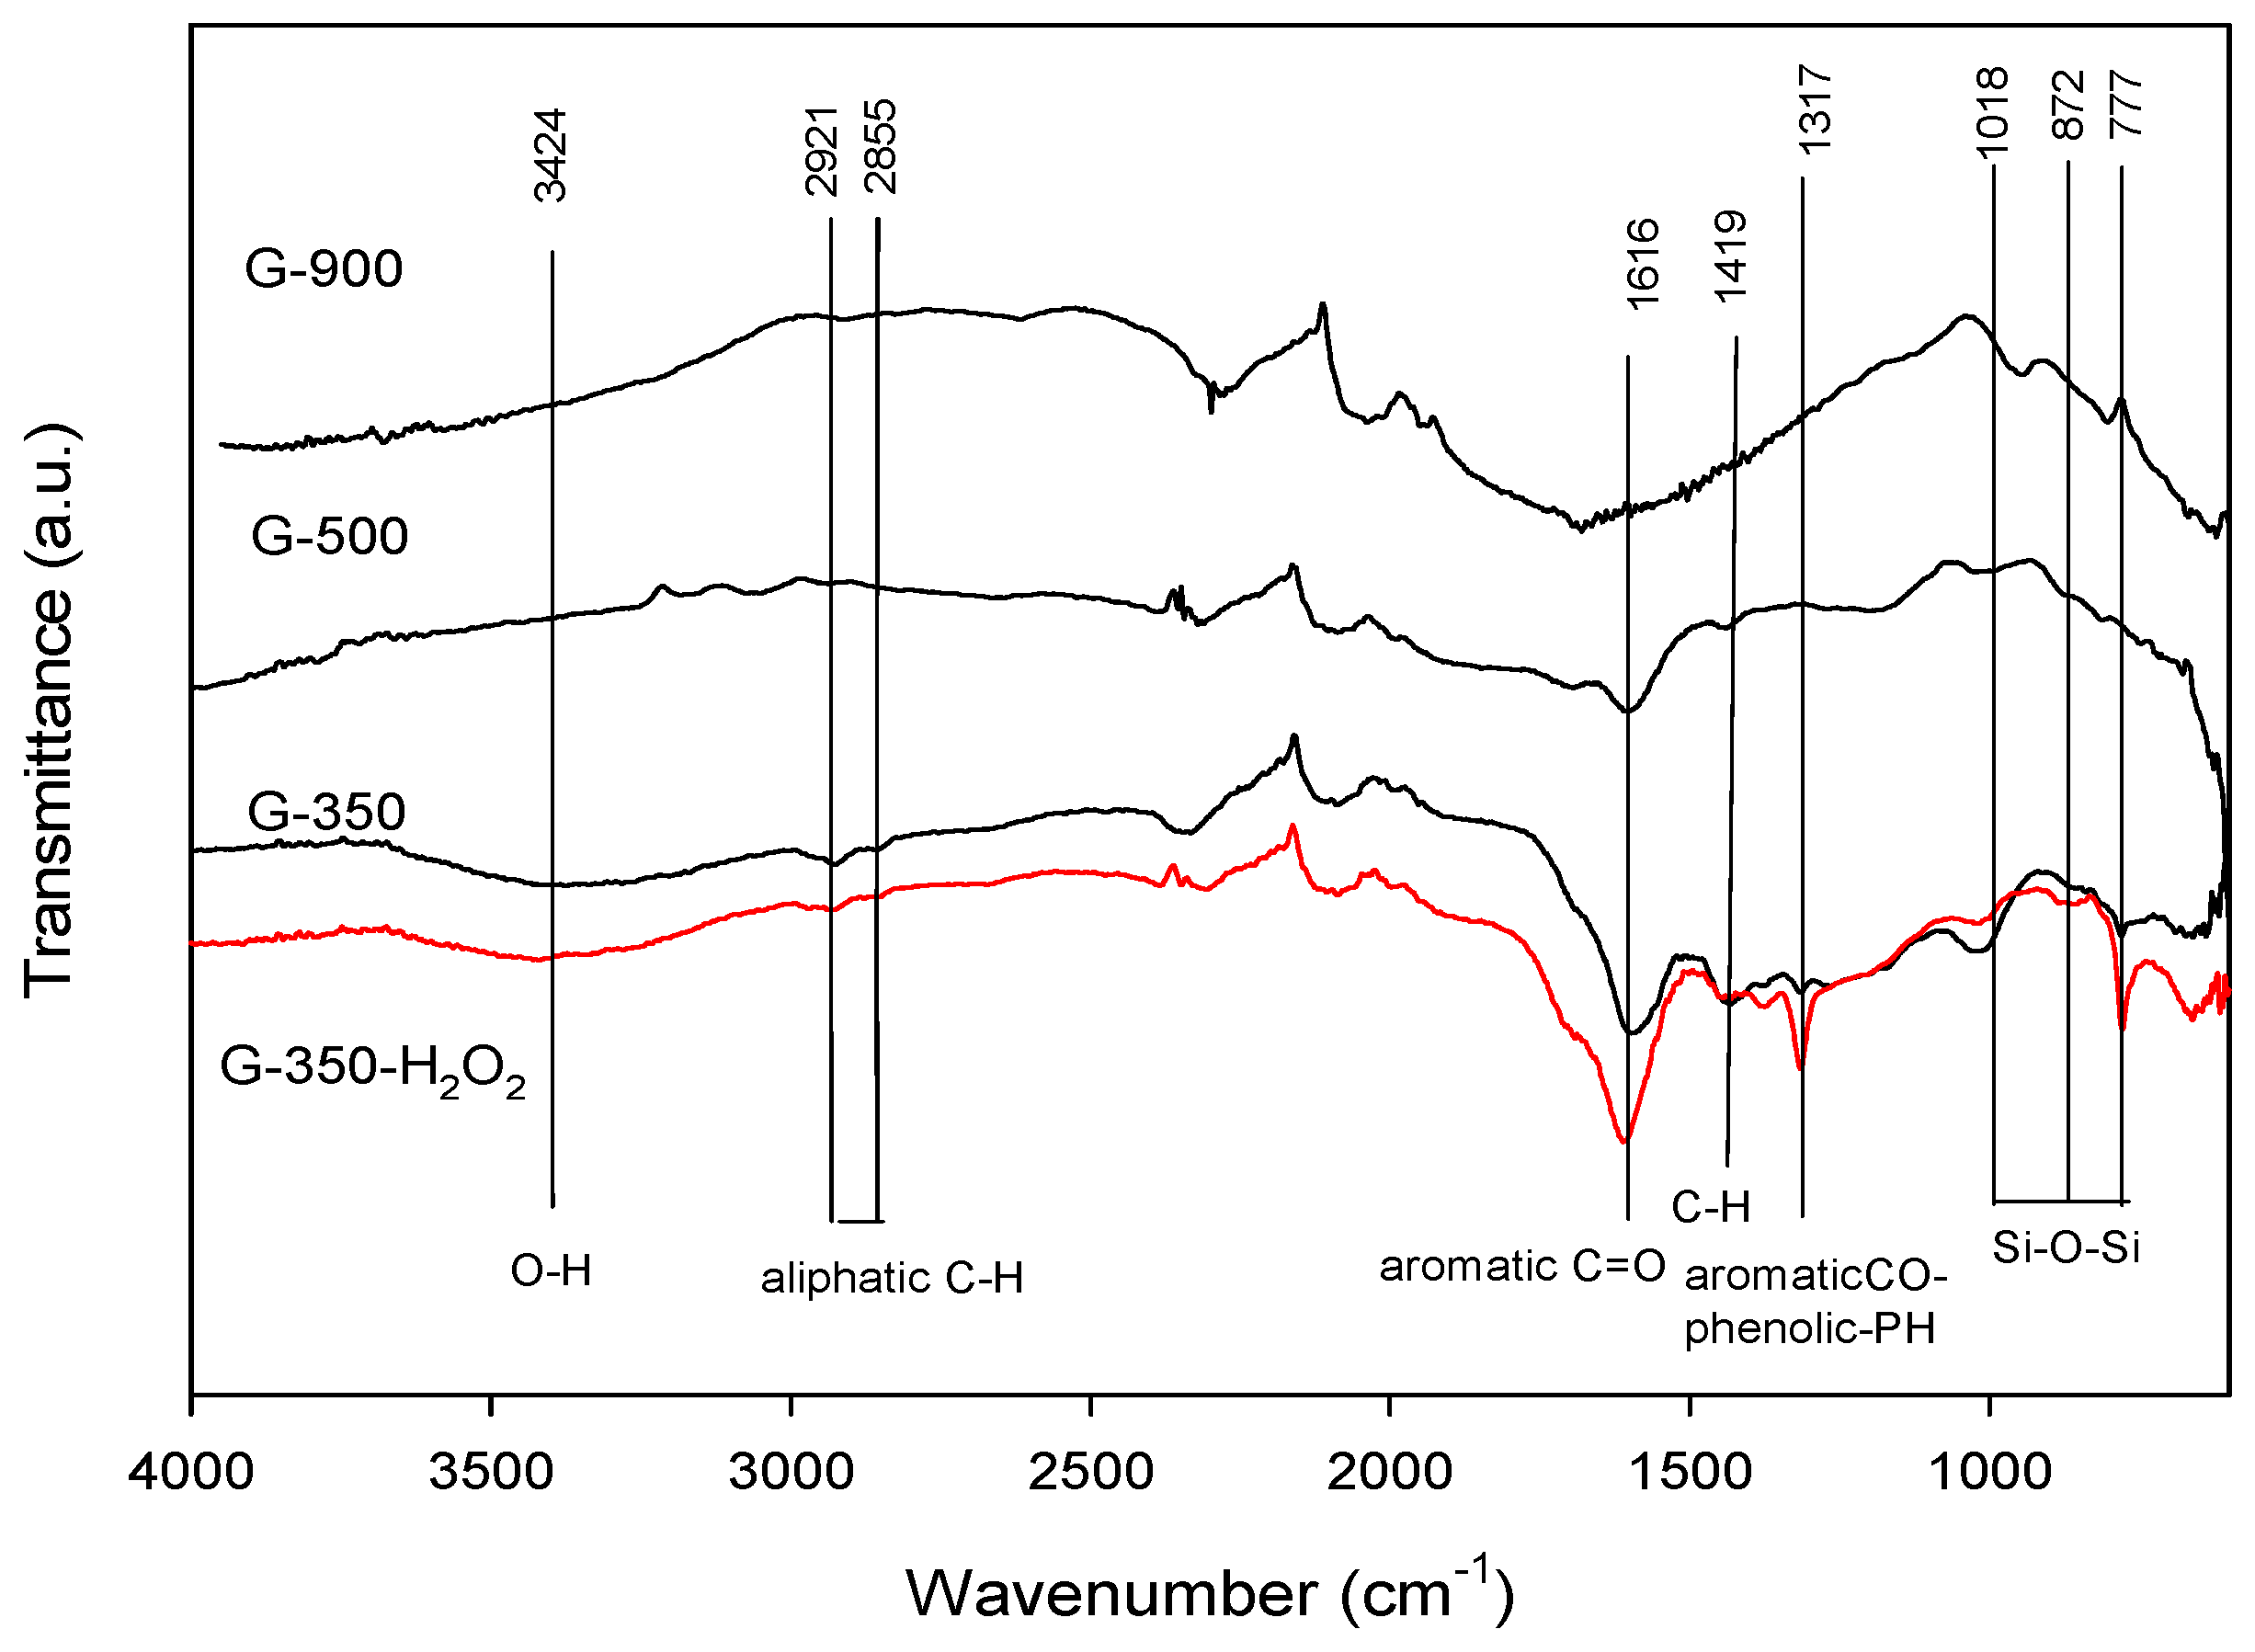
2.2. Biochar Characterization-G-350 Versus G-350 H2O2

Bulk biochar properties including C, N, H, and ash content were analyzed by Micro-analysis, Inc. (Wilmington, DE). All values were reported on a % dry weight, ash-free basis. Oxygen content was calculated by difference (O=100–C–N–H–ash).
Biochars were imaged using a Hitachi S3500N Variable Pressure Scanning Electron Microscope (SEM) (Toyko, Japan) to visually inspect their physical structure. To reduce sample charging and improve image resolution, biochar samples were coated with a 2 nm layer of metal (60% Au, 40% Pd) using a Cressington 108 Auto Sputter Coater (Watford, England).
Fourier transform infrared spectroscopy (FTIR) was used to assess the biochar surface functional groups. FTIR was performed using a Jasco FT/IR 6300 spectrometer (Jasco Europe s.r.l.) equipped with Mercury-cadmium-telluride (MCT) detector fitted with an attenuated total reflection (ATR) accessory (MIRacle™ Single Reflection ATR from Pike Technologies, WI, USA). The spectral range used ranges between 4000 and 580 cm−1, with nominal resolution of 2 cm−1 and 15–20 numbers of scans. Biochar samples were oven dried and ground prior to analysis.
Zeta potential was measured to evaluate electrostatic characteristics of biochar particles suspended in solution. Analysis was performed on G350 biochar with and without activation in suspensions of DI water and 0.01 M CaCl2 (40 mg: 8 mL) by dynamic light scattering using a Zetasizer Nano ZS Analyzer (Malvern Instrument, Malvern, United Kingdom).

2.3. Water Vapor and Herbicide Sorption

Water vapor sorption on biochars was measured following the methods of McDermot and Arnell [22] and Medic et al. [23] to evaluate the accessible surface area and surface energy. Biochars were placed in sealed chambers held at different relative humidities using salt solutions [24]. The biochars were periodically removed and weighed until equilibrium was established, then total water sorption was determined by mass difference. Water vapor sorption data were fit to a linear Brunauer-Emmett-Teller (BET) model from which SSA [1] and the isoteric heat of adsorption (Ea) [2] were calculated.
The specific surface area, SSA; is estimated from the following relationship:
SSA = ( n m N σ m )
where nm = moles H2O in monolayer, N = Avogadro’s number (6.02 × 10²³), σ = surface area per H2O molecule (10.8 × 10⁻²⁰ m2), and m = mass of sorbent (g). The isoteric heat of adsorption (Ea) is calculated by the following:
E a = ln ( c ) R T
where c = BET constant, R = gas constant (8.314 × 10⁻³ kJ K−1 mol−1), and T = temperature (K).
Herbicide sorption measurements were performed in triplicate using the batch equilibration method [25]. Biochar (40 mg) and 1 mg L−1 herbicide solution (8 mL) were combined in glass centrifuge tubes with Teflon lined caps (preliminary studies showed neither herbicide sorbed on the centrifuge tubes) [26,27]. After shaking in an end-over-end shaker (30 r.p.m.) at 20 ± 2 °C for 24 h, samples were centrifuged (5000 rpm, 10 min), and 4 mL of supernatant were removed and filtered (0.45 μm), discarding the first 2 mL. The remaining 2 mL of filtered solution were transferred to 2 mL amber screw top vials for analysis by high performance liquid chromatography (HPLC), as detailed below.
Herbicide sorption on the biochar materials was evaluated based on removal efficiency (RE), calculated as:
RE = C i C e C i × 100
where Ci = initial herbicide solution concentration (mg L−1) and Ce = solution concentration at equilibrium (mg L−1). The pH of the supernatant was measured directly in the sample tube at the end of the experiment. The solution pH was not adjusted or buffered during sorption measurements to fully account for the effects of activation and avoid further changes to the surface chemistries of the materials.
The sorption-desorption isotherms were also obtained for clomazone and cyhalofop on untreated and H2O2 activated G-350 biochar. For this purpose, in triplicate, 40 mg of each biochar were equilibrated with 8 mL of different solution of each herbicide with initial concentration ranging between 0.2 and 5 mg/L for 24 h at 20 ± 2 °C. Then, the suspensions were centrifuged and the supernatants were removed, filtered, and analyzed by HPLC. Sorption isotherms were fitted to the Freundlich equation:
Cs = Kf CeNf
where Cs = amount of herbicide sorbed (mg kg−1) and Ce = solution concentration at equilibrium (mg L−1). Kf and Nf are the empirical Freundlich constants calculated from its linearized form.

2.4. HPLC Analysis

Both cyhalofop and clomazone were measured by HPLC using a C-18 column (Kinetex C-18) in a Waters 600E chromatograph (Milford, MA) coupled to a diode array detector (Waters 996). The UV absorbance was monitored at 233 and 230 nm for cyhalofop and clomazone, respectively. The mobile phase was 50:50 (v/v) acetonitrile/water adjusted to pH 2.0 with phosphoric acid (H3PO4) for cyhalofop, and 35:65 (v/v) methanol/water for clomazone, with a 1 mL min−1 flow and 25 μL injection volume. Instrumental limit of detection (LOD) was calculated as the lowest observable concentration giving a signal-to-noise (S/N) ratio of 3:1, while instrumental limit of quantification (LOQ) was calculated as the concentration resulting in an S/N ratio of 10:1. The LOD and LOQ were 0.01 mg L−1 and 0.03 mg L−1, respectively, for both herbicides.

2.5. Statistical Analyses

Statistical evaluations of sorption based on RE values are detailed below for the various comparisons. All data are the means of triplicate samples with the exception of cyhalofop sorption in 0.01 M KCl which was conducted in duplicate. The effects of H2O2 activation on RE were evaluated for each herbicide using t-tests (p < 0.05) comparing individual herbicide-solution pairs (e.g., RE of cyhalofop on G350 versus G-350 H2O2 in H2O). The effects of variable background solutions on cyhalofop RE were evaluated by analysis of), variance (ANOVA and means were compared using Tukey’s honest significant difference (HSD) test (p < 0.05). The effects of biochar production temperature on sorption for each herbicide were also evaluated based on ANOVA, and if statistically significant differences existed, the means were further compared using Tukey’s HSD test (p < 0.05). Additionally, mean RE values of the two herbicides were analyzed pair-wise for each temperature using a series of t-tests to determine statistically significant differences (p < 0.05). All statistical analyses were performed in R (Version 3.3.2). Figures were plotted using Sigma Plot® (Version 13.0 for Windows, 2014, Systat Software Inc., Point Richmond, CA, USA).

3. Results and Discussion

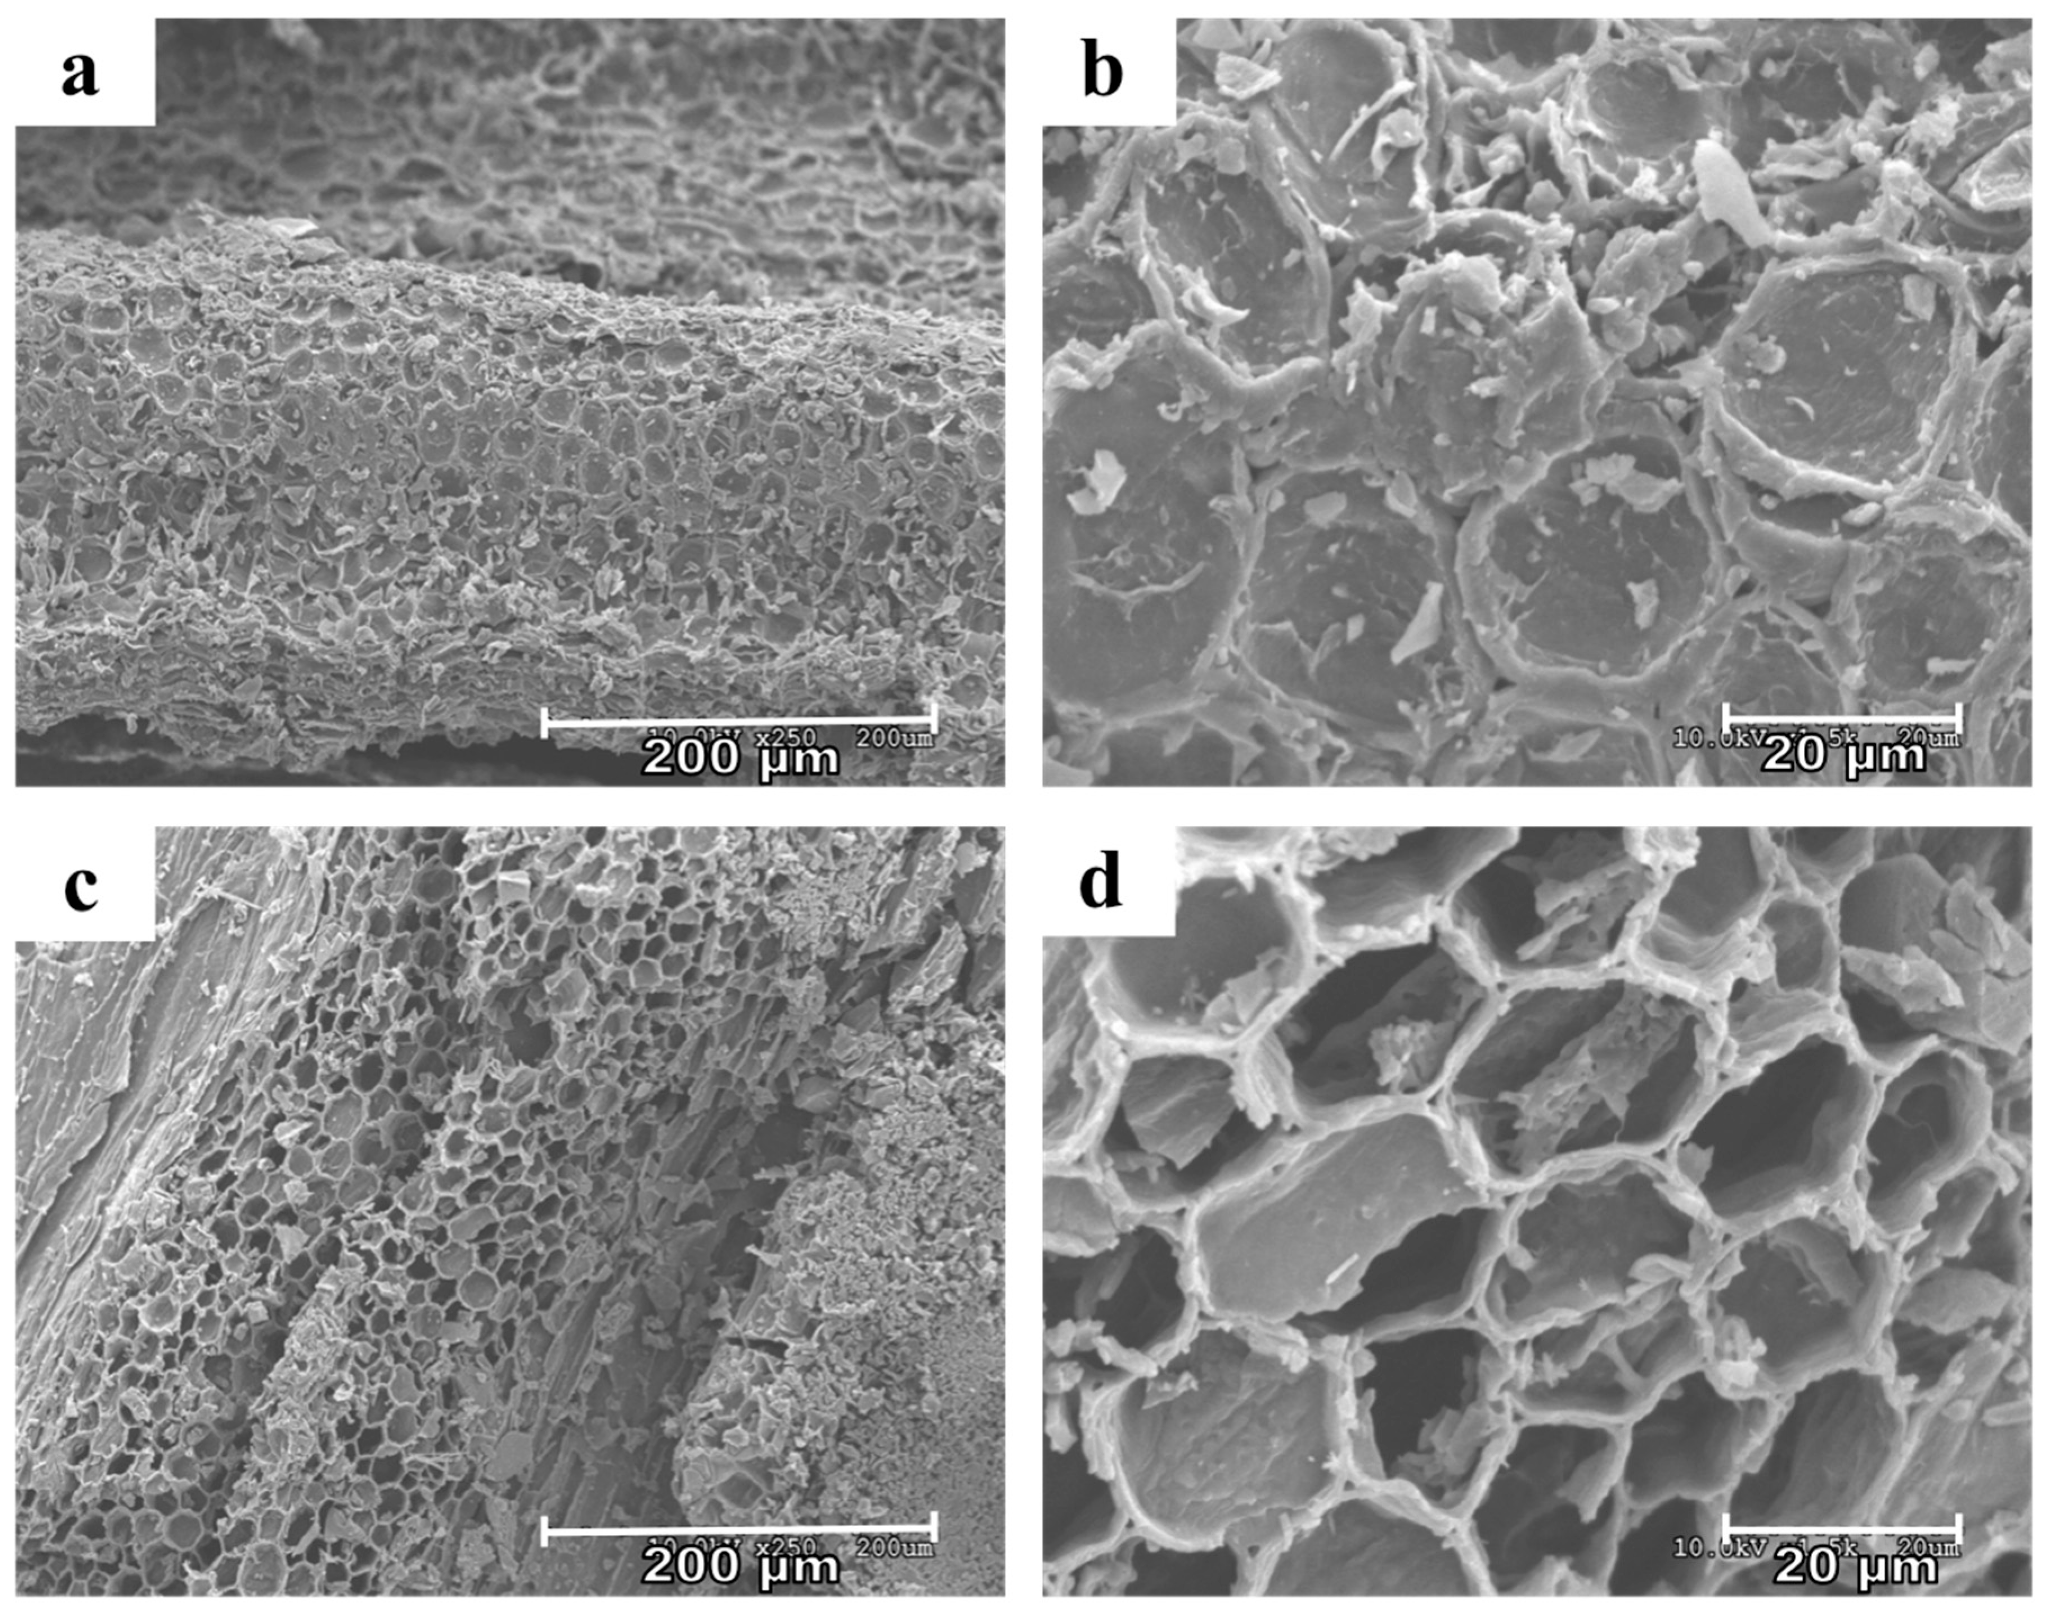
3.1. Biochar Activation Observations

Vigorous, rapid bubbling was observed upon the addition of H2O2 to the biochar, consistent with observations of effervescence by Lawrinenko et al. [21]. It is unclear whether the bubbling was due to reactions with the carbon structure of the material [28], or simply the decomposition of H2O2 catalyzed by metal oxides in the biochar ash component [29], or a combination of the two mechanisms. A variety of reactions have been reported following the exposure of biochar to H2O2, depending on the biochar properties [30] and activation conditions (e.g., pH, presence of ferrous salts [31]).
Once dry, the H2O2 activated G-350 biochar was noticeably lighter in color, shifting from a dark gray to a brownish hue (not shown). Alkaline H2O2 is commonly used in the bleaching of wood pulp and appears to have similar effects on low-temperature biochar. The bleaching effects of H2O2 on wood pulp have been attributed to the removal of chromophores and the breakdown of lignin [32]. However, the presence of transition metal ions is known to diminish the bleaching process by directly degrading the H2O2. Because bleaching effects are curtailed by metal-catalyzed degradation of H2O2 [32], the observed lightening of the biochar itself suggests that the H2O2 was not solely degraded by metals associated with the ash component.
The bulk composition of the G-350 biochar showed the following changes with activation: carbon content decreased from 62.7% to 59.2%, whereas nitrogen content increased from 1.06% to 1.15%, and oxygen content increased from 32.4% to 36.6% following H2O2 activation. The ash content of the biochar decreased from 10.5% to 3.5% following H2O2 activation. While other studies have observed a similar decrease in biochar carbon content with H2O2 treatments [16,30], changes may be affected by the source material. Huff and Lee [21] reported no changes in the bulk structure of a pinewood biochar (400 °C) with H2O2 treatments ranging from 1% to 30% H2O2. In the present study, the measured decrease in carbon could be due to either a loss of inorganic carbonates or organic carbon in the form of labile aliphatic groups. The loss of carbon can lead to the concentration of other elements. Because no new nitrogen atoms should be directly introduced by the H2O2 treatment, the increase in N suggests some degree of concentration due to mass loss. Furthermore, the reduction in the ash content could contribute to the concentration of N. In contrast, external O may be introduced on the biochar by activation, and the loss of ash may decrease the O content through the loss of oxides and carbonates. Therefore, bulk elemental analyses alone are not enough to confirm changes in the oxygen functionality of the material.
SEM images of G-350 (a and b) and G-350 H2O2 (c and d) are shown in Figure 2. Compared to the untreated biochar, the G-350 H2O2 has more open pores. The uncovering or opening of these pores likely resulted from the degradation of the more labile carbon (i.e., aliphatic groups) at the biochar surface by the H2O2. The oxidative degradation of carbon structures by H2O2 is a well-known reaction; for example, soils are often treated with H2O2 to remove organic matter [33]. The opening of pores via the removal of labile C is also supported by the decrease in C content following activation (62.7% to 59.2%).
ATR-FTIR spectra of H2O2 activated G-350 biochar, G-350, G-500 and G-900 are shown in Figure 3. The following peak identifications correspond with those reported by Li et al. [34]. The broad band between 3200 and 3600 cm−1 represents the O–H stretch from adsorbed water, while the peaks at 2921, 2855, and 1419 cm−1 result from aliphatic C–H. The presence of C=C and C=O stretching in aromatic rings are responsible for the peak at 1616 cm−1, and the peak at 1317 cm−1 was attributed to aromatic CO– and phenolic –OH groups. The peaks at 1018, 872, and 777 cm−1 likely result from the presence of silicate minerals (Si–O–Si) in the biochar samples, which is not surprising given that the G-350 biochar is over 10% ash. Alternatively, the peak at 777 cm−1 has been attributed to aromatic C–H stretching in biochar samples [21], and the peak at 872 cm−1 has been attributed to aromatic C–H as well as C–O from carbonates [35].
While the overall differences between the G-350 spectra before and after activation appear to be minor, slight changes in O functionality and aliphatic groups are evident. The G350 H2O2 spectrum suggests an increase in O-containing functional groups, most notably at 1310 and 1616 cm−1. A similar increase in O-groups was reported by Huff and Lee [27] following H2O2 activation of a 400 °C pinewood biochar at room temperature, as was an increase in the 775 cm−1 peak. Huff and Lee [27] proposed that the increase at 775 cm−1 represented an increase in C–H stretching, possibly resulting from the opening of aromatic rings. In contrast, the decreased intensity of the aliphatic bands near 2900 cm−1 observed in the present data suggests a decrease in aliphatic functional groups, which is consistent with their degradation by reactions with H2O2. Regarding the biochars prepared at 500 °C and 900 °C, there was a decreased in the intensity of the O–H stretching of the hydroxyl groups at 3424 cm−1, due to the loss of hydration, and the C–H stretching of the aliphatic vibration groups (2921–2855 cm−1). The disappearance of the phenolic –OH and aromatic CO also suggest a loss of functionality in these materials, as has been published previously [36,37], which would explain the observed sorption behavior.
Biochar produced at low temperatures generally have a variety of surface functional groups compared to high-temperature biochars, which more closely resemble aromatic graphitic carbon [35]. Limited decarbonylation and decarboxylation reactions take place below 350 °C, resulting in the presence of more polar surface groups, aliphatic groups, and a more amorphous character [10]. Typically, oxidative activation treatments add O to higher temperature biochars or charcoals in the case of activated carbon, which have limited functionality (i.e., flat FTIR spectra); therefore, the increase in O is clearly observable. However, it is unclear whether or not a similar oxygenation process is taking place on this low-temperature material with many pre-existing O groups. The FTIR data do not provide adequate evidence to determine whether the observed increase in the O-group peaks is from the addition of O (i.e., chemisorption of O on defect sites [30]), or if these peaks sharpen due to the removal of the aliphatic C groups (i.e., uncovering pre-existing atoms or concentrating their signal).
A key challenge in interpreting biochar FTIR spectra is that the peaks are the sum of interactions of difference groups, and the information is not often quantitative [38]; the magnitude of changes to biochar that were observed are not known. Furthermore, bands of mineral components can overlap the typical C–O and C–H peaks associated with the organic phase [39], which can lead to misinterpretations of the data. This may be particularly problematic for biochars with high ash contents, and in comparing biochars with different ash content or composition.
Biochar pH was strongly influenced by the treatment with H2O2, decreasing from 7.9 to 4.8 in H2O (7.5 to 4.5 in 0.01 M CaCl2). The pH decrease may be related to the changes in functionality (i.e., increased surface acidity) [21,40]. However, given the drastic nature of this decrease, it is likely other factors also play a role and the importance of metal oxides in the ash cannot be ruled out. In comparison, Huff and Lee [27] reported a 1.5 unit decrease in pH with 30% H2O2 treatment, but only a 0.1 unit decrease with 3% H2O2 for different wood biochars. The decrease in ash content with H2O2 treatment likely facilitated the observed decrease in pH.
Chemical activation had no measurable effect on the zeta potential of the G-350 biochar in DI water. The original G-350 and its activated counterpart had measured zeta potential values of −27.4 ± 2.2 mV and −26.4 ± 1.2 mV, respectively, in DI water, indicating a net negative surface charge. The biochar zeta potentials were less negative when measured in 0.01 M CaCl2 from the screening effects of the ions in solution (−10.4 ± 1.7 mV and −14.2 ± 1.6 mV for G-350 and G-350 H2O2, respectively), and G-350 H2O2 was significantly less negative than G-350 (t-test, p = 0.04).
The zeta potential was measured at the natural pH level of each biochar. Because zeta potential correlates with pH, if the variable-charge surface groups were unaltered, the lower pH of G-350 H2O2 would be expected to have a more positive zeta potential value. However, the unchanged value in DI water suggests more charge groups are present on the activated biochar, which is in agreement with the FTIR data.
H2O2 activation increased the water vapor SSA of G-350 by nearly 3-fold, from 47 to 140 m2 g−1. The increase in SSA with activation is consistent with the opening of pores visible in the SEM images (Figure 2). Though only macropores are clearly distinguishable on the scale imaged, the opening of additional micropores may have also contributed to the rise in SSA.
Isoteric heats of adsorption of water vapor (Ea values) were 23 and −43 kJ mol−1 for G-350 and G350 H2O2 biochars, respectively. Values that are more negative indicate more energetically favorable adsorption. Activation of G-350 by H2O2 increased the biochar surface’s affinity for water vapor, based on the large decrease in Ea. Water is a polar molecule; therefore, Ea values can be influenced by site-specific electrostatic interactions. It is possible that the newly developed (or uncovered) O-group nucleation sites are responsible for the observed decreased Ea with chemical activation. The decrease in aliphatic C-H observed in the FTIR spectra following activation, also supports this observed decrease in the G-350 biochar’s hydrophobicity [41].

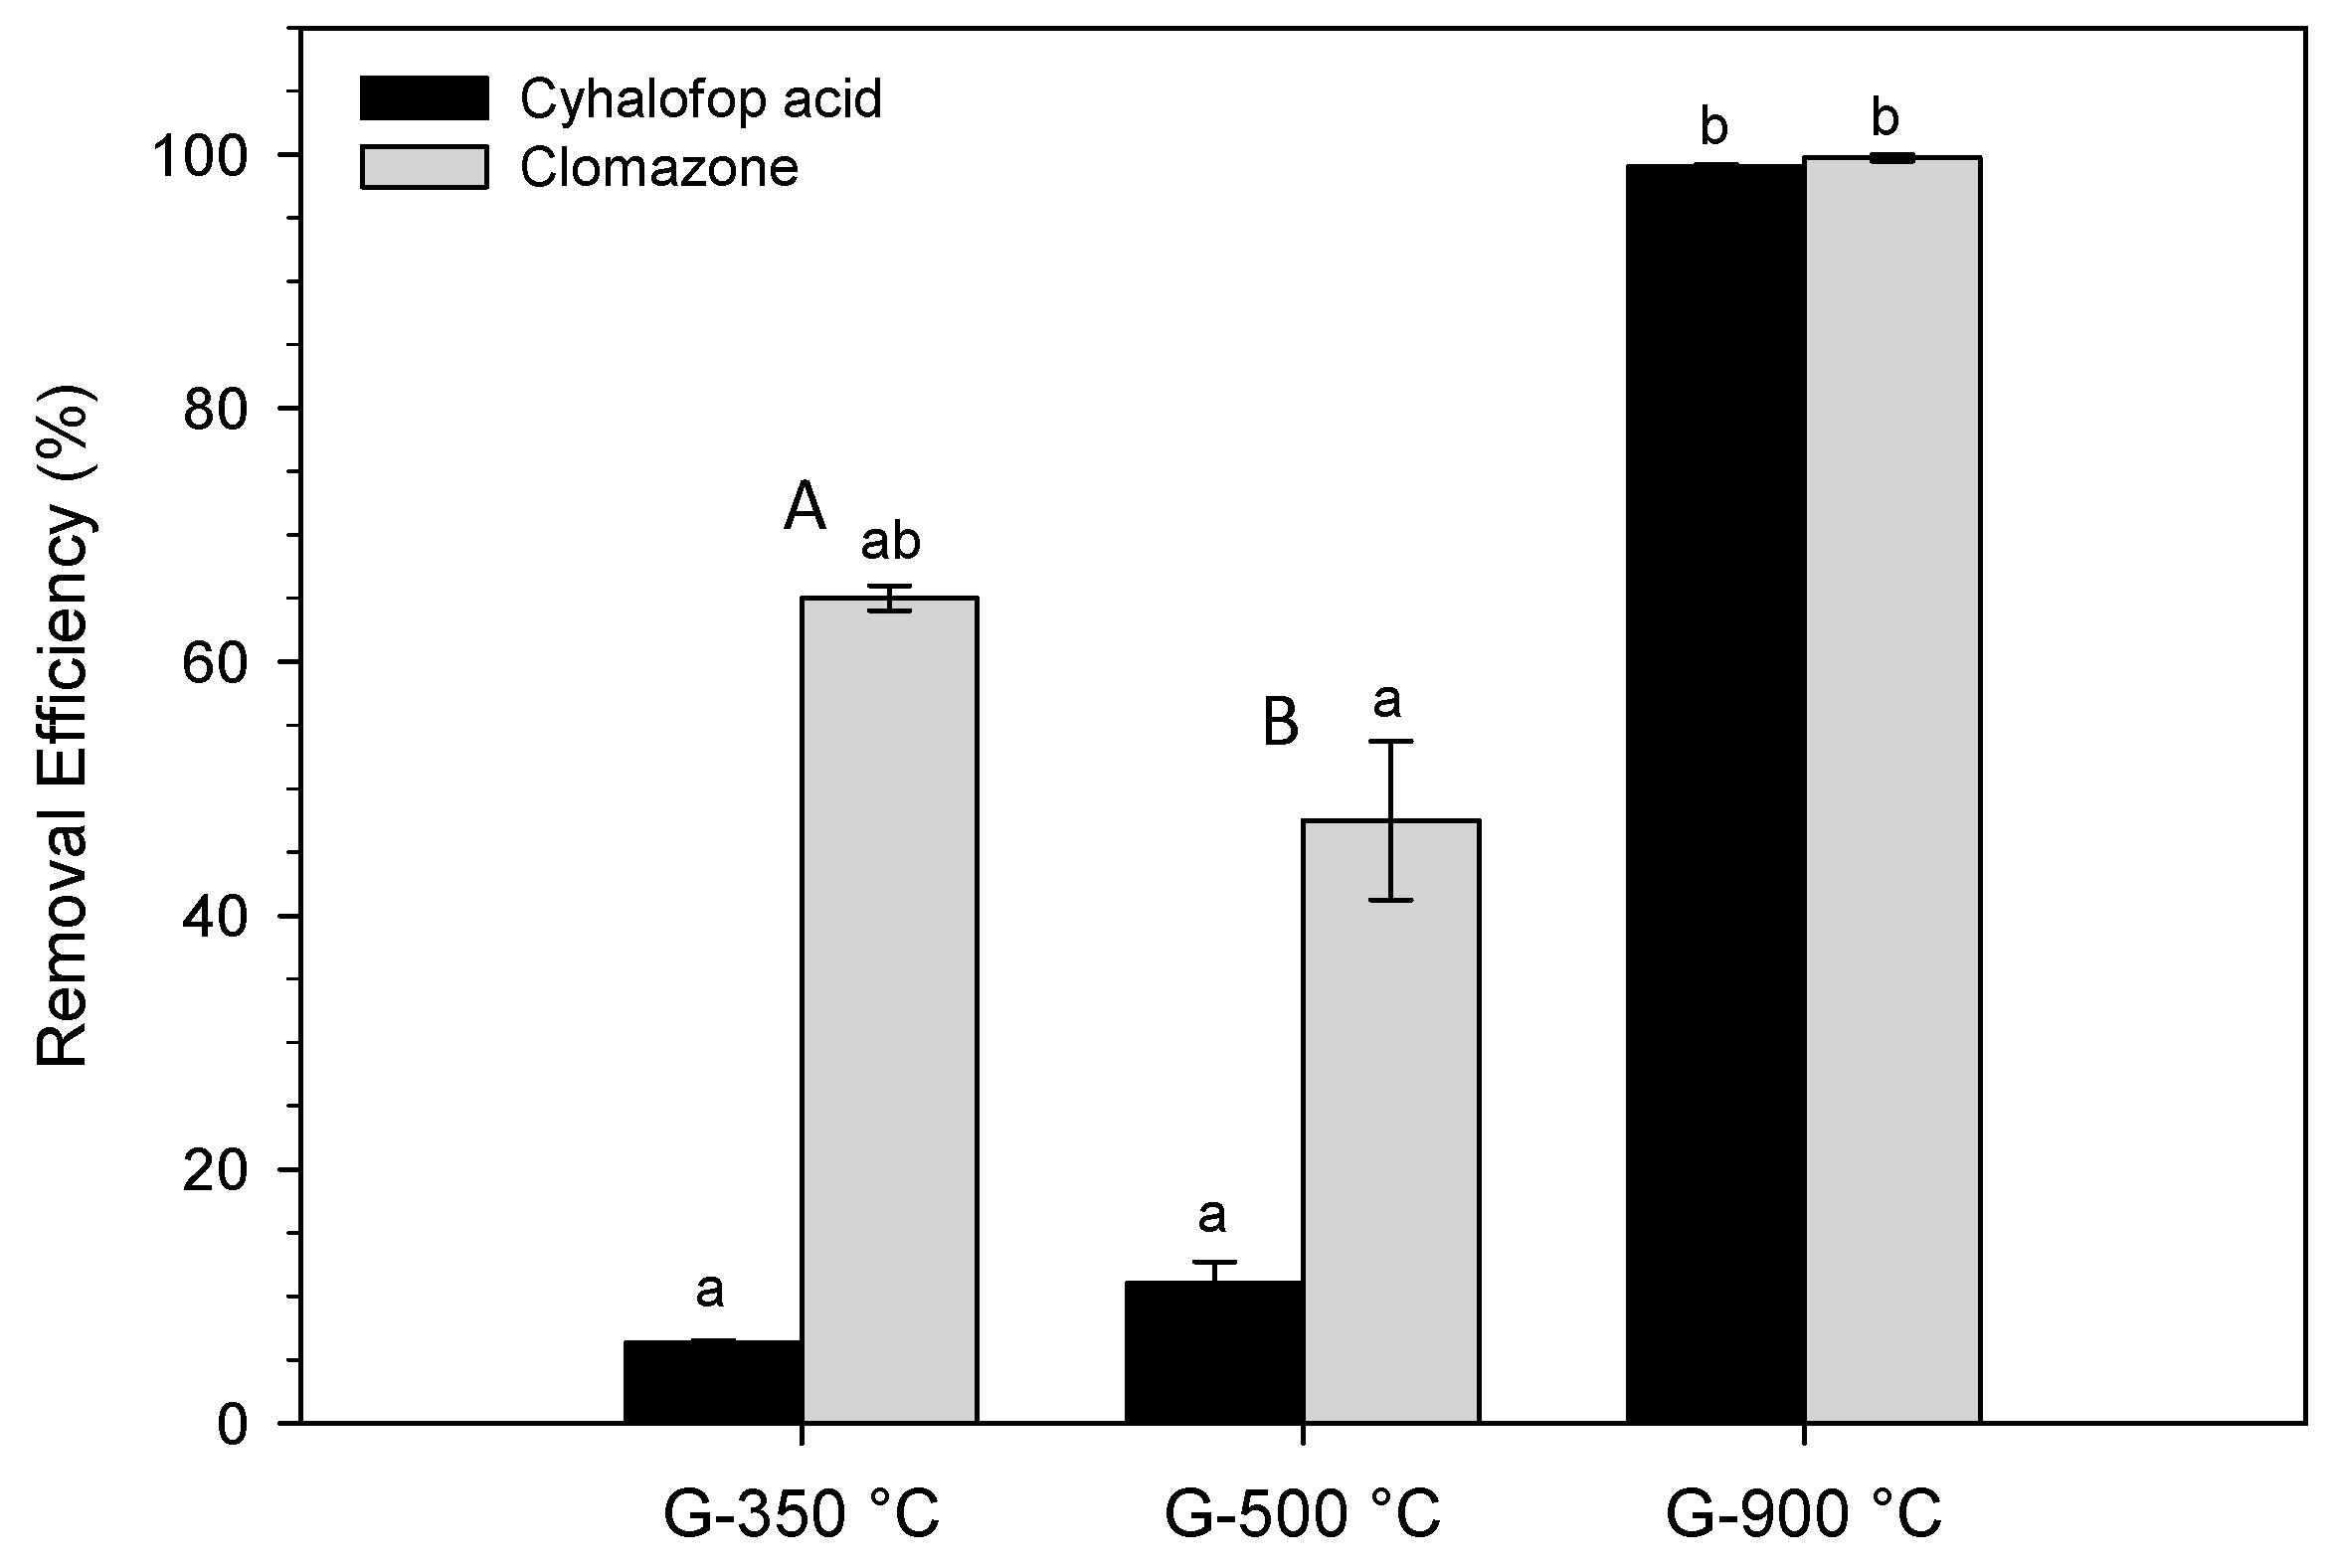
3.2. Herbicide Sorption

Activation of the G-350 biochar by H2O2 increased cyhalofop RE but did not significantly change clomazone RE as compared to unactivated biochar (Figure 4). In H2O, cyhalofop RE increased from 6.3% to 35.4%, while clomazone RE did not significantly increase (65.0% to 70.3%). Though a different activation method was employed (i.e., post-pyrolysis air oxidation), Xiao and Pignatello [12] similarly found that activation had a greater effect on organic acid adsorption than on neutral compounds.
Clomazone RE was greater than cyhalofop RE on both the G-350 (65.0% versus 6.3%) and G-350 H2O2 (70.3% versus 35.4%) biochars. This finding is consistent with the sorptive behavior of clomazone versus cyhalofop in soil, where average distribution coefficient normalized to total organic carbon, Koc, values are 300 and 186, respectively [42]. In previous work, clomazone was also sorbed greater than other anionic pesticide, byspiribac sodium, when the soil was amended with biochars prepared at 350 °C [27]. This was attributed to the presence of more amorphous organic matter within the carbonaceous matrix in biochar and further abundance of surface functional groups, according to higher O/C ratios, could favor specific chemical interactions, as reported for others polar organic compounds [27]. The scarce sorption of cyhalofop can be explained by its low pKa (3.9) which favors the predominance of the anionic form at most biochar pH levels (pH > 7). In its anionic form there would be reduced attraction to negatively charged surfaces. This electrostatic repulsion along with its low SSA values (<1 m2/g) has been the key factors cited for the low sorption of anionic pesticides on biochars [27].
The sorption isotherms were well-fitted to the Freudlich equation with R2 > 0.970 for all cases (Table 2) and they confirmed the trend observed for the RE (Figure 5). That is, the activation was only satisfactory for cyhalofop whereas no changes were registered for clomazone after the treatment of of G-350 with H2O2 (Figure 5). The Nf values < 1 registered for the activated biochar was an indication of the limited availability of sorption sites whereas for G350 closer to 1 suggesting more partitioning medium (Table 2). This fact has been associated with adsorption mechanism for others organic compounds in biochars [27].
To compare the effects of chemical activation to as opposed to thermal activation, REs of the untreated grape wood biochars (350, 500, and 900 °C) are shown in Figure 6. As seen with the activated biochar, clomazone sorption was significantly greater than cyhalofop sorption on both G-350 and G-500. Within the temperature series, the G-900 biochar had the greatest affinity for both herbicides, removing > 99% from solution, while the REs of G-350 and G-500 did not significantly differ from one another for either compound. The high RE of G-900 is consistent with the commonly reported trend of increased sorption with biochar production temperature, which is often attributed to increase in aromaticity and SSA with temperature (e.g., Chen et al. [10]). While the H2O2 activation of G-350 increased the RE of cyhalofop, the REs for both cyhalofop and clomazone remained much lower than with the G-900 biochar and were likely controlled by different sorption mechanisms.
The background solution had a significant impact on cyhalofop removal by both the untreated and H2O2 activated biochars; however, the effects were not consistent across the two materials (Figure 4). It is anticipated that adsorption will vary with solution ionic strength [9], consistent with that observed for cyhalofop on untreated G-350. Previous studies of aromatic acid sorption on carbonized sorbents have reported similar trends of increasing sorption with ionic strength [43], suggesting electrostatic-based mechanisms; however, other studies have reported no effect of ionic strength on organic acid sorption on biochar [44]. In contrast, cyhalofop sorption on G-350 H2O2 did not increase with ionic strength or follow any clear trend. The lower pH of the G-350 H2O2 biochar may have also dampened the screening or bridging effect of cations, as suggested by the lower magnitude of RE variability.
The effects of activation on G-350 biochar could be the results of a variety of mechanisms, i.e., changes in ash/mineral fraction, O functionality, aliphatic carbon, SSA, pH, zeta potential, π-interactions, or combinations thereof. If the mineral fraction of the biochar were actively involved in adsorption, we would expect to see a decrease in RE correlating to the decrease in % ash; however, this was not the case for either herbicide. Clomazone RE did not change, suggesting that the ash content has no effect. Cyhalofop RE increased, suggesting that the ash may have been blocking active binding sites [9], or otherwise altering properties that impact cyhalofop adsorption, specifically pH [45].
Both the bulk analysis and FTIR data suggest a slight increase in O functionality of the biochar surface following chemical activation. Because clomazone RE did not change with activation, there is no evidence to support direct interactions with these newly formed O groups. In contrast, the increase in cyhalofop RE on G-350 H2O2 suggests the new, or newly accessible, groups were influential; therefore, site-specific mechanisms such as charge-assisted hydrogen bonding (CAHB) may be critical for cyhalofop sorption.
The change in aliphatic C with activation can help in discerning the role of hydrophobic interactions. Unlike activated charcoals and high-temperature biochars where hydrophobicity is related to its large aromatic C structure, the hydrophobicity of low-temperature biochars arises from the presence of hydrophobic aliphatic functionalities [46,47]. The H2O2 activation appears to have degraded some of the aliphatic groups present on the original G-350 biochar, which should theoretically decrease the hydrophobicity of a low-temperature biochar surface. This was confirmed in our study by the decrease in water vapor Ea. Therefore, if the labile hydrophobic C were responsible for the removal of the herbicides, we would expect to see a decrease in RE. The unchanged RE of clomazone instead does not support hydrophobic effects with these non-aromatic groups. Similarly, the aliphatic groups did not appear to contribute to the removal of cyhalofop, and instead may have been preventing site-specific interactions with O groups.
The decrease in water vapor Ea with activation supports the decrease in biochar surface hydrophobicity; therefore, if hydrophobic effects were key in the sorption of either herbicide, decreased REs should have been observed. Water vapor adsorption data also identified an increase in SSA with activation. The increase in SSA corresponded to an increase in cyhalofop RE, but not clomazone RE, suggesting the newly exposed surfaces favored interactions with the ionizable compounds, or a removal of pore size restrictions for the slightly larger cyhalofop molecule.
Though porosity was not explicitly measured in this study, the increased SSA and SEM images suggest an increase in porosity with activation. While the SSA measurable by water vapor indicates a large increase, it is important to keep in mind that the larger clomazone and cyhalofop molecules cannot necessarily enter newly developed micropores accessible to the smaller water molecules. For all porous materials, pore filling is a potential removal mechanism; however, the data in this study do not support it as the dominant mechanism controlling adsorption on biochar. If pore filling were a dominant mechanism, we would expect to see both cyhalofop and clomazone adsorption increase following the H2O2 treatment, as both molecules are of similar size. Instead, only an increase in cyhalofop adsorption was observed. The treatment with 3% H2O2 at room temperature was relatively mild compared to other activation methods, such as thermal oxidation, where porosity has been shown to play a larger role in the increased organic chemical sorption (e.g., [7]).
Changes in pH arise from changes in the previously discussed biochar properties (i.e., ash content and surface functionality), but their effects must also be considered independently. Because pH influences the relative abundance of charged species for ionizable compounds such as cyhalofop, it is crucial to take into account changes in this distribution. As previously stated, pH was not adjusted in this experiment in order to fully account for the effect of activation and prevent further changes to the material. Based on the solution pH of the untreated G-350 biochar (pH 7.9), 100% of the cyhalofop would be present in its anionic form, while 89% is expected in the anionic form with the activated biochar (pH 4.8). Though important to note, this shift in species distribution does not appear to fully account for the >450% increase in cyhalofop RE with activation. Similarly, the slightly lower pH of the biochars in 0.01 M CaCl2 may contribute in part to the higher cyhalofop RE (compared to H2O), but other mechanisms such as cation bridging are also likely influential [48].
Zeta potential, likewise, is related to the aforementioned changes in biochar properties, as well as pH. For a negatively charged biochar surface, the general trend is for zeta potential to become less negative as pH decreases. Therefore, if we assume no change to the biochar surface with activation, the three-unit decrease in pH would be expected to result in a more positive zeta potential. However, we observed either no change (H2O) or a more negative (0.01 M CaCl2) zeta potential following activation, which is in agreement with the observed changes to the biochar surface chemistry. Because the net charge did not become more positive, non-site-specific electrostatic forces of the material would not be expected to favor a greater attraction of the anionic cyhalofop, again suggesting the importance of mechanisms such as CAHB with selected functional groups [44,49].
π–interactions (e.g., π–π overlap, polar –π) are often cited as adsorption mechanisms for the removal of organic compounds by biochar (e.g., antibiotics [48,50]), but most often are associated with high temperature biochars and activated charcoals. While many aromatic π-orbitals are present in the G-350 biochar, only small ring clusters exist within biochars produced at these low temperatures, and the structure is more amorphous than high temperature biochars [36]. Additionally, the presence of many functional groups, such as long aliphatic side chains, as have been registered by FTIR (Figure 3), can sterically hinder these interactions and influence the distribution of delocalized electrons.
Sorption mechanisms for organic compounds are often cited to shift from partitioning in the noncarbonized organic fraction to adsorption on the carbonized material as biochar pyrolysis temperatures increase [10]. However, partitioning is not specific mechanism that can be determined, but rather describes the removal of a sorbate from solution that follows a linear isotherm. Theoretically, the sorbate is dissolving into the organic matter; in the case of biochar, the noncarbonized (amorphous) fraction. Because partitioning is not a clearly defined mechanism, it is challenging to comment on its importance from the data in this study. However, if partitioning were occurring in the labile C fraction of the original biochar, we would have expected to see a decrease in RE with activation.
Numerous other mechanisms appear in the biochar literature (e.g., Van der Waals forces, hydrogen bonding, etc.); however, we cannot elucidate the individual contributions of each specific mechanism. It is also important to recall that multiple mechanisms simultaneously contribute to the observed net sorption. We can, however, begin to prioritize the mechanisms.

4. Conclusions

Characterization of a low temperature grape wood biochar before and after activation revealed that 3% H2O2 at room temperature, a relatively mild treatment, was sufficient to alter the surface chemistry of the biochar as well as the bulk composition. The activation induced changes improved the sorption of cyhalofop, but not clomazone, which suggests that H2O2 activation treatments may be of use for sorbing organic acid herbicides but is of little value in optimizing the removal of polar, non-ionizable compounds. However, the ability to target weak acid herbicides is particularly beneficial, as their anionic nature makes them particularly susceptible to leaching and contaminating groundwater. Furthermore, the demonstrated ability to improve sorption on a low temperature biochar is promising for agricultural use.
With regard to sorption mechanisms, it was found that neither ash, nor labile C (aliphatic groups) were key in the removal of cyhalofop and clomazone. Instead, cyhalofop removal appeared to be favored by the decreased pH with activation and the availability of O functionality; therefore, charge-based mechanisms such as CAHB are hypothesized to dominate its sorption by biochar. In contrast, the activation effects in this study suggest hydrophobic effects did not appear to be the driving mechanism. However, whether the similar mechanisms persist in the soil environment will need to be examined in future work. In particular, the localized effects of the H2O2-induced pH decrease should be studied to determine if this sorption-enhancing property remains effective in case of the other weak acid herbicides.

Author Contributions

The following summarize the contribution of the authors: conceptualization, K.H., B.G., K.A.S., and L.C.; methodology K.H., B.G., L.C., and K.A.S.; experimental investigation, K.H. and B.G.; experimental resources, K.A.S. and L.C.; writing—original draft preparation, K.H. and B.G.; writing—review and editing, B.G., K.H., L.C., and K.A.S.; visualization, K.H. and B.G.; supervision, K.A.S. and L.C.; project administration, L.C. and K.A.S.; funding acquisition, L.C., K.A.S., and K.H.

Funding

The Spanish Ministry of Science, Innovation and Universities (MICINN Project AGL2016-77821-R).

Acknowledgments

USDA is an equal opportunity provider and employer. K.H. would like to thank the University of Minnesota for a Thesis Research Travel Grant allowing for a visit to IRNAS-CSIC (Seville, Spain) and additional funding through a University of Minnesota Doctoral Dissertation Fellowship. Parts of this work were carried out in the Characterization Facility, University of Minnesota, which receives partial support from the National Science Foundation (NSF) through the Materials Research Science and Engineering Center (MRSEC) program. Special thanks to Jeff Novak and Don Watts for the biochar production from the USDA-ARS Florence, SC location. Special thanks also to William Koskinen for his assistance in reviewing an initial draft of this manuscript.

Conflicts of Interest

The authors declare no conflict of interest.

References

  1. Tan, X.; Liu, Y.; Zeng, G.; Wang, X.; Hu, X.; Gu, Y.; Yang, Z. Application of biochar for the removal of pollutants from aqueous solutions. Chemosphere 2015, 125, 70–85. [Google Scholar] [CrossRef] [PubMed]
  2. Ahmad, M.; Rajapaksha, A.U.; Lim, J.E.; Zhang, M.; Bolan, N.; Mohan, D.; Vithanage, M.; Lee, S.S.; Ok, Y.S. Biochar as a sorbent for contaminant management in soil and water: A review. Chemosphere 2014, 99, 19–23. [Google Scholar] [CrossRef] [PubMed]
  3. Hagemann, N.; Spokas, K.; Schmidt, H.P.; Kägi, R.; Böhler, M.A.; Bucheli, T.D. Activated carbon, biochar and charcoal: Linkages and synergies across pyrogenic carbon’s ABCs. Water 2018, 10, 1–19. [Google Scholar] [CrossRef]
  4. Rajapaksha, A.U.; Chen, S.S.; Tsang, D.C.W.; Zhang, M.; Vithanage, M.; Mandal, S.; Gao, B.; Bolan, N.S.; Sik, Y. Engineered/designer biochar for contaminant removal/immobilization from soil and water: Potential and implication of biochar modification. Chemosphere 2016, 148, 276–291. [Google Scholar] [CrossRef] [PubMed]
  5. Azargohar, R.; Dalai, A.K. Steam and KOH activation of biochar: Experimental and modeling studies. Microporous Mesoporous Mater. 2008, 110, 413–421. [Google Scholar] [CrossRef]
  6. Benzigar, M.R.; Talapaneni, S.N.; Joseph, S.; Ramadass, K.; Singh, G.; Scaranto, J.; Ravon, U.; Al-Bahily, K.; Vinu, A. Recent advances in functionalized micro and mesoporous carbon materials: synthesis and applications. Chem. Soc. Rev. 2018, 47, 2680–2721. [Google Scholar] [CrossRef] [PubMed]
  7. Pignatello, J.J.; Mitch, W.A.; Xu, W. Activity and reactivity of pyrogenic carbonaceous matter toward organic compounds. Environ. Sci. Technol. 2017, 51, 8893–8908. [Google Scholar] [CrossRef] [PubMed]
  8. Ifthikar, J.; Wang, J.; Wang, Q.; Wang, T.; Wang, H.; Khan, A.; Jawad, A.; Sun, T.; Jiao, X.; Chen, Z. Highly efficient lead distribution by magnetic sewage sludge biochar: Sorption mechanisms and bench applications. Bioresour. Technol. 2017, 238, 399–406. [Google Scholar] [CrossRef]
  9. Moreno-Castilla, C. Adsorption of organic molecules from aqueous solutions on carbon materials. Carbon N. Y. 2004, 42, 83–94. [Google Scholar] [CrossRef] [Green Version]
  10. Chen, B.; Zhou, D.; Zhu, L. Transitional adsorption and partition of nonpolar and polar aromatic contaminants by biochars of pine needles with different pyrolytic temperatures. Environ. Sci. Technol. 2008, 42, 5137–5143. [Google Scholar] [CrossRef]
  11. Spokas, K.A.; Cantrell, K.B.; Novak, J.M.; Archer, D.W.; Ippolito, J.A.; Collins, H.P.; Boateng, A.A.; Lima, I.M.; Lamb, M.C.; McAloon, A.J. Biochar: A synthesis of its agronomic impact beyond carbon sequestration. J. Environ. Qual. 2012, 41, 973–989. [Google Scholar] [CrossRef] [PubMed]
  12. Xiao, F.; Pignatello, J.J. Effects of post-pyrolysis air oxidation of biomass chars on adsorption of neutral and ionic compounds. Environ. Sci. Technol. 2016, 50, 6276–6283. [Google Scholar] [CrossRef]
  13. Kupryianchyk, D.; Hale, S.; Zimmerman, A.R.; Harvey, O.; Rutherford, D.; Abiven, S.; Knicker, H.; Schmidt, H.P.; Rumpel, C.; Cornelissen, G. Sorption of hydrophobic organic compounds to a diverse suite of carbonaceous materials with emphasis on biochar. Chemosphere 2016, 144, 879–887. [Google Scholar] [CrossRef]
  14. Liu, P.; Liu, W.J.; Jiang, H.; Chen, J.J.; Li, W.W.; Yu, H.Q. Modification of bio-char derived from fast pyrolysis of biomass and its application in removal of tetracycline from aqueous solution. Bioresour. Technol. 2012, 121, 235–240. [Google Scholar] [CrossRef]
  15. Lawrinenko, M.; Laird, D.A.; Johnson, R.L.; Jing, D. Accelerated aging of biochars: Impact on anion exchange capacity. Carbon N. Y. 2016, 103, 217–227. [Google Scholar] [CrossRef] [Green Version]
  16. Mia, S.; Dijkstra, F.A.; Singh, B. Aging induced changes in biochar’s functionality and adsorption behavior for phosphate and ammonium. Environ. Sci. Technol. 2017, 51, 8359–8367. [Google Scholar] [CrossRef] [PubMed]
  17. Gámiz, B.; Velarde, P.; Spokas, K.A.; Celis, R.; Cox, L. Changes in sorption and bioavailability of herbicides in soil amended with fresh and aged biochar. Geoderma 2019, 337, 341–349. [Google Scholar] [CrossRef]
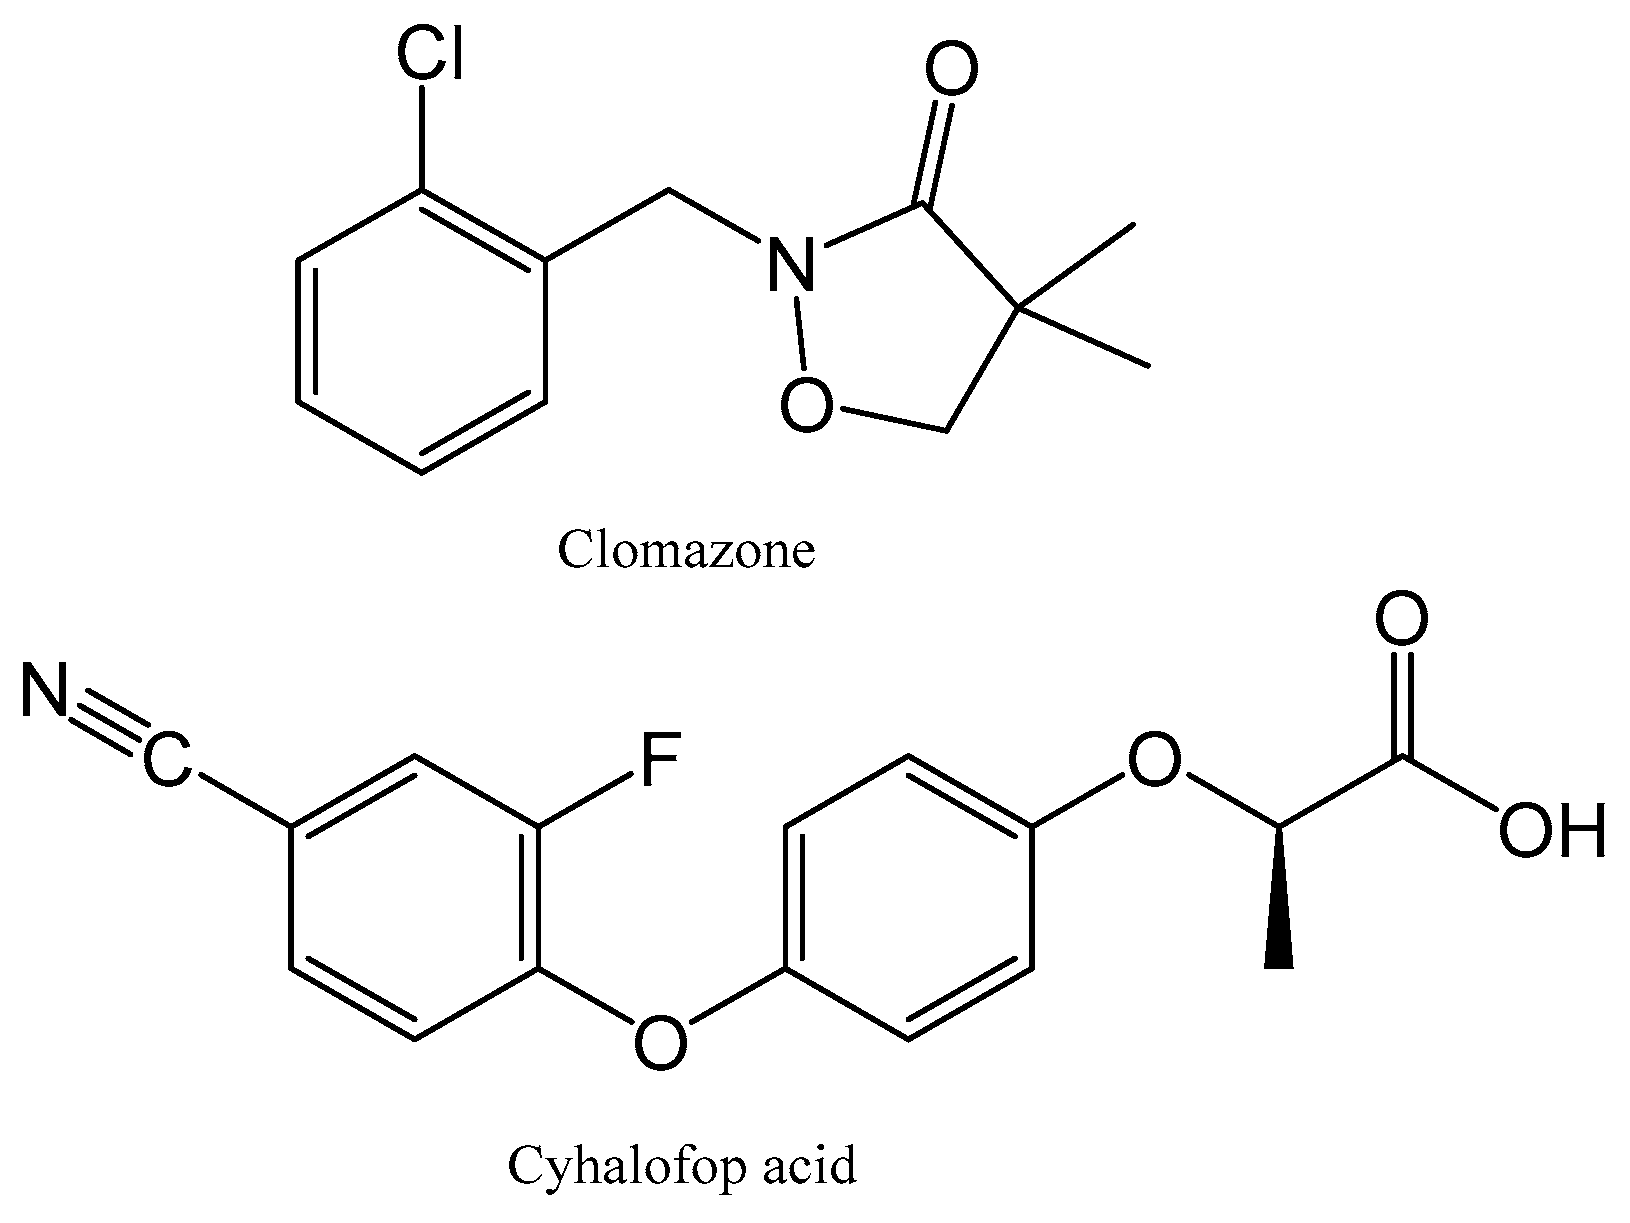
  18. Ray, P.G.; Pews, R.G.; Flake, J.; Secor, J.; Hamburg, A. Cyhalofop butyl: A new graminicide for use in rice. In Proceedings of the 10th Australian Weeds Conference and 14th Asian Pacific Weed Science Society Conference, Brisbane, Australia, 6 August–10 September 1993. [Google Scholar]
  19. Jackson, R.; Douglas, M. An aquatic risk assessment for cyhalofop-butyl: A new herbicide for control of barnyard grass in rice. In Proceedings of the Human and Environmental Exposure to Xenobiotics, Proceedings of the XI Symposium Pesticide Chemistry, Cremona, Italy, 11–15 September 1999; Volume 1999, pp. 345–354. [Google Scholar]
  20. Domingues, R.R.; Trugilho, P.F.; Silva, C.A.; De Melo, I.C.N.A.; Melo, L.C.A.; Magriotis, Z.M.; Sánchez-Monedero, M.A. Properties of biochar derived from wood and high-nutrient biomasses with the aim of agronomic and environmental benefits. PLoS ONE 2017, 12, 1–19. [Google Scholar] [CrossRef] [PubMed]
  21. Huff, M.D.; Lee, J.W. Biochar-surface oxygenation with hydrogen peroxide. J. Environ. Manage. 2016, 165, 17–21. [Google Scholar] [CrossRef]
  22. McDermot, H.L.; Arnell, J.C. Charcoal sorption studies. II The sorption of water by hydrogen treated charcoals. J. Phys. Chem. 1954, 58, 492–498. [Google Scholar] [CrossRef]
  23. Medic, D.; Darr, M.; Shah, A.; Rahn, S. Effect of torrefaction on water vapor adsorption properties and resistance to microbial degradation of corn stover. Energy & Fuels 2012, 26, 2386–2393. [Google Scholar]
  24. Rockland, L.B. Saturated salt solutions for static control of relative humidity between 5o and 40C. Anal. Chem. 1960, 32, 1375–1376. [Google Scholar] [CrossRef]
  25. OECD (Economic Co-operation and Development). Guideline 106: Adsorption—Desorption Using a Batch Equilibrium Method; OECD Publishing: Paris, France, 2000; ISBN 9789264069602. [Google Scholar]
  26. Wu, J.; Wang, K.; Zhang, Y.; Zhang, H. Determination and study on dissipation and residue determination of cyhalofop-butyl and its metabolite using HPLC-MS/MS in a rice ecosystem. Environ. Monit. Assess. 2014, 186, 6959–6967. [Google Scholar] [CrossRef]
  27. Gámiz, B.; Velarde, P.; Spokas, K.A.; Hermosín, M.C.; Cox, L. Biochar soil additions affect herbicide fate: Importance of application timing and feedstock species. J. Agric. Food Chem. 2017, 65, 3109–3117. [Google Scholar] [CrossRef]
  28. Yang, J.; Pignatello, J.J.; Pan, B.; Xing, B. Degradation of p -nitrophenol by lignin and cellulose chars: H2O2 -mediated reaction and direct reaction with the char. Environ. Sci. Technol. 2017, 51, 8972–8980. [Google Scholar] [CrossRef] [PubMed]
  29. Lousada, C.M.; Yang, M.; Nilsson, K.; Jonsson, M. Catalytic decomposition of hydrogen peroxide on transition metal and lanthanide oxides. J. Mol. Catal. A Chem. 2013, 379, 178–184. [Google Scholar] [CrossRef]
  30. Fry, H.S.; Milstead, K.L. The action of hydrogen peroxide upon simple carbon compounds. III. Glycolic acid. J. Am. Chem. Soc. 1935, 57, 2269–2272. [Google Scholar] [CrossRef]
  31. Gellerstedt, G.; Pettersson, I. Chemical aspects of hydrogen peroxide bleaching-Part II the bleaching of kraft pulps. J. Wood Chem. Technol. 1982, 23, 231–250. [Google Scholar] [CrossRef]
  32. Robinson, W.O. The determination of organic matter in soils by means of hydrogen peroxide. J. Agric. Res. 1927, 34, 339–356. [Google Scholar]
  33. Li, F.; Shen, K.; Long, X.; Wen, J.; Xie, X.; Zeng, X.; Liang, Y.; Wei, Y.; Lin, Z.; Huang, W.; et al. Preparation and characterization of biochars from Eichornia crassipes for cadmium removal in aqueous solutions. PLoS ONE 2016, 11, e0148132. [Google Scholar] [CrossRef]
  34. Kloss, S.; Zehetner, F.; Dellantonio, A.; Hamid, R.; Ottner, F.; Liedtke, V.; Schwanninger, M.; Gerzabek, M.H.; Soja, G. Characterization of slow pyrolysis biochars: Effects of feedstocks and pyrolysis temperature on biochar properties. J. Environ. Qual. 2012, 41, 990. [Google Scholar] [CrossRef]
  35. Keiluweit, M.; Nico, P.S.; Johnson, M.G.; Kleber, M. Dynamic molecular structure of plant biomass-derived black carbon (biochar). Environ. Sci. Technol. 2010, 44, 1247–1253. [Google Scholar] [CrossRef]
  36. Trigo, C.; Cox, L.; Spokas, K. Influence of pyrolysis temperature and hardwood species on resulting biochar properties and their effect on azimsulfuron sorption as compared to other sorbents. Sci. Total Environ. 2016, 566–567, 1454–1464. [Google Scholar] [CrossRef]
  37. Shafeeyan, M.S.; Daud, W.M.A.W.; Houshmand, A.; Shamiri, A. A review on surface modification of activated carbon for carbon dioxide adsorption. J. Anal. Appl. Pyrolysis 2010, 89, 143–151. [Google Scholar] [CrossRef]
  38. Rhoads, C.A.; Senftle, J.T.; Coleman, M.M.; Davis, A.; Painter, P.C. Further studies of coal oxidation. Fuel 1983, 62, 1387–1392. [Google Scholar] [CrossRef]
  39. Li, X.; Shen, Q.; Zhang, D.; Mei, X.; Ran, W.; Xu, Y.; Yu, G. Functional groups determine biochar properties (pH and EC) as studied by two-dimensional 13C NMR correlation spectroscopy. PLoS ONE 2013, 8, e65949. [Google Scholar] [CrossRef]
  40. Kinney, T.J.; Masiello, C.A.; Dugan, B.; Hockaday, W.C.; Dean, M.R.; Zygourakis, K.; Barnes, R.T. Hydrologic properties of biochars produced at different temperatures. Biomass and Bioenergy 2012, 41, 34–43. [Google Scholar] [CrossRef]
  41. PPDB Pesticides Properties Database. Available online: http://sitem.herts.ac.uk/aeru/bpdb/index.htm (accessed on 25 September 2019).
  42. Sigmund, G.; Sun, H.; Hofmann, T.; Kah, M. Predicting the sorption of aromatic acids to noncarbonized and carbonized sorbents. Environ. Sci. Technol. 2016, 50, 3641–3648. [Google Scholar] [CrossRef]
  43. Ni, J.Z.; Pignatello, J.J.; Xing, B.S. Adsorption of aromatic carboxylate ions to black carbon (biochar) is accompanied by proton exchange with water. Environ. Sci. Technol. 2011, 45, 9240–9248. [Google Scholar] [CrossRef]
  44. Cao, X.; Harris, W. Properties of dairy-manure-derived biochar pertinent to its potential use in remediation. Bioresour. Technol. 2010, 101, 5222–5228. [Google Scholar] [CrossRef]
  45. Gray, M.; Johnson, M.G.; Dragila, M.I.; Kleber, M. Water uptake in biochars: The roles of porosity and hydrophobicity. Biomass Bioenergy 2014, 61, 196–205. [Google Scholar] [CrossRef]
  46. Zornoza, R.; Moreno-Barriga, F.; Acosta, J.A.; Muñoz, M.A.; Faz, A. Stability, nutrient availability and hydrophobicity of biochars derived from manure, crop residues, and municipal solid waste for their use as soil amendments. Chemosphere 2016, 144, 122–130. [Google Scholar] [CrossRef]
  47. Jia, M.; Wang, F.; Bian, Y.; Jin, X.; Song, Y.; Kengara, F.O.; Xu, R.; Jiang, X. Effects of pH and metal ions on oxytetracycline sorption to maize-straw-derived biochar. Bioresour. Technol. 2013, 136, 87–93. [Google Scholar] [CrossRef]
  48. Li, X.; Gámiz, B.; Wang, Y.; Pignatello, J.J.; Xing, B. Competitive sorption used to probe strong hydrogen bonding sites for weak organic acids on carbon nanotubes. Environ. Sci. Technol. 2015, 49, 1409–1417. [Google Scholar] [CrossRef]
  49. Peng, B.; Chen, L.; Que, C.; Yang, K.; Deng, F.; Deng, X.; Shi, G.; Xu, G.; Wu, M. Adsorption of antibiotics on graphene and biochar in aqueous solutions induced by π-π interactions. Sci. Rep. 2016, 6, 31920. [Google Scholar] [CrossRef]
  50. Sun, K.; Jin, J.; Keiluweit, M.; Kleber, M.; Wang, Z.; Pan, Z.; Xing, B. Polar and aliphatic domains regulate sorption of phthalic acid esters (PAEs) to biochars. Bioresour. Technol. 2012, 118, 120–127. [Google Scholar] [CrossRef]
Figure 1. Chemical structures of clomazone and cyhalofop herbicides.
Agronomy 09 00588 g001
Figure 2. Scanning Electron Microscope (SEM) images of (a) the untreated G-350 (250×); (b) the untreated G-350 (1.5k×); (c) G-350 H2O2 (250×); (d) G-350 H2O2 (1.5k×.) biochars.
Agronomy 09 00588 g002
Figure 3. Fourier transform infrared spectroscopy (FTIR)-attenuated total reflection (ATR) spectra of H2O2 activated G-350 biochar, G-350, G-500, and G-900.
Agronomy 09 00588 g003
Figure 4. Removal efficiency (RE) of G-350 biochar with and without H2O2 activation for cyhalofop and clomazone. Error bars represent the standard error of the mean (n = 3). Lowercase letters indicate significant differences between RE means with and without activation for individual chemical/solution pairs (p < 0.05). Uppercase letters indicate significant differences among background solutions for each biochar (p < 0.05).
Agronomy 09 00588 g004
Figure 5. Sorption isotherms for cyhalofop and clomazone on G-350 and activated G-350 with H2O2.
Agronomy 09 00588 g005
Figure 6. Removal efficiency (RE) of grape wood biochars for cyhalofop and clomazone in deionized (DI) water. Error bars represent the standard error of the mean (n = 3). Different lowercase letters indicate significant differences among temperatures for individual herbicides (p < 0.05). Uppercase letters indicate a significant difference between cyhalofop and clomazone REs for each biochar (p < 0.05).
Agronomy 09 00588 g006
Table 1. Biochars properties.
FeedstockPyrolysis Temperature (°C)Moisture %Ash %VM 1 %C %H %N %O %SSA 2 (m2 g−1)
Grape wood3503.510.939.566.64.01.117.5< 1
Grape wood5004.016.819.370.42.30.99.6< 1
Grape wood9001.322.26.671.60.11.04.9124
1 Volatile matter; 2 Specific surface area determined by N2 sorption.
Table 2. Freundlich Coefficients for cyhalofop and clomazone sorption isotherms on G-350 and G-350-H2O2.
G-350 G-350-H2O2
HerbicideKfNfR2KfNfR2
Cyhalofop13.9 (12.6–15.4) 10.92 ± 0.09 20.97048.3 (44.6–52.4)0.75 ± 0.070.976
Clomazone284 (264–306)0.81 ± 0.050.990284 (265–305)0.74 ± 0.040.990
1 Values in parentheses correspond to the range in the values of the Freundlich coefficient; 2 values ± standard error.

