Article

Alley Cropping Increases Land Use Efficiency and Economic Profitability Across the Combination Cultivation Period

1
College of Soil and Water Conservation, Beijing Forestry University, Beijing 100083, China
2
College of Resources and Environmental Sciences, China Agricultural University, Beijing 100193, China
3
College of Resources and Environment Science, Hebei Agricultural University, Baoding 071001, China
4
Beijing Collaborative Innovation Center for Eco-Environmental Improvement with Forestry and Fruit Trees, Beijing 102206, China
5
Ji County Station, Chinese National Ecosystem Research Network (CNERN), Beijing 100083, China
6
Key Laboratory of State Forestry Administration on Soil and Water Conservation, Beijing Forestry University, Beijing 100083, China
7
Beijing Institute of Water, Beijing 100048, China
*
Author to whom correspondence should be addressed.
Agronomy 2019, 9(1), 34; https://doi.org/10.3390/agronomy9010034
Submission received: 24 October 2018 / Revised: 3 January 2019 / Accepted: 11 January 2019 / Published: 15 January 2019

Abstract

:
Alley cropping allows the famer to effectively use available resources and yield more benefits. Choosing suitable associated crop and mitigating the competition between trees and crops are crucial for designing the alley cropping systems. We conducted a long-term experiment, including apple (Malus pumila)/peanut (Arachis hypogaea), apple/millet (Setaria italica) and apple/maize (Zea mays) alley cropping systems with conventional intercropping distance, and corresponding monocultures (Exp.1), and a short-term experiment with improved intercropping distance in the same three combinations (Exp.2) in the Loess Plateau, China. The results showed crop yields in three alley cropping systems were lower than the corresponding monocultures. Apple yields were significantly constrained by millet and maize in the alley cropping systems, but not sensitive to the presence of peanut. Land equivalent ratios (LERs) ranged from 0.44 to 0.89 before the tree bore fruit. The LERs were greater than 1.0 after the tree bore fruit, and the apple trees made a decisive contribution to the land use advantage. Net present values of three alley cropping systems were on average 60.1% higher than the corresponding monocultures across the alley cropping period. The maximum annual present value in the first–fifth, sixth and seventh–ninth years after the alley cropping establishment was observed in the apple/maize, apple/millet and apple/peanut system, respectively. These results highlight that choosing the optimal alley cropping management and suitable associated crops at different years after establishment may allow farmers to increase the land use efficiency and economic profitability.

1. Introduction

One of the greatest challenges associated with climate change, food security, and deteriorating agricultural resource base, is how to develop viable farming systems that make full use of the arable land and increase farmers’ revenues. Agroforestry provides an elegant solution to the challenges, allowing farmers to effectively use available land resources with lower environmental costs, and yielding varied products at different times [1]. Alley cropping is an agroforestry practice where trees are planted in rows, creating alleyways for cultivating agricultural crops during the early years of tree growth [2]. This is an economically beneficial approach for agriculture, which generates short-term income from annual crops and also provide medium- to long- term products from trees or shrubs.
However, a drawback of combining trees with field crop is that they may compete for light, water, and nutrient, particularly in areas where the available resources are limited [3]. Many researchers found that alley cropping reduced the tree yield and/or crop yield due to competition, but its land equivalent ratio (LER) was still greater than 1.0 [4,5,6]. Although crop yield is reduced by 17.4%–22.8% with the trees, the alley cropping increases 32.7% of tree yield and shows a higher LER (1.76–2.60) [7]. Alley cropping is an efficient land use pattern because the addition of the crop to the tree fields can more than compensate the loss of the tree yield [8]. However, little is known about whether the appropriate intercropping distance between trees and crops can reduce the competition and lead to a higher land use efficiency; and whether the competition tends to be intense with the widening of tree canopies and roots over time [9].
Trees take several years to bear fruit, and planting trees is a long-term investment [10,11], and associated crops are especially attractive to farmers who wish to add short-term profitability. Contrary to the wealth of information on the biological and physical processes of agroforestry [12,13], comparatively less researches is available concerning economic profit. Its improved and sustainable profitability is a powerful advantage, which has spurred the adoption of this practice in numerous regions throughout the world [14,15,16]. Rahman suggested that agroforestry systems had a higher net present value and benefit-cost ratio than the two separate cultivations [17]. Economic returns from different agroforestry practices show varied net benefits in different stages of agroforestry, and additional crops ensure a greater net benefit to the participants [18]. Economic analysis of agroforestry would provide reliable information to famers on the potential profitability of these practices, but little knowledge is available on the effects of associated crop on the net economic benefit.
To address the above limitations, a long-term experiment (Exp.1), including apple (Malus pumila)/peanut (Arachis hypogaea), apple/millet (Setaria italica), and apple/maize (Zea mays) alley cropping systems, and the corresponding monocultures, was conducted from 2005 to 2013 (from first to ninth year after the alley cropping establishment). The yield, light transmittance and root horizontal extent in Exp. 1 was measured to improve the intercropping distance between trees and crops. Then, the improved intercropping distance was applied in the same three combinations as Exp.1, with the nine stages after establishment, to test the land use efficiency and economic performance in 2014 (Exp.2).

2. Materials and Methods

2.1. Site Description

Field experiments were located in Ji County (36°06′26.3” N, 110°35′38.9” E) of Shanxi Province, China. Jixian is a typical fragmented and gully area. This area experiences temperate monsoon climate with warm moist summer and cold dry winter. During the growing season, from April to October, the accumulated temperature above 10 °C is 3050 °C, the sunshine duration is 1498 h and the rainfall is 521 mm. The precipitation in this period accounts for more than 90% of the annual precipitation. The soil is loess with homogeneous, porous and typically non-stratified properties. Apple (Malus pumila) is widely planted in this area, for example 18,700 hectares of 22,000 hectares of arable land were planted with apple trees in 2016, and apple-based alley cropping was extremely popular.

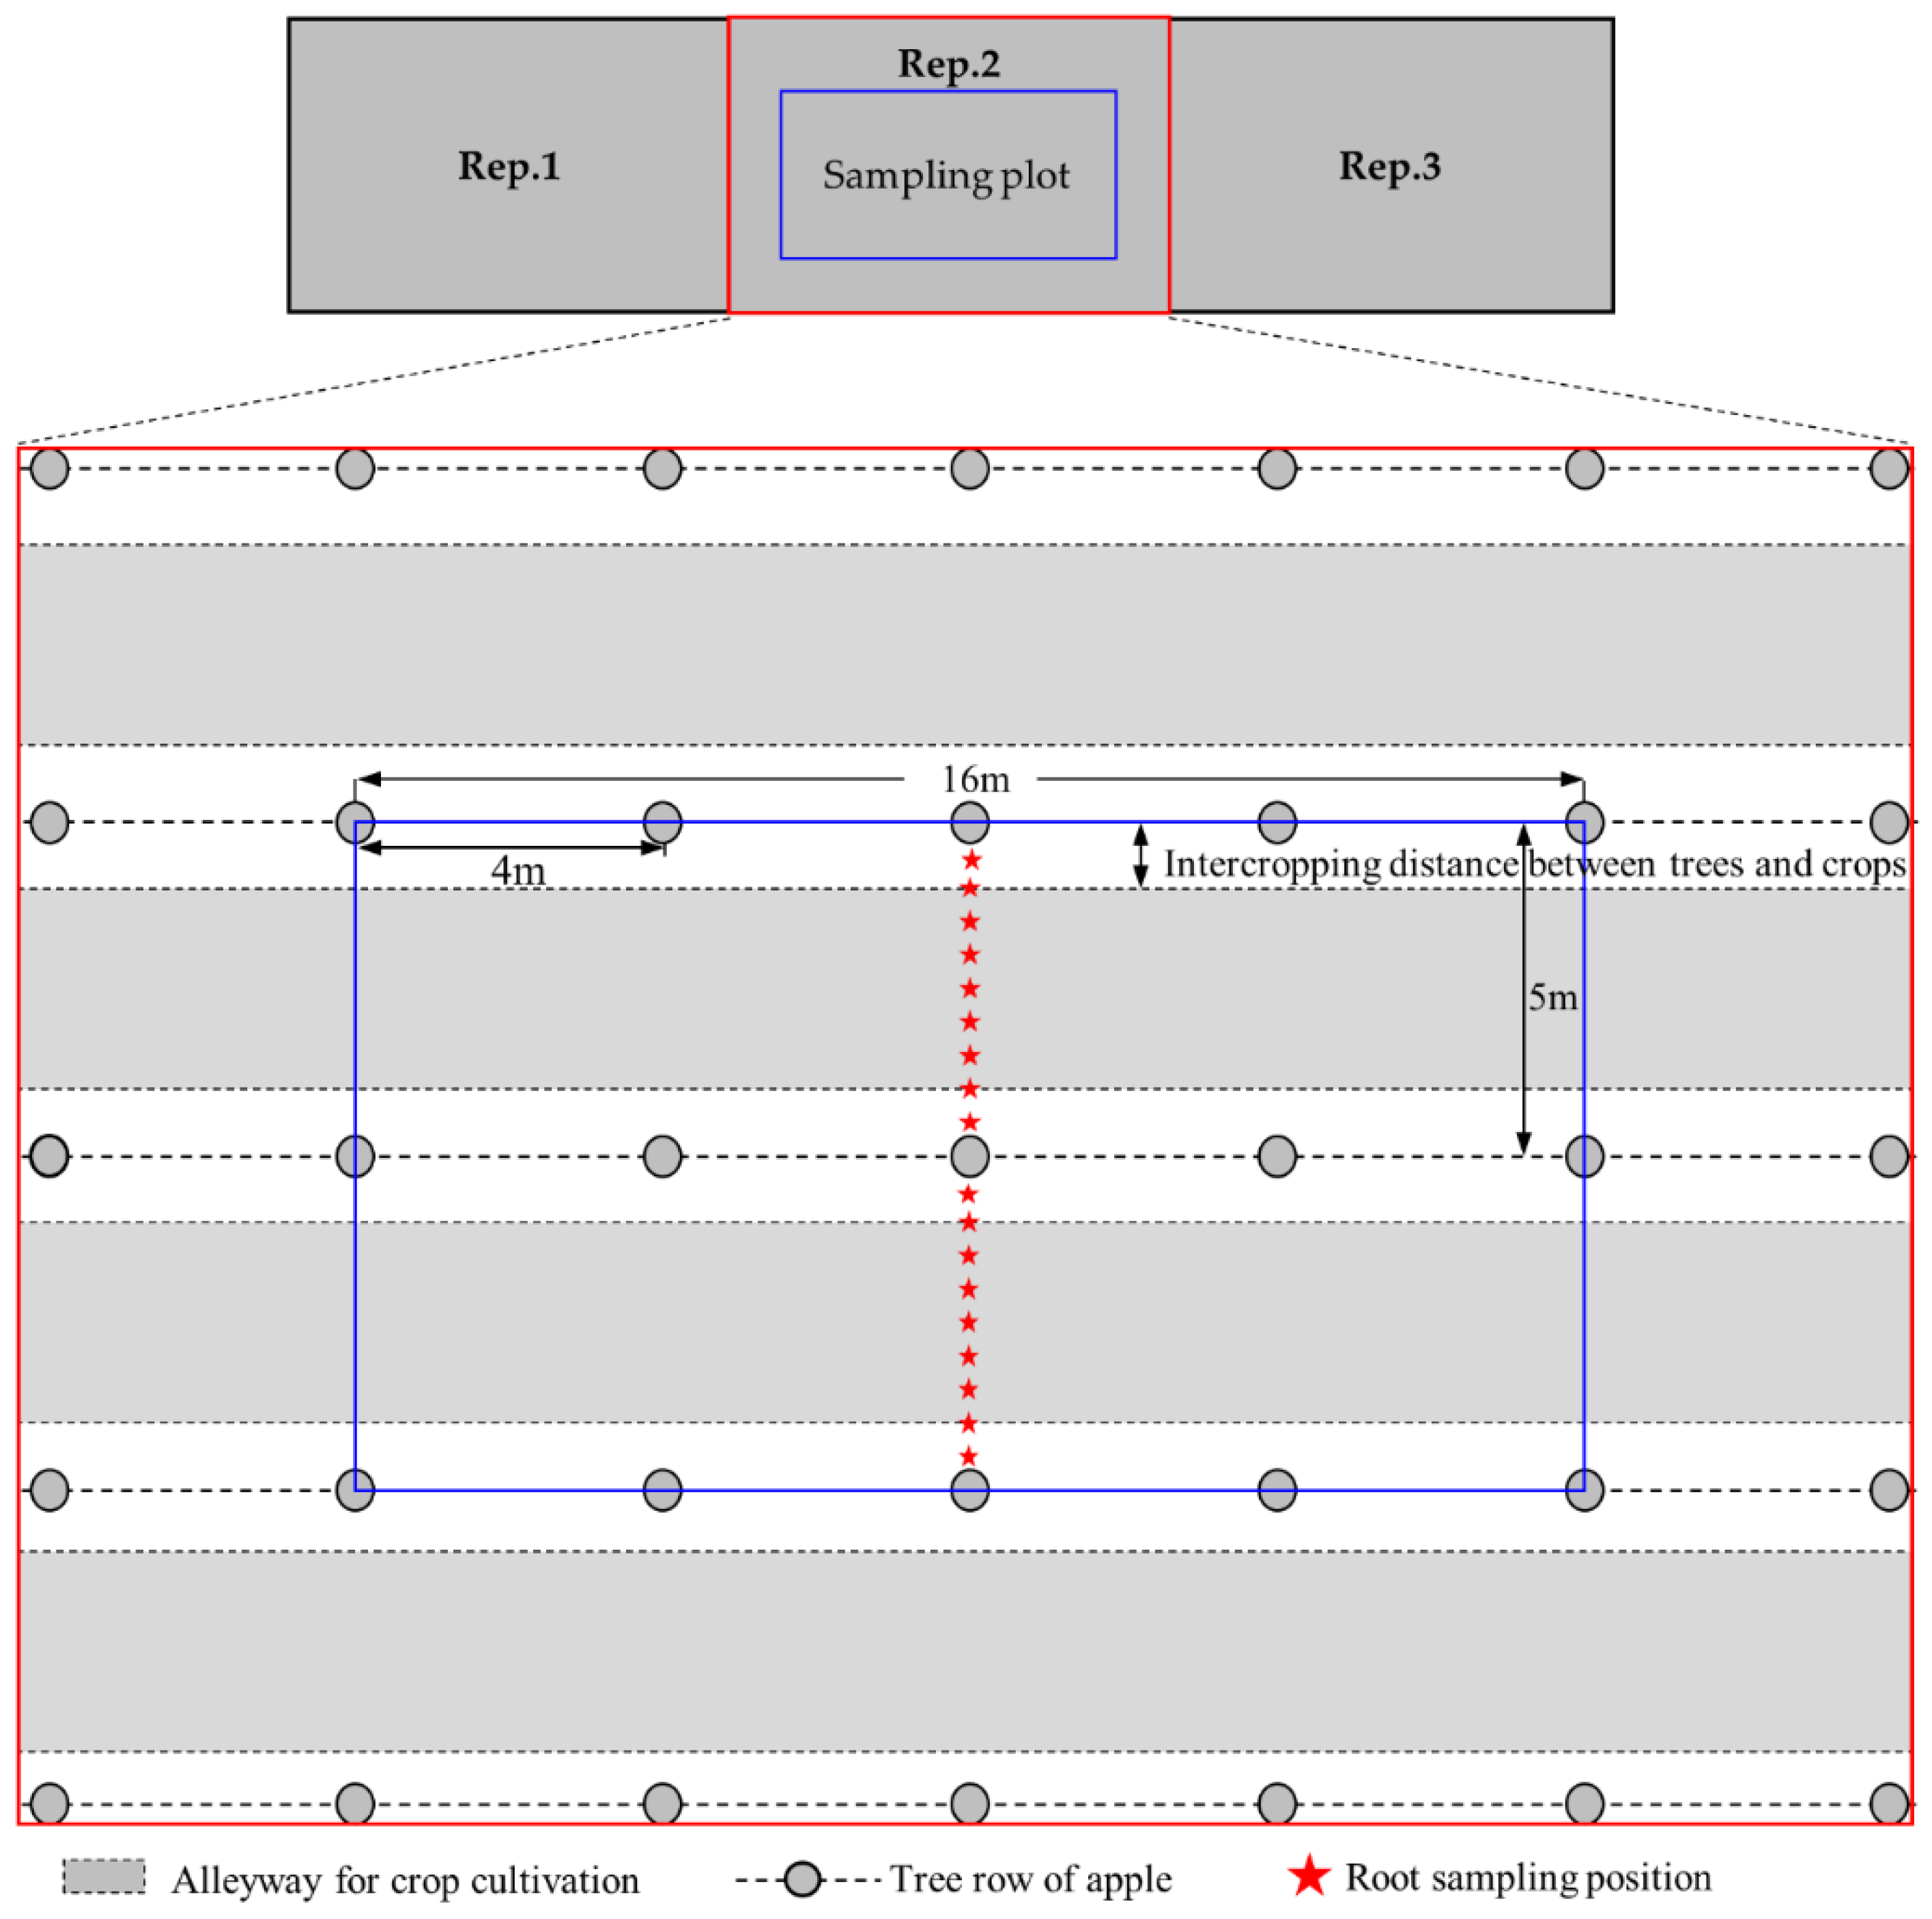
2.2. Experimental Design

2.2.1. A long-Term Experiment

A long-term experiment (Exp.1) was conducted in an apple demonstration garden of Ji County from 2005 to 2013 (matching first–ninth year-old apple trees). Apple trees in alley cropping systems and sole apple system were planted with a spacing of 4 m between trees and a spacing of 5 m between tree rows. Crops were cultivated in the alleyway between the tree rows. The row spacing of crops was set to 0.5 m, and the planting density of peanut, millet, and maize was 150,000 plants ha−1, 400,000 plants ha−1, and 67,500 plants ha−1 respectively. The trees and crops were planted in a north-south orientation. Intercropping distance between trees and crops was dynamically adjusted to match the tree growth, and crops were cultivated beyond the canopy edge of apple trees, based on the conventional management of farmers. Three alley cropping systems, including apple/peanut (Arachis hypogaea) system, apple/millet (Setaria italica) system, apple/maize (Zea mays) system, and corresponding sole apple, sole peanut, sole millet and sole maize systems were compared. Crop rotation was employed to mitigate the build-up of pathogens and pests in Exp.1 either for intercropped or sole crops. Peanut-millet-maize rotation, millet-maize-peanut rotation and maize-peanut-millet rotation was applied at first, second and third year of the alley cropping systems, respectively. This pattern was circulated during the fourth–sixth years and seventh–ninth years after the alley cropping establishment. Each sampling plot of the alley cropping system and sole apple system was 160 m2 (10 m in width, perpendicular to the tree row, and 16 m in length, parallel to the tree row), with three tree rows and two alleyways (Figure 1). Each sampling plot of the sole crop system was 50 m2, including 10 crop rows (5 m in width and 10 m in length). The sampling plot of alley cropping systems was designed in the central region of the experiment block, avoiding the border effect on the growth and yield of both trees and crops (Figure 1). The distance between alley cropping plots (or sole apple plots) and sole crop plots is 10 m to separate the border effect of trees on sole crops. Three replications (blocks) for each cropping system were designed.
Cultivars were Fuji in Siberian crab (Malus baccata) rootstock for apple, Jinhua-8 for peanut, Jingu-21 for millet and Jindan-65 for maize. Apple trees were planted on 28 March 2005. Crops were sown from 20 April to 15 May every year. Plants were harvested from 20 September to 10 October every year.
Each mid-October, 12 kg plant−1 and 30 kg plant−1 of organic fertilizer was applied as the base fertilizer for the first-fifth and sixth-ninth year-old apple trees, respectively. The organic fertilizer is sheep manure, including organic matter 30.34%, N 0.85%, P2O5 0.57% and K2O 0.51%. In addition, 1.2 kg plant−1 and 2.0 kg plant−1 of compound fertilizer was used for the first-fifth and sixth-ninth year-old apple trees, respectively. 50% of the compound fertilizer was mixed into the organic fertilizer, 30% was applied to trees when the apple tree sprouted, and 20% was used on 1 July. The compound fertilizer contains N 15%, P2O5 15% and K2O 15%. Sole trees and intercropped trees were applied the same fertilizers and fertilization application rate. The compound fertilizer was applied to the alleyways at a rate of 600 kg ha−1 in the apple/maize and apple/millet systems, and at a rate of 200 kg ha−1 in the apple/peanut system. The same fertilizers and fertilization application rate were adopted by sole crops and intercrops. Since no irrigation was practiced in this experimental area, trees and crops completely depend on the rainfall.
Measurements were taken on apple trees and crops for the following three variables: (i) Root horizontal extent. We designed nine sampling points in the alley cropping systems and apple monoculture, which were located at 0.5 m, 1.0 m, 1.5 m, 2.0 m, 2.5 m, 3.0 m, 3.5 m, 4.0 m, 4.5 m from the tree row respectively. Roots were collected with a vertical soil profile at four depth intervals of 0–10 cm, 10–20 cm, 20–40 cm and 40–60 cm. Roots of the trees and crops were sampled by the root core method in mid-July each year after establishment. (ii) Light transmittance. Incident radiation below plant canopy was obtained by the LI-191R (LI-COR, Lincoln, NB, USA). One cardinal point was above the tree canopy. Nine cardinal points (0.5 m, 1.0 m, 1.5 m, 2.0 m, 2.5 m, 3.0 m, 3.5 m, 4.0 m and 4.5 m from the tree row) below the apple canopy but above the crop canopy were designed. One sampling point was above the maize canopy in the monoculture. Six sampling points were designed at 0 m, 0.1 m, 0.2 m, 0.3 m, 0.4 m, 0.5 m from the border row of the sole maize, respectively, and 1.5 m above ground. Daily light interception of the trees and maize during 08:00 to 18:00 was obtained by measuring the photosynthetically active radiation (PAR) under the canopy. Accumulated light interception of apple trees during the crop growing season was calculated by summing the daily values of light interception. But the accumulated light interception of maize was only measured from eighth leaf blade (V8) to harvest. Canopy shading is one minus the ratio between the accumulated PAR below and above the canopy. (iii) Yield. Yields were measured from all trees and crops in the sampling plot, and then weighed on an electronic scale to determine the yield per unit area.

2.2.2. A Short-Term Experiment

A short-term experiment (Exp.2) neighboring the long-term experiment was arranged in 2014. This experiment designed three same apple/crop systems and one apple monoculture system as the Exp.1 with different alley cropping stages (from first to ninth year after establishment), and the corresponding crop monocultures. Plant materials and planting parameters in this experiment were the same as that in Exp.1. But the improved intercropping distance, which was determined by the measurement parameters in Exp.1 (Section 2.3), was applied in this experiment. The design of all sampling plots and blocks was also the same as that in Exp.1.
Crops were sown on 2 May. The Exp.2 adopted the same field management as Exp.1. Apple yields were measured on 2 October. Peanut and millet were harvested on 7 September. Maize was harvested on 24 September. The yields of apple and crops were taken to evaluate the land use efficiency and economic performance.

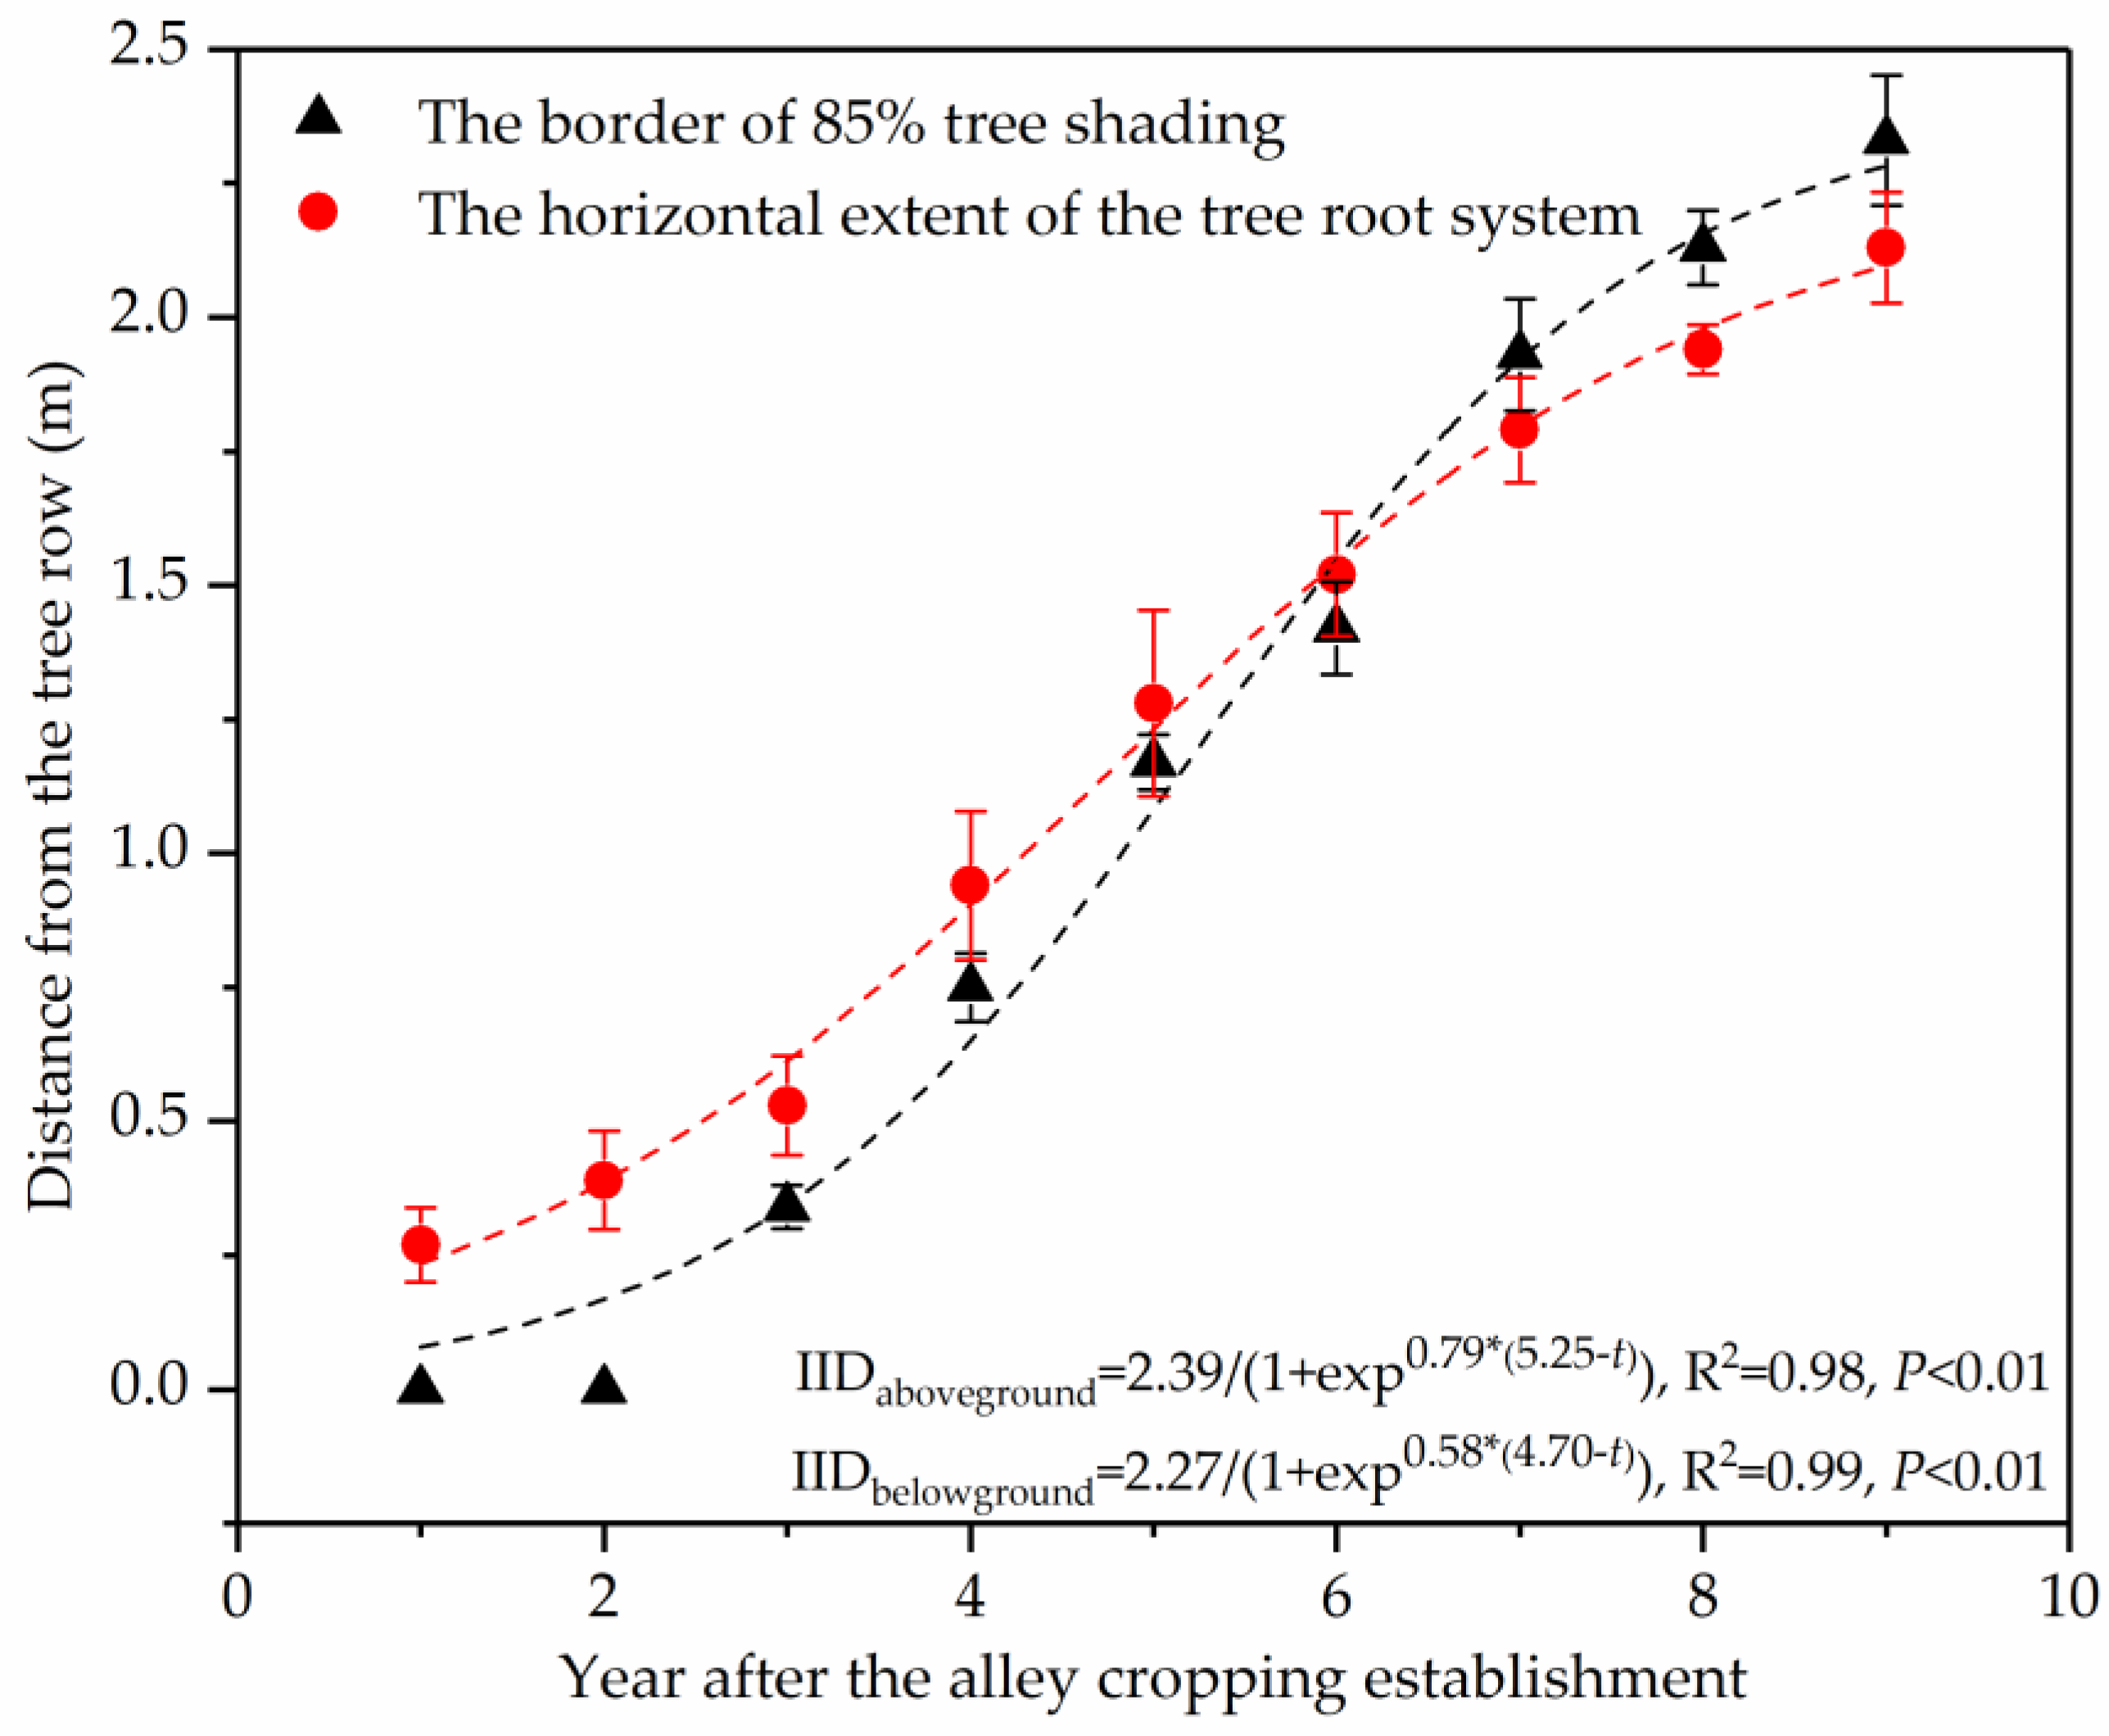
2.3. Intercropping Distance between Apple Trees and Crops

Optimized distance between trees and crops should be determined by the interspecific interaction, especially for the competition for resources which is the primary factor restricting the component growth processes in agroforestry [19]. The interspecific competition is divided into two separate components: Aboveground light interception from the canopy, and belowground competition for soil moisture and nutrient. Therefore, we assumed that niche separation of aboveground and belowground parts in alley cropping systems is favorable to gain greater products for farmers. The distance would be improved by this method compared the conventional intercropping distance from the farmer’ practice.
Light interception of the canopy was employed to evaluate the effects of the light competition in alley cropping systems. The light interception above 85% significantly deceases the yield of peanut, millet and maize, compared to the full light [20,21,22], and revenues of those crops may barely cover their production costs. Therefore, we adopted the same 85% light limit for three crops to easily calculating the threshold effect of tree shading for intercrops. Meanwhile, the threshold also means that crop canopy located outside the border. In this study, 25 cm (half row spacing) represented the canopy radius of peanut and millet, and was preformed to regulate the crop canopy beyond the border. Not only that, but the light interception of maize canopy on apple trees was also involved into the calculation of the aboveground intercropping distance. Greater height (more than 2.7 m) and canopy cover of maize reduce the available light and yield of apple trees, which has a lower height (below 1.5 m) of the clear bole and leader branches [23]. The light transmittance of the maize canopy is less than 15% in the middle of maize rows [24]. Therefore, the improved intercropping distance in aboveground part (IIDaboveground) was presented as a summation of the border of 85% tree shading from the tree row and canopy radius of peanut or millet (or 85% maize shading). The border of 85% canopy shading of the tree and maize was calculated by the regression equation between the light sampling positions and measured light transmittance. The north-south orientation of the tree lines also brought about a symmetrical effect of tree shading on intercrops. A logistical growth model, using ordinary least squares, is fitted to the periodic growth data [25]. The light transmittance of tree canopy and horizontal distribution of the tree root system were observed in monoculture systems of Exp.1. Those measured values were programmed in the logistic growth model to calculate the border of 85% tree shading and horizontal extent of the tree root system. The IIDaboveground was calculated as follows:
IID aboveground = W tree + W crop
W tree = a 1 + exp k ( t 0 t )
where, Wtree is the border of 85% tree shading; Wcrop is the canopy radius of peanut and millet, or the border of 85% maize shading; a is the asymptotic maximum border of 85% tree shading during the alley cropping period, k is the relative growth rate of the border of 85% tree shading, t0 is the time taken to reach the maximum growth rate of the border of 85% tree shading, and t is the year after the alley cropping establishment. The parameters, including a, b, t0 etc., were obtained from the logistical regression equation, when growth indicators of trees were fitted by the logistical model in the software, Origin Pro 2017 (Origin Lab, Northampton, MA, USA).
Root distribution of trees and crops can be used to identify the major area of interspecific competition for soil water and nutrient [26]. Schroth clarified that niche separation of the tree and crop roots was the key to species coexistence in agroforestry [27]. However, Cardinael et al. concluded that root overlap had a positive effect on creating vertical segregation of the root systems and spatial complementarity, and induced deeper rooting of walnut trees to obtain deeper water in the Mediterranean region [28]. Our previous study found that apple roots in alley cropping was increased in the deeper 60 cm of soil (the main soil layer of crop roots) compared to sole apple, and root separation in the upper 60 cm of soil could still provide the opportunity of which apple trees exploited the deeper soil resources [29]. Therefore, the root separation was regarded as a criterion to improve the intercropping distance in belowground part (IIDbelowground). The results in Exp.1 showed the roots of the intercropped apple were lower than that of sole apple, but the root horizontal extent of intercropped trees is the same as that of sole apple [29]. This phenomenon allows that the root distribution of sole apple was used in the calculations of intercropped apple roots. Our results also detected that the root radius of sole peanut was not greater than 25 cm. The horizontal roots of sole millet reached up to 50 cm, but 90% roots were also located within 25 cm. More than 85% of sole maize roots are distributed within 25 cm from the crop row [30]. And, 25 cm (half row spacing) was administered to design the root horizontal extent for all crops, and which was conductive to the calculation of the IIDbelowground. The IIDbelowground was calculated by the following equation:
IID belowground = W tree + W crop
W tree = b 1 + exp k ( t 0 t )
where, W′tree is the horizontal extent of the tree root system; W′crop is the horizontal extent of crop root system; b is the asymptotic maximum horizontal extent of the tree root system during the alley cropping period, k′ is the relative growth rate of tree roots, t0 is the time taken to reach the maximum growth rate of tree roots, and t′ is the year after the alley cropping establishment.
Considering that the optimized distance between trees and crops was identified jointly by the aboveground and belowground competition, the improved intercropping distance (IID) based on the measurement parameters in Exp.1 was formulated as:
IID = m a x ( IID aboveground + IID belowground )

2.4. Economic Analysis

Economic data were collected from the incurred costs and received benefits in the agricultural production process in Exp.2. The arable land has been free for smallholders in China since 2006. Labor costs for landowners with agricultural systems was valued at zero in this study, but they need to hire workers to pick the apple and harvest the grain of crops. The annual depreciation costs for agricultural machinery were calculated from the purchasing price and expected service life of the machinery. Fuel and maintenance costs of agricultural machinery were recorded based on the actual needs. Costs of planting (or sowing) and management, including rootstock seedlings, planting, rootstock seedlings, replanting, graft seedlings, grafting, blossom and fruit thinning, seed, tillage, sowing, fertilizer, pesticide, and other materials, were determined with reference to the local market prices.
The yields of apple trees and crops were valued at the price that farmers sell to local vendors, and converted into monetary value to evaluate the benefits. All economic data were calculated using the constant prices and real discount rates from 2014. Costs and benefits were settled in US Dollar (USD), and 1 USD equaled 6.12 Chinese Yuan (CNY) on 31 December 2014.
Traditionally, there are two basic problems in relation to alley cropping economics: (1) Whether such practices are economically feasible compared with the sole cropping, and (2) which crop species are optimal in terms of profitability. For the long-term investment, net present value (NPV) was used to estimate the total economic profitability over the entire alley cropping period among various planting systems in terms of the current criterion [31]. Present value (PV) was applied to determine the annual revenue in different intercropping years discounted to the present. The PV means future revenues (actual profitability without discount at a given year) are discounted at the interest rate, which is always less than the future value because money has interest-earning potential. This characteristic refers to as the time value of the money. This term is the key to properly valuing whether farmers are earning at a certain point in time. The following formula was used to compute the PV and NPV.
P V t = B t C t ( 1 + i ) t
N P V = P V 1 + P V 2 + P V 3 + + P V t = t = 1 n B t C t ( 1 + i ) t
where, PVt is the present value at the tth year after alley cropping establishment, Bt is the revenue of the cropping system per unit area at the tth year, Ct is the cost of the cropping system per unit area at the tth year, i is the interest rate (guiding rate of return), and t is the year after establishment. NPV is the summation of the present value of each year during the alley cropping period, n is the total number of the period. The NPV is commonly calculated on a per hectare and annual basis.

2.5. Statistical Analysis

The border of 85% tree shading and horizontal extent of the tree root system was simulated by the logistical growth model 1 using the Origin Pro 2017 (Origin Lab, Northampton, MA, USA). Analyses of variance (ANOVA) of the data were performed using the SPSS 20.0 (IBM, Armonk, NY, USA). Means were used to simulate the trajectories of intercropping distance between apple trees and crops. Means were compared to evaluate the economic indicators of apple trees and annual crops under the tested treatments.

3. Results

3.1. Yields

Alley cropping decreased the yields of both apple and associated crops in Exp.1 (Table 1). Yield of intercropped peanut ranged from 2.67 t ha−1 at the first year to 1.93 t ha−1 at the ninth year, on average 13.4% lower than the sole peanut. Yield of intercropped millet ranged from 2.93 t ha−1 at the first year to 1.90 t ha−1 at the ninth year, on average 15.5% lower than the millet monoculture. Yield of intercropped maize ranged from 9.91 t ha−1 at the first year to 5.56 t ha−1 at the ninth year, on average 17.9% lower than the sole maize. The relatively low crop yields in the alley cropping systems could be attributed to the increased competition from the apple trees, especially in the sixth–ninth years after the apple tree bore fruit (Table 1). The three crops also showed a decreased yield in the alley cropping systems across the alley cropping period in Exp.2 (Table S1).
Apple yield of apple/peanut system was not significantly affected by the alley cropping in Exp.1 (Table 1). Apple yield of apple/millet system was obviously lower than the apple monoculture at the seventh and ninth years in Exp.1 (Table 1). The presence of maize had no effect on apple yield only at the eighth year in Exp.1 (Table 1). But the associated crops were not significantly reduced the apple yields in all alley cropping system in Exp.2 (Table S1).

3.2. Intercropping Distance between Apple Trees and Crops

The variation of 85% tree shading and horizontal extent of the tree root system during the alley cropping period were well fitted by the logistical growth model. the correlation coefficients were above 0.98 (Figure 2). The border of 85% tree shading and horizontal extent of the tree root system showed a consecutive widening with the increasing years after establishment. The horizontal extent of the tree root system was larger than the border of 85% tree shading during the first–sixth years, but the phenomenon was converted after the seventh year.
IID was represented by an analog IID and an operable IID (Table 2). The analog IID means a theoretical value of the interactional border between trees and crops, that is, analog alleyway width was derived from the tree row spacing minus the competitive interface. However, the practical alleyway width was designed as the multiple of the crop row spacing, so that the analog IID was tailored to the practical production, namely, the operable IID. The IIDs showed a successive increase during the alley cropping period, which was fueled by the tree growth (Table 2, Figure 1). The analog IID in apple/peanut and apple/millet system increased annually from 0.48 m at the first year to 2.53 m at the ninth year. But the operable IID in these systems broaden from 0.50 m to 2.50m over time, which was greater than the analog IID. The apple/maize system showed larger analog and operable IIDs compared to other alley cropping systems at the sixth and eighth years (Table 2).
Compared to the conventional intercropping distance in Exp.1, the IIDs in the apple/peanut and apple/millet systems were optimized at the fourth and seventh years (Table 2). The IIDs of the apple/maize systems in Exp.2 was greater than the distance in Exp.1 (Table 2), which was conductive to alleviating the resource competition between apple and maize.

3.3. Land Equivalent Ratios

Land equivalent ratios (LERs) increased by 0.48–0.88 during the first–fifth years after establishment compared to apple monocultures (LER = 0), averaged over the two experiments (Table 3). The LERs were greater than 1.0 after the apple trees produced fruit, except for the apple/maize system at the ninth year. The mean LERs during the first–ninth year were significantly more than 1.0. Partial LERs (LERcrop) for maize in Exp.2 was less than that in Exp.1 during the sixth–eighth years, at where the IID were greater than the conventional distance. But the LERs between Exp. 1 and Exp. 2 were no significant difference. Because the partial LERs (LERapple) for apple trees compensated the loss of the maize yield (Table 3). The mean LERs for the apple/maize systems in Exp.2 was significantly greater than that in Exp.1 across the alley cropping period.

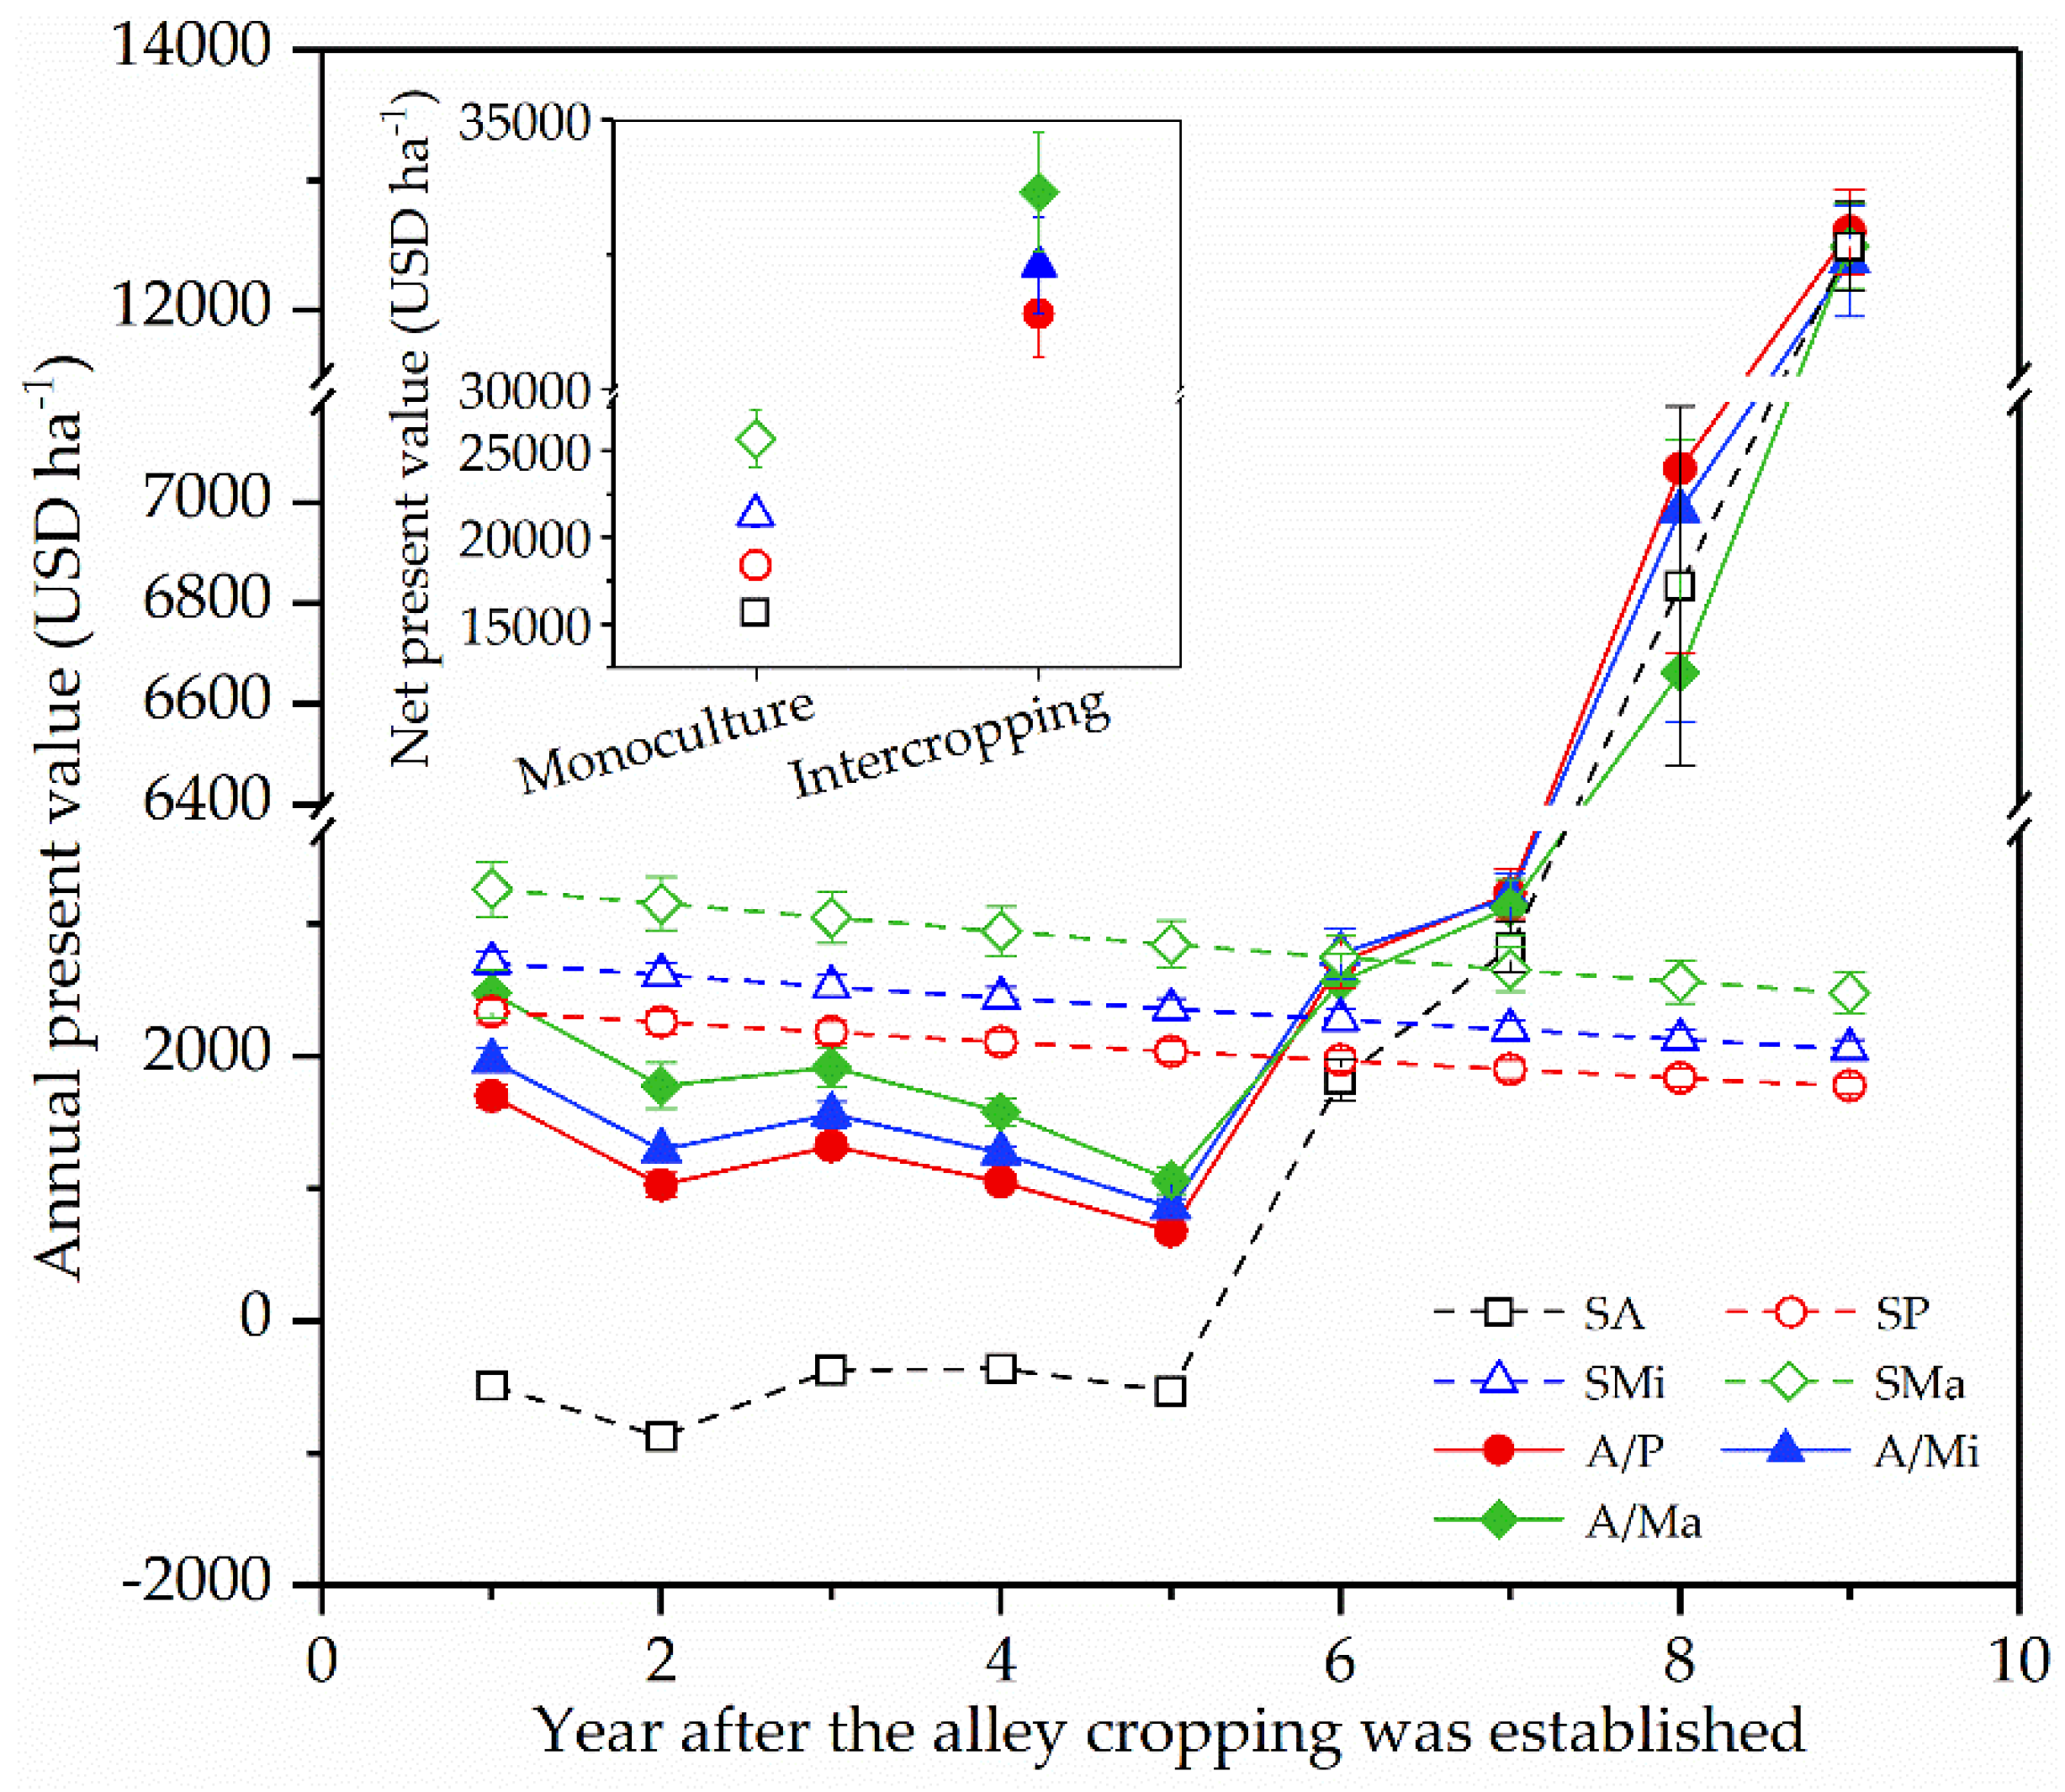
3.4. Economic Profitability

Cost structure showed a significantly difference among cropping systems (Table 4, Table 5 and Table 6). The alley cropping systems produced a higher cost than the apple monoculture or crop monoculture, but reduced the cost by 27.92–81.32 USD ha−1 compared to the average cost of the corresponding monocultures. The decrease of crop protection products and intertillage contributed to the cost saving of 16.0%–98.9%. Those can be attributed to the decline of agrochemicals for intercrops when tree spraying was employed, and the decreased cost of intertillage that was only arranged once for all trees and crops. Harvest fee in alley cropping also cut the cost of 1.1%–42.8%, compared to the monocultures. Apple/maize system showed a greater cost among three alley cropping practices as a consequence of more investment spending on seed and fertilizer. Seed cost of intercropped millet was lower than 63.3%–68.6% that of other crops, contributing to that the total cost of the apple/millet system was lowest among the three alley cropping systems.
Annual present values (PVs) in alley cropping systems were gradually decreased until the fifth year after establishment, but then showed a 37.7% increase during the sixth–ninth years compared with the corresponding monocultures (Figure 3). The annual PV of the apple/peanut system was reduced from 1701.11 USD ha−1ha at the first year to 679.4 USD ha−1 at the fifth year, but achieved the maximum of 12608.94 USD ha−1 among all cropping systems at the ninth year. The annual PV in the apple/millet system ranged from 1969.43 USD ha−1 at the first year to 858.14 USD ha−1 at the fifth year to 12381.9 USD ha−1 at the ninth year. The annual PV of the apple/maize system ranged from 2476.98 USD ha−1 at the first year to 1059.1 USD ha−1 at the fifth year to 12494.62 USD ha−1 at the ninth year. The annual PV of apple monoculture showed a progressive increase across the alley cropping period. The annual PVs of the alley cropping systems, which burdened with huge production costs for apple trees, were greater than that in apple monoculture during the first–seventh years, but lower than the sole crops (Table 6, Figure 3). The apple/maize system showed the greatest annual PV among three alley cropping systems during the first–fifth years, but was lower than other alley cropping systems during the sixth–ninth years. The annual PV of the apple/millet system was greatest among the alley cropping systems at the sixth year. A weakest negative effect motivated that the apple/peanut systems obtained the greatest annual PV among the alley cropping systems during the seventh–ninth years.
The net present value (NPV) quantified the cash flows of all cropping systems over the alley cropping period (Figure 3). The NPVs of the three alley cropping systems were on average 60.1% higher (12184.0 USD ha−1) than that in the monocultures during the whole alley cropping period (Figure 3). The apple/crop alley cropping averagely increased 107.1% in NPV compared to the sole apple. The greatest NPV among the three alley cropping systems was observed in apple/maize system.

4. Discussion

4.1. Land Use Advantage

When the IID was adopted in Exp.2, the results showed that the belowground competition was the first ingredient for designing intercropping distance during the first–fifth years after establishment, while light interception was the main driving force to broaden the distance during the sixth–ninth years (Figure 2). Gao et al. concluded that the primary limiting factor of the growth and yield of components within the range of 1.5m was the soil moisture, followed by the light and soil nutrient in young apple tree/crop alley cropping systems [32]. For older apple-based alley cropping, the light interception from apple trees is the primary factor of reducing the growth and yield of associated crops, and the soil moisture is the secondary factor [33]. Nair considered that tree shading significantly reduced the intercrops growth between the 8 and 35 years after the coconut tree were planted [34]. Therefore, the competition in the alley cropping systems would be minimized, if the maximum value between IIDaboveground and IIDbelowground was used in alley cropping systems, and the dominant sequence also regulates the plant yield and land use efficiency in alley cropping systems.
The competition with the trees resulted in the decreased yields and partial LERs of the intercrops. However, the LER in the alley cropping systems increased by 0.46–0.89 during the first–fifth years compared to the sole apple orchard (LER = 0) (Table 3), because the apple yield is not available in these years. Although the yields of trees and crops in the alley cropping systems were reduced during the sixth–eighth years, the total LERs of the apple/crop systems were higher than 1.0 (Table 3). This phenomenon is promoted by the bonus yield, when cultivating crop into tree monoculture produced abundant crop yield and slight impact on the tree yield [35]. A lower fertilization rate for peanut, equivalent to a third of the fertilization rate for maize and millet, did not cause more intense competition of the alley cropping system and negative effects on the partial LER, compared to the apple/maize and apple/millet systems (Table 3). Increased N2 fixation of the legume stimulated by the dominant species may explain the fertilizer effect among three intercrops [36]. The land use advantage also depends on the reduction of the negative interaction between trees and associated crops [14]. The greater IID resulted in a significantly decrease in partial LER for crops (especially for maize) in Exp.2, compared with that in Exp.2. But there were no significant difference in total LER between the two experiments during the sixth–eighth years (Table 2, Table 3). This result implied that the IID can be used to optimize the structure of alley cropping system and reduce the production costs. Chirko et al. [37] and Wang et al. [38] also confirmed this point. The annual decreasing in the total LERs indicated that the alley cropping is no longer profitable in the land utilization.

4.2. Economic Advantage

Agricultural land use is an economic activity, and profitability is the overriding factor in decisions on the feasibility, adaptability, and sustainability regarding different cropping systems [39]. Because of this motive, farmers’ decisions are guided by the profitability maximization based on sustainable land use practices. However, different planting systems and production processes have different levels of costs and benefits [40], and there has been a great deal of controversy regarding whether alley cropping is economically viable.
The economic analysis of the land management planning process can be applied to determine the proper cropping systems [41]. Our results showed that the apple monoculture generated the financial deficit from −361.93 USD ha−1 to −874.25 USD ha−1 before apple trees produced fruit (Figure 3). The apple orchard with crops, however, obtained 679.4–1701.11 USD ha−1 in this period, attributing to the economic compensation from intercrops for apple trees. After apple trees produced fruit, the partial LER for apple promoted the land use efficiency of the alley cropping, whose LERs were greater than 1.0, and further motivated the 37.7% increase in annual PV in the alley cropping systems compared with the corresponding monocultures. This phenomenon has been commonly observed in other literature [42,43]. During the alley cropping period, alley cropping reduced the production costs compared to the monocultures (Table 6). For example, the alley cropping system decreased the agrochemical cost of crop when the tree spraying prevented pest and disease [44]. The intertillage cost also was cut, because the intertillage for apple trees and intercrops can be accomplished at once. The labor cost for weeding, however, was not decreased in apple/peanut system, because herbicides for apple trees and legume crops is conflict.
The NPVs showed that the apple/maize system obtained the greatest economic profitability compared to other cropping systems (Figure 3). However, the three alley cropping systems showed their respective advantages in different alley cropping stages. Rahman et al. confirmed that agroforestry practices presented clear differences in net economic income between different tree species or crops [18]. Peanut, millet and sorghum are cultivated in more than 50% of agroforestry systems in Sudan, but the greatest benefit over a 10-year period is achieved in the tree/sorghum, /pearl millet, and /sesame agroforestry systems [45]. Ngwira et al. reported that a main crop intercropped with other crops produced completely different income levels through contrast tests [46]. These different economic performances are preformed to determine the best joint production level among the different combinations. Once these optimal combinations have been identified, they would be used as decision variables or alternatives for farmers [41]. The greater yield of maize during the early period after establishment contributed to the excellent economic profitability of the apple/maize system compared to other alley cropping systems (Figure 3). The greatest net benefit was obtained from the apple/peanut system after the seventh year. This is because peanut was sold at a higher price than maize and millet. The weak competition intensity between the trees and peanut and N facilitation of peanut for the trees could minimize the decreased yield of the apple/peanut system [32,47]. This result also partly explains the economic advantage of the apple/peanut system.
In addition to the yield and economic advantage in the alley cropping systems, there may be a multitude of positive impacts on other ecological services, such as biodiversity support, carbon sequestration, soil and water conservation, buffering the microclimate and soil fertility [48,49,50]. Alley cropping systems also significantly control pests and diseases [51,52]. At present, the alley cropping is widely applied in reducing the demand for fertilizers by planting nitrogen-fixing trees or crops in Europe [53]. Therefore, the improvement of intercropping distance and associated crops should be co-designed on account of multiple purposes in the alley cropping systems [44]. The comprehensive analysis is rarely elaborated in the alley cropping systems, and this becomes a vital proposition for optimizing the socio-economic and ecological benefits.

5. Conclusions

A key issue in agroforestry management is the need to maximize mutual benefits and minimize interspecific competition between all components, allowing the agroforestry to achieve high efficiency and sustainability [14]. The competition reduced the yields of intercrops and apple trees, but the presence of the intercrops and its low impact on the apple yield contributed to the land use advantage of the alley cropping systems (LER > 1) after the apple trees produced fruit. The broadened intercropping distance had no significantly negative effect on the LER in Exp.2 compared to that in Exp.1. This result confirmed the hypothesis that the light transmittance and root horizontal extent can be employed to determine the intercropping distance. The greater NPVs across the entire alley cropping period made apple/crop alley cropping systems became a sensible agriculture practice. The apple orchards intercropped with maize, millet and peanut harvested the maximum annual PV in the first–fifth, sixth and seventh–ninth years after the alley cropping establishment, respectively. The optimized choice for crop species and management in different stages of the alley cropping systems would provide more opportunities for farmers to increase land use efficiency and economic profitability.

Supplementary Materials

The following are available online at https://www.mdpi.com/2073-4395/9/1/34/s1, Table S1: Yields (t ha−1) of apple (Malus pumila) and crops in alley cropping and sole crops in Exp.2 (2014). The crop yields in alley cropping systems were expressed per unit of crop area.

Author Contributions

Conceptualization, H.X., H.B., L.G. and L.Y.; Data curation, L.G. and L.Y.; Formal analysis, H.X.; Funding acquisition, H.B.; Investigation, H.X. and L.G.; Methodology, H.X.; Project administration, H.X.; Resources, H.X. and H.B.; Software, H.X.; Supervision, H.B.; Writing—Original draft, H.X. and H.B.; Writing—Review and editing, H.X. and H.B.

Funding

This research was funded by the National Key Technology R & D Program of the Ministry of Science and Technology of China (No. 2015BAD07B0502), the National Natural Science Foundation of China (No. 31700366; No. 31470638) and the Beijing Municipal Education Commission (CEFF-PXM2018_014207_000024).

Acknowledgments

We thank the reviewers for valuable suggestions and comments and editors for valuable work.

Conflicts of Interest

The authors declare no conflict of interest.

References

  1. Centre, W.A. Annual Report 2010–2011 of World Agroforestry Centre: Wicked Challenges Today, Wicked Solutions Tomorrow; World Agroforestry Centre: Nairobi, Kenya, 2011; pp. 6–7. [Google Scholar]
  2. Gold, M.A.; Garrett, H.E. Agroforestry Nomenclature, Concepts, and Practices, 2nd ed.; American Society of Agronomy Inc.: Madison, WI, USA, 2009; pp. 45–56. [Google Scholar]
  3. Jose, S.; Williams, R.; Zamora, D. Belowground ecological interactions in mixed-species forest plantations. For. Ecol. Manag. 2006, 233, 231–239. [Google Scholar] [CrossRef]
  4. Singh, B.; Bishnoi, M.; Baloch, M.R.; Singh, G. Tree biomass, resource use and crop productivity in agri-horti-silvicultural systems in the dry region of Rajasthan, India. Arch. Agron. Soil Sci. 2014, 60, 1031–1049. [Google Scholar] [CrossRef]
  5. Razouk, R.; Daoui, K.; Ramdani, A.; Chergaoui, A. Optimal distance between olive trees and annual crops in rainfed intercropping system in northern Morocco. Crop Sci. Res. 2016, 1, 23–32. [Google Scholar]
  6. Nerlich, K.; Graeff-Hönninger, S.; Claupein, W. Erratum to: Agroforestry in Europe: A review of the disappearance of traditional systems and development of modern agroforestry practices, with emphasis on experiences in Germany. Agrofor. Syst. 2013, 87, 1211. [Google Scholar] [CrossRef]
  7. Miah, M.G.; Islam, M.M.; Rahman, M.A.; Ahamed, T.; Islam, M.R.; Jose, S. Transformation of jackfruit (Artocarpus heterophyllus Lam.) orchard into multistory agroforestry increases system productivity. Agrofor. Syst. 2018, 92, 1–11. [Google Scholar] [CrossRef]
  8. Sida, T.S.; Baudron, F.; Hadgu, K.; Derero, A.; Giller, K.E. Crop vs. tree: Can agronomic management reduce trade-offs in tree-crop interactions? Agric. Ecosyst. Environ. 2018, 260, 36–46. [Google Scholar] [CrossRef]
  9. Zhang, W.; Ahanbieke, P.; Wang, B.; Xu, W.; Li, L.; Christie, P.; Li, L. Root distribution and interactions in jujube tree/wheat agroforestry system. Agrofor. Syst. 2013, 87, 929–939. [Google Scholar] [CrossRef]
  10. Bohra, B.; Sharma, N.; Saxena, S.; Sabhlok, V.; Ramakrishna, Y. Socio-economic impact of biofuel agroforestry systems on smallholder and large-holder farmers in Karnataka, India. Agrofor. Syst. 2018, 92, 1–16. [Google Scholar] [CrossRef]
  11. Caviglia-Harris, J.L.; Kahn, J.R.; Green, T. Demand-side policies for environmental protection and sustainable usage of renewable resources. Ecol. Econ. 2003, 45, 119–132. [Google Scholar] [CrossRef]
  12. Pumariño, L.; Sileshi, G.W.; Gripenberg, S.; Kaartinen, R.; Barrios, E.; Muchane, M.N.; Midega, C.; Jonsson, M. Effects of agroforestry on pest, disease and weed control: A meta-analysis. Basic Appl. Ecol. 2015, 16, 573–582. [Google Scholar] [CrossRef]
  13. Torralba, M.; Fagerholm, N.; Burgess, P.J.; Moreno, G.; Plieninger, T. Do European agroforestry systems enhance biodiversity and ecosystem services? A meta-analysis. Agric. Ecosyst. Environ. 2016, 230, 150–161. [Google Scholar] [CrossRef]
  14. Garrity, D. Agroforestry and the future of global land use. In Agroforestry-The Future of Global Land Use; Springer: Dordrecht, The Netherlands, 2012; Volome 9, pp. 21–27. [Google Scholar]
  15. Thevathasan, N.V.; Gordon, A.M.; Bradley, R.; Cogliastro, A.; Folkard, P.; Grant, R.; Kort, J.; Liggins, L.; Njenga, F.; Olivier, A. Agroforestry research and development in Canada: The way forward. In Agroforestry-The Future of Global Land Use; Springer: Dordrecht, The Netherlands, 2012; pp. 247–283. [Google Scholar]
  16. Wilson, M.H.; Lovell, S.T. Agroforestry—The next step in sustainable and resilient agriculture. Sustainability 2016, 8, 574. [Google Scholar] [CrossRef]
  17. Rahman, S.A.; Jacobsen, J.B.; Healey, J.R.; Roshetko, J.M.; Sunderland, T. Finding alternatives to swidden agriculture: Does agroforestry improve livelihood options and reduce pressure on existing forest? Agrofor. Syst. 2017, 91, 185–199. [Google Scholar] [CrossRef]
  18. Rahman, H.T.; Deb, J.C.; Hickey, G.M.; Kayes, I. Contrasting the financial efficiency of agroforestry practices in buffer zone management of Madhupur National Park, Bangladesh. J. For. Res. 2014, 19, 12–21. [Google Scholar] [CrossRef]
  19. Bi, H.; Yun, L.; Zhu, Q. Interspecific Relationship in Agroforestry Systems on the Loess Plateau of West Shanxi Province; Science Press: Beijing, China, 2011; pp. 112–121. [Google Scholar]
  20. Du, Z.; He, M.; Yang, Z. The Effect of Shading Treatment on Photosynthetic Properties of Setaria Italica and Arachis Hypogaea. CNKI 1982, 6, 219–226. [Google Scholar]
  21. Zhang, K. Influence of Shading on Photosynthetic Characteristics, Yield and Quality of Peanut and Its Growth Model; Shandong Agircultural University: Taian, China, 2009. [Google Scholar]
  22. Zhong, X.-M.; Shi, Z.-S. Research progress on corn shading stress. J. Maize Sci. 2012, 1, 030. [Google Scholar]
  23. Xiaobang, P. Eco-Physiological Characteristics and Productivity of Grooviest System in the Loess Area of the Northern Wei River, Shaanxi, China; Northwest A&F University: Yangling, China, 2009. [Google Scholar]
  24. The Modelling of Three Dimensional Distribution of Photosynthetically Active Radiation in Maize Canopy; China Agricultural University: Beijing, China, 2004.
  25. Andersen, M.K.; Hauggaard-Nielsen, H.; Weiner, J.; Jensen, E.S. Competitive dynamics in two-and three-component intercrops. J. Appl. Ecol. 2007, 44, 545–551. [Google Scholar] [CrossRef]
  26. Wolz, K.J.; DeLucia, E.H. Alley cropping: Global patterns of species composition and function. Agric. Ecosyst. Environ. 2018, 252, 61–68. [Google Scholar] [CrossRef]
  27. Schroth, G. Tree root characteristics as criteria for species selection and systems design in agroforestry. In Agroforestry: Science, Policy and Practice; Springer: Berlin, Gremany, 1995; pp. 125–143. [Google Scholar]
  28. Cardinael, R.; Mao, Z.; Prieto, I.; Stokes, A.; Dupraz, C.; Kim, J.H.; Jourdan, C. Competition with winter crops induces deeper rooting of walnut trees in a Mediterranean alley cropping agroforestry system. Plant Soil 2015, 391, 219–235. [Google Scholar] [CrossRef]
  29. Sun, Y.; Bi, H.; Xu, H.; Duan, H.; Peng, R.; Wang, J. Below-Ground Interspecific Competition of Apple (Malus pumila M.)–Soybean (Glycine max L. Merr.) Intercropping Systems Based on Niche Overlap on the Loess Plateau of China. Sustainability 2018, 10, 3022. [Google Scholar] [CrossRef]
  30. Bo, Y. Quantification of the Three-Dimensional Root Architecture of Field-Grown Maize; China Agricultural University: Beijing, China, 2013. [Google Scholar]
  31. Pearce, D.; Mourato, S. The economic valuation of agroforestry’s environmental services. In Agroforestry and Biodiversity Conservation in Tropical Landscapes; Island Press: Washington, DC, USA, 2004; pp. 67–86. [Google Scholar]
  32. Gao, L.; Xu, H.; Bi, H.; Xi, W.; Bao, B.; Wang, X.; Bi, C.; Chang, Y. Intercropping competition between apple trees and crops in agroforestry systems on the Loess Plateau of China. PLoS ONE 2013, 8, e70739. [Google Scholar] [CrossRef] [PubMed]
  33. Lei, Y.; Bi, H.; Tian, X.; Cui, Z.; Zhou, H.; Gao, L.; Liu, L. Main interspecific competition and land productivity of fruit-crop intercropping in Loess Region of West Shanxi. Yingyong Shengtai Xuebao 2011, 22, 1225–1232. [Google Scholar]
  34. Nair, P.R. Intensive Multiple Cropping with Coconuts in India. Principles, Programmes and Prospects; Verlag Paul Parey: Berlin, Germany, 1979. [Google Scholar]
  35. Bai, W.; Sun, Z.; Zheng, J.; Du, G.; Feng, L.; Cai, Q.; Yang, N.; Feng, C.; Zhang, Z.; Evers, J.B. Mixing trees and crops increases land and water use efficiencies in a semi-arid area. Agric. Water Manag. 2016, 178, 281–290. [Google Scholar] [CrossRef]
  36. Li, B.; Li, Y.Y.; Wu, H.M.; Zhang, F.F.; Li, C.J.; Li, X.X.; Lambers, H.; Li, L. Root exudates drive interspecific facilitation by enhancing nodulation and N2 fixation. Proc. Natl. Acad. Sci. USA 2016, 113, 6496–6501. [Google Scholar] [CrossRef] [PubMed]
  37. Chirko, C.P.; Gold, M.A.; Nguyen, P.V.; Jiang, J. Influence of direction and distance from trees on wheat yield and photosynthetic photon flux density (Qp) in a Paulownia and wheat intercropping system. For. Ecol. Manag. 1996, 83, 171–180. [Google Scholar] [CrossRef]
  38. Wang, Q.; Zhang, D.; Zhang, L.; Han, S.; van der Werf, W.; Evers, J.B.; Su, Z.; Anten, N.P. Spatial configuration drives complementary capture of light of the understory cotton in young jujube plantations. Field Crops Res. 2017, 213, 21–28. [Google Scholar] [CrossRef]
  39. Dordas, C.A.; Vlachostergios, D.N.; Lithourgidis, A.S. Growth dynamics and agronomic-economic benefits of pea–oat and pea–barley intercrops. Crop Pasture Sci. 2012, 63, 45–52. [Google Scholar] [CrossRef]
  40. Rasul, G.; Thapa, G.B. Financial and economic suitability of agroforestry as an alternative to shifting cultivation: The case of the Chittagong Hill Tracts, Bangladesh. Agric. Syst. 2006, 91, 29–50. [Google Scholar] [CrossRef]
  41. Betters, D.R. Planning optimal economic strategies for agroforestry systems. Agrofor. Syst. 1988, 7, 17–31. [Google Scholar] [CrossRef]
  42. McGinty, M.M.; Swisher, M.E.; Alavalapati, J. Agroforestry adoption and maintenance: Self-efficacy, attitudes and socio-economic factors. Agrofor. Syst. 2008, 73, 99–108. [Google Scholar] [CrossRef]
  43. Pantera, A.; Burgess, P.J.; Losada, R.M.; Moreno, G.; López-Díaz, M.; Corroyer, N.; McAdam, J.; Rosati, A.; Papadopoulos, A.; Graves, A. Agroforestry for high value tree systems in Europe. Agrofor. Syst. 2018, 92, 945–949. [Google Scholar] [CrossRef]
  44. Jamar, L.; Rondia, A.; Lateur, M.; Minet, L.; Froncoux, A.; Stilmant, D. Co-design and establishment of innovative fruit-based agroforestry cropping systems in Belgium. In Proceedings of the International Symposium on Innovation in Integrated and Organic Horticulture (INNOHORT), Avignon, France, 8–12 June 2015; pp. 347–350. [Google Scholar]
  45. Fahmi, M.K.M.; Dafa-Alla, D.-A.M.; Kanninen, M.; Luukkanen, O. Impact of agroforestry parklands on crop yield and income generation: Case study of rainfed farming in the semi-arid zone of Sudan. Agrofor. Syst. 2018, 92, 1–16. [Google Scholar] [CrossRef]
  46. Ngwira, A.R.; Aune, J.B.; Mkwinda, S. On-farm evaluation of yield and economic benefit of short term maize legume intercropping systems under conservation agriculture in Malawi. Field Crops Res. 2012, 132, 149–157. [Google Scholar] [CrossRef]
  47. Isaac, M.E.; Carlsson, G.; Ghoulam, C.; Makhani, M.; Thevathasan, N.V.; Gordon, A.M. Legume performance and nitrogen acquisition strategies in a tree-based agroecosystem. Agroecol. Sustain. Food Syst. 2014, 38, 686–703. [Google Scholar] [CrossRef]
  48. Malézieux, E.; Crozat, Y.; Dupraz, C.; Laurans, M.; Makowski, D.; Ozier-Lafontaine, H.; Rapidel, B.; De Tourdonnet, S.; Valantin-Morison, M. Mixing plant species in cropping systems: Concepts, tools and models: A review. In Sustainable Agriculture; Springer: Berlin, Germany, 2009; pp. 329–353. [Google Scholar]
  49. Jose, S. Agroforestry for ecosystem services and environmental benefits: An overview. Agrofor. Syst. 2009, 76, 1–10. [Google Scholar] [CrossRef]
  50. Smith, J.; Girling, R.; Wolfe, M.; Pearce, B. Agroforestry: Integrating apple and arable production as an approach to reducing copper use in organic and low-input apple production. In Proceedings of the Agriculture and the Environment X: Delivering Multiple Benefits from our Land: Sustainable Development in Practice, Edinburgh, UK, 15–16 April 2014; pp. 278–284. [Google Scholar]
  51. Schut, M.; Rodenburg, J.; Klerkx, L.; van Ast, A.; Bastiaans, L. Systems approaches to innovation in crop protection. A systematic literature review. Crop Prot. 2014, 56, 98–108. [Google Scholar] [CrossRef] [Green Version]
  52. Simon, S.; Lesueur Jannoyer, M.; Plénet, D.; Lauri, P.-É.; Le Bellec, F. Design of Innovative Orchards: Proposal of an Adapted Conceptual Framework. 2015. Available online: http://fsd5.european-agronomy.org/documents/proceedings.pdf (accessed on 11 August 2018).
  53. Quinkenstein, A.; Woellecke, J.; Böhm, C.; Grünewald, H.; Freese, D.; Schneider, B.U.; Hüttl, R.F. Ecological benefits of the alley cropping agroforestry system in sensitive regions of Europe. Environ. Sci. Policy 2009, 12, 1112–1121. [Google Scholar] [CrossRef]
Figure 1. Sampling plot layout of the apple (Malus pumila)/crop alley cropping system. Each plot included three tree rows and two alleyways. Rep. means the replication.
Agronomy 09 00034 g001
Figure 2. Trajectories of the border of 85% tree shading and horizontal extent of the tree root system in the apple monoculture system. The values of the scatter points were measured in Exp.1.
Agronomy 09 00034 g002
Figure 3. Annual present value and net present value of different cropping systems during the alley cropping period in Exp.2. The economic profitability in each year during the alley cropping period was showed by the present value, not the actual revenue without discount in each year. Each symbol represents mean ± SE (n = 3). SA, SP, SMi and SMa present sole apple, sole peanut, sole millet and sole maize, respectively. A/P, A/Mi and A/Ma mean apple/peanut systems, apple/millet systems and apple/maize systems, respectively. The data were settled in US Dollar (USD), 1 Dollar = 6.12 Chinese Yuan (CNY) (31 December 2014).
Agronomy 09 00034 g003
Table 1. Yields (t ha−1) of apple (Malus pumila) and crops in alley cropping and sole crops in Exp.1 (2005–2013). The crop yields in alley cropping systems were expressed per unit of crop area.
SpeciesCropping SystemYear after Establishment
FirstSecondThirdFourthFifthSixthSeventhEighth Ninth
PeanutMono2.79 ± 0.17 a3.42 ± 0.51 a3.05 ± 0.10 a2.60 ± 0.1 8a3.18 ± 0.12 a2.56 ± 0.17 a3.75 ± 0.24 a2.82 ± 0.12 a3.06 ± 0.13 a
Inter2.67 ± 0.11 a3.29 ± 0.28 a2.89 ± 0.05 a2.37 ± 0.12 a2.81 ± 0.07 a2.28 ± 0.02 a3.00 ± 0.10 a2.35 ± 0.14 b1.93 ± 0.49 b
MilletMono3.03 ± 0.12 a3.93 ± 0.14 a3.49 ± 0.23 a2.89 ± 0.18 a3.45 ± 0.19 a3.03 ± 0.21 a3.87 ± 0.17 a3.20 ± 0.24 a3.56 ± 0.28 a
Inter2.93 ± 0.07 a3.77 ± 0.05 a3.32 ± 0.07 a2.58 ± 0.06 a2.94 ± 0.05 a2.62 ± 0.07 a3.29 ± 0.14 a2.36 ± 0.21 b1.90 ± 0.17 b
MaizeMono10.32 ± 0.63 a13.19 ± 0.49 a11.28 ± 0.60 a9.53 ± 0.57 a11.71 ± 0.55 a9.46 ± 0.60 a13.59 ± 0.52 a10.69 ± 0.61 a11.56 ± 0.75 a
Inter9.91 ± 0.33 a12.77 ± 0.12 a10.81 ± 0.48 a8.84 ± 0.23 a10.42 ± 0.26 a8.06 ± 0.26 a10.45 ± 0.31 b6.55 ± 0.24 b5.56 ± 1.47 b
AppleMono----------2.35 ± 0.18 a3.59 ± 0.05 a7.62 ± 0.29 a13.64 ± 0.30 a
Associated with Peanut----------2.17 ± 0.14 ab3.39 ± 0.04 ab7.44 ± 0.26 a13.43 ± 0.33 ab
Associated with Millet----------2.17 ± 0.15 ab3.29 ± 0.03 b7.32 ± 0.16 a13.08 ± 0.21 bc
Associated with Maize----------2.08 ± 0.10 b3.22 ± 0.07 b7.22 ± 0.10 a12.73 ± 0.17 c
Mono means the crop or apple in the monoculture; Inter means the crop in the alley cropping. Same small letter indicates no significant difference between monoculture and alley cropping systems, among apple plantation systems at p = 0.05.
Table 2. Intercropping distance (m) between apple trees and crops in the alley cropping systems. Exp. is the abbreviation of the experiment. IID is the abbreviation of the improved intercropping distance.
Year after EstablishmentExp.1Exp.2
Conventional Intercropping DistanceApple/Peanut (millet)Apple/Maize
IIDaboveIIDbelowAnalog IIDOperable IIDIIDaboveIIDbelowAnalog IIDOperable IID
First0.500.330.480.480.500.400.480.480.50
Second0.750.420.640.640.750.490.640.640.75
Third1.000.590.860.861.000.660.860.861.00
Fourth1.000.901.151.151.250.971.151.151.25
Fifth1.501.331.481.481.501.401.481.481.50
Sixth1.751.801.791.801.751.871.791.872.00
Seventh2.002.172.052.172.252.242.052.242.25
Eighth2.252.412.232.412.252.482.232.482.50
Ninth2.502.532.352.532.502.602.352.60--
Table 3. Land equivalent ratios (LER) in apple-based alley cropping systems in Exp.1 and Exp.2.
Years after EstablishmentCrop SpeciesExp.1 (2005–2013)Exp.2 (2014)
LER CropLER AppleLERLER CropLER AppleLER
FirstPeanut0.86 ± 0.02 aA--0.86 ± 0.02 aA0.89 ± 0.01 aA--0.89 ± 0.01 aA
Millet0.87 ± 0.01 aA--0.87 ± 0.01 aA0.87 ± 0.01 aA--0.87 ± 0.01 aA
Maize0.86 ± 0.01 aA--0.86 ± 0.01 aA0.87 ± 0.01 aA--0.87 ± 0.01 aA
SecondPeanut0.77 ± 0.02 aA--0.77 ± 0.02 aA0.78 ± 0.02 aA--0.78 ± 0.02 aA
Millet0.77 ± 0.01 aA--0.77 ± 0.01 aA0.76 ± 0.01 aA--0.76 ± 0.01 aA
Maize0.76 ± 0.02 aA--0.76 ± 0.02 aA0.78 ± 0.01 aA--0.78 ± 0.01 aA
ThirdPeanut0.66 ± 0.02 aA--0.66 ± 0.02 aA0.69 ± 0.01 aA--0.69 ± 0.01 aA
Millet0.67 ± 0.02 aA--0.67 ± 0.02 aA0.68 ± 0.02 aA--0.68 ± 0.02 aA
Maize0.67 ± 0.02 aA--0.67 ± 0.02 aA0.67 ± 0.01 aA--0.67 ± 0.01 aA
FourthPeanut0.64 ± 0.01 aA--0.64 ± 0.01 aA0.57 ± 0.01 aB--0.57 ± 0.01 aB
Millet0.63 ± 0.02 aA--0.63 ± 0.02 aA0.57 ± 0.02 aB--0.57 ± 0.02 aB
Maize0.65 ± 0.01 aA--0.65 ± 0.01 aA0.57 ± 0.01 aB--0.57 ± 0.01 aB
FifthPeanut0.44 ± 0.02 aA--0.44 ± 0.02 aA0.48 ± 0.01 aA--0.48 ± 0.01 aA
Millet0.50 ± 0.05 aA--0.50 ± 0.05 aA0.48 ± 0.01 abA--0.48 ± 0.01 abA
Maize0.46 ± 0.01 aA--0.46 ± 0.01 aA0.47 ± 0.02 bA--0.47 ± 0.02 bA
SixthPeanut0.36 ± 0.02 aA0.92 ± 0.01 aA1.28 ± 0.01 aB0.38 ± 0.02 aA0.97 ± 0.01 aA1.35 ± 0.02 aA
Millet0.38 ± 0.04 aA0.92 ± 0.01 aB1.31 ± 0.01 abA0.37 ± 0.02 aA0.95 ± 0.01 aA1.32 ± 0.01 aA
Maize0.35 ± 0.01 bA0.89 ± 0.03 aB1.23 ± 0.03 bA0.27 ± 0.01 bB0.94 ± 0.03 aA1.20 ± 0.01 bA
SeventhPeanut0.24 ± 0.01 aA0.95 ± 0.01 aB1.19 ± 0.01 aA0.18 ± 0.01 aB0.98 ± 0.01 aA1.16 ± 0.03 aA
Millet0.26 ± 0.02 aA0.92 ± 0.01 abB1.17 ± 0.01 abA0.17 ± 0.02 aB0.97 ± 0.01 abA1.14 ± 0.01 aA
Maize0.23 ± 0.03 aA0.90 ± 0.02 bB1.13 ± 0.02 bA0.16 ± 0.01 aB0.94 ± 0.02 bA1.09 ± 0.02 aA
EighthPeanut0.18 ± 0.03 aA0.98 ± 0.01 aA1.16 ± 0.01 aA0.16 ± 0.02 aA0.98 ± 0.01 aA1.13 ± 0.01 aA
Millet0.15 ± 0.03 aA0.96 ± 0.02 aA1.11 ± 0.02 abA0.16 ± 0.02 aA0.96 ± 0.02 aA1.12 ± 0.02 abA
Maize0.12 ± 0.01 aA0.95 ± 0.02 aA1.07 ± 0.02 bA0.06 ± 0.01 aB0.95 ± 0.02 aA1.01 ± 0.03 bA
NinthPeanut0.06 ± 0.03 aA0.98 ± 0.01 aA1.05 ± 0.01 aA0.08 ± 0.01 aA0.98 ± 0.01 aA1.07 ± 0.01 aA
Millet0.05 ± 0.01 aA0.96 ± 0.02 abA1.01 ± 0.02 abA0.07 ± 0.01 aA0.96 ± 0.02 abA1.04 ± 0.02 abA
Maize0.05 ± 0.02 aA0.93 ± 0.03 bB0.98 ± 0.03 bA--1.00 ± 0.01 bA1.00 ± 0.01 bA
First-ninthPeanut0.46 ± 0.00 aA0.97 ± 0.01 aA1.43 ± 0.01 aA0.47 ± 0.01 aA0.98 ± 0.00 aA1.45 ± 0.01 aA
Millet0.46 ± 0.02 aA0.95 ± 0.01 abA1.41 ± 0.03 aA0.46 ± 0.01 aA0.97 ± 0.00 aA1.43 ± 0.01 bA
Maize0.46 ± 0.03 aB0.93 ± 0.00 bB1.39 ± 0.03 aB0.48 ± 0.01 aA0.97 ± 0.00 aA1.45 ± 0.01 aA
Same small letter indicates no significant difference among the apple/crop alley cropping systems at p = 0.05. Capital letters show a significantly difference between Exp.1 and Exp.2 at p = 0.05.
Table 4. Cost structure of apple monoculture system in Exp.2.
ActivitiesQuantity ha−1Price unit−1Cost (USD ha−1)
Planting
FirstRootstock seedling500.00.41204.25
Planting500.00.1365.36
SecondRootstock seedling48.00.4119.61
Replanting48.00.136.27
Graft seeding452.01.23553.92
Grafting452.00.1673.86
ThirdGraft seeding48.01.2358.82
Grafting48.00.167.84
Tending (fertilizer, blossom and fruit thinning, agrochemical, intertillage etc.)
First, second 220.6
Third 306.4
Fourth 361.9
Fifth 531.0
Sixth 789.2
Seventh 919.1
Eighth 1086.6
Ninth 1188.7
Harvesting
Sixth 2.7149.02132.66
Seventh 3.8849.02190.31
Eighth 8.2249.02402.76
Ninth 14.1949.02695.65
Table 5. Cost structure of crop monoculture systems in Exp.2.
ActivitiesQuantity ha−1Price unit−1Cost (USD ha−1)
Sowing
PeanutSeed150.01.14171.57
Tillage 36.76
Sowing 68.63
MilletSeed6.08.9953.92
Tillage 36.76
Sowing 49.02
MaizeSeed60.02.45147.06
Tillage 36.76
Sowing 49.02
Tending (fertilizer, agrochemical, intertillage, etc.)
Peanut 155.23
Millet 205.88
Maize 214.87
Harvesting
Peanut 3.2016.3452.32
Millet 3.3816.3455.20
Maize 11.713.2738.25
Table 6. Cost structure (USD ha−1) of apple/crop alley cropping systems in Exp.2.
ActivitiesCropping SystemYear after Establishment
FirstSecondThirdFourthFifthSixthSeventhEighth Ninth
Plantingand sowingApple/peanut518.87875.23260.54166.18138.48110.7855.3955.3927.70
Apple/millet395.34765.42164.4683.8269.8555.8827.9427.9427.94
Apple/maize479.17839.93229.66139.71116.4269.8546.5723.28--
TendingApple/peanut321.47307.81371.36407.70551.55788.61891.291059.591138.61
Apple/millet365.29346.76408.51444.15586.52815.98928.611080.201172.01
Apple/maize383.61364.26426.42463.48611.81831.45939.411095.081188.73
HarvestingApple/peanut46.6340.5935.8729.8225.13148.69195.52401.36692.61
Apple/millet47.8942.1437.4831.5226.57147.03193.48395.11683.68
Apple/maize33.4029.8225.7521.8317.88134.61184.30386.88695.77
Total costApple/peanut886.981223.63667.76603.69715.161048.091142.211516.341858.92
Apple/millet808.531154.33610.44559.49682.941018.891150.031503.251883.63
Apple/maize896.161234.02681.83625.02746.091035.901170.281505.251884.49

