Performance and Stability of Commercial Wheat Cultivars under Terminal Heat Stress


Abstract
1. Introduction
2. Materials and Methods
2.1. Plant Materials and Field Conditions
2.2. Phenotypic Measurements
2.3. Statistical Analysis
2.4. Stability Analysis and Genotype × Interaction (G × E)
3. Results
3.1. Analysis of Variance
3.2. Interrelationships among the Studied Traits under Recommended Sown Condition
3.3. Interrelationships among the Studied Traits under the Late Sown Condition
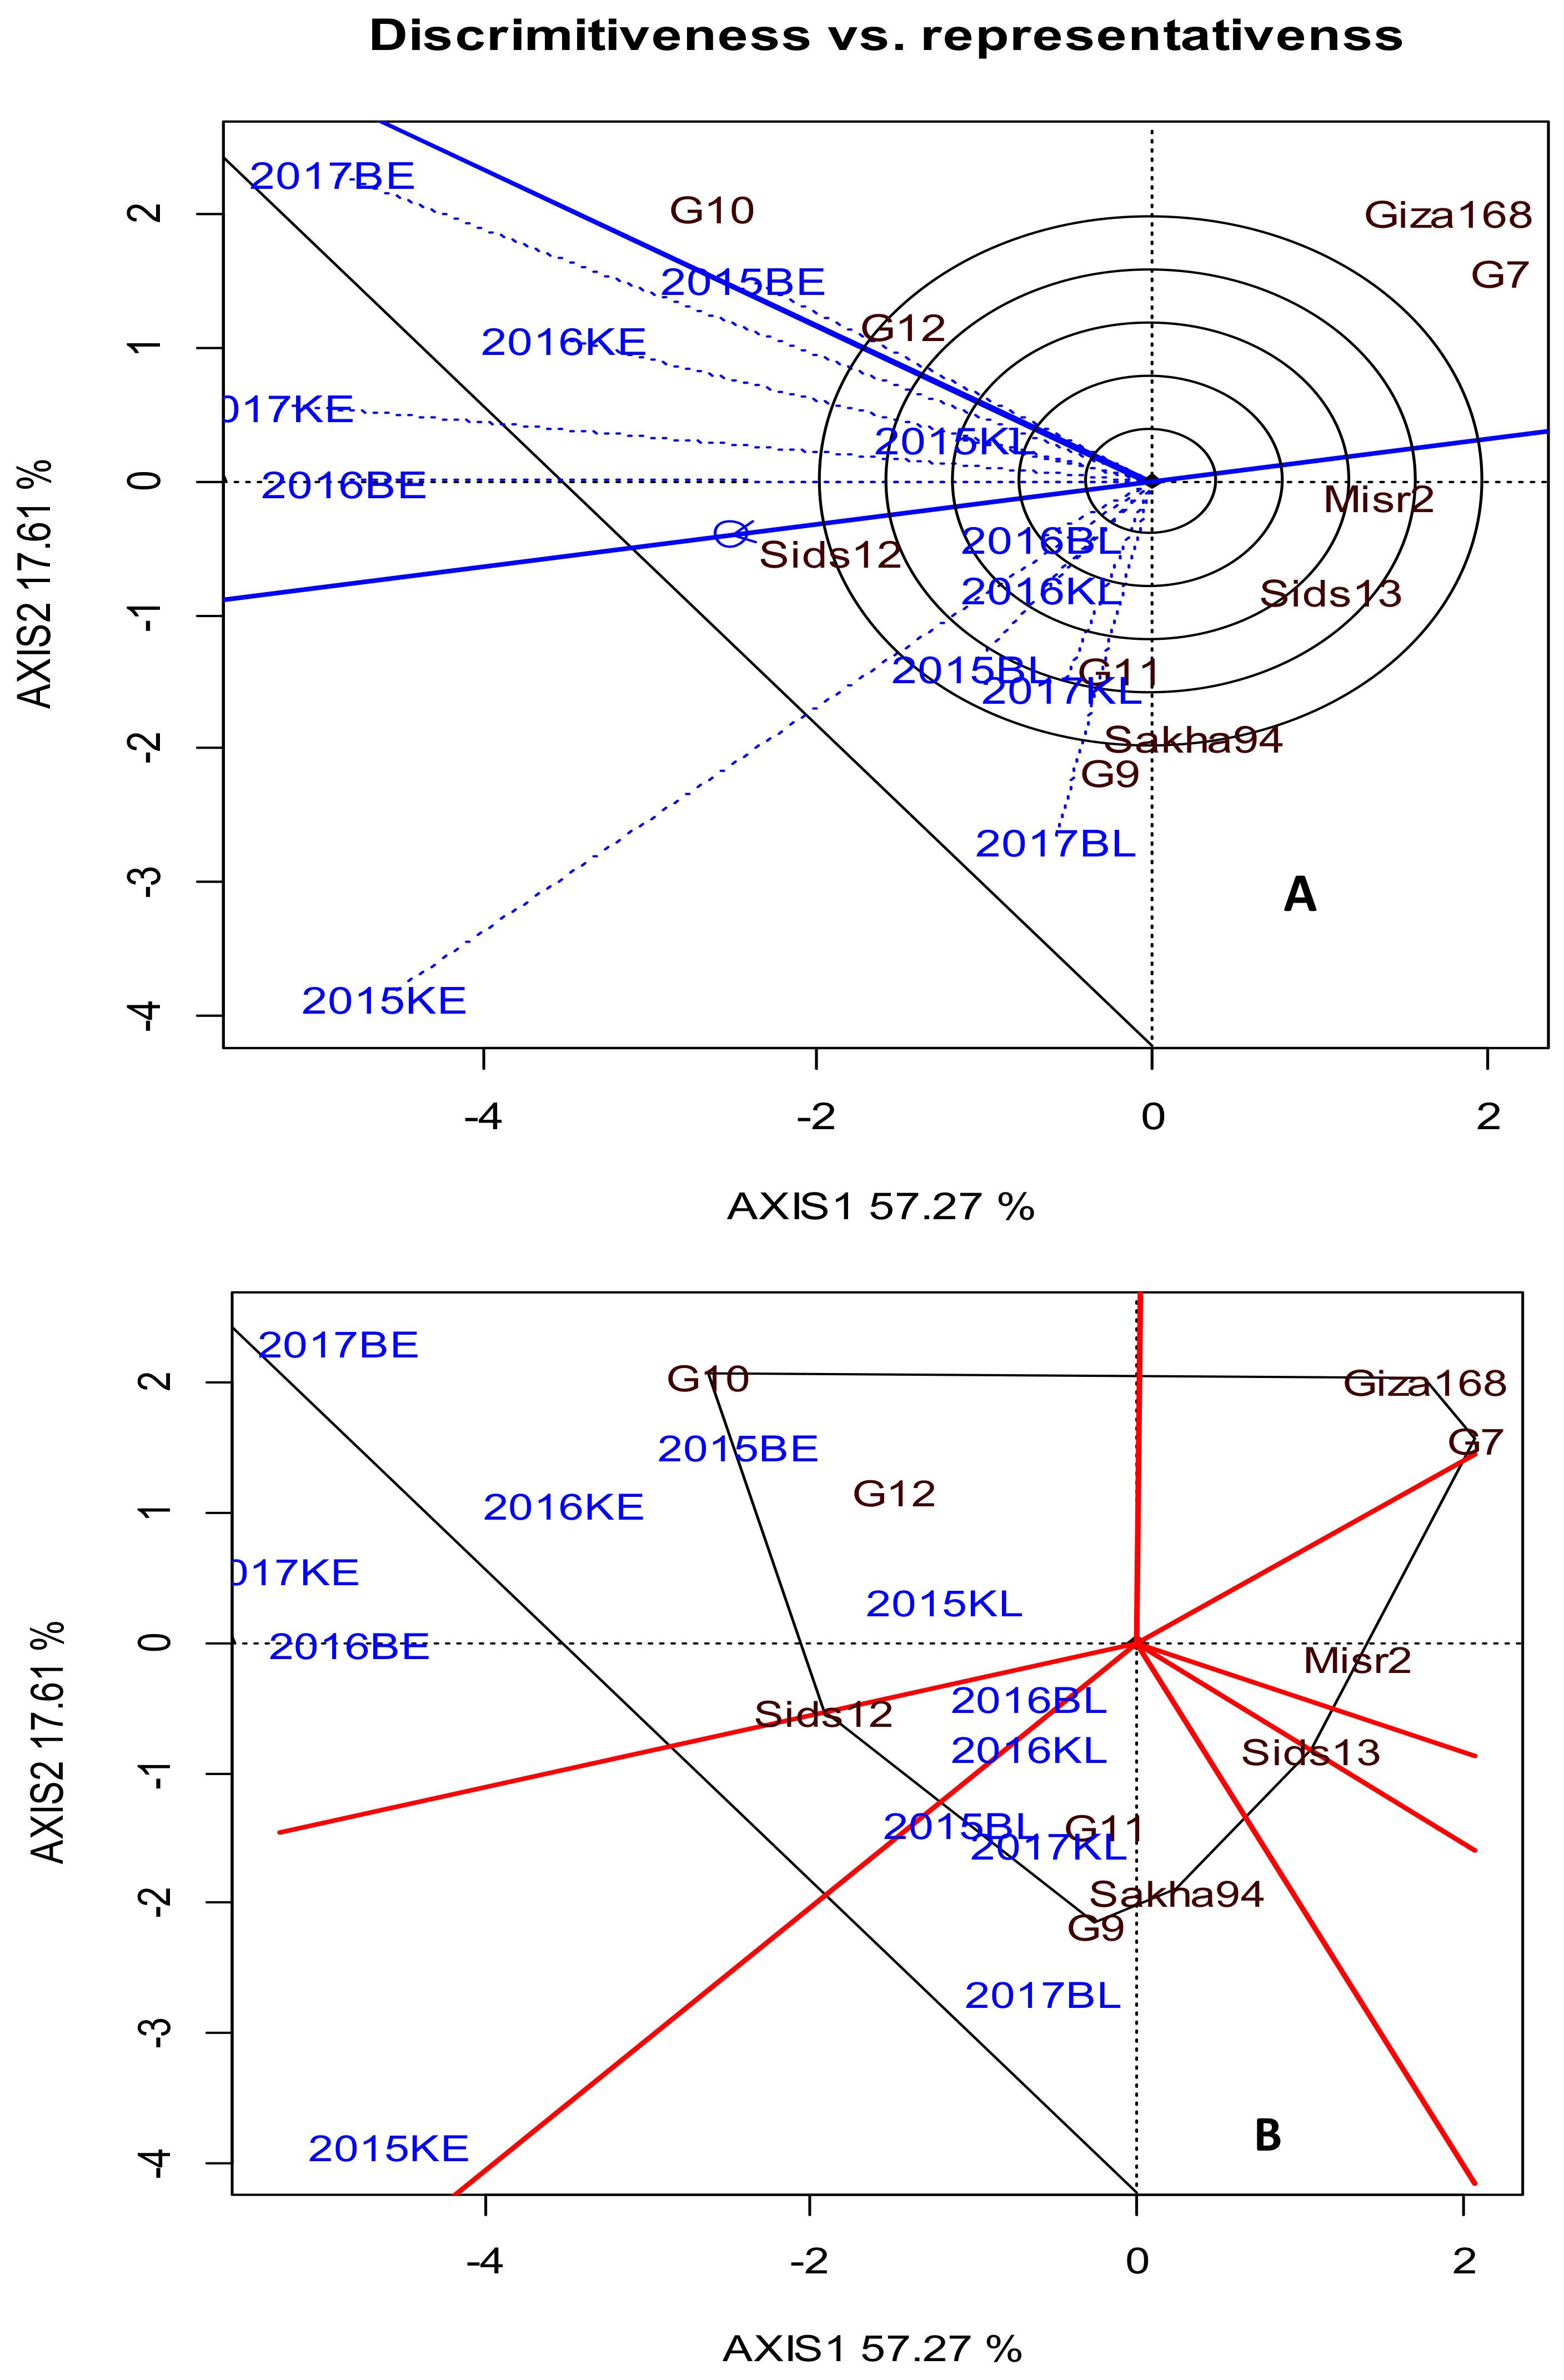
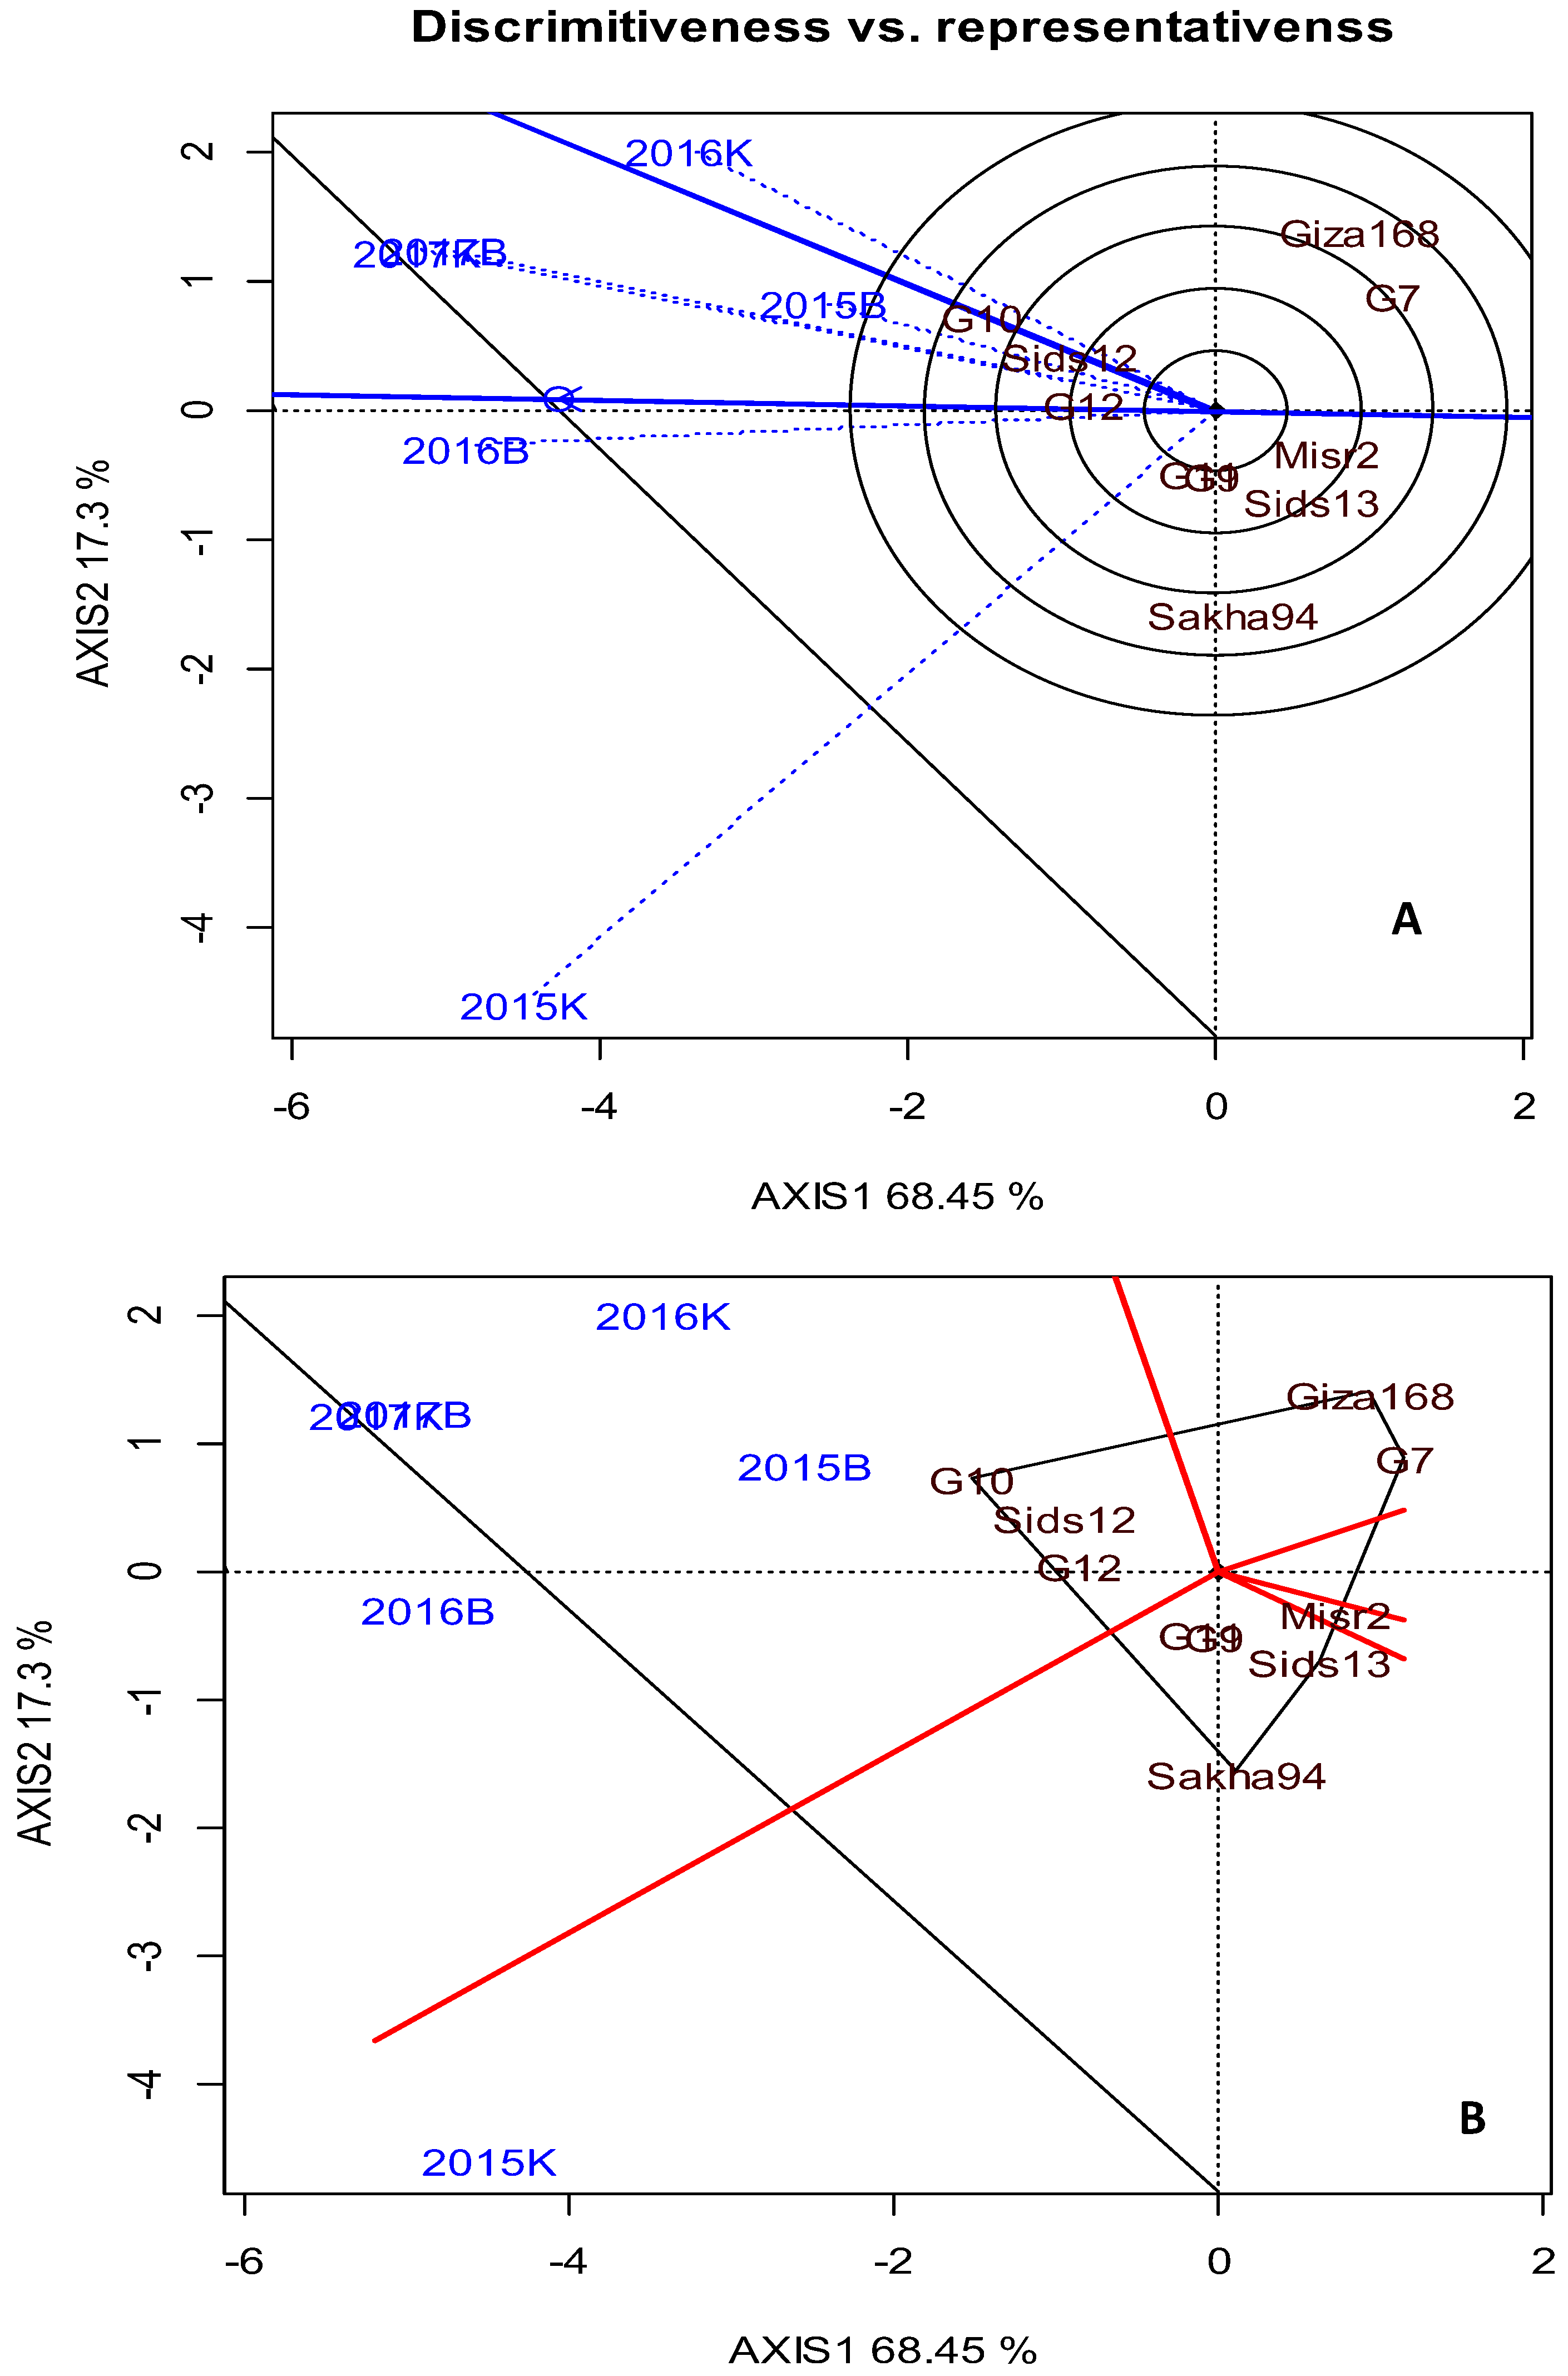
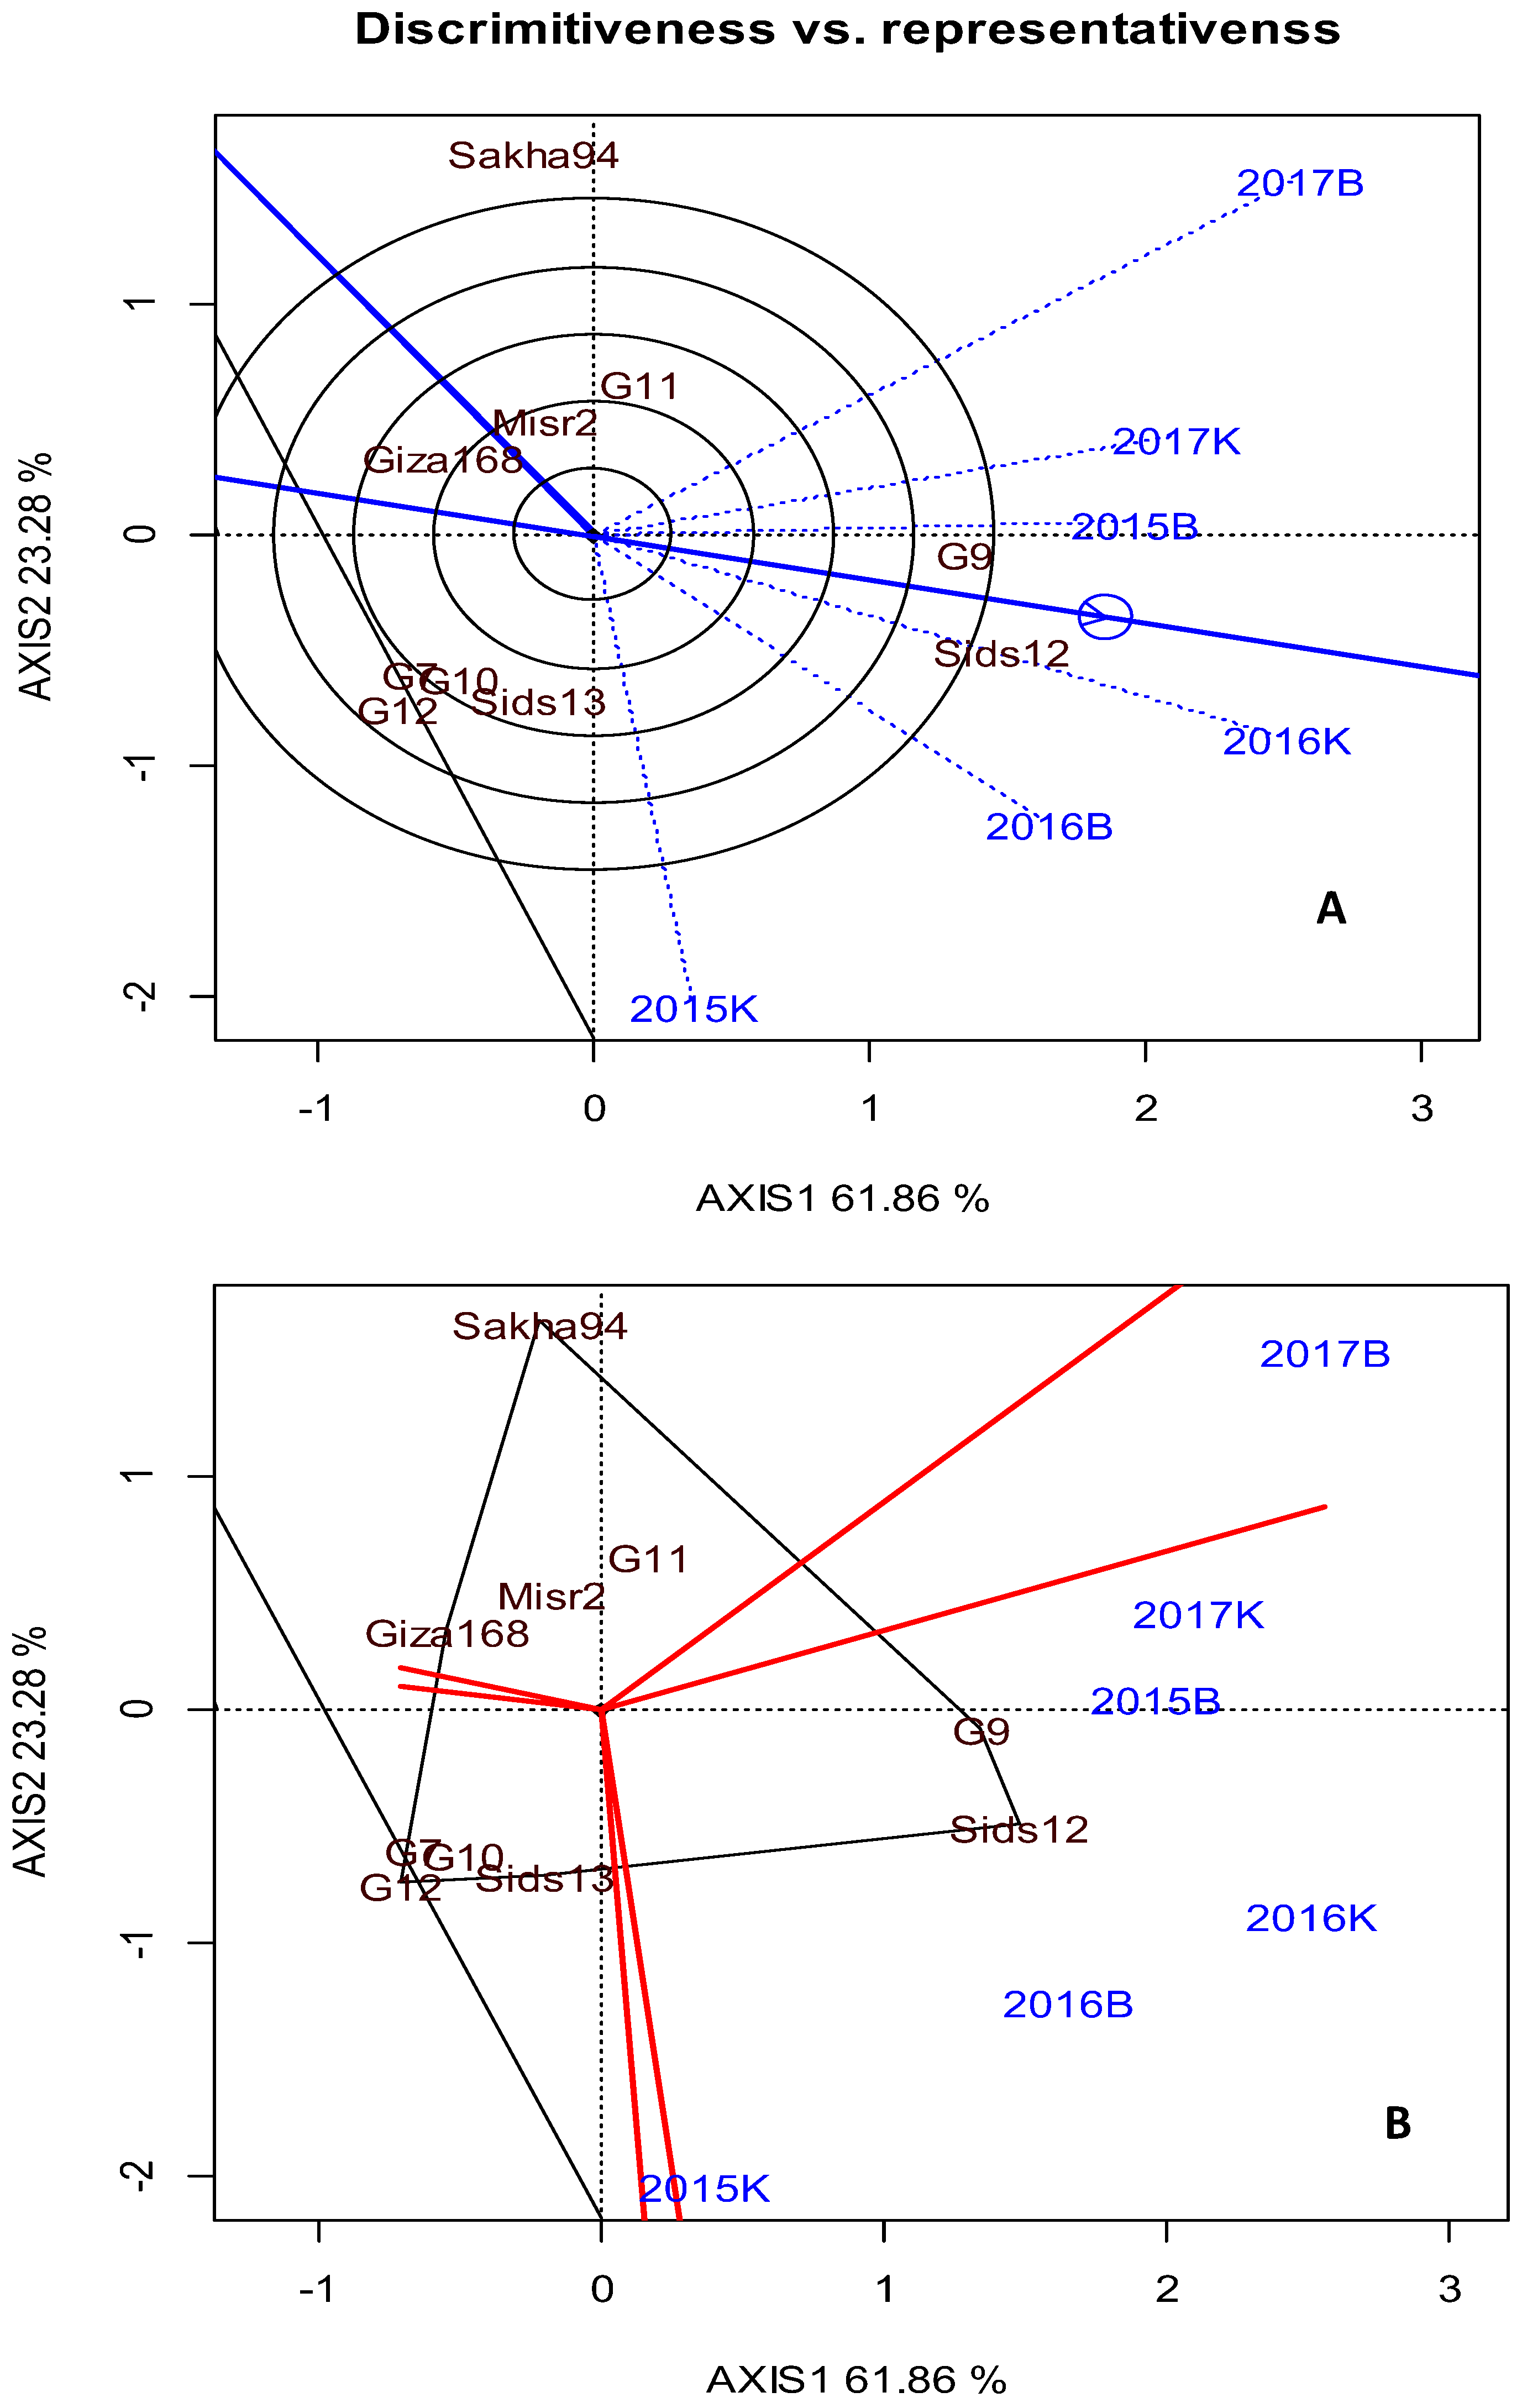
3.4. Genotype × Environment Interaction (G × E) for Grain Yield
4. Discussion
5. Conclusions
Acknowledgments
Conflicts of Interest
References
- Enghiad, A.; Ufer, D.; Countryman, A.M.; Thilmany, D.D. An Overview of Global Wheat Market Fundamentals in an Era of Climate Concerns. Int. J. Agron. 2017, 2017, 3931897. [Google Scholar] [CrossRef]
- Curtis, T.; Halford, N.G. Food security: The challenge of increasing wheat yield and the importance of not compromising food safety. Ann. Appl. Biol. 2014, 164, 354–372. [Google Scholar] [CrossRef] [PubMed]
- Olmstead, A.L.; Rhode, P.W. Adapting North American wheat production to climatic challenges, 1839–2009. Proc. Natl. Acad. Sci. USA 2011, 108, 480–485. [Google Scholar] [CrossRef]
- Asseng, S.; Ewert, F.; Martre, P.; Rötter, R.P.; Lobell, D.B.; Cammarano, D.; Kimball, B.A.; Ottman, M.J.; Wall, G.W.; White, J.W.; et al. Rising temperatures reduce global wheat production. Nat. Clim. Chang. 2015, 5, 143–147. [Google Scholar] [CrossRef]
- Bita, C.E.; Gerats, T. Plant tolerance to high temperature in a changing environment: Scientific fundamentals and production of heat stress-tolerant crops. Front. Plant Sci. 2013, 4, 273. [Google Scholar] [CrossRef] [PubMed]
- Farooq, M.; Bramley, H.; Palta, J.A.; Siddique, K.H.M. Heat Stress in Wheat during Reproductive and Grain-Filling Phases. Crit. Rev. Plant Sci. 2011, 30, 491–507. [Google Scholar] [CrossRef]
- Jat, R.K.; Singh, P.; Jat, M.L.; Dia, M.; Sidhu, H.S.; Jat, S.L.; Bijarniya, D.; Jat, H.S.; Parihar, C.M.; Kumar, U.; et al. Heat stress and yield stability of wheat genotypes under different sowing dates across agro-ecosystems in India. Field Crops Res. 2018, 218, 33–50. [Google Scholar] [CrossRef]
- Akter, N.; Rafiqul Islam, M. Heat stress effects and management in wheat. A review. Agron. Sustain. Dev. 2017, 37, 37. [Google Scholar] [CrossRef]
- Spiertz, J.H.J.; Hamer, R.J.; Xu, H.; Primo-Martin, C.; Don, C.; van der Putten, P.E.L. Heat stress in wheat (Triticum aestivum L.): Effects on grain growth and quality traits. Eur. J. Agron. 2006, 25, 89–95. [Google Scholar] [CrossRef]
- Feng, B.; Liu, P.; Li, G.; Dong, S.T.; Wang, F.H.; Kong, L.A.; Zhang, J.W. Effect of Heat Stress on the Photosynthetic Characteristics in Flag Leaves at the Grain-Filling Stage of Different Heat-Resistant Winter Wheat Varieties. J. Agron. Crop Sci. 2014, 200, 143–155. [Google Scholar] [CrossRef]
- Gonzalez, A.; Bermejo, V.; Gimeno, B.S. Effect of different physiological traits on grain yield in barley grown under irrigated and terminal water deficit conditions. J. Agric. Sci. 2010, 148, 319–328. [Google Scholar] [CrossRef]
- Matsui, T.; Omasa, K.; Horie, T. The Difference in Sterility due to High Temperatures during the Flowering Period among Japonica-Rice Varieties. Plant Prod. Sci. 2001, 4, 90–93. [Google Scholar] [CrossRef]
- Vara Prasad, P.V.; Craufurd, P.Q.; Summerfield, R.J. Sensitivity of peanut to timing of heat stress during reproductive development. Crop Sci. 1999, 39, 1352–1357. [Google Scholar] [CrossRef]
- Batts, G.R.; Ellis, R.H.; Morison, J.I.L.; Nkemka, P.N.; Gregory, P.J.; Hadley, P. Yield and partitioning in crops of contrasting cultivars of winter wheat in response to CO2 and temperature in field studies using temperature gradient tunnels. J. Agric. Sci. 1998, 130, 17–27. [Google Scholar] [CrossRef]
- Wardlaw, F.; Sofieldb, I.; Cartwrightc, P.M. Factors Limiting the Rate of Dry Matter Accumulation in the Grain of Wheat Grown at High Temperature. Aust. J. Plant Physiol. 1980, 7, 387–400. [Google Scholar] [CrossRef]
- Iqbal, M.; Raja, N.I.; Yasmeen, F.; Hussain, M.; Ejaz, M.; Shah, M.A. Impacts of Heat Stress on Wheat: A Critical Review. Adv. Crop Sci. Technol. 2017, 5, 251. [Google Scholar] [CrossRef]
- Adams, S. Effect of Temperature on the Growth and Development of Tomato Fruits. Ann. Bot. 2001, 88, 869–877. [Google Scholar] [CrossRef]
- Abiko, M.; Akibayashi, K.; Sakata, T.; Kimura, M.; Kihara, M.; Itoh, K.; Asamizu, E.; Sato, S.; Takahashi, H.; Higashitani, A. High-temperature induction of male sterility during barley (Hordeum vulgare L.) anther development is mediated by transcriptional inhibition. Sex. Plant Reprod. 2005, 18, 91–100. [Google Scholar] [CrossRef]
- Al-Otayk, S.M. Performance of Yield and Stability of Wheat Genotypes under High Stress Environments of the Central Region of Saudi Arabia. Meteorol. Environ. Arid Land Agric. Sci. 2010, 21, 81–92. [Google Scholar] [CrossRef]
- Farshadfar, E.; Sabaghpour, S.H.; Zali, H. Comparison of parametric and non-parametric stability statistics for selecting stable chickpea (Cicer arietinum L.) genotypes under diverse environments. Aust. J. Crop Sci. 2012, 6, 514–524. [Google Scholar]
- Lin, C.S.; Binns, M.R. A superiority measure of cultivar performance for cultivar × location data. Can. J. Plant Sci. 1988, 68, 193–198. [Google Scholar] [CrossRef]
- Eberhart, S.A.; Russell, W.A. Stability Parameters for Comparing Varieties. Crop Sci. 1966, 6, 36–40. [Google Scholar] [CrossRef]
- Romagosa, I.; Fox, P.N. Genotype × environment interaction and adaptation. In Plant Breeding; Springer: Dordrecht, The Netherlands, 1993; pp. 373–390. ISBN 9401046654. [Google Scholar]
- Akcura, M.; Kaya, Y. Nonparametric stability methods for interpreting genotype by environment interaction of bread wheat genotypes (Triticum aestivum L.). Genet. Mol. Biol. 2008, 31, 906–913. [Google Scholar] [CrossRef]
- Bavec, M.; Vuković, K.; Grobelnik Mlakar, S.; Rozman, Č.; Bavec, F. Leaf area index in winter wheat: response on seed rate and nitrogen application by different varieties. J. Cent. Eur. Agric. 2007, 8, 337–342. [Google Scholar] [CrossRef]
- Peterson, R.F.; Campbell, A.B.; Hannah, A.E. A diagrammatic scale for estimating rust intensity on leaves and stems of cereals. Can. J. Res. 1948, 26, 496–500. [Google Scholar] [CrossRef]
- Roelfs, A.P.; Singh, R.P.; Saari, E.E. Rust Diseases of Wheat: Concepts and Methods of Disease Management; CIMMYT (International Maize and Wheat Improvement Center): Mexico, D.F., Mexico, 1992; ISBN 968612747X. [Google Scholar]
- Gomez, K.A.; Gomez, A.A.; Gomez, K.A. Statistical Procedures for Agricultural Research; John Wiley & Sons: New York, NY, USA, 1984; ISBN 9780471870920. [Google Scholar]
- Steel, R.G.D.; Torrie, J.H. Principles and Procedures of Statistics: A Biometrical Approach, 2nd ed.; McGraw-Hill Publishing Co.: New York, NY, USA, 1980; 631p. [Google Scholar]
- Mellenbergh, G.J.; Arce, C. Experimental design and analysis. J. Mark. Res. (JMR) 1992, 29, 155–156. [Google Scholar] [CrossRef]
- Pinthus, M.J. Estimate of genotypic value: A proposed method. Euphytica 1973, 22, 121–123. [Google Scholar] [CrossRef]
- Mulusew, F.; Bing, D.J.; Tadele, T.; Amsalu, A. Comparison of biometrical methods to describe yield stability in field pea (Pisum sativum L.) under south eastern Ethiopian conditions. Afr. J. Agric. Res. 2014, 9, 2574–2583. [Google Scholar] [CrossRef]
- Blanco, A.; Mangini, G.; Giancaspro, A.; Giove, S.; Colasuonno, P.; Simeone, R.; Signorile, A.; De Vita, P.; Mastrangelo, A.M.; Cattivelli, L.; et al. Relationships between grain protein content and grain yield components through quantitative trait locus analyses in a recombinant inbred line population derived from two elite durum wheat cultivars. Mol. Breed. 2012, 30, 79–92. [Google Scholar] [CrossRef]
- Pacheco, Á.; Vargas, M.; Alvarado, G.; Rodríguez, F.; Crossa, J.; Burgueño, J. GEA-R (Genotype × Environment Analysis with R for Windows) Version 4.0. Available online: http://hdl.handle.net/11529/10203 (accessed on 29 January 2018).
- Hereher, M.E. Time series trends of land surface temperatures in Egypt: a signal for global warming. Environ. Earth Sci. 2016, 75, 1218. [Google Scholar] [CrossRef]
- Valizadeh, J.; Ziaei, S.M.; Mazloumzadeh, S.M. Assessing climate change impacts on wheat production (a case study). J. Saudi Soc. Agric. Sci. 2014, 13, 107–115. [Google Scholar] [CrossRef]
- Castro, M.; Peterson, C.J.; Dalla Rizza, M.; Díaz Dellavalle, P.; Vázquez, D.; Ibañez, V.; Ross, A. Influence of heat stress on wheat grain characteristics and protein molecular weight distribution. In Wheat Production in Stressed Environments; Springer: Dordrecht, The Netherlands, 2007; pp. 365–371. ISBN 978-1-4020-5496-9. [Google Scholar]
- Mohammed, A.R.; Tarpley, L. Impact of high nighttime temperature on respiration, membrane stability, antioxidant capacity, and yield of rice plants. Crop Sci. 2009, 49, 313–322. [Google Scholar] [CrossRef]
- Ayeneh, A.; Van Ginkel, M.; Reynolds, M.P.; Ammar, K. Comparison of leaf, spike, peduncle and canopy temperature depression in wheat under heat stress. Field Crops Res. 2002, 79, 173–184. [Google Scholar] [CrossRef]
- Fu, G.; Feng, B.; Zhang, C.; Yang, Y.; Yang, X.; Chen, T.; Zhao, X.; Zhang, X.; Jin, Q.; Tao, L. Heat Stress Is More Damaging to Superior Spikelets than Inferiors of Rice (Oryza sativa L.) due to Their Different Organ Temperatures. Front. Plant Sci. 2016, 7, 1637. [Google Scholar] [CrossRef] [PubMed]
- Gadallah, A.; Milad, I.; Yossef, Y.A.; Gouda, M.A. Evaluation of Some Egyptian Bread Wheat (Triticum aestivum) Cultivars under Salinity Stress. Alex. Sci. Exch. 2017, 38, 260. [Google Scholar]
- Chen, W.R.; Zheng, J.S.; Li, Y.Q.; Guo, W.D. Effects of high temperature on photosynthesis, chlorophyll fluorescence, chloroplast ultrastructure, and antioxidant activities in fingered citron. Russ. J. Plant Physiol. 2012, 59, 732–740. [Google Scholar] [CrossRef]
- Kreslavski, V.D.; Lyubimov, V.Y.; Shabnova, N.I.; Balakhnina, T.I.; Kosobryukhov, A.A. Heat-induced impairments and recovery of photosynthetic machinery in wheat seedlings. Role of light and prooxidant-antioxidant balance. Physiol. Mol. Biol. Plants 2009, 15, 115–122. [Google Scholar] [CrossRef] [PubMed]
- Kreslavski, V.; Tatarinzev, N.; Shabnova, N.; Semenova, G.; Kosobryukhov, A. Characterization of the nature of photosynthetic recovery of wheat seedlings from short-term dark heat exposures and analysis of the mode of acclimation to different light intensities. J. Plant Physiol. 2008, 165, 1592–1600. [Google Scholar] [CrossRef] [PubMed]
- Xu, S.; Li, J.; Zhang, X.; Wei, H.; Cui, L. Effects of heat acclimation pretreatment on changes of membrane lipid peroxidation, antioxidant metabolites, and ultrastructure of chloroplasts in two cool-season turfgrass species under heat stress. Environ. Exp. Bot. 2006, 56, 274–285. [Google Scholar] [CrossRef]
- Guo, Y.-P.; Zhou, H.-F.; Zhang, L.-C. Photosynthetic characteristics and protective mechanisms against photooxidation during high temperature stress in two citrus species. Sci. Hortic. 2006, 108, 260–267. [Google Scholar] [CrossRef]
- Havaux, M. Characterization of thermal damage to the photosynthetic electron transport system in potato leaves. Plant Sci. 1993, 94, 19–33. [Google Scholar] [CrossRef]
- Del Río, L.A.; Pastori, G.M.; Palma, J.M.; Sandalio, L.M.; Sevilla, F.; Corpas, F.J.; Jiménez, A.; López-Huertas, E.; Hernández, J.A. The Activated Oxygen Role of Peroxisomes in Senescence. Plant Physiol. 1998, 116, 1195–1200. [Google Scholar] [CrossRef] [PubMed]
- Asthir, B. Protective mechanisms of heat tolerance in crop plants. J. Plant Interact. 2015, 10, 202–210. [Google Scholar] [CrossRef]
- Hasanuzzaman, M.; Nahar, K.; Alam, M.M.; Roychowdhury, R.; Fujita, M. Physiological, biochemical, and molecular mechanisms of heat stress tolerance in plants. Int. J. Mol. Sci. 2013, 14, 9643–9684. [Google Scholar] [CrossRef] [PubMed]
- Hemantaranjan, A. Heat Stress Responses and Thermotolerance. Adv. Plants Agric. Res. 2014, 1. [Google Scholar] [CrossRef]
- Liu, J.Q.; Kolmer, J.A. Genetics of Leaf Rust Resistance in Canadian Spring Wheats AC Domain and AC Taber. Plant Dis. 1997, 81, 757–760. [Google Scholar] [CrossRef]
- Huerta-Espino, J.; Singh, R.P.; Germán, S.; McCallum, B.D.; Park, R.F.; Chen, W.Q.; Bhardwaj, S.C.; Goyeau, H. Global status of wheat leaf rust caused by Puccinia triticina. Euphytica 2011, 179, 143–160. [Google Scholar] [CrossRef]
- Liu, J.Q.; Kolmer, J.A. Inheritance of Leaf Rust Resistance in Wheat Cultivars Grandin and CDC Teal. Plant Dis. 1997, 81, 505–508. [Google Scholar] [CrossRef]
- Herrera-Foessel, S.A.; Singh, R.P.; Huerta-Espino, J.; Crossa, J.; Yuen, J.; Djurle, A. Effect of Leaf Rust on Grain Yield and Yield Traits of Durum Wheats with Race-Specific and Slow-Rusting Resistance to Leaf Rust. Plant Dis. 2006, 90, 1065–1072. [Google Scholar] [CrossRef]
- Broers, L.H.M. Partial resistance to wheat leaf rust in 18 spring wheat cultivars. Euphytica 1989, 44, 247–258. [Google Scholar] [CrossRef]
- Broers, L.H.M. Influence of development stage and host genotype on three components of partial resistance to leaf rust in spring wheat. Euphytica 1989, 44, 187–195. [Google Scholar] [CrossRef]
- Draz, I.S.; Abou-Elseoud, M.S.; Kamara, A.-E.M.; Alaa-Eldein, O.A.-E.; El-Bebany, A.F. Screening of wheat genotypes for leaf rust resistance along with grain yield. Ann. Agric. Sci. 2015, 60, 29–39. [Google Scholar] [CrossRef]
- Khan, A.A.; Kabir, M.R. Evaluation of Spring Wheat Genotypes (Triticum Aestivum L.) for Heat Stress Tolerance Using Different Stress Tolerance Indices. Cercet. Agron. Mold. 2015, 47, 49–63. [Google Scholar] [CrossRef]
- Mir, R.R.; Zaman-Allah, M.; Sreenivasulu, N.; Trethowan, R.; Varshney, R.K. Integrated genomics, physiology and breeding approaches for improving drought tolerance in crops. Theor. Appl. Genet. 2012, 125, 625–645. [Google Scholar] [CrossRef] [PubMed]
- Cossani, C.M.; Reynolds, M.P. Physiological Traits for Improving Heat Tolerance in Wheat. Plant Physiol. 2012, 160, 1710–1718. [Google Scholar] [CrossRef] [PubMed]
- Aziz, A.; Mahmood, T.; Mahmood, Z.; Shazadi, K.; Mujeeb-Kazi, A.; Rasheed, A. Genotypic Variation and Genotype × Environment Interaction for Yield-Related Traits in Synthetic Hexaploid Wheats under a Range of Optimal and Heat-Stressed Environments. Crop Sci. 2018, 58, 295–303. [Google Scholar] [CrossRef]
- Acevedo, E.; Silva, P.; Silva, H. Wheat Growth and Physiology; FAO Plant Production and Protection Series (FAO): Rome, Italy, 2002. [Google Scholar]
- Altenbach, S.B.; Dupont, F.M.; Kothari, K.M.; Chan, R.; Johnson, E.L.; Lieu, D. Temperature, Water and Fertilizer Influence the Timing of Key Events During Grain Development in a US Spring Wheat. J. Cereal Sci. 2003, 37, 9–20. [Google Scholar] [CrossRef]
- Chamekh, Z.; Karmous, C.; Ayadi, S.; Sahli, A.; Hammami, Z.; Fraj, M.B.; Benaissa, N.; Trifa, Y.; Slim-Amara, H. Stability analysis of yield component traits in 25 durum wheat (Triticum durum Desf.) genotypes under contrasting irrigation water salinity. Agric. Water Manag. 2015, 152, 1–6. [Google Scholar] [CrossRef]
- Mohamed, N.E.M.; Said, A.A. 7 Stability Parameters for Comparing Bread Wheat Genotypes under Combined Heat and Drought Stress. Egypt. J. Agron. 2014, 36, 123–146. [Google Scholar]
- Abbas Mosavi, A.; Babaiean Jelodar, N.; Kazemitabar, K. Environmental Responses and Stability Analysis for Grain Yield of Some Rice Genotypes. World Appl. Sci. J. 2013, 21, 105–108. [Google Scholar] [CrossRef]
- Witcombe, J.R. Estimates of stability for comparing varieties. Euphytica 1988, 39, 11–18. [Google Scholar] [CrossRef]
- Lopes, M.S.; El-Basyoni, I.; Baenziger, P.S.; Singh, S.; Royo, C.; Ozbek, K.; Aktas, H.; Ozer, E.; Ozdemir, F.; Manickavelu, A.; et al. Exploiting genetic diversity from landraces in wheat breeding for adaptation to climate change. J. Exp. Bot. 2015, 66, 3477–3486. [Google Scholar] [CrossRef] [PubMed]
- Omae, H.; Kumar, A.; Shono, M. Adaptation to High Temperature and Water Deficit in the Common Bean (Phaseolus vulgaris L.) during the Reproductive Period. J. Bot. 2012, 2012, 803413. [Google Scholar] [CrossRef]
- Qu, A.-L.; Ding, Y.-F.; Jiang, Q.; Zhu, C. Molecular mechanisms of the plant heat stress response. Biochem. Biophys. Res. Commun. 2013, 432, 203–207. [Google Scholar] [CrossRef] [PubMed]
- Lobell, D.B.; Field, C.B. Global scale climate–crop yield relationships and the impacts of recent warming. Environ. Res. Lett. 2007, 2, 14002. [Google Scholar] [CrossRef]
- Krasensky, J.; Jonak, C. Drought, salt, and temperature stress-induced metabolic rearrangements and regulatory networks. J. Exp. Bot. 2012, 63, 1593–1608. [Google Scholar] [CrossRef] [PubMed]


| Cultivar | Pedigree | Year of Release |
|---|---|---|
| Giza168 | MRL/BUC//SERI | 1995 |
| Gemmeiza7 | 7CMH74A-630/SX//SERI82/AGEN | 1999 |
| Gemmeiza9 | ALD“s”/HUAC//CMH74A-630/SX | 1999 |
| Gemmeiza10 | Maya74“S”/ON/1160-147/3/Bb/G11/4/chat“S”/5/crow“S”CGM5820-3GM-1GM-2GM-0GM | 2004 |
| Gemmeiza11 | BOW “S”/KVZ “S”//7C/SERI82/3/GIZA168/SKHA61 | 2011 |
| Gemmeiza12 | OTUS/3/SARA/THB//VEECMSS97Y00227S-5Y- | 2011 |
| Sakha94 | OPATA/RAYON//KAUZ | 2004 |
| Sids12 | BUC//7C/ALD/5/MAYA74/ON//1160-147/3/BB/GLL/4/CHAT“S”/6/MAYA/VUL-4SD-1SD-1SD-0SD. | 2007 |
| Sids13 | KAUZ “S”//TSI/SNB“S”. ICW94-0375-4AP-2AP-030AP-0APS-3AP-0APS-050AP-0AP-0SD. | 2010 |
| Misr2 | SKAUZ/BAV92. CMSS96M0361S-1M-010SY-010M-010SY-8M-0Y-0S. | 2011 |
| SOURCE | DF | Mean Squares | ||||||||
|---|---|---|---|---|---|---|---|---|---|---|
| CHLOR | CANO | LA | GFD | PH | YIELD | LR | SR | NDF | ||
| ENV | 5 | 72.6 ** | 1316.1 ** | 212.7 ** | 492.5 ** | 785.5 ** | 34.02 ** | 0.025 | 0.016 | 2263.5 ** |
| Replication(ENV) | 12 | 0.60 | 2.27 | 1.44 | 3.36 | 37.73 | 0.10 | 0.017 | 0.017 | 67.00 ** |
| SD | 1 | 1055.4 ** | 61871.3 ** | 11969.29 ** | 6002.5 ** | 63374.9 ** | 836.1 ** | 14.88 ** | 16.72 ** | 85069.9 ** |
| ENV * SD | 5 | 119.0 ** | 463.2 ** | 115.33 ** | 16.3 * | 393.3 ** | 13.0 ** | 0.02 | 0.036 | 360.9 ** |
| Main plot Error | 12 | 0.59 | 1.36 | 2.10 | 6.83 | 37.55 | 0.12 | 0.042 | 0.011 | 68.9 |
| CULTIVAR | 9 | 15.1 ** | 182.5 ** | 142.8 ** | 116.7 ** | 1141.2 ** | 6.6 ** | 1.46 ** | 1.77 ** | 3500.5 ** |
| SD * CULTIVAR | 9 | 6.4 ** | 84.3 ** | 20.2 ** | 43.8 ** | 761.1 ** | 2.9 ** | 1.47 ** | 0.89 ** | 2003.76 ** |
| ENV * CULTIVAR | 45 | 9.08 ** | 109.7 ** | 53.4 ** | 38.04 ** | 371.1 ** | 2.2 ** | 0.02 | 0.035 * | 600.3 ** |
| ENV * SD * CULTIVAR | 45 | 6.8 ** | 193.18 ** | 28.59 ** | 44.9 ** | 423.2 ** | 2.8 ** | 0.019 | 0.031 | 682.9 ** |
| ERROR | 216 | 0.14 | 2.71 | 0.69 | 1.4 | 14.95 | 0.1 | 0.019 | 0.02 | 22.2 |
| PH | GY | NDF | LR | SR | CHLOR | CANO | LA | GFD | ||||||||||
|---|---|---|---|---|---|---|---|---|---|---|---|---|---|---|---|---|---|---|
| Sowing date | R | L | R | L | R | L | R | L | R | L | R | L | R | L | R | L | R | L |
| Sids12 | 83.5 | 62.5 | 8.08 | 4.27 | 139.5 | 112.1 | 0.40 (40.7) | 0.36 (49.9) | 0.09 (37.52) | 0.46 (53.2) | 32.6 | 29.0 | 33.9 | 46.9 | 36.1 | 24.6 | 31.32 | 28.9 |
| Gemmeiza10 | 65.7 | 52.2 | 7.65 | 3.12 | 116.2 | 103.4 | 0.06 (40.5) | 0.85 (57.1) | 0.14 (32.6) | 0.90 (46.8) | 31.3 | 28.0 | 32.2 | 44.4 | 33.8 | 22.4 | 32.2 | 27.9 |
| Gemmeiza7 | 88.3 | 58.3 | 4.67 | 4.15 | 132.5 | 124.4 | 0.41 (30.4) | 0.94 (54.1) | 0.40 (39.2) | 0.95 (43.2) | 32.6 | 28.6 | 36.6 | 42.6 | 38.36 | 25.2 | 34.8 | 25.25 |
| Gemmeiza9 | 89.3 | 58.3 | 7.6 | 4.87 | 133.7 | 119.8 | 0.11 (38.8) | 0.41 (68.1) | 0.40 (32.8) | 0.46 (55.5) | 32.4 | 28.5 | 37.1 | 44.1 | 38.5 | 25.1 | 34.5 | 29.3 |
| Gemmeiza11 | 88.4 | 52.3 | 5.0 | 2.9 | 126 | 109.6 | 0.32 (20.6) | 0.36 (43.9) | 0.16 (26.3) | 0.41 (54.6) | 30.7 | 28.4 | 34.3 | 41.9 | 34.4 | 24.6 | 30.2 | 24.2 |
| Gemmeiza12 | 76.3 | 60.1 | 8.8 | 3.12 | 117.5 | 95.2 | 0.05 (36.6) | 0.84 (47.7) | 0.16 (26.3) | 0.93 (54.6) | 30.8 | 28.3 | 33.1 | 47.6 | 33.4 | 23.1 | 33.3 | 22.3 |
| Misr2 | 90.6 | 61.5 | 5.0 | 3.4 | 128.4 | 110.7 | 0.78 (38.4) | 0.83 (56.7) | 0.35 (38.0) | 0.91 (55.1) | 31.3 | 28.7 | 32.4 | 60.4 | 36.25 | 24.2 | 34.9 | 25.3 |
| Sakha94 | 75.5 | 63.9 | 5.0 | 3.3 | 127.0 | 121.4 | 0.94 (46.5) | 0.82 (44.3) | 0.08 (39.4) | 0.95 (56.8) | 30.8 | 27.8 | 31.1 | 47.5 | 29.9 | 20.1 | 28.3 | 21.8 |
| Giza168 | 95.8 | 64.9 | 5.4 | 4.0 | 121.8 | 114.0 | 0.06 (39.4) | 0.93 (59.8) | 0.91 (32.9) | 0.97 (45.5) | 33.5 | 28.5 | 29.6 | 42.5 | 34.5 | 22.9 | 32.5 | 25.9 |
| Sids13 | 79.9 | 58.3 | 5.0 | 3.7 | 126.7 | 110.3 | 0.11 (29.7) | 0.92 (52.2) | 0.88 (45.6) | 0.85 (52.5) | 32.7 | 29.5 | 33.5 | 48.7 | 36.5 | 23.2 | 32.7 | 24.2 |
| Lsd | 6.0 | 0.5 | 1.8 | 0.071 | 0.065 | 0.6 | 2.6 | 1.3 | 1.8 | |||||||||
| Sowing date mean | 83.3 | 59.2 | 6.2 | 3.7 | 126.9 | 112.1 | 0.32 | 0.73 | 0.36 | 0.78 | 31.9 | 28.5 | 33.4 | 46.7 | 35.2 | 23.5 | 32.5 | 25.5 |
| CHLOR | CANO | LA | GFD | PH | YIELD | LR | SR | NDF | |
|---|---|---|---|---|---|---|---|---|---|
| CHLOR | −0.17 | 0.55 ** | 0.27 | 0.43 * | 0.07 | −0.33 * | 0.07 | −0.47 ** | |
| CANO | 0.00 | 0.44 ** | −0.11 | 0.10 | −0.20 | −0.05 | −0.25 | −0.31 * | |
| LA | 0.42 * | −0.21 | 0.61 ** | 0.50 ** | 0.43 * | 0.06 | −0.63 ** | −0.79 ** | |
| GFD | 0.40 * | −0.57 ** | 0.56 ** | 0.31 | 0.60 ** | 0.17 | −0.69 ** | −0.56 ** | |
| PH | 0.55 ** | −0.08 | 0.60 ** | 0.39 * | 0.45 * | 0.01 | −0.06 | −0.90 ** | |
| YIELD | 0.39 * | −0.55 ** | 0.55 ** | 0.77 ** | 0.43 * | 0.01 | −0.67 ** | −0.59 ** | |
| LR | −0.33 | 0.37 * | −0.71 ** | −0.81 ** | −0.53 ** | −0.82 ** | −0.38 | 0.42 * | |
| SR | −0.28 | 0.41 * | −0.63 ** | −0.84 ** | −0.42 * | −0.85 ** | 0.97 ** | −0.06 | |
| NDF | −0.30 | −0.80 ** | −0.30 | 0.25 | −0.46 ** | 0.23 | −0.53 ** | −0.1 |
| Sowing Date | Genotypes | Coefficient of Variation C.V% | Regression Coefficient (bi) | Perkins and Jinks (Di) | Wrike’s Ecovalence (Wi) | Superiority Measure (Pi) | Average Absolute Rank (Si(1)) |
|---|---|---|---|---|---|---|---|
| Recommended & late combined | Sids12 | 49.03 | 1.60 | 0.60 | 28.42 | 0.78 | 0.82 |
| Gemmeiza10 | 32.43 | 0.60 | −0.40 | 12.53 | 6.35 | 0.32 | |
| Gemmeiza7 | 31.70 | 0.88 | −0.12 | 10.38 | 2.29 | 0.61 | |
| Giza168 | 40.77 | 1.10 | 0.10 | 8.82 | 2.66 | 0.41 | |
| Gemmeiza11 | 47.59 | 1.46 | 0.46 | 13.67 | 1.34 | 0.68 | |
| Gemmeiza12 | 32.28 | 0.61 | −0.39 | 12.83 | 5.75 | 0.21 | |
| Misr2 | 33.89 | 0.75 | −0.25 | 8.11 | 4.58 | 0.45 | |
| Sakha94 | 47.22 | 1.11 | 0.11 | 18.29 | 3.56 | 0.52 | |
| Gemmeiza9 | 30.03 | 1.06 | 0.06 | 3.91 | 0.54 | 0.24 | |
| Sids13 | 35.91 | 0.83 | −0.17 | 7.49 | 4.39 | 0.48 | |
| Recommended | Sids12 | 6.14 | 0.32 | −0.68 | 4.15 | 0.16 | 0.53 |
| Misr2 | 31.73 | 1.47 | 0.47 | 2.52 | 7.75 | 0.53 | |
| Gemmeiza7 | 24.62 | 0.62 | −0.38 | 5.79 | 11.01 | 0.47 | |
| Gemmeiza9 | 31.65 | 1.73 | 0.73 | 6.18 | 4.50 | 1.00 | |
| Gemmeiza11 | 30.89 | 1.54 | 0.54 | 7.61 | 4.44 | 1.20 | |
| Gemmeiza12 | 13.53 | 0.86 | −0.14 | 1.09 | 0.91 | 0.33 | |
| Gemmeiza10 | 19.67 | 0.18 | −0.82 | 9.98 | 9.74 | 0.60 | |
| Sakha94 | 23.90 | 0.83 | −0.17 | 4.52 | 7.84 | 1.00 | |
| Giza168 | 34.97 | 1.47 | 0.47 | 13.11 | 5.37 | 1.47 | |
| Sids13 | 17.07 | 0.98 | −0.02 | 3.31 | 1.08 | 0.60 | |
| late | Sids13 | 24.03 | 2.32 | 1.32 | 1.30 | 1.40 | 0.67 |
| Gemmeiza9 | 22.99 | 2.48 | 1.48 | 1.35 | 1.03 | 0.73 | |
| Gemmeiza7 | 25.24 | 2.26 | 1.26 | 1.36 | 1.69 | 0.67 | |
| Gemmeiza10 | 6.74 | −0.33 | −1.33 | 1.47 | 0.09 | 0.60 | |
| Gemmeiza11 | 8.37 | −0.12 | −1.12 | 1.21 | 0.88 | 0.87 | |
| Gemmeiza12 | 30.57 | 2.56 | 1.56 | 2.74 | 1.77 | 0.73 | |
| Misr2 | 11.30 | 0.50 | −0.51 | 0.63 | 1.77 | 0.80 | |
| Sakha94 | 17.77 | 0.68 | −0.32 | 1.65 | 1.32 | 0.83 | |
| Giza168 | 24.80 | −0.84 | −1.84 | 5.09 | 1.75 | 0.97 | |
| Sids12 | 5.27 | 0.49 | −0.51 | 0.36 | 0.00 | 0.07 |
| Sowing Date | Source | DF | MS | % of Variance Explained |
|---|---|---|---|---|
| Recommend and late combined | Environments (E) | 11 | 96.80 ** | 63.20 |
| Genotypes (G) | 9 | 27.40 ** | 14.60 | |
| G × E | 99 | 3.80 ** | 22.20 | |
| PC1 | 19 | 8.90 ** | 45.30 | |
| PC2 | 17 | 6.00 ** | 27.10 | |
| PC3 | 15 | 3.70 ** | 14.80 | |
| Residuals | 240 | 0.10 | ||
| Recommend | Environments (E) | 5 | 42.15 ** | 29.52 |
| Genotypes (G) | 9 | 36.50 ** | 46.00 | |
| G × E | 45 | 3.88 ** | 24.48 | |
| PC1 | 13 | 6.74 ** | 50.13 | |
| PC2 | 11 | 4.82 ** | 30.36 | |
| PC3 | 9 | 2.25 ** | 11.59 | |
| Residuals | 120 | 0.19 | ||
| late | Environments (E) | 5 | 3.48 ** | 12.99 |
| Genotypes (G) | 9 | 7.23 ** | 48.57 | |
| G × E | 45 | 1.14 ** | 38.44 | |
| PC1 | 13 | 2.42 ** | 61.16 | |
| PC2 | 11 | 1.20 ** | 25.59 | |
| PC3 | 9 | 0.54 ** | 9.41 | |
| Residuals | 120 | 0.03 |
© 2018 by the author. Licensee MDPI, Basel, Switzerland. This article is an open access article distributed under the terms and conditions of the Creative Commons Attribution (CC BY) license (http://creativecommons.org/licenses/by/4.0/).
Share and Cite
Elbasyoni, I.S. Performance and Stability of Commercial Wheat Cultivars under Terminal Heat Stress. Agronomy 2018, 8, 37. https://doi.org/10.3390/agronomy8040037
Elbasyoni IS. Performance and Stability of Commercial Wheat Cultivars under Terminal Heat Stress. Agronomy. 2018; 8(4):37. https://doi.org/10.3390/agronomy8040037
Chicago/Turabian StyleElbasyoni, Ibrahim S. 2018. "Performance and Stability of Commercial Wheat Cultivars under Terminal Heat Stress" Agronomy 8, no. 4: 37. https://doi.org/10.3390/agronomy8040037
APA StyleElbasyoni, I. S. (2018). Performance and Stability of Commercial Wheat Cultivars under Terminal Heat Stress. Agronomy, 8(4), 37. https://doi.org/10.3390/agronomy8040037